Exploring conformational equilibria of a heterodimeric ABC transporter
- Ruhr-Universität Bochum, Germany
- Freie Universität Berlin, Germany
- University of Zurich, Switzerland
- ETH Zurich, Switzerland
Figures
Figure 1 with 2 supplements
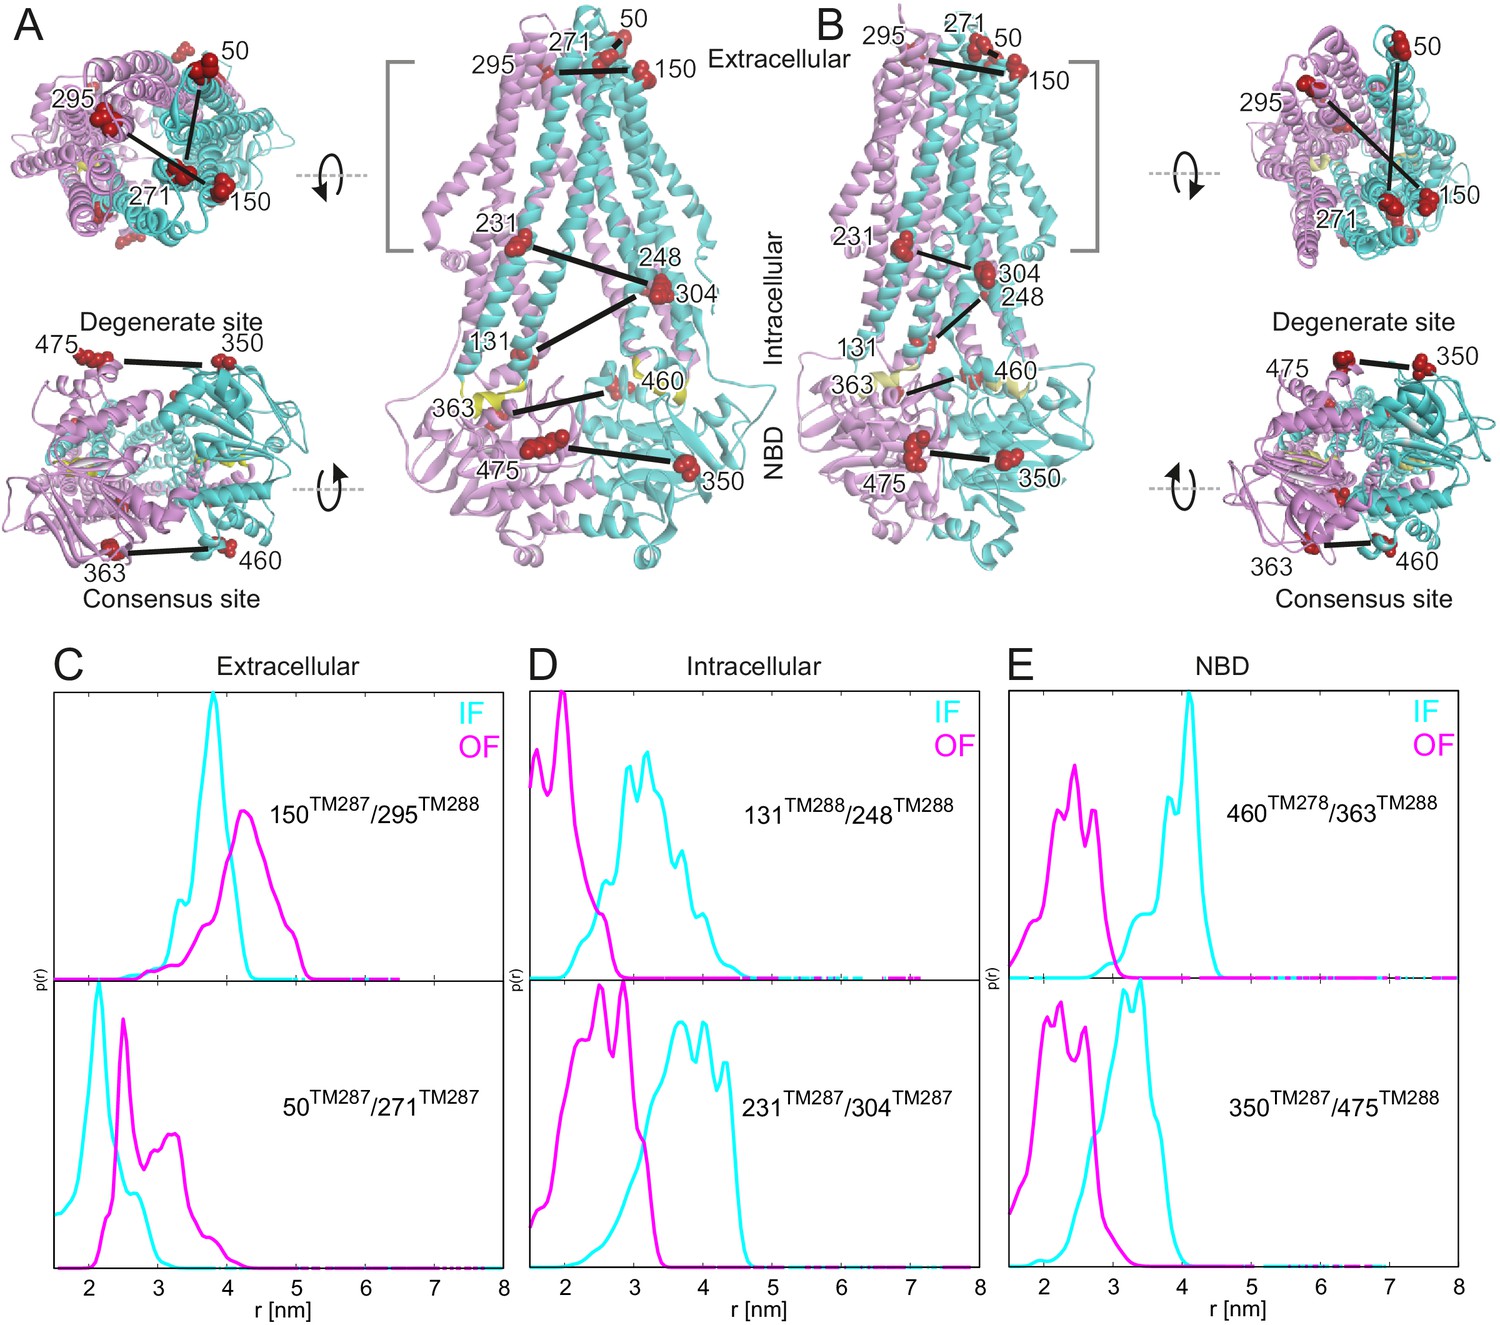
Labeling sites and putative conformational switch.
Schematic of spin-labeled sites in the extracellular, intracellular and NBD regions of TM287/288 in (A) the inward-facing apo crystal structure (PDB: 4Q4H) and in (B) the outward-facing homology model based on the Sav1866 crystal structure (PDB: 2HYD). TM287 is colored in cyan and TM288 in pink. (C–E) Simulations of the distance distribution probabilities for the six spin-labeled double mutants in the IF (cyan) and OF (magenta) states represented in panels A and B. The ambient temperature MTSL rotamer library in MMM2015 was used. Comparison with the experimental data and with a previous version of the MTSL library are presented in Figure 1—figure supplement 1.
Figure 1—figure supplement 1
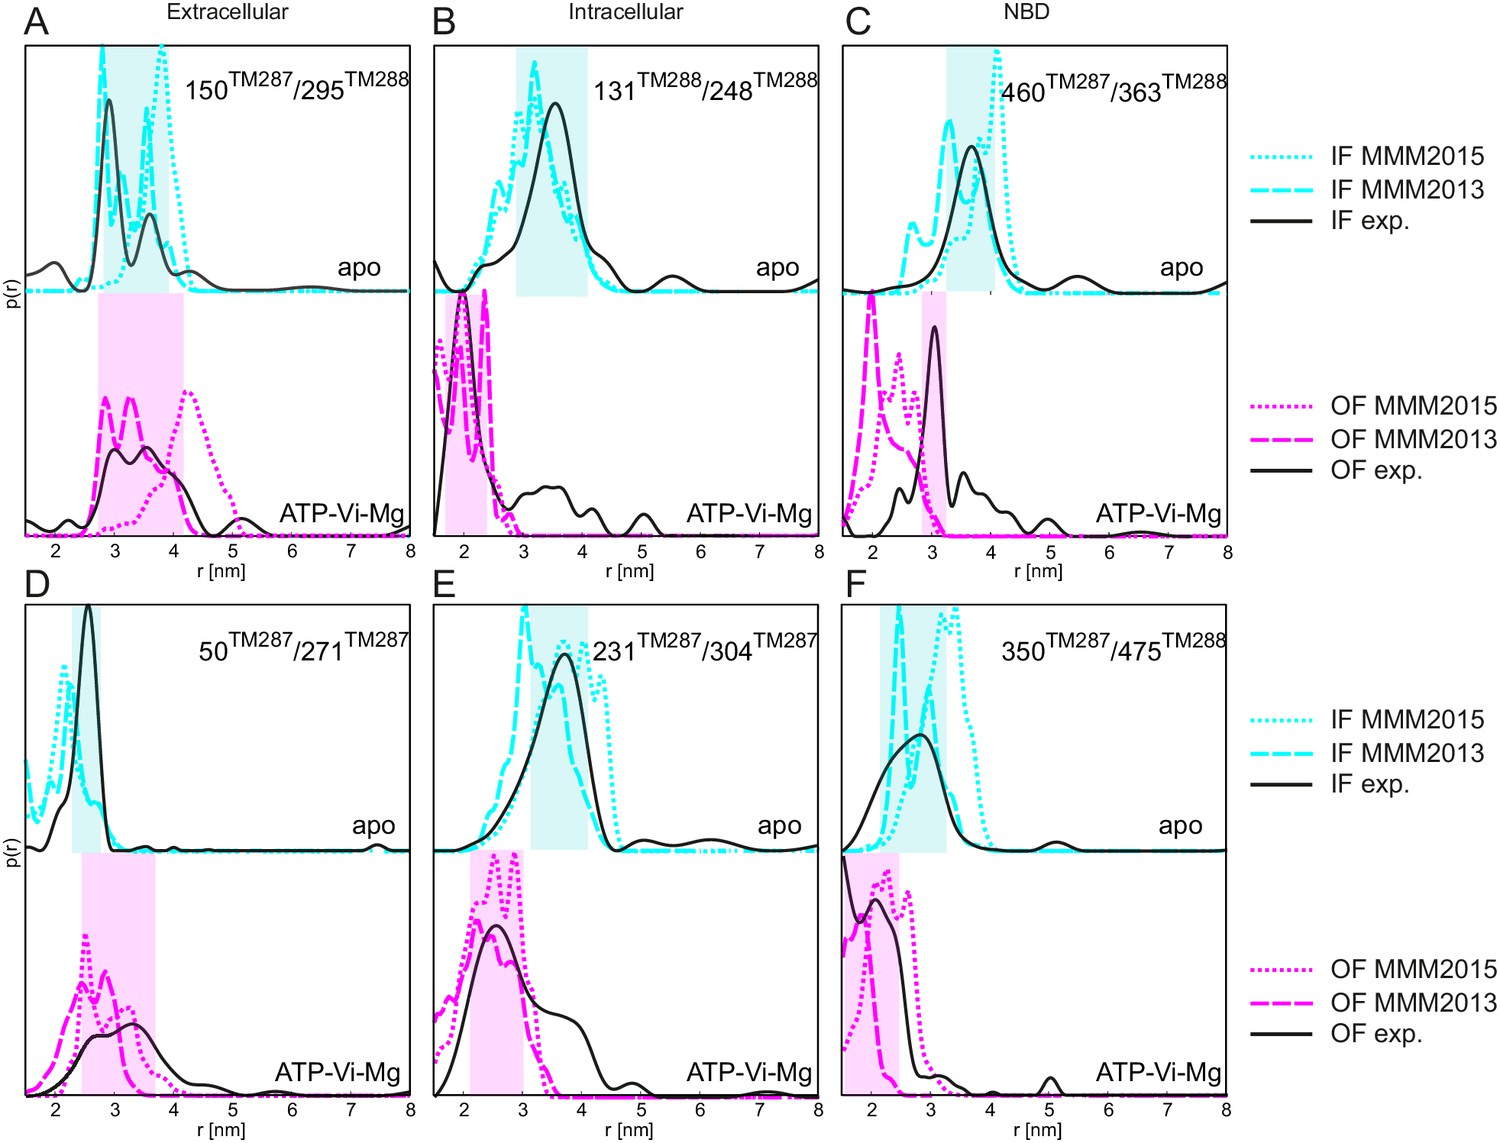
Comparison between simulated and experimental distance distributions.
Simulations of the distance distribution probability for the six spin-labeled pairs in the IF (cyan) and OF (magenta) states performed with MMM2015 with the rotamer library at ambient temperature (dotted lines as in Figure 1) and with the rotamer library of MMM2013 simulated at 175 K (dashed lines). The experimental distance distributions on nucleotide-free (apo, black solid line in upper plots) and ATP-Vi-Mg (black, solid line in lower plots) states are taken from Figure 2. Transparent cyan and magenta rectangles outline the range of experimental distances characteristic of the IF and OF conformations, respectively.
Figure 1—figure supplement 2
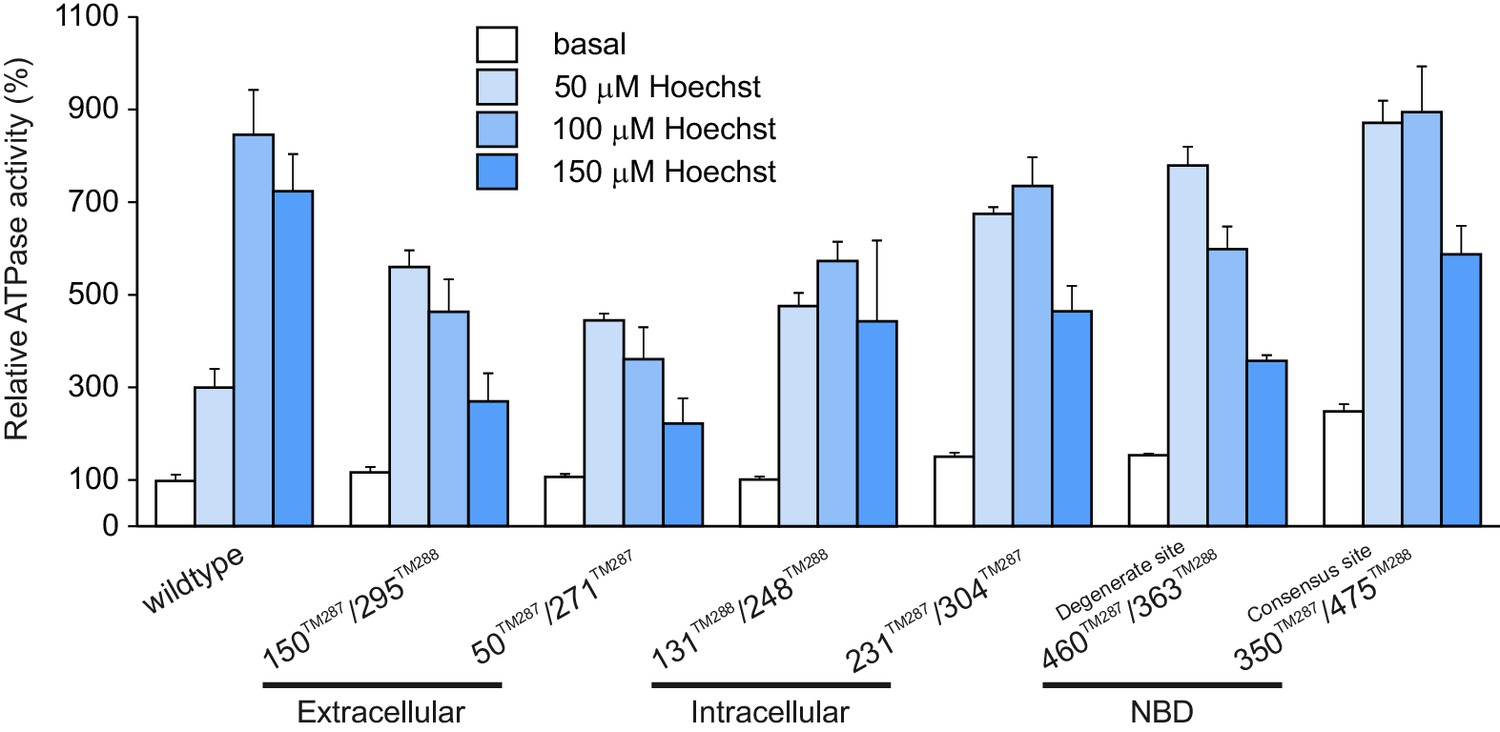
Hoechst 33342 stimulated ATPase activities of wildtype TM287/288 and spin-labeled mutants reconstituted into proteoliposomes.
Stimulation of ATPase hydrolysis of wildtype TM287/288 and six spin-labeled mutants reconstituted into proteoliposomes was determined in the absence (basal activity) and in the presence of 50 µM, 100 µM and 150 µM Hoechst 33342 at 50°C. Data were normalized to the basal ATPase activity of reconstituted wildtype TM287/288. The error bars are standard deviations of three technical replicates.
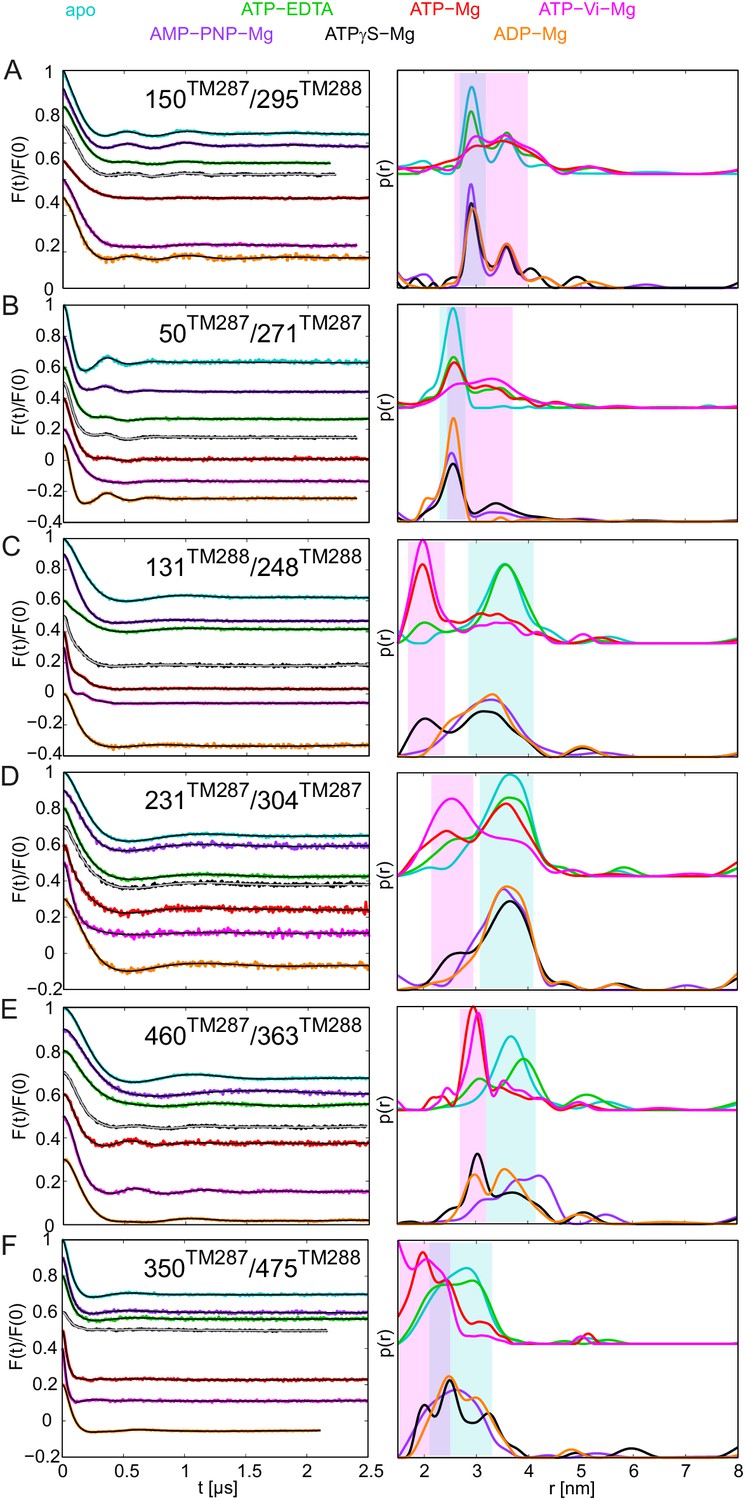
Figure 2 with 4 supplements
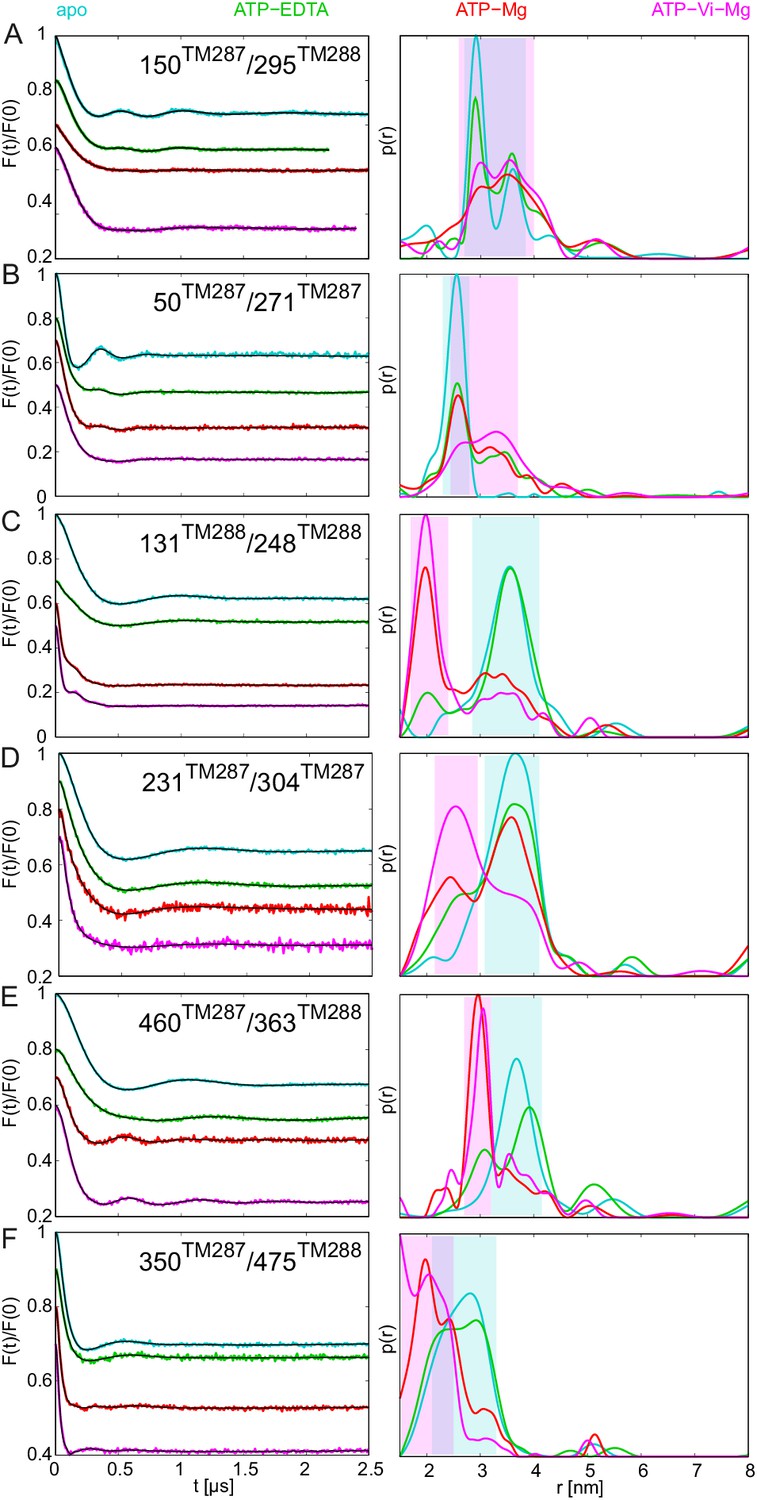
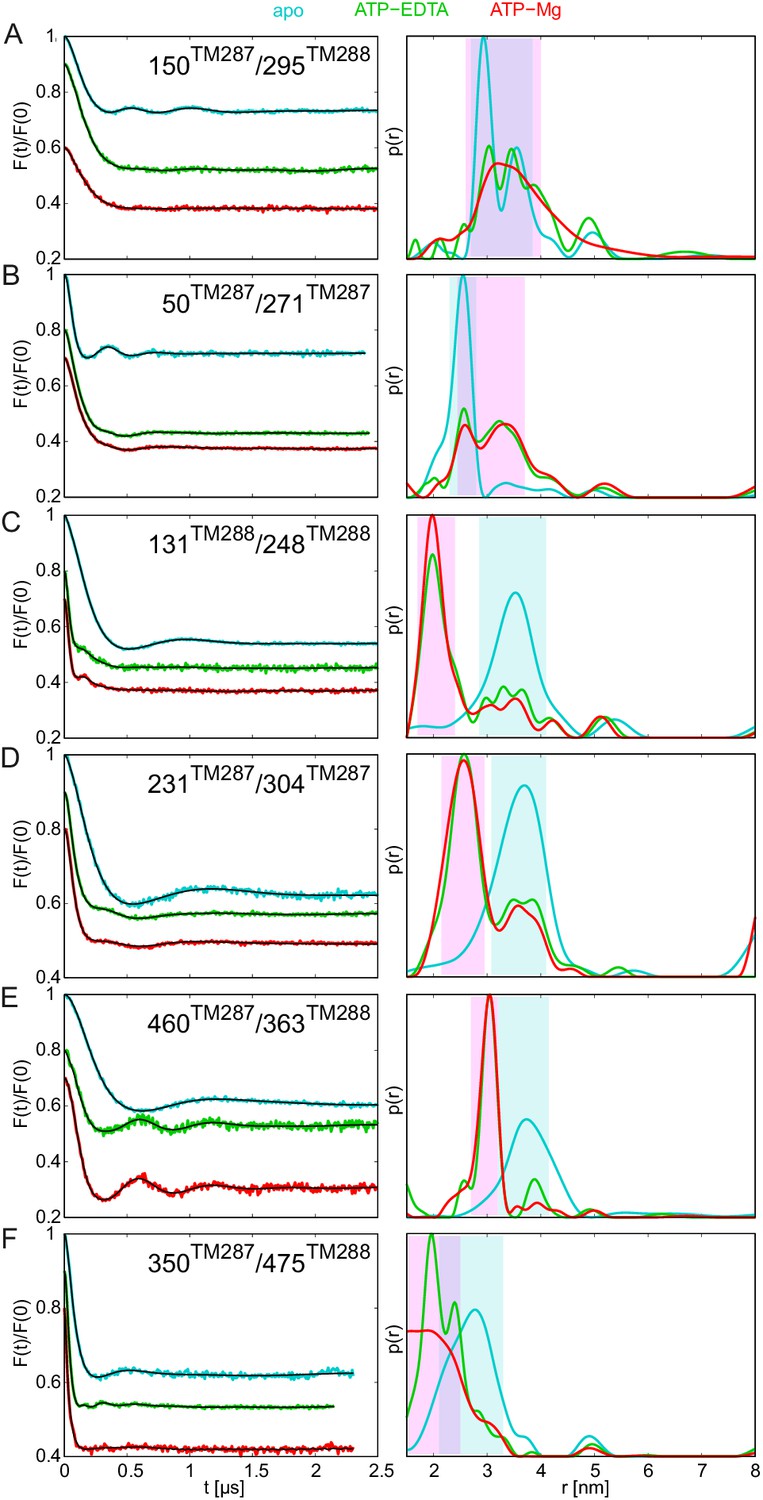
DEER analysis of spin-labeled TM287/288.
Q-band background-corrected DEER traces [F(t)/F(0)] with fitted distribution function (left) and corresponding distance distribution (right) calculated using DeerAnalysis2015 and normalized by area. Traces are shown for the six spin-labeled pairs in the absence of nucleotides (apo, cyan), ATP-EDTA (green), ATP-Mg incubated for 20 s (red) and ATP-Vi-Mg (magenta). (A and B) Extracellular pairs. (C and D) Intracellular pairs. (E) NBD pair 460TM287/363TM288 monitoring the consensus site. (F) NBD pair 350TM287/475TM288 monitoring the degenerate site. Transparent cyan and magenta rectangles outline the range of experimental distances characteristic of the IF and OF conformations, respectively. All primary DEER data can be found in Figure 2—figure supplement 1. The DEER data of the apo states presented in panels A, C, E, F are taken from (Hohl et al., 2014). Traces detected after incubation with 14 mM ATP and 2.5 mM EDTA are shown in Figure 2—figure supplement 4.
Figure 2—figure supplement 1
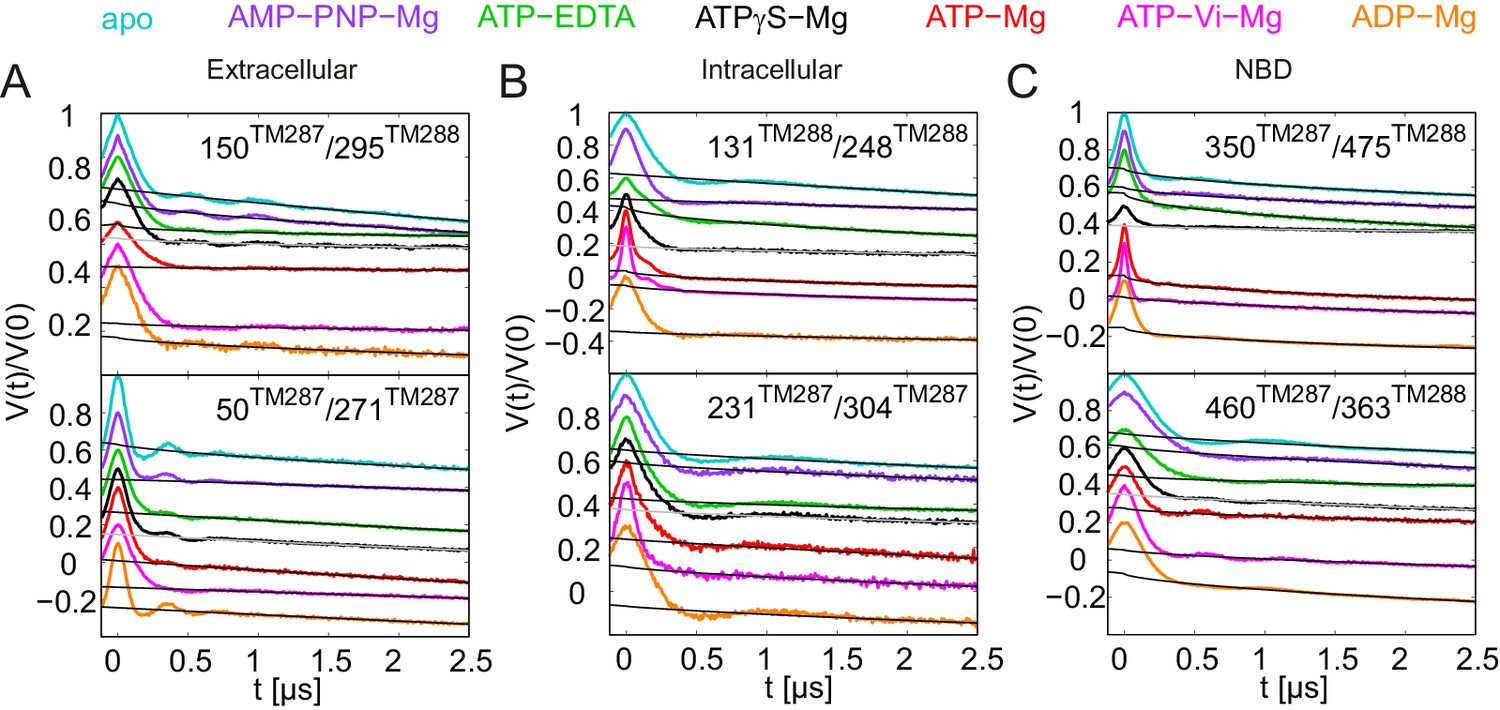
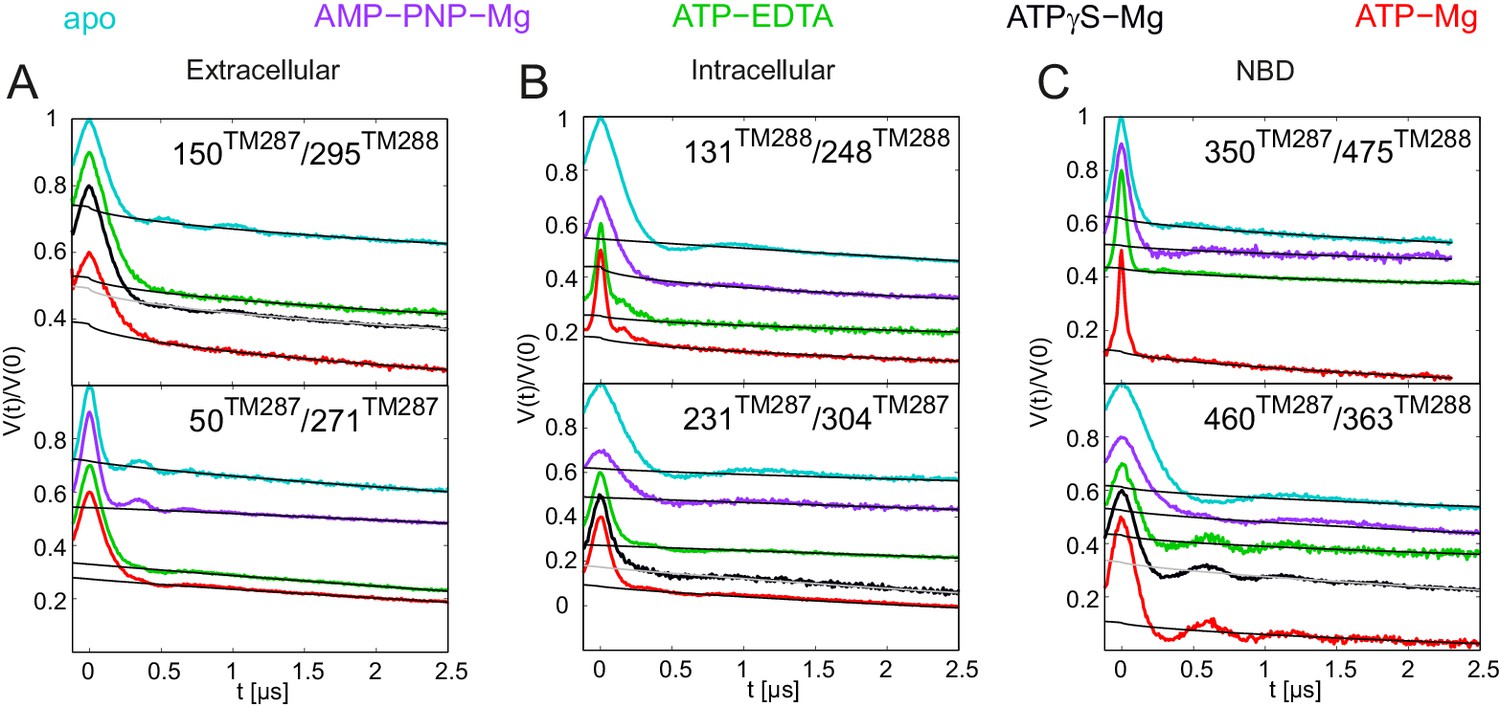
Primary DEER traces of spin-labeled pairs in wildtype TM287/288.
Q-band DEER traces [V(t)/V(0)] with the fitted background using homogeneous stretched exponential decay with dimensions of 1.5–3 for the six spin-labeled pairs engineered into wildtype TM287/288. Color code as in Figure 2. (A and B) Extracellular pairs 150TM287/295TM288 and 50TM287/271TM287. (C and D) Intracellular pairs 131TM288/248TM288 and 231TM287/304TM287. (E) NBD pair 460TM287/363TM288 monitoring the consensus site. (F) NBD pair 350TM287/475TM288 monitoring the degenerate site. The data of the apo and AMP-PNP-Mg states of the four pairs 150TM287/295TM288, 131TM288/248TM288, 460TM287/363TM288, 350TM287/475TM288 in the wildtype transporter are taken from (Hohl et al., 2014).
Figure 2—figure supplement 2
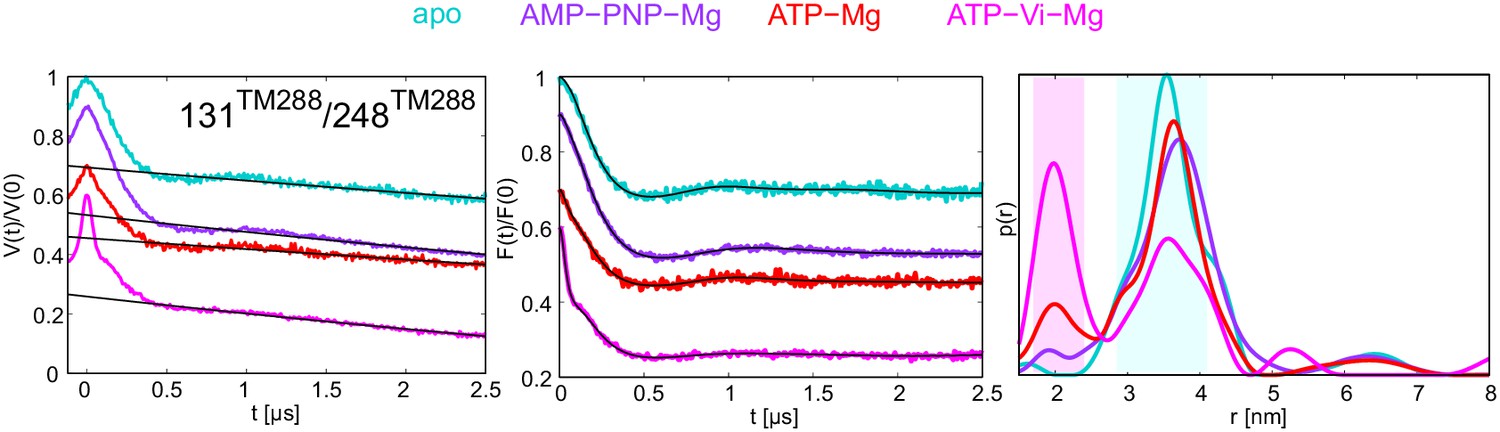
DEER analysis of TM287/288 in proteoliposomes.
Q-band DEER trace [V(t)/V(0)] with the background fit (left), background corrected DEER trace [F(t)/F(0)] with fitted distribution function (center) and the corresponding distance distribution normalized to the area (right) for the spin-labeled pair 131TM288/248TM288 in wildtype TM287/288 reconstituted into polar E. coli lipids and egg phosphatidylcholine. The data of the apo and AMP-PNP-Mg states are taken from (Hohl et al., 2014).
Figure 2—figure supplement 3
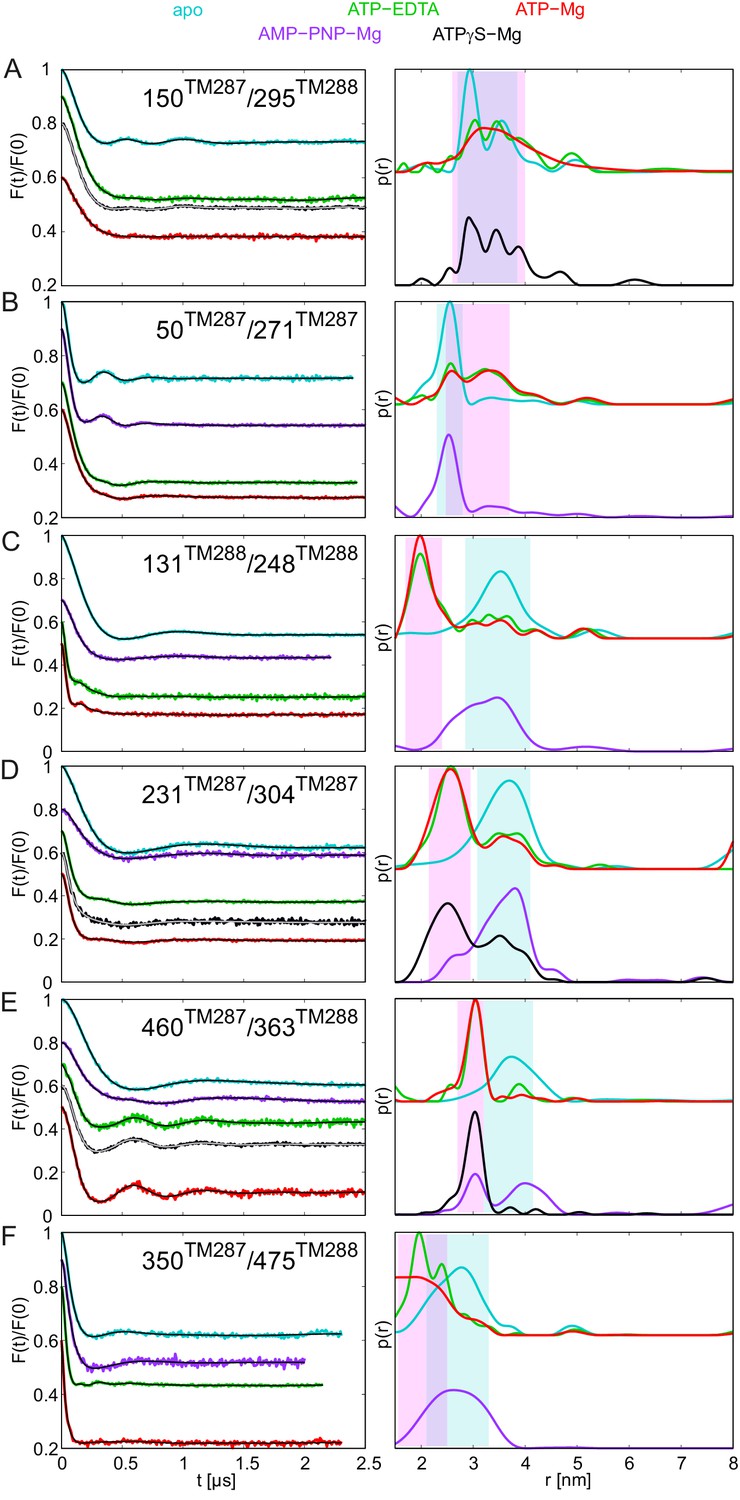
DEER analysis of spin-labeled pairs in wildtype TM287/288 with additional nucleotide analogs and ADP-Mg.
Q-band background-corrected DEER traces [F(t)/F(0)] with fitted distribution function (left) and corresponding distance distribution (right) for the six spin-labeled pairs engineered into wildtype TM287/288. The upper distance distributions correspond to those presented in Figure 2, the bottom distributions to the additional nucleotide analogs and ADP-Mg. (A and B) Extracellular pairs 150TM287/295TM288 and 50TM287/271TM287. (C and D) Intracellular pairs 131TM288/248TM288 and 231TM287/304TM287. (E) NBD pair 460TM287/363TM288 monitoring the consensus site. (F) NBD pair 350TM287/475TM288 monitoring the degenerate site. The data of the apo and AMP-PNP-Mg states of the four pairs 150TM287/295TM288, 131TM288/248TM288, 460TM287/363TM288, 350TM287/475TM288 in the wildtype transporter are taken from (Hohl et al., 2014).
Figure 2—figure supplement 4
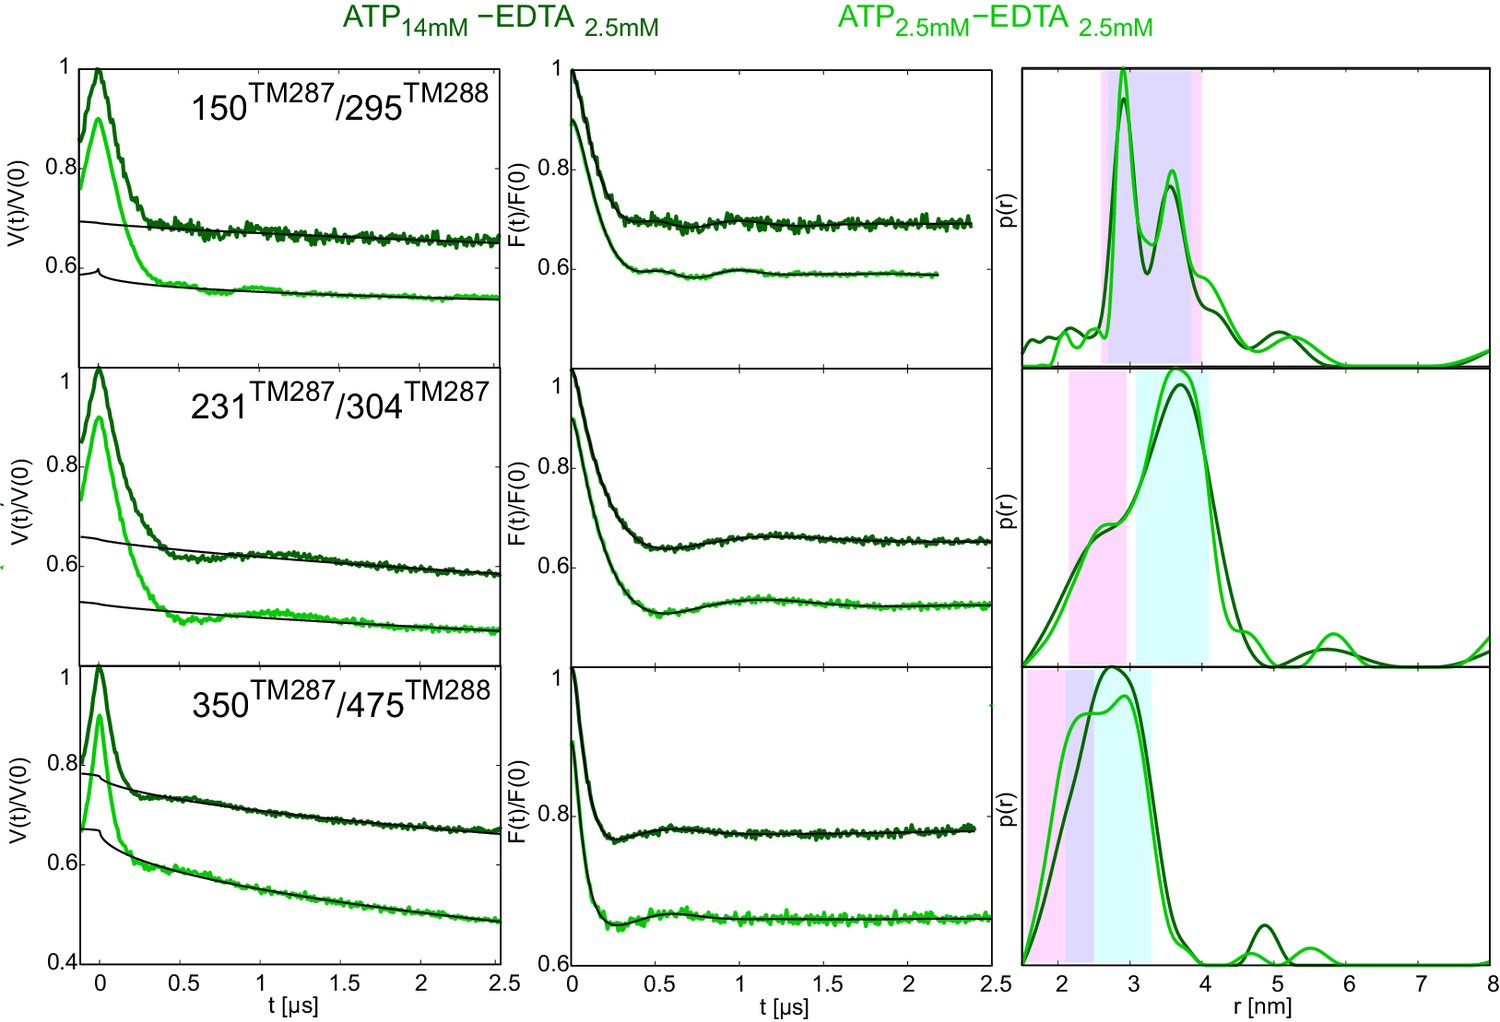
DEER analysis of wildtype TM287/288 in the presence of 2.5 mM or 14 mM ATP and 2.5 mM EDTA.
Q-band DEER traces [V(t)/V(0)] (left), background corrected DEER traces [F(t)/F(0)] with fitted distribution functions (center) and corresponding distance distributions (right) for three spin-labeled pairs in wildtype TM287/288: extracellular pair 150TM287/295TM288, intracellular pair 231TM287/304TM287 and NBD degenerate site pair 350TM287/475TM288. The light and dark green traces were obtained with 2.5 mM EDTA and 2.5 mM or 14 mM ATP, respectively.
Figure 3
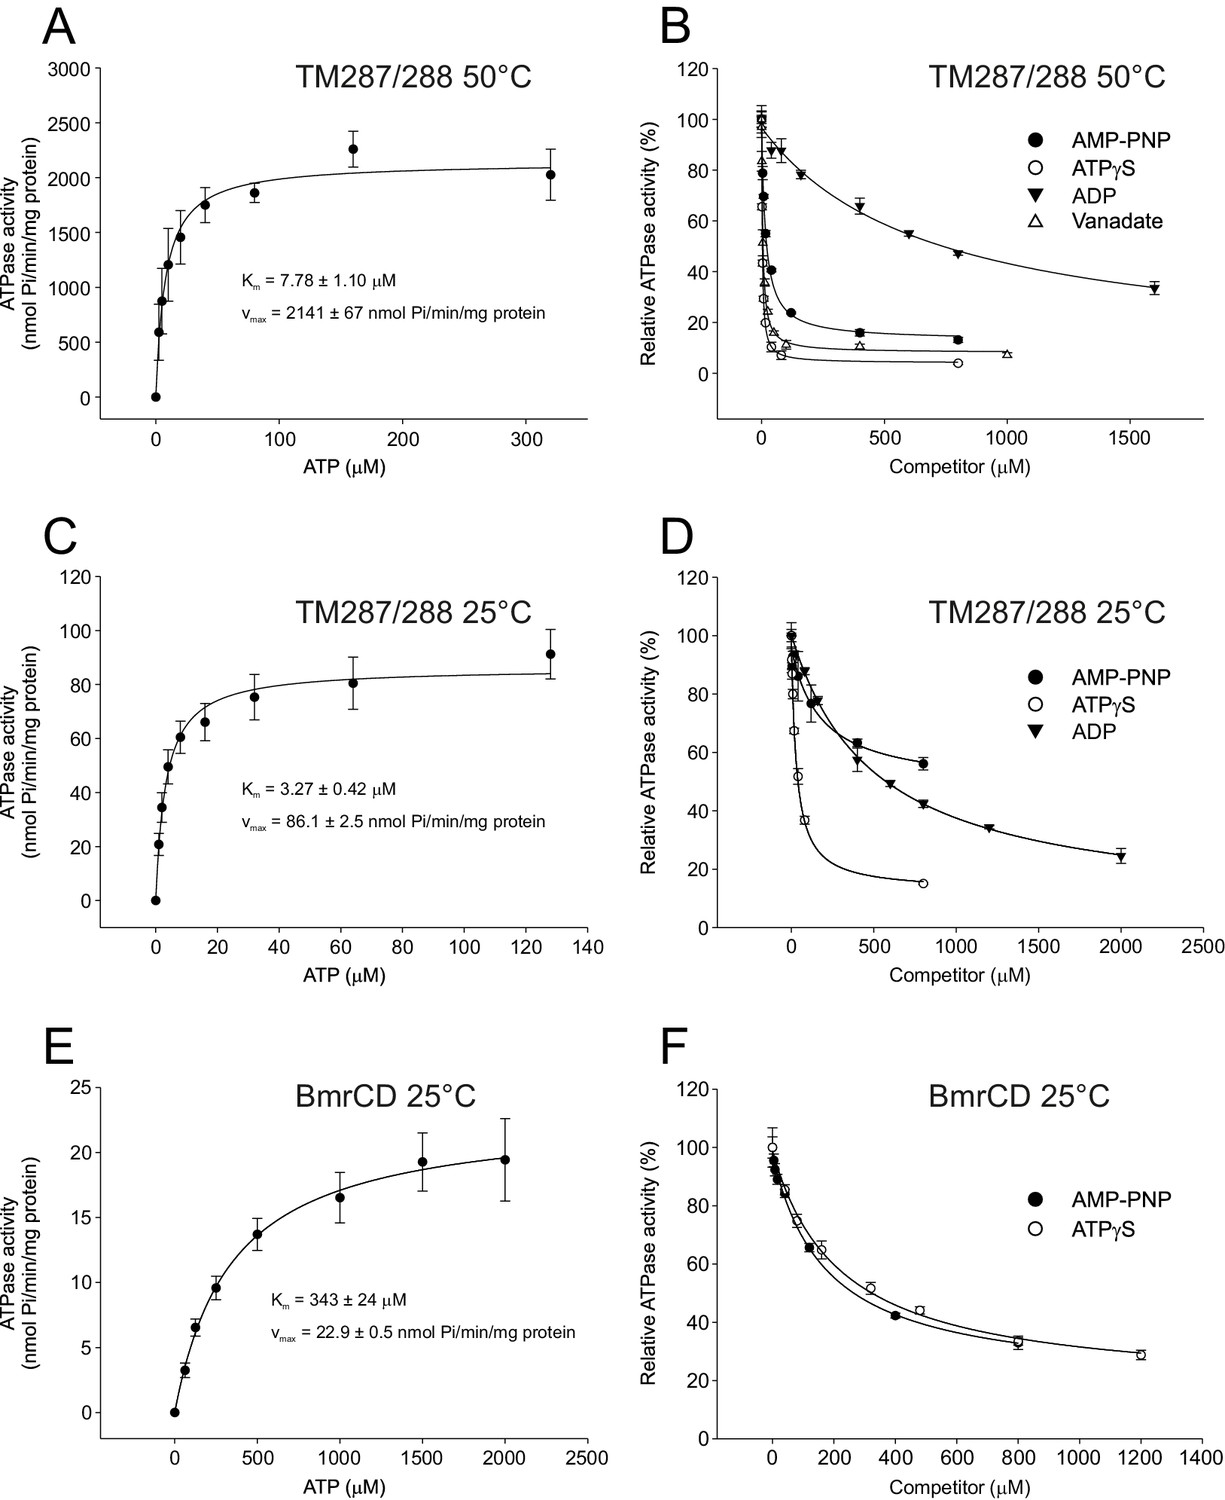
Inhibition of ATPase activity of TM287/288 and BmrCD by vanadate and nucleotides.
Km and vmax values for ATP hydrolysis by TM287/288 at 50°C (A) and 25°C (C) and BmrCD at 25°C (E) were determined by measuring ATPase activities at increasing ATP concentrations. Inhibition of ATP hydrolysis of TM287/288 was determined in the presence of increasing concentrations of vanadate at 50°C (B) or AMP-PNP, ATPγS and ADP at 50°C (B) or 25°C (D). Inhibition of ATP hydrolysis of BmrCD by AMP-PNP and ATPγS was determined at 25°C (F). In the inhibition assays, 500 µM and 2500 µM ATP were used for TM287/288 and BmrCD, respectively. The curves were fitted with a hyperbolic decay function to obtain IC50 values, which were used together with the corresponding Km to calculate Ki (Table 2). The error bars of the measurement points are standard deviations of three technical replicates.
Figure 4 with 2 supplements
DEER analysis of spin-labeled TM287/288 carrying the E-to-Q mutation.
Q-band background-corrected DEER traces [F(t)/F(0)] with fitted distribution function (left) and corresponding distance distribution (right) calculated using DeerAnalysis2015 and normalized by area. Traces are shown for the six spin-labeled pairs engineered in TM287/288 in the E-to-Q mutant in the absence of nucleotides (apo, cyan), ATP-EDTA (green) and ATP-Mg (red). (A and B) Extracellular pairs. (C and D) Intracellular pairs. (E) NBD pair 460TM287/363TM288 monitoring the consensus site. (F) NBD pair 350TM287/475TM288 monitoring the degenerate site. Transparent cyan and magenta rectangles outline the experimental distance range characteristic for the IF and OF conformations, respectively. All primary DEER data can be found in Figure 4—figure supplement 1.
Figure 4—figure supplement 1
Primary DEER traces of spin-labeled pairs in TM287/288 carrying the E-to-Q mutation.
Q-band DEER traces [V(t)/V(0)] with the fitted background using homogeneous stretched exponential decay with dimensions of 1.5–3 for the six spin-labeled pairs engineered on the E-to-Q mutant. Color code as in Figure 4. (A and B) Extracellular pairs 150TM287/295TM288 and 50TM287/271TM287. (C and D) Intracellular pairs 131TM288/248TM288 and 231TM287/304TM287. (E) NBD pair 460TM287/363TM288 monitoring the consensus site. (F) NBD pair 350TM287/475TM288 monitoring the degenerate site.
Figure 4—figure supplement 2
DEER analysis of spin-labeled pairs in TM287/288 carrying the E-to-Q substitution with additional nucleotide analogs.
Q-band background-corrected DEER traces [F(t)/F(0)] with fitted distribution function (left) and corresponding distance distribution (right) for the six spin-labeled pairs of TM287/288 carrying the E-to-Q mutation. The upper distance distributions correspond to those presented in Figure 4, the bottom distributions to the additional nucleotide analogs AMP-PNP-Mg and ATPγS-Mg. Color code as described in the figure legend. (A and B) Extracellular pairs 150TM287/295TM288 and 50TM287/271TM287. (C and D) Intracellular pairs 131TM288/248TM288 and 231TM287/304TM287. (E) NBD pair 460TM287/363TM288 monitoring the consensus site. (F) NBD pair 350TM287/475TM288 monitoring the degenerate site.
Figure 5 with 1 supplement
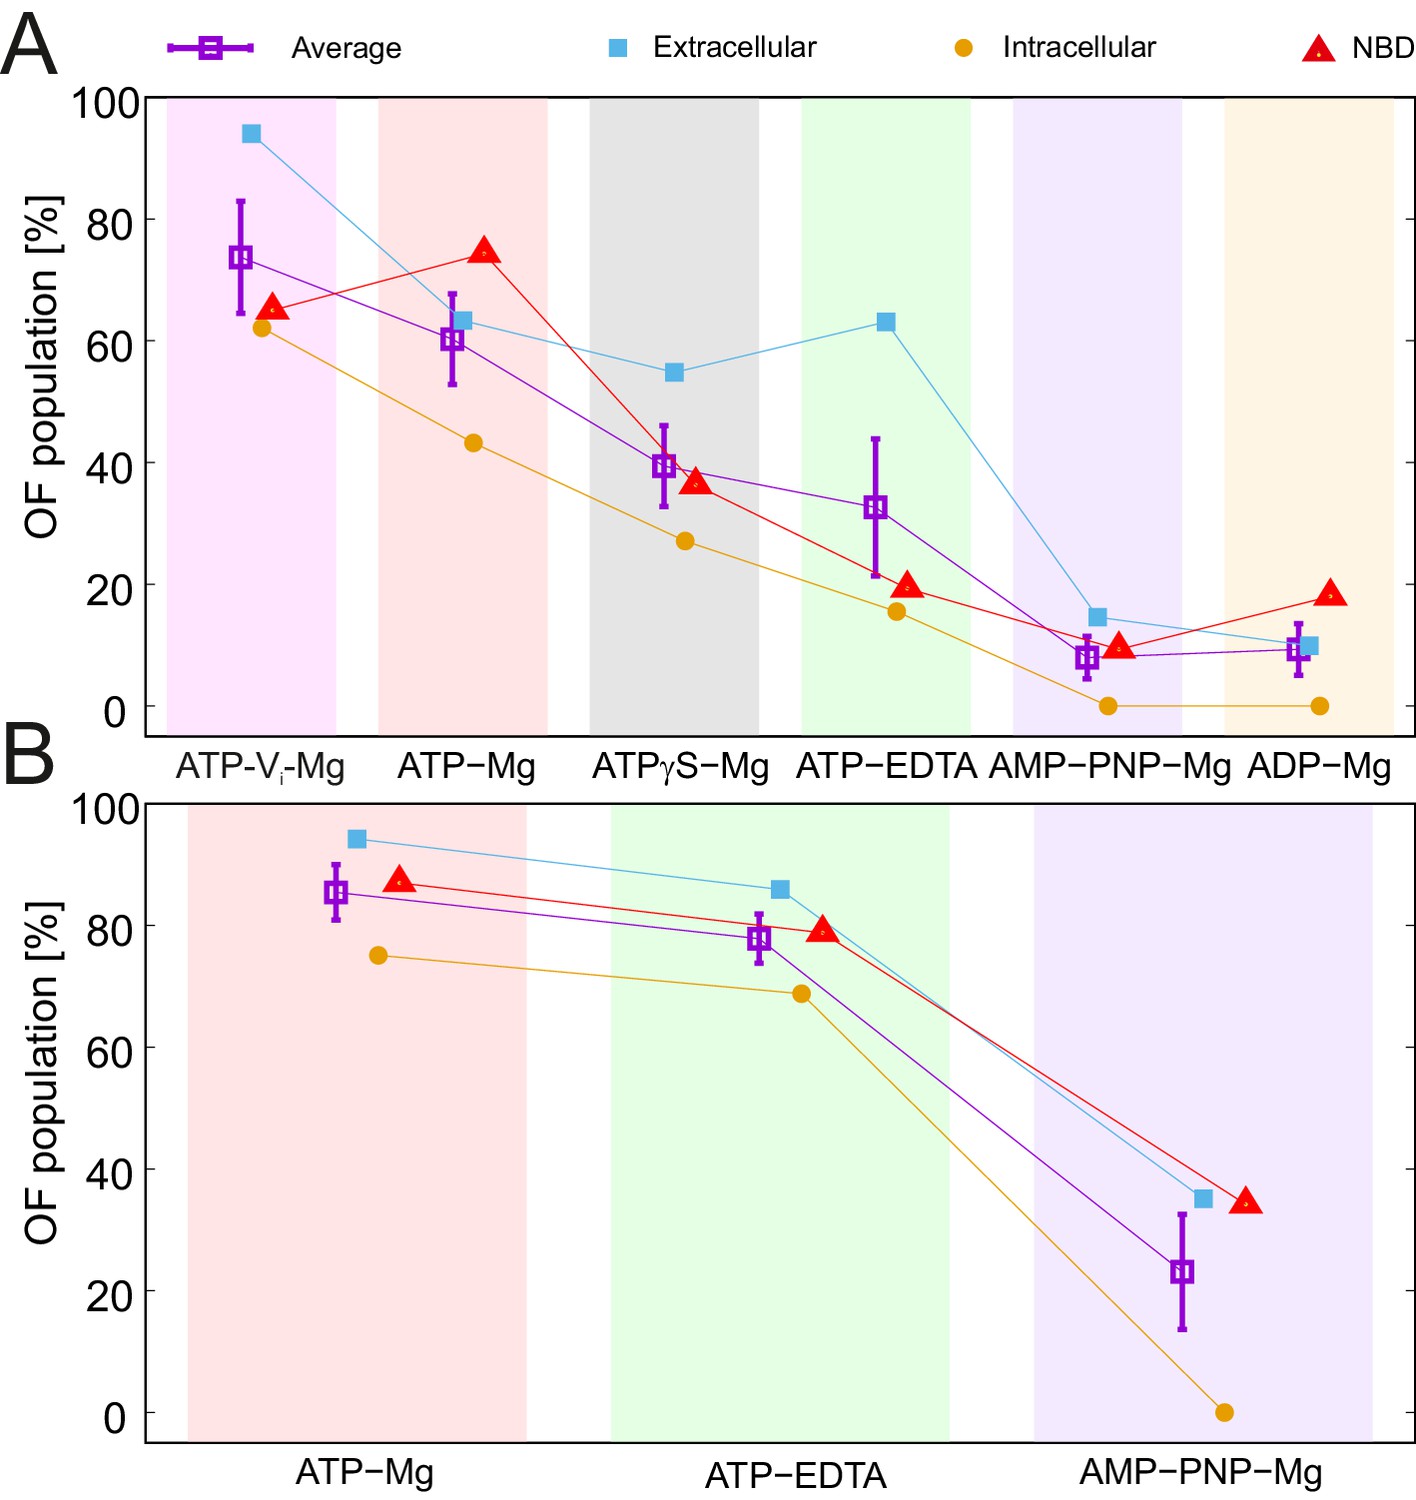
Nucleotide ranking according to the ability to populate the OF conformation.
Three spin-labeled pairs of TM287/288 representing the extracellular region (150TM287/295TM288), intracellular region (131TM288/248TM288) and the NBDs (460TM287/363TM288) were used for the analysis of the IF/OF populations in the wildtype transporter (A) and the E-to-Q mutant (B). The percentage of the OF population was calculated using the relative area under the model-based two Gaussian distance distribution performed using DeerAnalysis2015. The purple squares with error bars show the average ability of each nucleotide to stabilize the conformational switch. Background-corrected DEER traces and corresponding distance distributions are shown in Figure 5—figure supplement 1.
-
Figure 5—source data 1
Parameters of the two-Gaussian fit.
- https://doi.org/10.7554/eLife.20236.017
Figure 5—figure supplement 1
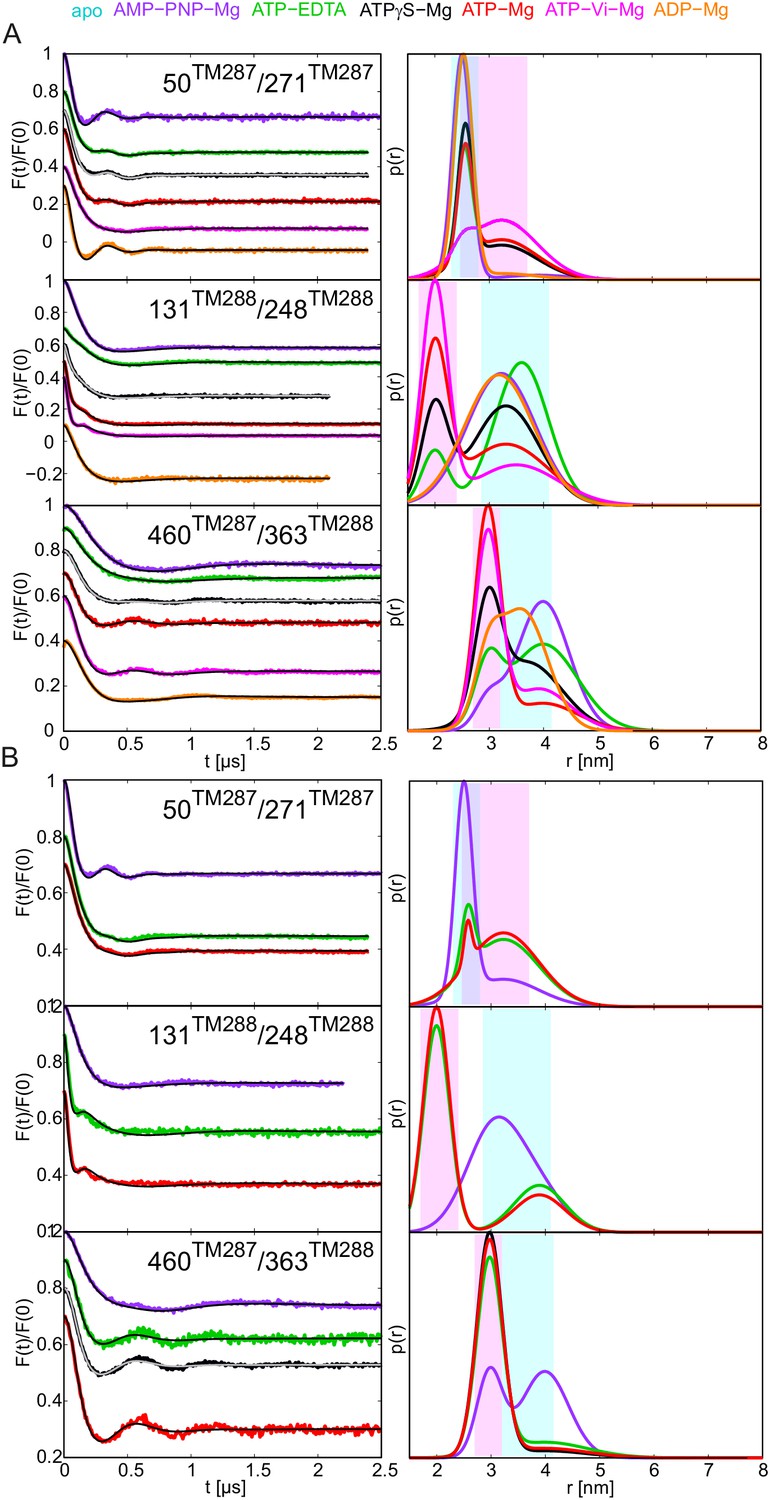
Two-Gaussian fit DEER analysis of three selected spin-labeled pairs of TM287/288.
Q-band background-corrected DEER traces [F(t)/F(0)] with fitted distribution function (left) and corresponding distance distribution (right) for the three selected spin-labeled pairs engineered on the wildtype TM287/288 (A) and the E-to-Q mutant (B).
Figure 6 with 1 supplement
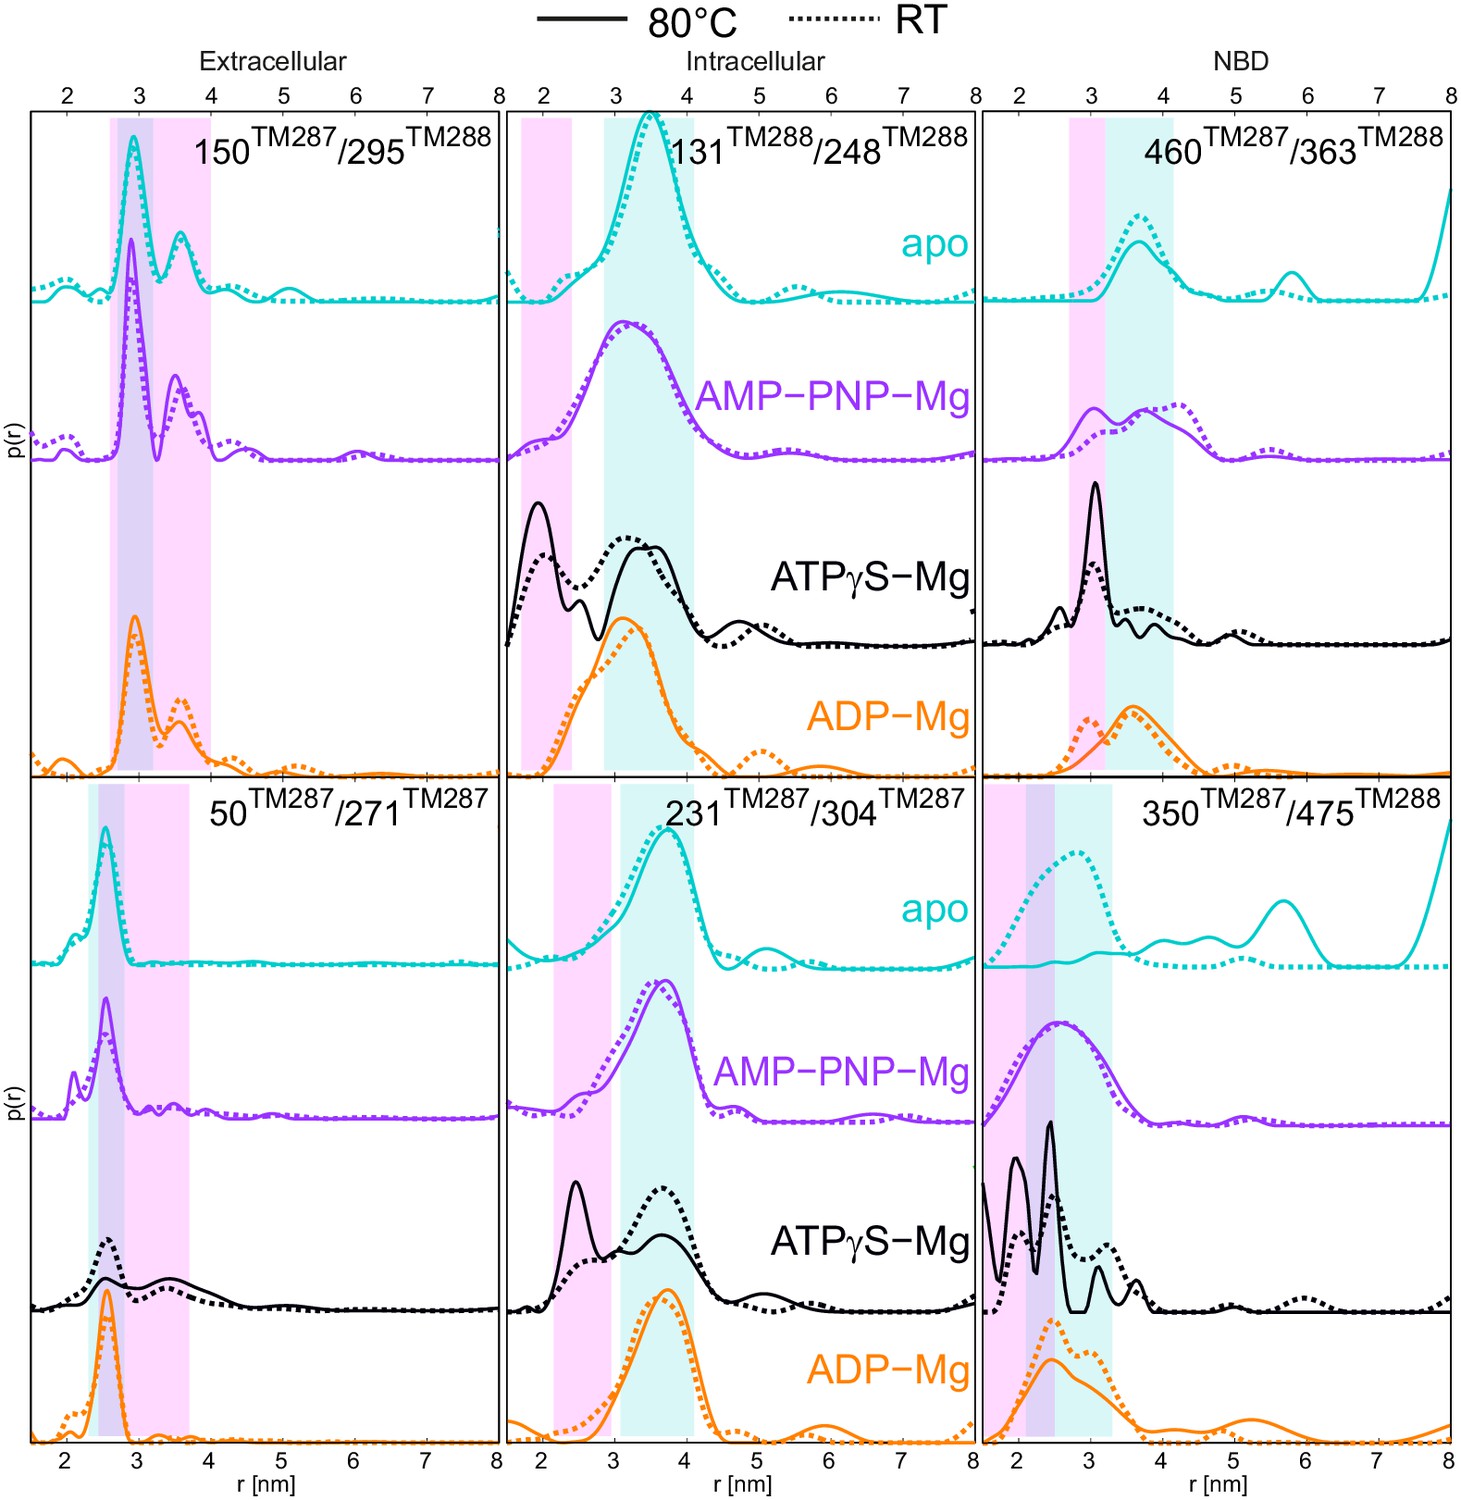
DEER distance distribution of samples snap frozen from room temperature and 80°C.
Q-band DEER distance distribution for the six spin-labeled pairs engineered on wildtype TM287/288. Distance distributions normalized by area are shown for the samples incubated at room temperature snap frozen in liquid nitrogen (dashed lines, taken from Figure 2 and Figure 2—figure supplement 3) and samples incubated at 80°C and snap frozen in cold isopentane (solid lines). The corresponding DEER data and analysis are shown in Figure 6—figure supplement 1.
Figure 6—figure supplement 1
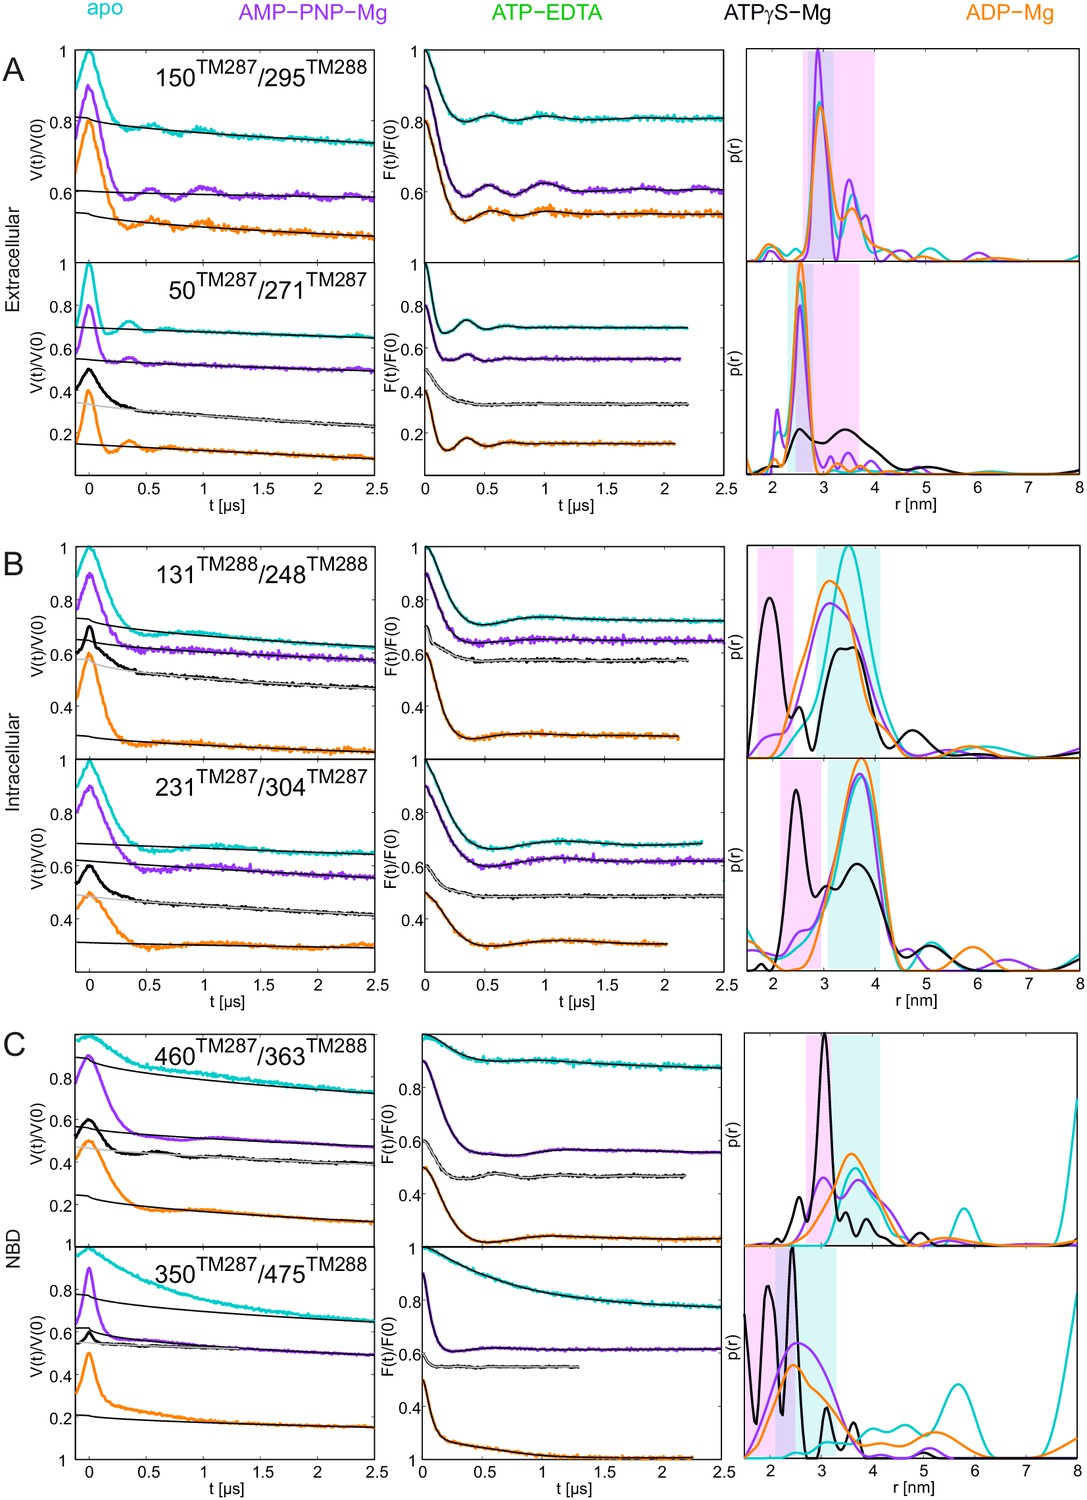
DEER analysis of wildtype TM287/288 snap frozen from 80°C.
Q-band DEER traces [V(t)/V(0)], background corrected DEER traces [F(t)/F(0)] with fitted distribution function and corresponding distance distributions (from Figure 6) for the six spin-labeled pairs engineered on wildtype TM287/288 incubated at 80°C and snap frozen in isopentane. (A) Extracellular pairs 150TM287/295TM288 and 50TM287/271TM287. (B) Intracellular pairs 131TM288/248TM288 and 231TM287/304TM287. (C) NBD pair 460TM287/363TM288 monitoring the consensus site and 350TM287/475TM288 monitoring the degenerate site.
Figure 7
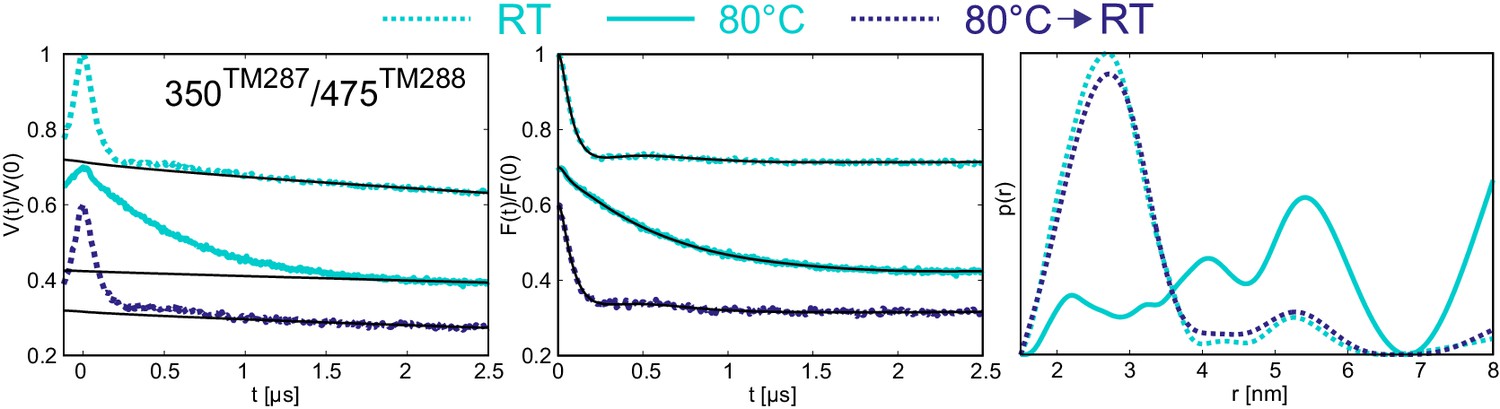
Reversibility of the disengagement of the NBDs at high temperatures.
Q-band primary DEER data [V(t)/V(0)] with the background fit (left), background corrected Form factor [F(t)/F(0)] with the fit (center) and corresponding distance distribution (right) for the 350TM287/475TM288 pair monitoring the degenerate site in the absence of nucleotides. Traces were measured using two aliquots of the same sample. The first aliquot was frozen from room temperature (dashed cyan), the second aliquot was frozen from 80°C (solid cyan), then thawed, incubated at room temperature again and snap frozen in liquid nitrogen (dashed blue).
Figure 8

Nucleotide binding to the degenerate site stabilizes cross-NBD contacts of inward-facing TM287/288.
The interfaces between the NBDs were analyzed by the PISA server. (A) Analysis of AMP-PNP-Mg bound TM287/288 (PDB: 4Q4A), (B) analysis of apo TM287/288 (PDB: 4Q4A). The left panel shows a top view of the NBDs, the right panel a side view of the degenerate (front) and consensus (back) site. Cross-NBD hydrogen bonds and salt bridges according to the PISA server criteria are highlighted by dashed black lines.
Figure 9 with 2 supplements
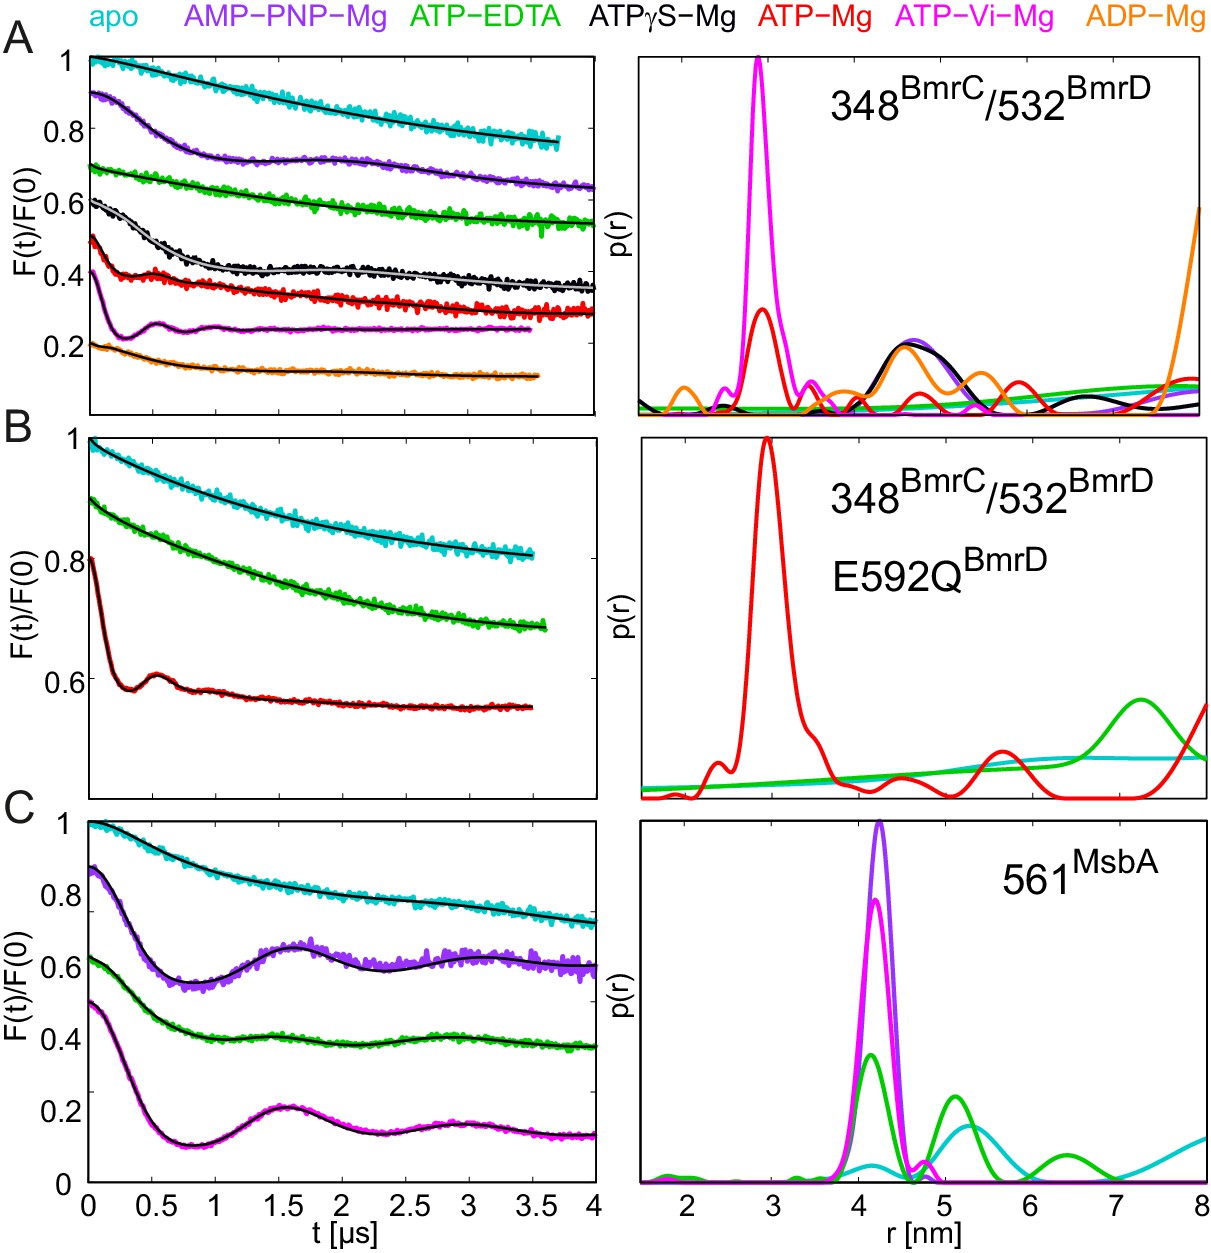
DEER analysis of spin-labeled pairs in the NBDs of BmrCD and MsbA.
Q-band background-corrected DEER traces [F(t)/F(0)] with fitted distribution function (left) and corresponding distance distribution (right). (A) Spin labeled pair 348BmrC/532BmrD in wildtype BmrCD and (B) in BmrCD carrying the E-to-Q substitution incubated with different nucleotides and nucleotide analogs. (C) Spin labeled 561MsbA in wildtype MsbA incubated with different nucleotides and nucleotide analogs. Primary DEER traces are shown in Figure 9—figure supplement 1. DEER traces detected for BmrCD after incubation with 10 mM nucleotides are shown in Figure 9—figure supplement 2.
Figure 9—figure supplement 1
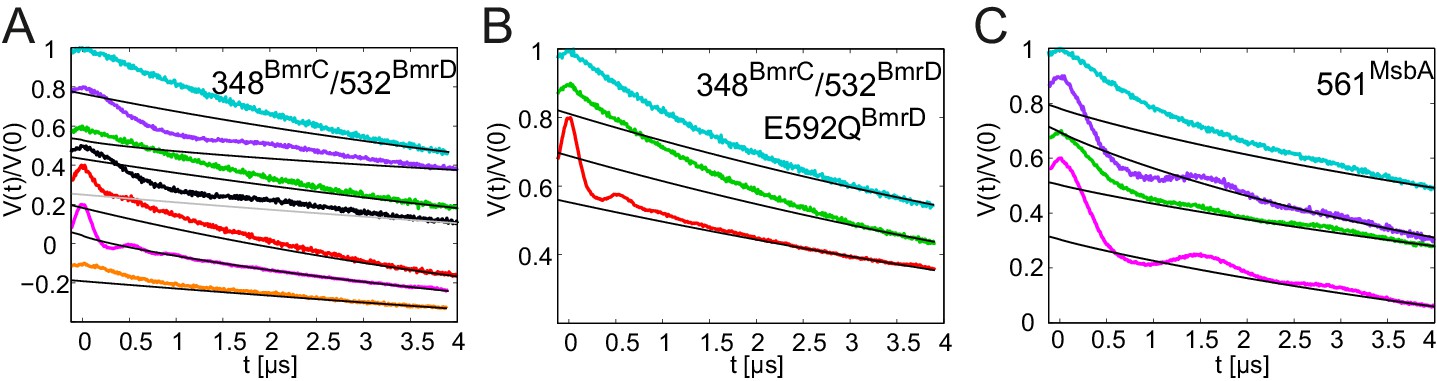
DEER analysis of BmrCD and MsbA.
Q-band primary DEER traces [V(t)/V(0)] with fitted background for the spin-labeled pair 348BmrC/532BmrD in (A) wildtype BmrCD and (B) in BmrCD containing the E-to-Q mutation; (C) data for the spin-labeled pair 561MsbA in wildtype MsbA. Color coding as in Figure 9.
Figure 9—figure supplement 2
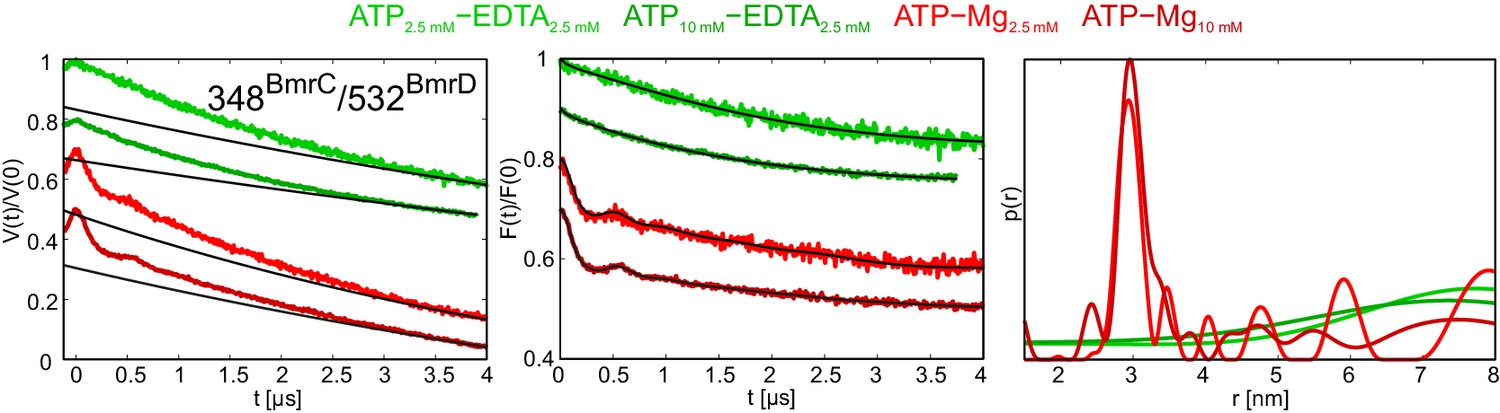
DEER analysis of wildtype BmrCD in the presence of 2.5 and 10 mM ATP.
Q-band DEER trace [V(t)/V(0)] with the background fit (left), background corrected DEER trace [F(t)/F(0)] with fitted distribution function (center) and the corresponding distance distribution normalized to the area (right) for the spin-labeled pair 348BmrC/532BmrD in wildtype BmrCD. The light and dark green traces are obtained with EDTA 2.5 mM and 2.5 mM or 10 mM ATP, respectively. The light and dark red traces were detected in the presence of 2.5 mM or 10 mM ATP-Mg, respectively.
Figure 10
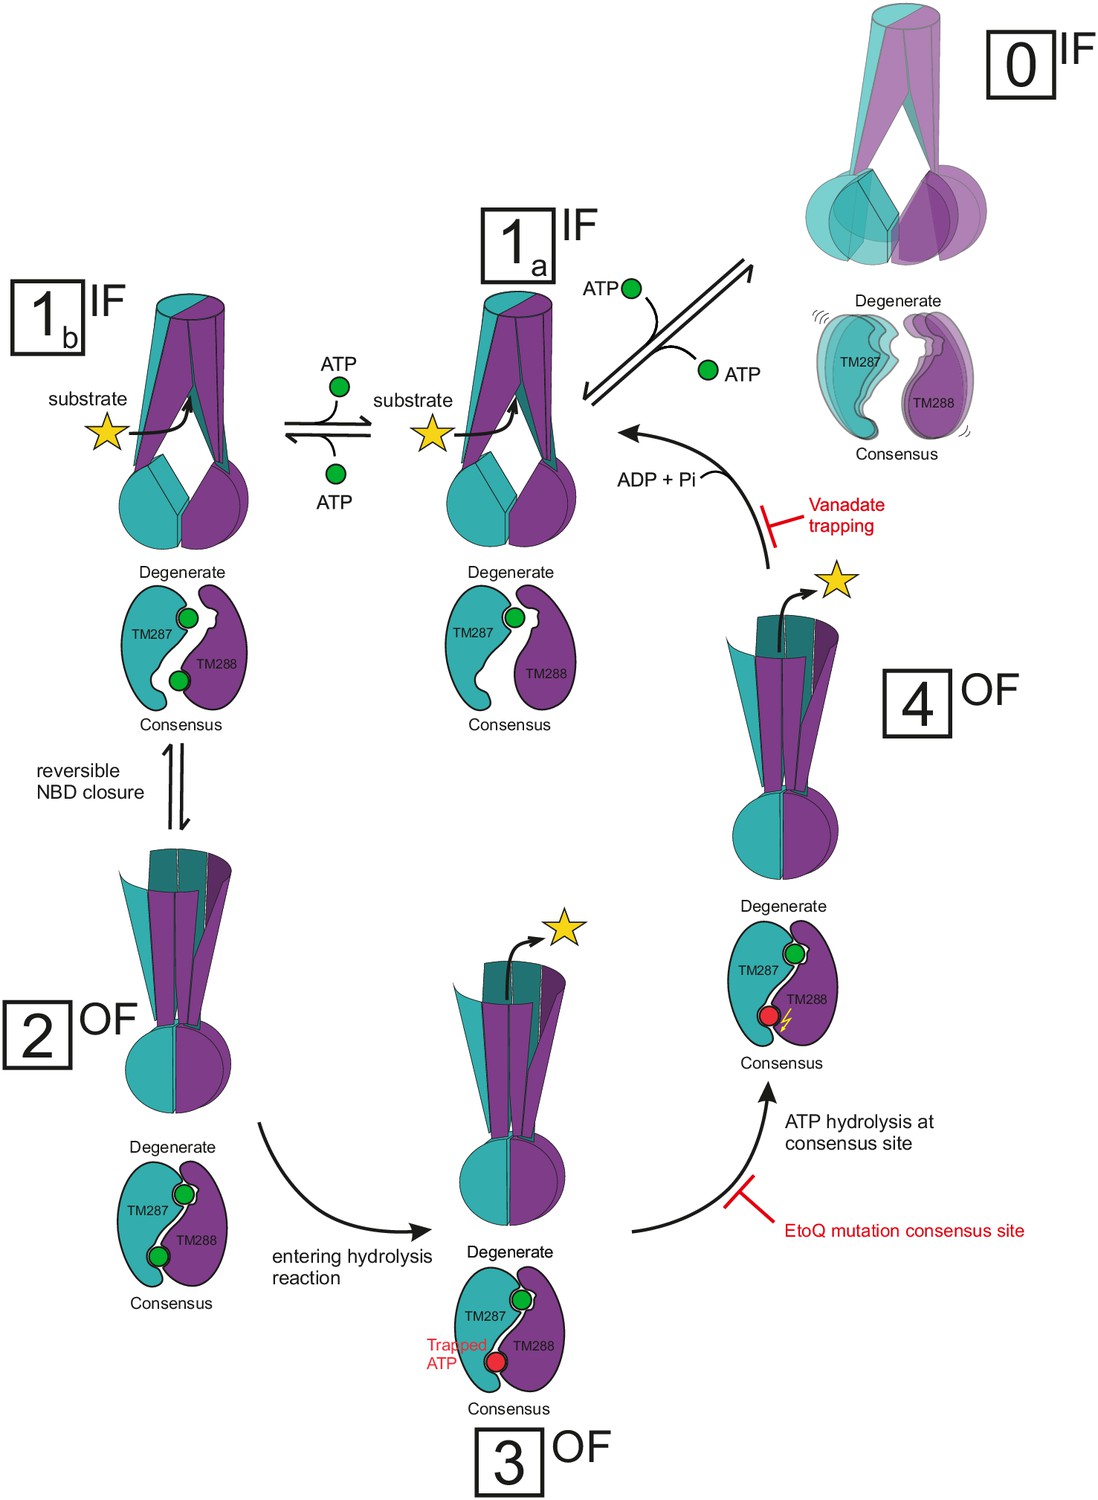
Proposed mechanism for heterodimeric ABC exporters.
Heterodimeric ABC exporters exhibit the following major conformations: IF with separated NBDs with no nucleotide bound (state 0), IF with partially contacting NBDs and one nucleotide bound to the degenerate site or two nucleotides bound (states 1a and 1b, respectively), OF with closed NBDs and two nucleotides bound (state 2) and stably closed NBDs with a nucleotide trapped at the consensus site in its pre-hydrolysis (state 3) or post-hydrolysis (state 4) state. State 0 is rare and not part of the transport cycle. In state 1, the bound nucleotide does not directly bridge the NBD interface, but causes cross-NBD interactions via the D-loops in an allosteric fashion. Transition from state 1a via state 1b to state 2 is reversible and state 2 is stabilized by nucleotide sandwiching at the NBD interface. Full NBD closure (state 2) is required to initiate ATP hydrolysis at the consensus site. During the hydrolysis reaction, which is an irreversible process, the transporter adopts first a pre-hydrolysis state (state 3), then a post-hydrolysis state (state 4) and upon completion of the ATP hydrolysis reverts to the IF state with one ATP bound at the degenerate site (state 1a). The Walker B E-to-Q mutation in the consensus site and nucleotide trapping by vanadate stabilize the pre- and post-hydrolytic transition state, respectively, and thereby OF states 3 and 4 are populated.
Author response image 1

Tables
Table 1
ATPase activities in detergent.
Protein | Nucleotide | Temperature [°C] | ATPase activity [nmol Pi/min/mg protein] | Turnover per transporter [min−1] | % of wildtype | |
|---|---|---|---|---|---|---|
TM287/288 | wildtype | ATP - Mg | 50 | 2141 ± 67 | 284 | - |
25 | 86.1 ± 2.5 | 11.4 | - | |||
ATP – Mg +1 mM vanadate | 50 | 165 ± 20 | 21.9 | 7.71 | ||
ATP – Mg +2.5 mM EDTA | 50 | <0.1 | <0.01 | <0.005 | ||
AMP-PNP - Mg | 25 | <0.1 | <0.01 | <0.005 | ||
E517QTM288 | ATP - Mg | 25 | 0.165 ± 0.015 | 0.0219 | 0.192 | |
Spin-labeled TM287/288 | 350TM287/475TM288 | ATP - Mg | 50 | - | - | 193* |
460TM287/363TM288 | ATP - Mg | 50 | - | - | 212* | |
131TM288/248TM288 | ATP - Mg | 50 | - | - | 156* | |
231TM287/304TM287 | ATP - Mg | 50 | - | - | 146* | |
150TM287/295TM288 | ATP - Mg | 50 | - | - | 112* | |
50TM287/271TM287 | ATP - Mg | 50 | - | - | 73* | |
BmrCD | wildtype | ATP - Mg | 25 | 22.9 ± 0.5 | 3.24 | - |
E592QBmrD | ATP - Mg | 25 | 0.633 ± 0.053 | 0.0896 | 2.76 | |
MsbA | wildtype | ATP - Mg | 30 | 135 ± 9 | 18.4 | - |
561MsbA | ATP - Mg | 30 | 122 ± 17 | 16.6 | 90.4 | |
-
* values are given in respect to an internal wildtype control in each measurement.
Table 2
Ki determination.
Protein | Temperature [°C] | Km for ATP [µm]∗ | Competitor | IC50 [µm]∗ | Ki [µm]† |
|---|---|---|---|---|---|
TM287/288 | 50 | 7.78 ± 1.10 | AMP-PNP | 16.1 ± 1.6 | 0.246 ± 0.042 |
ATPγS | 2.86 ± 0.08 | 0.0439 ± 0.0062 | |||
ADP | 681 ± 160 | 10.4 ± 2.9 | |||
Vanadate | 4.90 ± 0.29 | 0.0751 ± 0.0114 | |||
25 | 3.27 ± 0.42 | AMP-PNP | 179 ± 75 | 1.17 ± 0.51 | |
ATPγS | 31.4 ± 2.8 | 0.204 ± 0.032 | |||
ADP | 505 ± 21 | 3.28 ± 0.44 | |||
BmrCD | 25 | 343 ± 24 | AMP-PNP | 174 ± 24 | 21.0 ± 3.2 |
ATPγS | 221 ± 24 | 26.7 ± 3.3 |
-
∗ Km and IC50 values and standard errors were obtained from fits shown in Figure 3.
-
† Ki values and standard errors were calculated based on the given Km and IC50 values as described in the materials and methods.
Download links
A two-part list of links to download the article, or parts of the article, in various formats.
Downloads (link to download the article as PDF)
Open citations (links to open the citations from this article in various online reference manager services)
Cite this article (links to download the citations from this article in formats compatible with various reference manager tools)
Exploring conformational equilibria of a heterodimeric ABC transporter
eLife 6:e20236.
https://doi.org/10.7554/eLife.20236


