How prior preferences determine decision-making frames and biases in the human brain
- Institut du Cerveau et de la Moelle épinière, France
- Inserm U1127, CNRS U 7225, Université Pierre et Marie Curie, France
- CHU Henri Mondor, DHU Pe-PSY, Service de Neurochirurgie Fonctionnelle, France
Figures
Figure 1
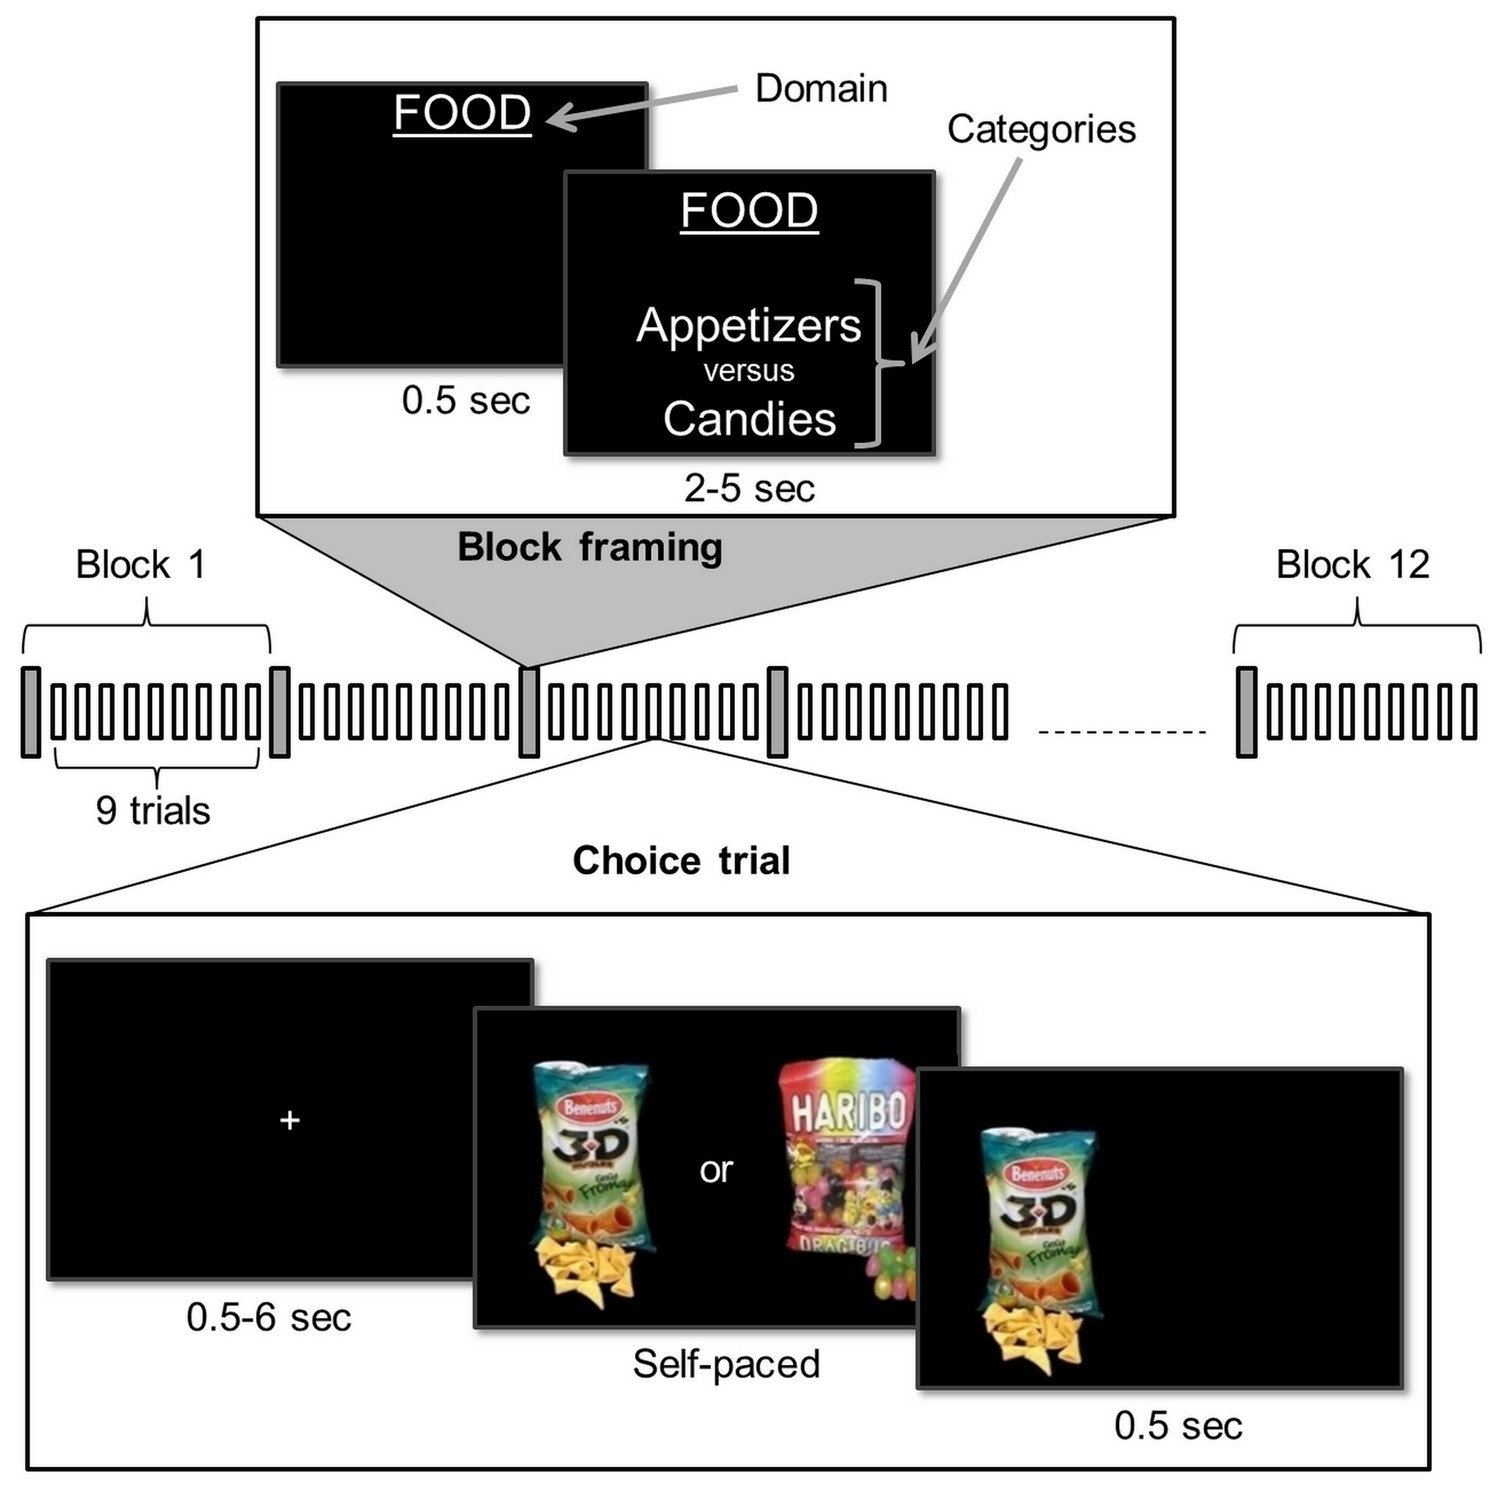
Choice task.
Participants performed the choice task inside the MRI scanner. The task was composed of four 12-block sessions. During a block, subjects first saw an instruction screen indicating the reward domain (e.g., food) and the two categories from which choice options were drawn. Then, they had to make a series of nine binary choices, each confronting the two categories with two novel items. The choice was self-paced and feedback on chosen option was provided to the subject.
Figure 2
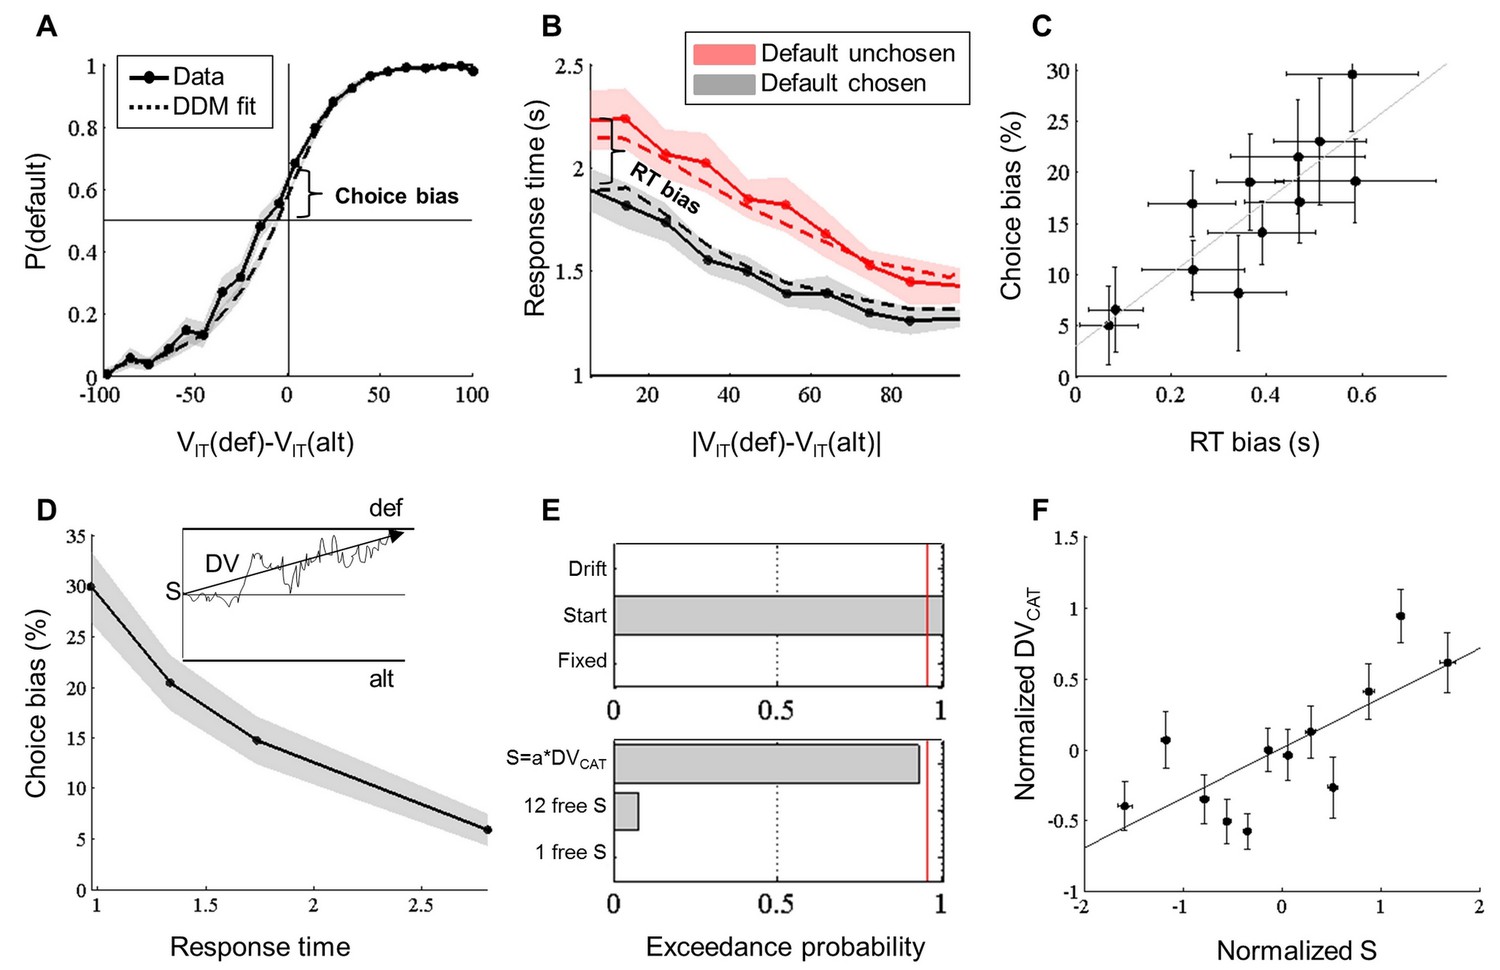
Behavioral results (MRI experiment).
(A) Probability of choosing the default option, P(def), plotted as a function of decision value, DVIT, divided into 20 bins. Values correspond to likeability ratings given by the subject prior to scanning. Both probabilities observed in choice data (solid line) and simulated from the fitted Drift Diffusion Model (dashed line) are shown. Choice bias was defined as the difference between the observed probability for a null decision value and the expected equiprobability (50%). (B) Choice response time (RT) plotted as a function of the absolute decision value, |DVIT|, divided into 10 bins, separately for trials in which the default option was chosen (black) and unchosen (red). Both RT observed in behavioral data (solid line) and simulated from the fitted Drift Diffusion Model (dashed line) are shown. RT bias was defined as the difference between the intercepts observed for the two types of choice. (C) Correlation of choice and RT biases across blocks. (D) Choice bias plotted as a function of response time, divided into four bins. Inset illustrates the Drift Diffusion model (adapted from (Voss et al., 2013), with S the starting point, DV the mean drift rate and def / alt the thresholds for choosing default / alternative options. Choice bias was larger for shorter RT, suggesting that it could arise from a bias in the starting point. (E) Family model comparison between different theoretical accounts of choice and RT biases. Top: the null model (‘Fixed’) is compared to models in which either the starting point (‘Start’) or the drift rate (‘Drift’) is allowed to favor the default option. Bottom: the model with a single free starting point (‘1 free S’) is compared to models in which the starting point is varied across blocks, either in proportion to the value difference between categories ‘S=a*DVCAT’ or as a set of 12 independent parameters (‘12 free S’). Red line corresponds to 95% exceedance probability. (F) Correlation across blocks between DVCAT and starting point S (from fitting the '12-free-S’ model). This suggests that the starting point is adjusted in each block to the average value difference between the two confronted categories. Shaded areas and error bars represent ± inter-subject SEM.
Figure 3
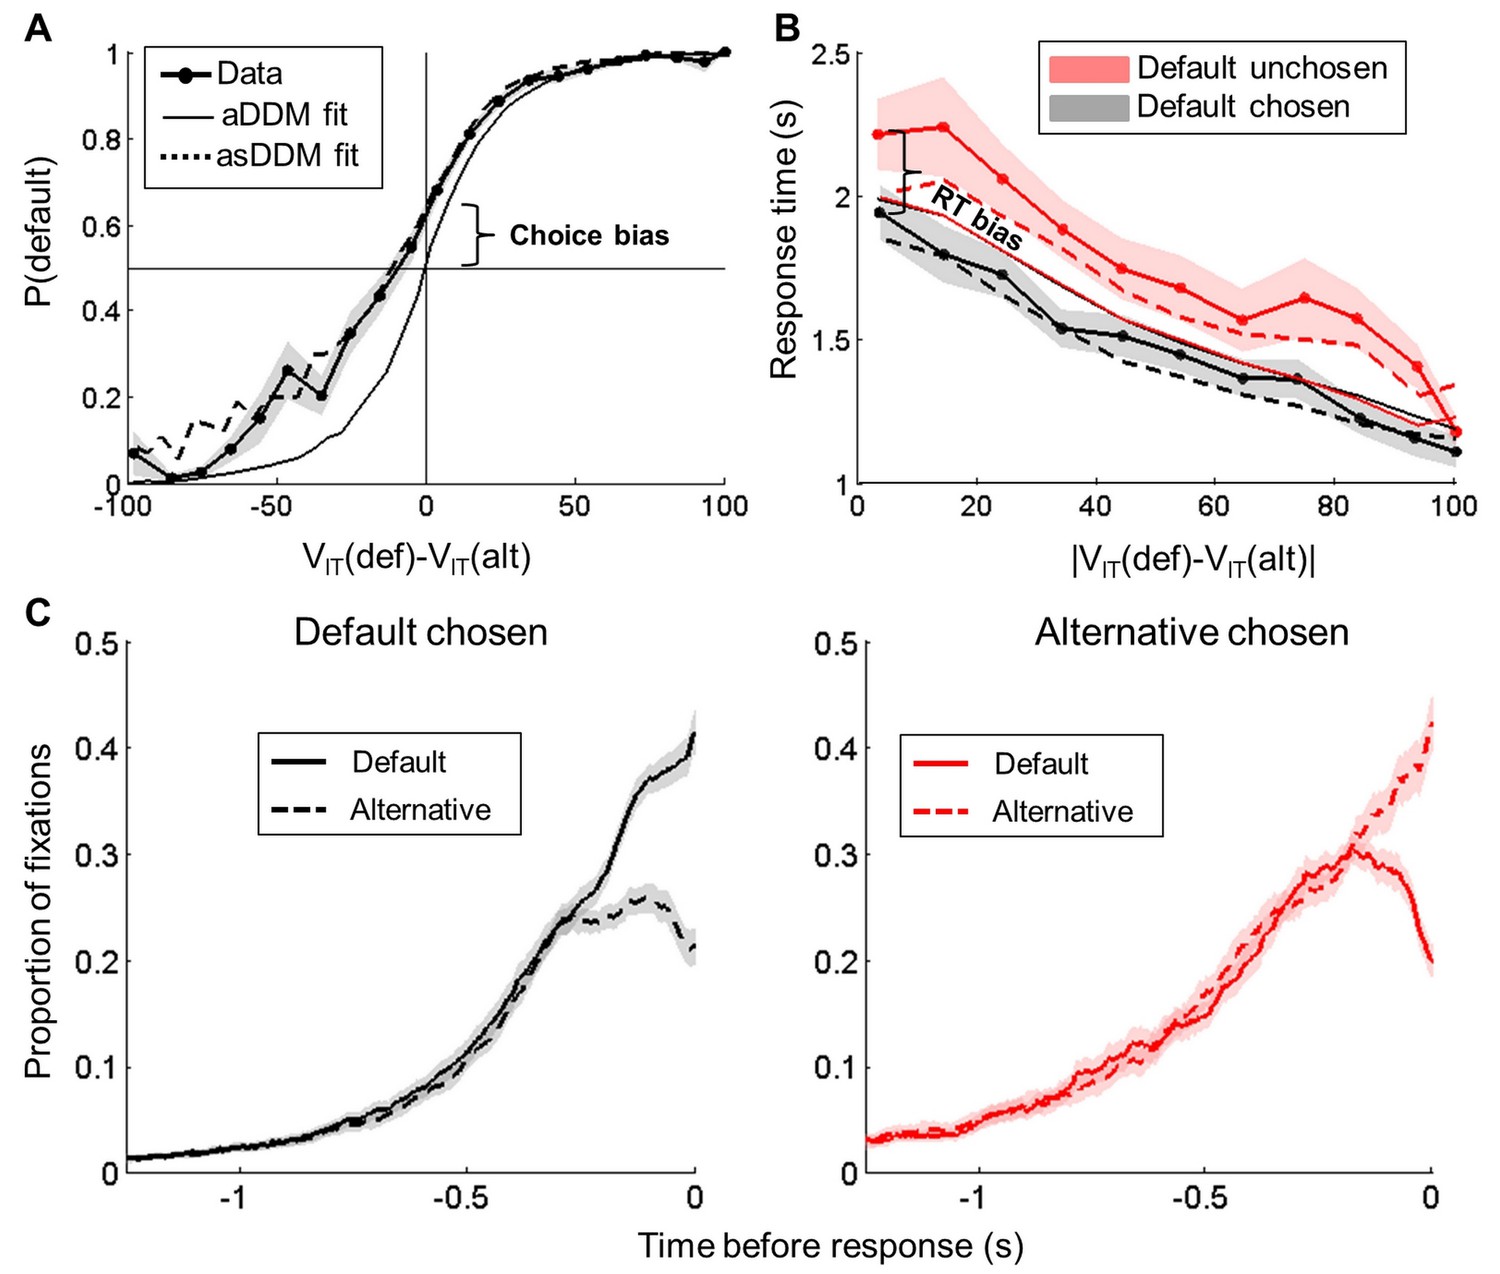
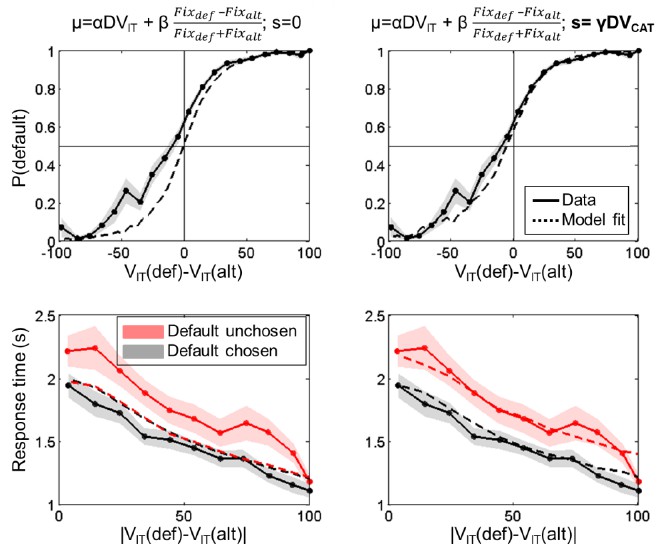
Behavioral results (eye-tracking experiment).
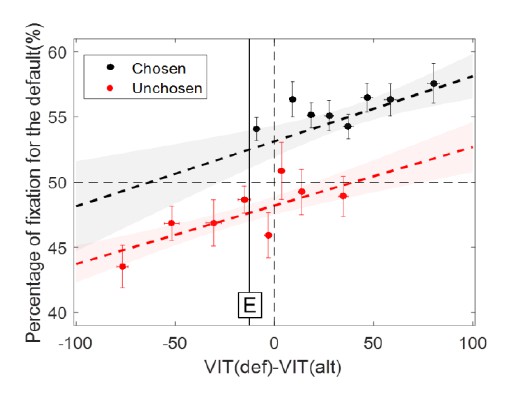
(A) Probability of choosing the default option plotted as a function of decision value DVIT. The three curves correspond to probabilities actually observed in choice data (lines with circles) and simulated from either the fitted attentional Drift Diffusion Model (aDDM, solid lines) or the same model fitted with a starting point proportional to prior preference DVCAT (asDDM, dashed line). (B) Choice response time (RT) plotted as a function of the absolute decision value |DVIT|, separately for trials in which the default option was chosen (left) and unchosen (right). The different curves correspond to RT observed in behavioral data (lines with circles) and simulated from either the fitted aDDM (solid line with circles) or asDDM (dashed line). Note that the aDDM alone cannot reproduce choice and RT biases. (C) Proportion of fixations (number of trials over all trials) to the default and alternative options at each time point when default is chosen (left) or unchosen (right). Curves are time-locked to choice (button press). They do not add up to one because at a given time point in a given trial, subjects may fixate none of the two options. Shaded areas are ± inter-subject SEM.
Figure 4 with 1 supplement
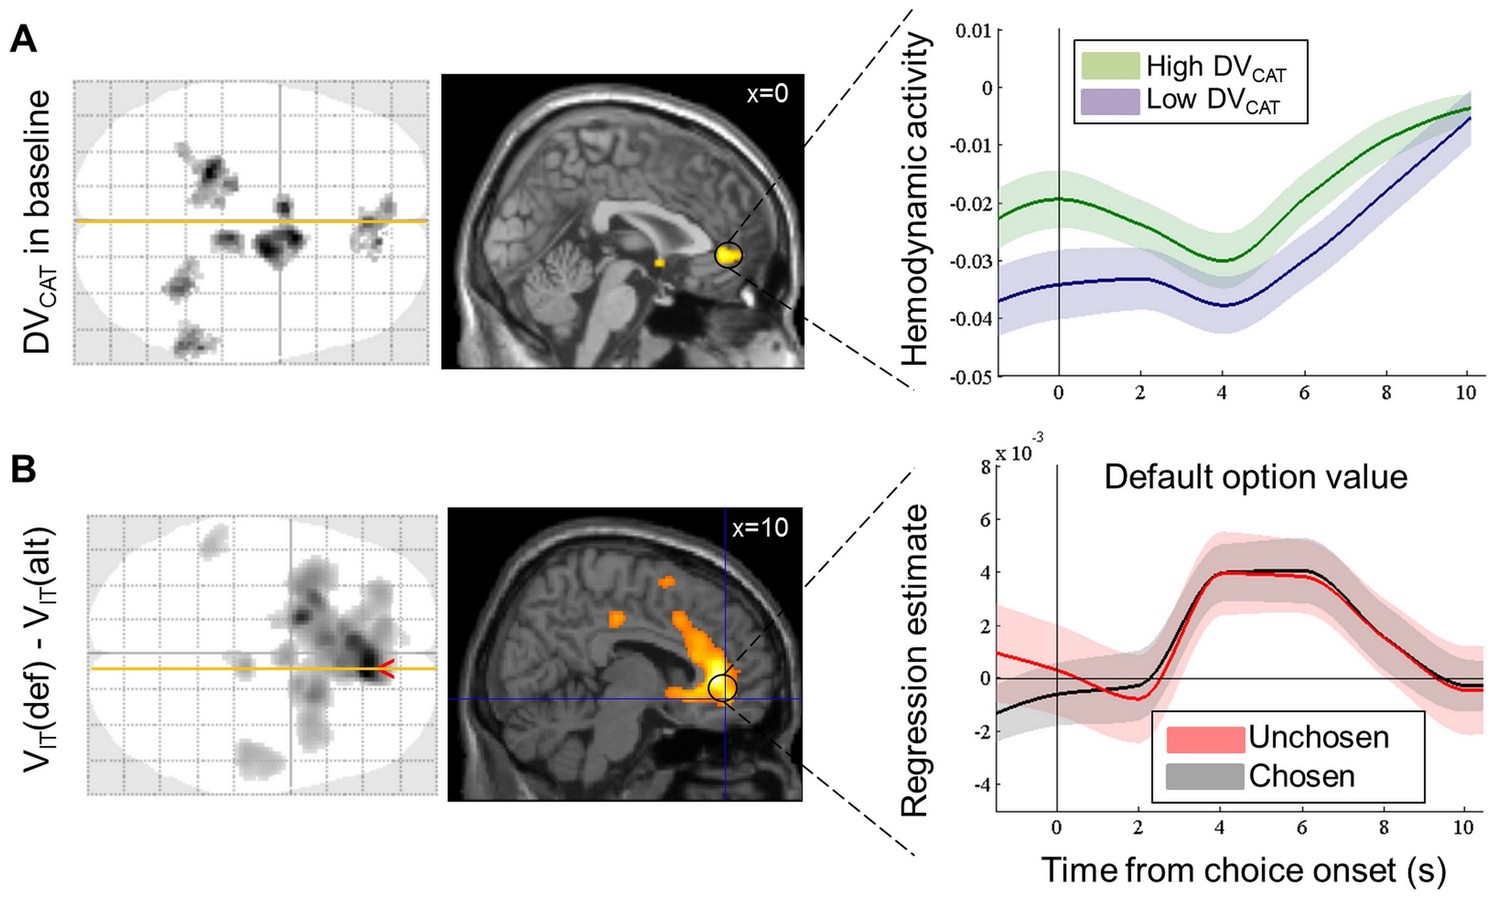
Neural correlates of the bias and framing effects of prior preference.
(A) Bias in value coding and vmPFC baseline. Left: axial glass brain and sagittal slice of statistical maps relating to the prior preference (DVCAT), one volume (2 s) before the display of choice options. Areas shown in black (on glass brain) and yellow (on sagittal slice) showed significant positive group-level random effect (one-sample t-test, p<0.005 uncorrected for display purposes, minimum extent: 100 voxels). Right: time course of peri-stimulus fMRI activity in the vmPFC region, shown separately for high (green) and low (purple) DVCAT. Black vertical line (time 0) indicates the onset of choice options. (B) Frame of value coding in vmPFC response. Left: axial glass brain and sagittal slice of statistical maps relating the canonical hemodynamic response to the decision value (DVIT), at the onset of choice option (same threshold as in A: one-sample t-test, p<0.005 uncorrected for display purposes, minimum extent: 100 voxels). Right: time courses of the regression estimate (beta) obtained in the vmPFC region for the default option value when it was chosen (black) or unchosen (red). Shaded areas are ± inter-subject SEM.
Figure 4—figure supplement 1
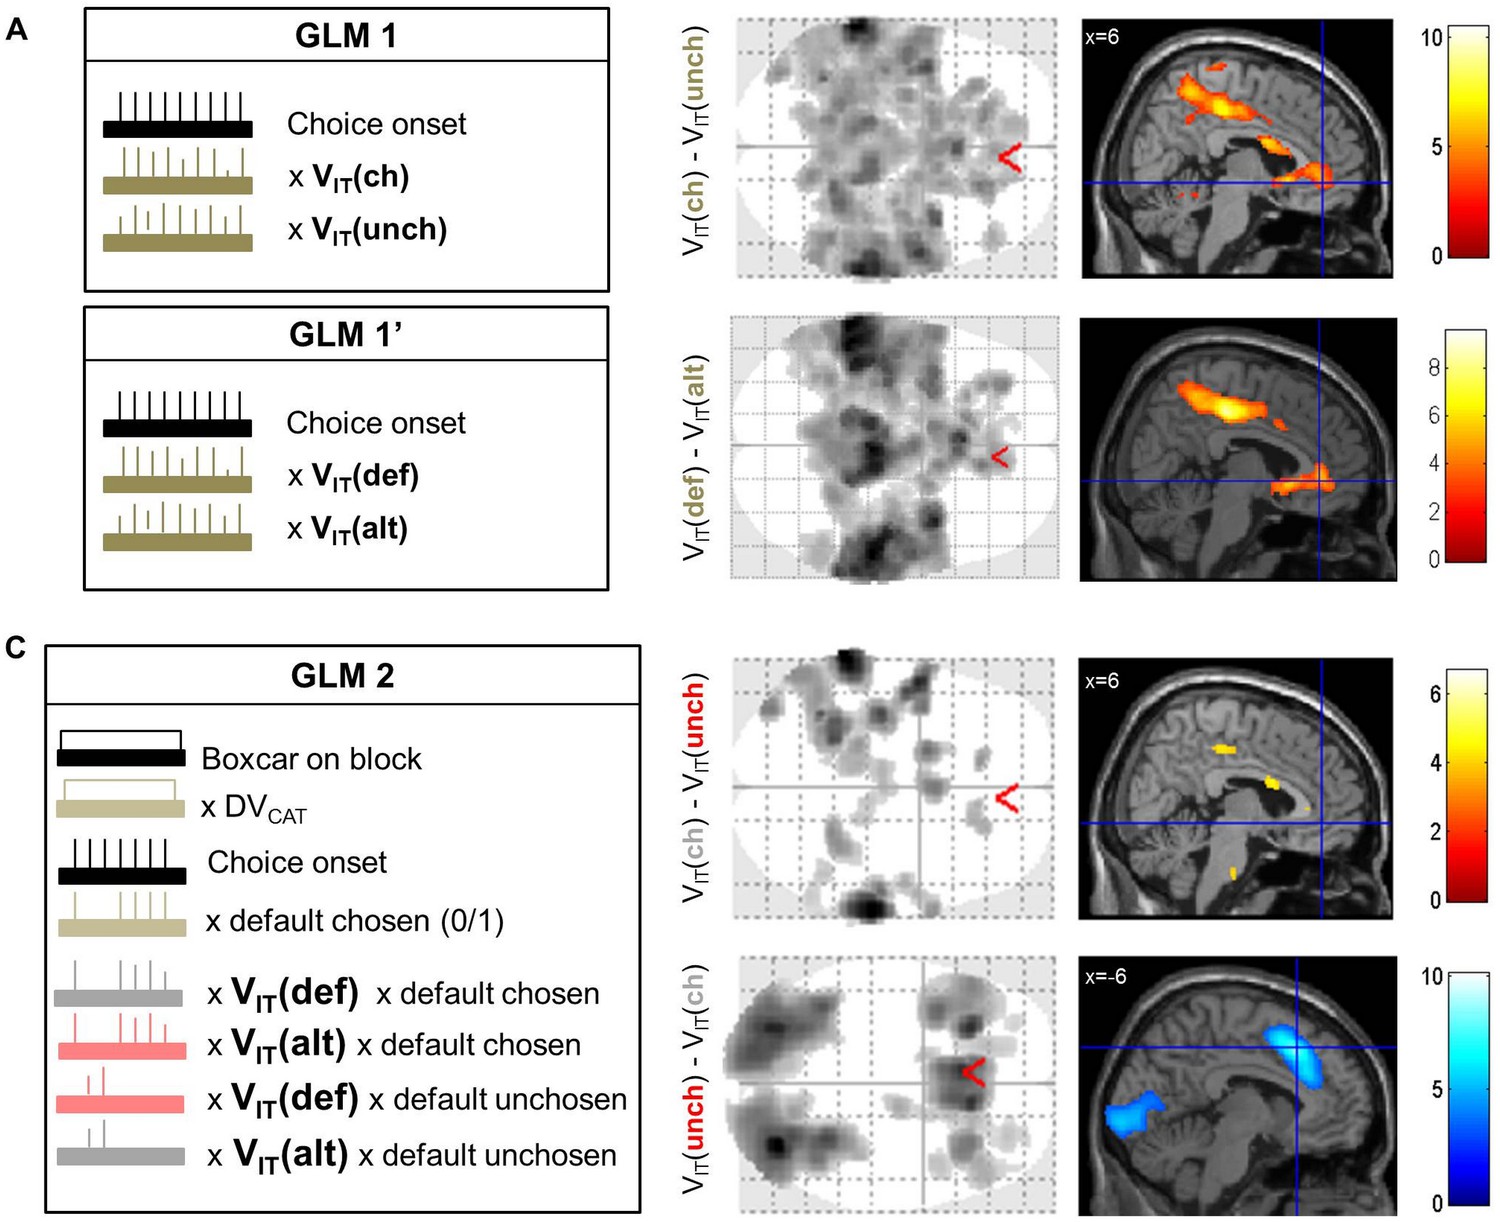
Dissociation of neural value representations expressed in the pre-choice versus post-choice frame.
(A) Simple contrasts between chosen and unchosen value (GLM1) or between default and alternative options (GLM1’). The box on the left illustrates GLM1 and GLM1’, with a delta function indicating the onset of choice options (black), modulated by two parametric regressors representing the option values (brown). The maps on the right show in black (on glass brain) and with color code (on sagittal slice) clusters that significantly reflected post-choice (top) and pre-choice (bottom) decision value at the group level (one-sample t-test, p<0.005 uncorrected for display purposes, minimum extent: 100 voxels). In both cases significant clusters were found in the vmPFC and ventral striatum, among many other areas, with global maxima in the intra-parietal lobules. (B) Dissociation between decision value coding in the pre-choice and post-choice frames using GLM2. The box on the left illustrates GLM2, with a boxcar and delta functions (black) indicating the duration of blocks and the onset of choice options, respectively. The boxcar function was parametrically modulated by the prior preference, whereas the delta function was parametrically modulated by choice type and the four interactions between choice type and option values, i.e. default and alternative option values when default is chosen and when it is not chosen. The maps on the right show significant clusters (using same tests and thresholds as in A) in the contrasts between grey and red regressors, which correspond to chosen versus unchosen values. These contrasts show differences in parameter estimates for the value of chosen options (irrespective of whether they are default or alternative), relative to unchosen options. Compared to the result shown in A, the chosen minus unchosen option value contrast still yielded significant activation outside the brain valuation system, but not in the vmPFC or ventral striatum (with identical statistical threshold). The orthogonal contrast, between default and alternative option values (irrespective of whether they are chosen or not), did result in activation of the vmPFC and ventral striatum, as shown in Figure 4B and Table S1 (Supplementary file 1).
Author response image 1
Author response image 2
Author response image 3
Author response image 4

Author response image 5

Additional files
-
Supplementary file 1
Table S1 – Activation list for decision value coding in the pre-choice and post-choice frames (GLM 3).
Regions are listed that survived voxel-based thresholding of p<0.001 uncorrected, and whole-brain 991 cluster-level FWE correction. [x, y, z] coordinates refer to the Montreal Neurological Institute (MNI) space.
- https://doi.org/10.7554/eLife.20317.008
Download links
A two-part list of links to download the article, or parts of the article, in various formats.
Downloads (link to download the article as PDF)
Open citations (links to open the citations from this article in various online reference manager services)
Cite this article (links to download the citations from this article in formats compatible with various reference manager tools)
How prior preferences determine decision-making frames and biases in the human brain
eLife 5:e20317.
https://doi.org/10.7554/eLife.20317


