Activity-dependent switch of GABAergic inhibition into glutamatergic excitation in astrocyte-neuron networks
- Instituto Cajal, Spain
- The Barcelona Institute of Science and Technology, Spain
- University of Minnesota, United States
- University of Castilla-La Mancha, Spain
- Ruhr University Bochum, Germany
- University of Saarland, Germany
- Universidad de Valparaíso, Chile
- Johns Hopkins School of Medicine, United States
- University of Basel, Switzerland
Figures
Figure 1 with 2 supplements
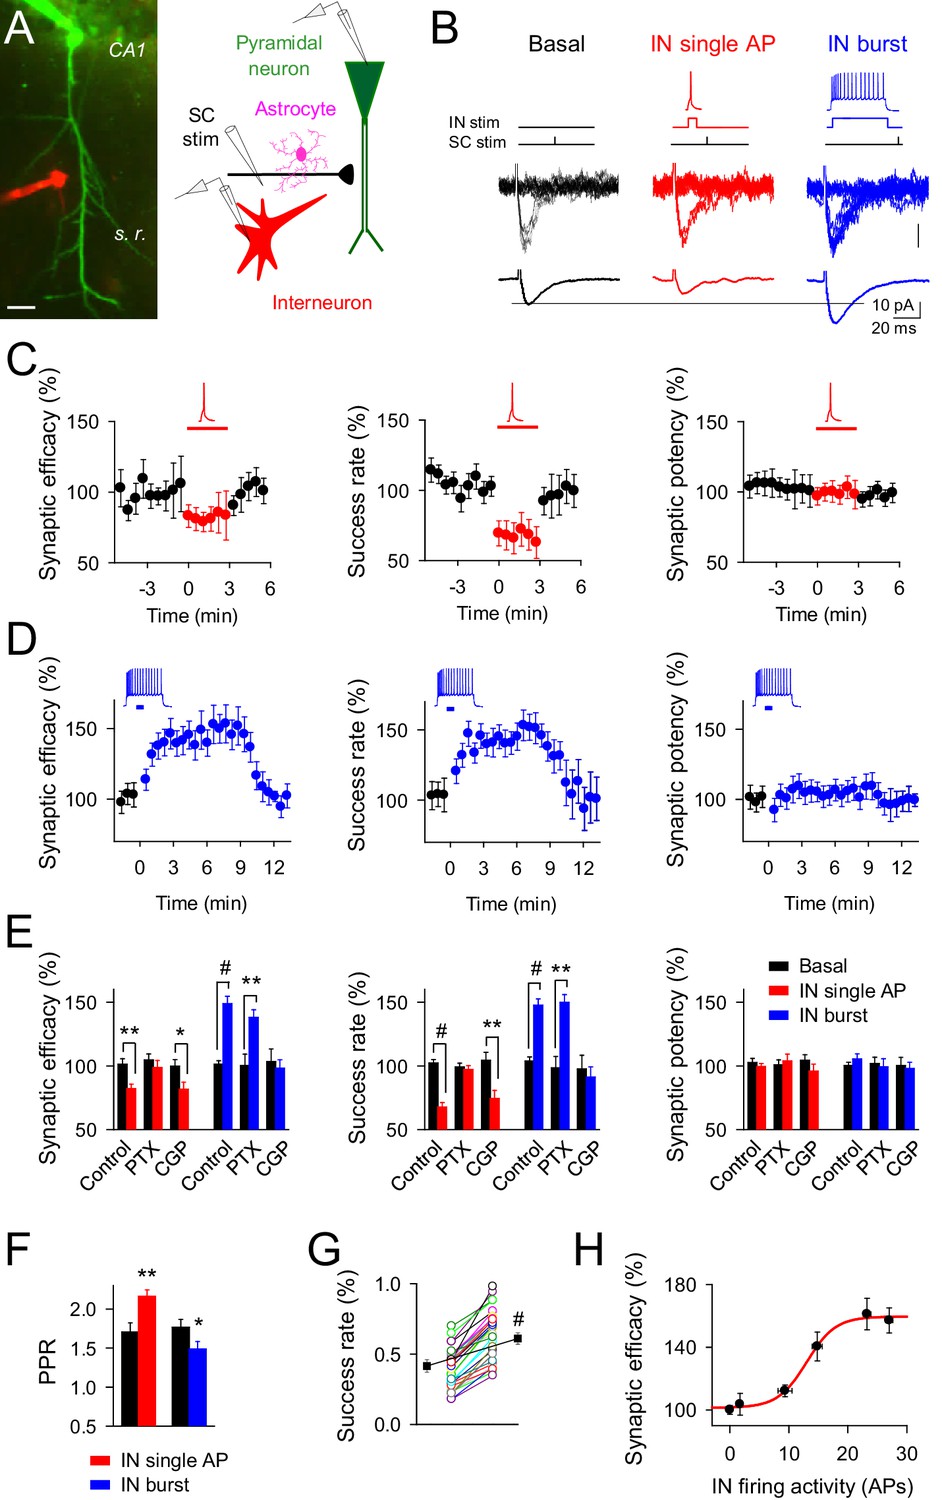
Changes on interneuron firing activity inhibit or potentiate transmitter release at single CA3-CA1 synapses.
(A) Left, image of paired recorded GABAergic interneuron (IN; red) and CA1 pyramidal neuron (green). Right, scheme depicting paired recordings from interneuron and pyramidal neurons, and Schaffer collateral (SC) stimulating electrode. Scale bar, 25 mm. (B) Responses evoked by minimal stimulation showing regular EPSC amplitudes and transmission failures (15 consecutive stimuli; top), and averaged EPSCs (50 consecutive stimuli; bottom) before and after pairing SC stimuli with single (red) or bursts (blue) of interneuron APs. (C–D) Synaptic efficacy (i.e., mean amplitude of responses including successes and failures); success rate (percentage of effective EPSCs from the total number of stimuli); and synaptic potency (i.e., mean EPSC amplitude excluding failures) (bin width, 33 s) before and after pairing SC stimuli with single (C) red; n = 10) or bursts (D) blue; n = 33) of interneuron APs. Horizontal bars indicate the time of pairing. (E) Relative changes of synaptic parameters from basal (black) elicited by pairing SC stimuli with single (red) or bursts of interneuron APs (blue), in control (n = 10 and 33, for red and blue, respectively), picrotoxin (PTX; n = 6 and 7, for red and blue, respectively), and CGP55845 (n = 5 and 9, for red and blue, respectively). (F) Paired pulse ratio (PPR). (G) Success rate from synapses shown in D, and averaged values (black) in control and after IN burst stimulation (n = 33). The IN-mediated effects were independent on their initial values. (H) Relative potentiation of synaptic efficacy vs. interneuron firing activity (n ≥ 4 for each data point; Hill equation fitting, R2 = 0.9955). *p<0.05, **p<0.01, #p<0.001; paired t test. See also Figure 1—figure supplements 1 and 2. Error bars indicate SEM, as in all other figures.
Figure 1—figure supplement 1
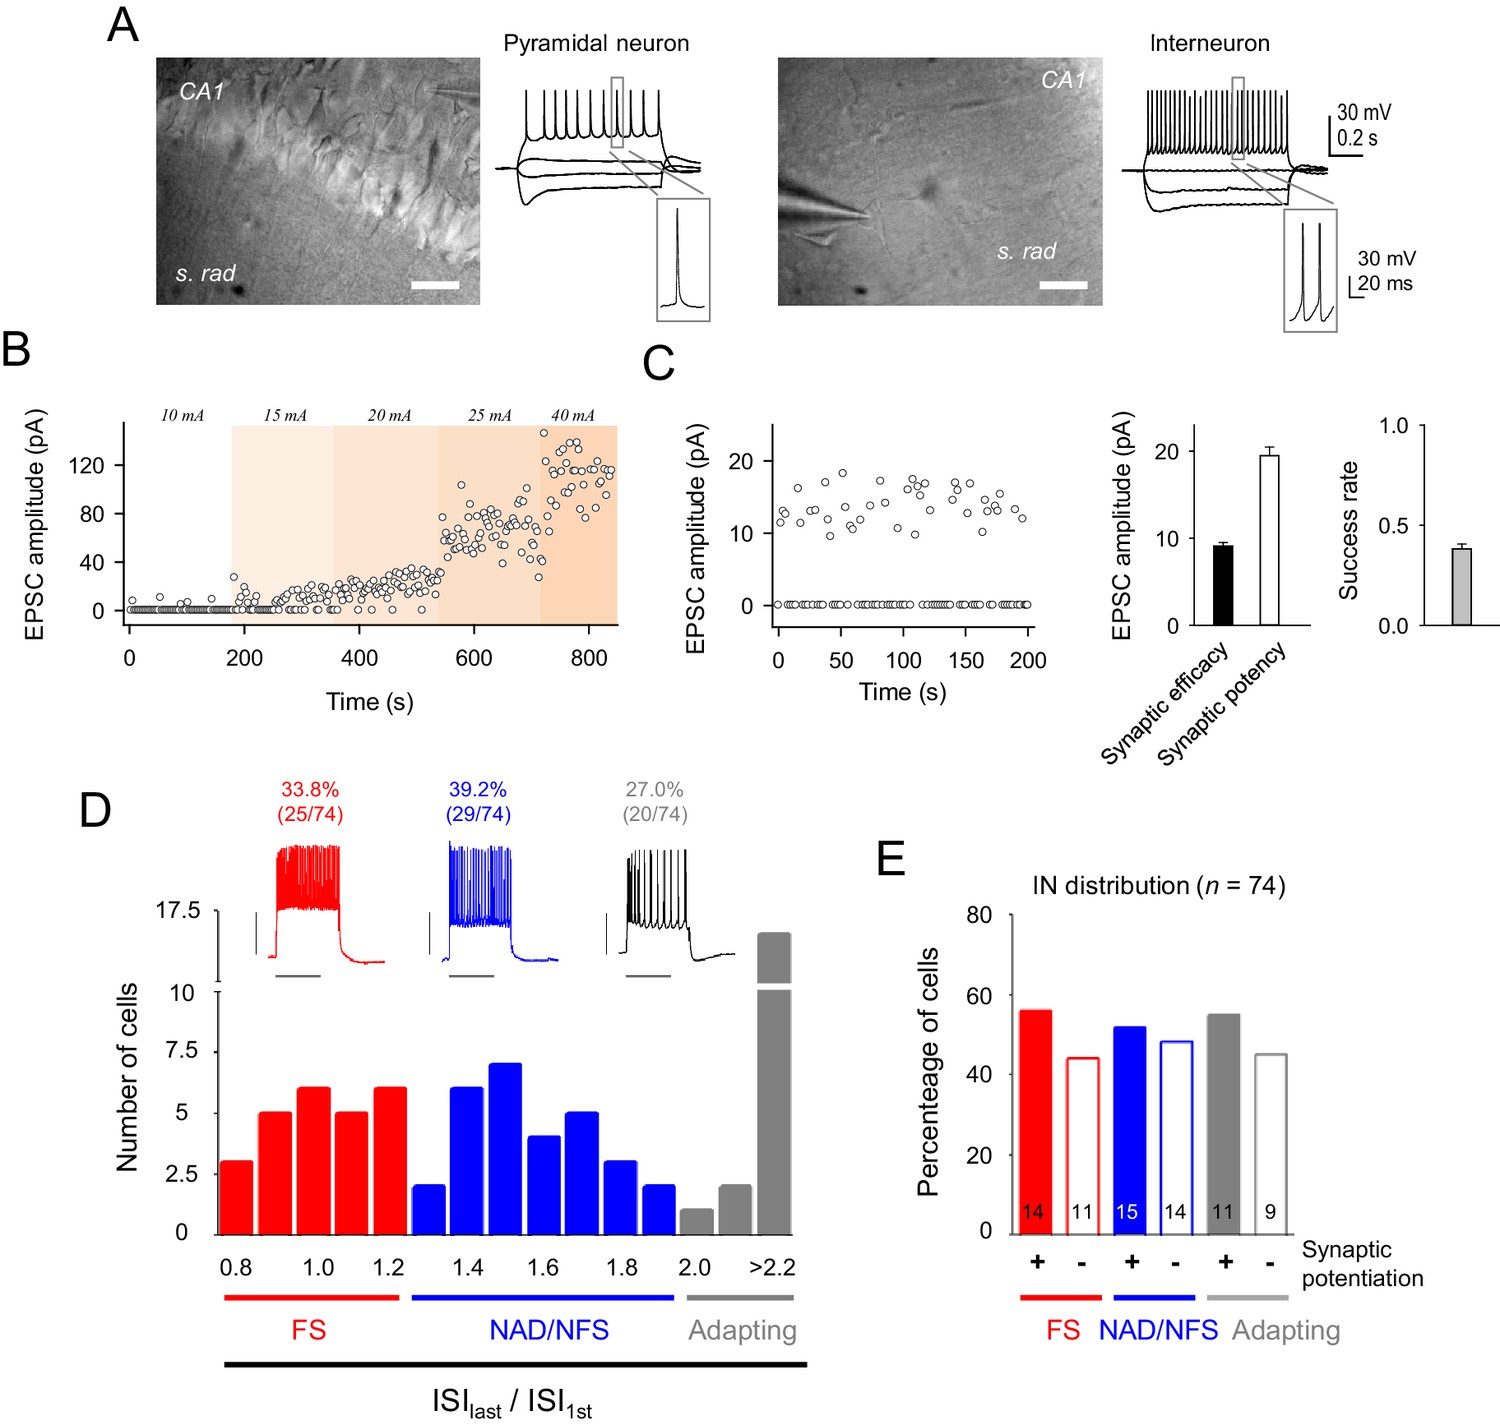
Electrophysiological properties of recorded cells and synaptic currents evoked by minimal stimulation.
(A) Infrared differential interference contrast images of a CA1 pyramidal neuron (left) and an interneuron (right), with their representative voltage responses to hyper and depolarizing current pulses. Scale bar, 40 µm. (B) Time course of EPSC peak amplitude of single synapse stimulation while increasing stimulation intensity. Note the step-like activation of larger responses to small changes in stimulus intensity. (C) Left, EPSC amplitudes (failures and successes) from a representative CA3-CA1 single synapse recorded from a CA1 pyramidal neuron. Note the high number of transmission failures and the relatively low and constant EPSC amplitude, which are indicative of putative single synapse activity. Note that stimulation intensity was unchanged for the entire experiment. Right, summary of synaptic transmission parameters from representative recordings evoked by minimal stimulation: synaptic efficacy (mean amplitude of all EPSCs, including failures), synaptic potency (mean EPSC amplitude without failures), and mean success rate of neurotransmitter release (n = 45 synapses). (D) Top, representative firing patterns of the 3 types of recorded interneuron evoked by 700 ms depolarization pulses. Bottom, representation of the number of cells belonging to each interneuron subtype, according to their inter-spike interval (ISI) adaptation rate. (E) Proportion of interneuron that induced synaptic transmission potentiation after eliciting bursts of interneuron APs. These data indicate that the synaptic potentiation was independent of the interneuron subtypes. Error bars indicate SEM.
Figure 1—figure supplement 2
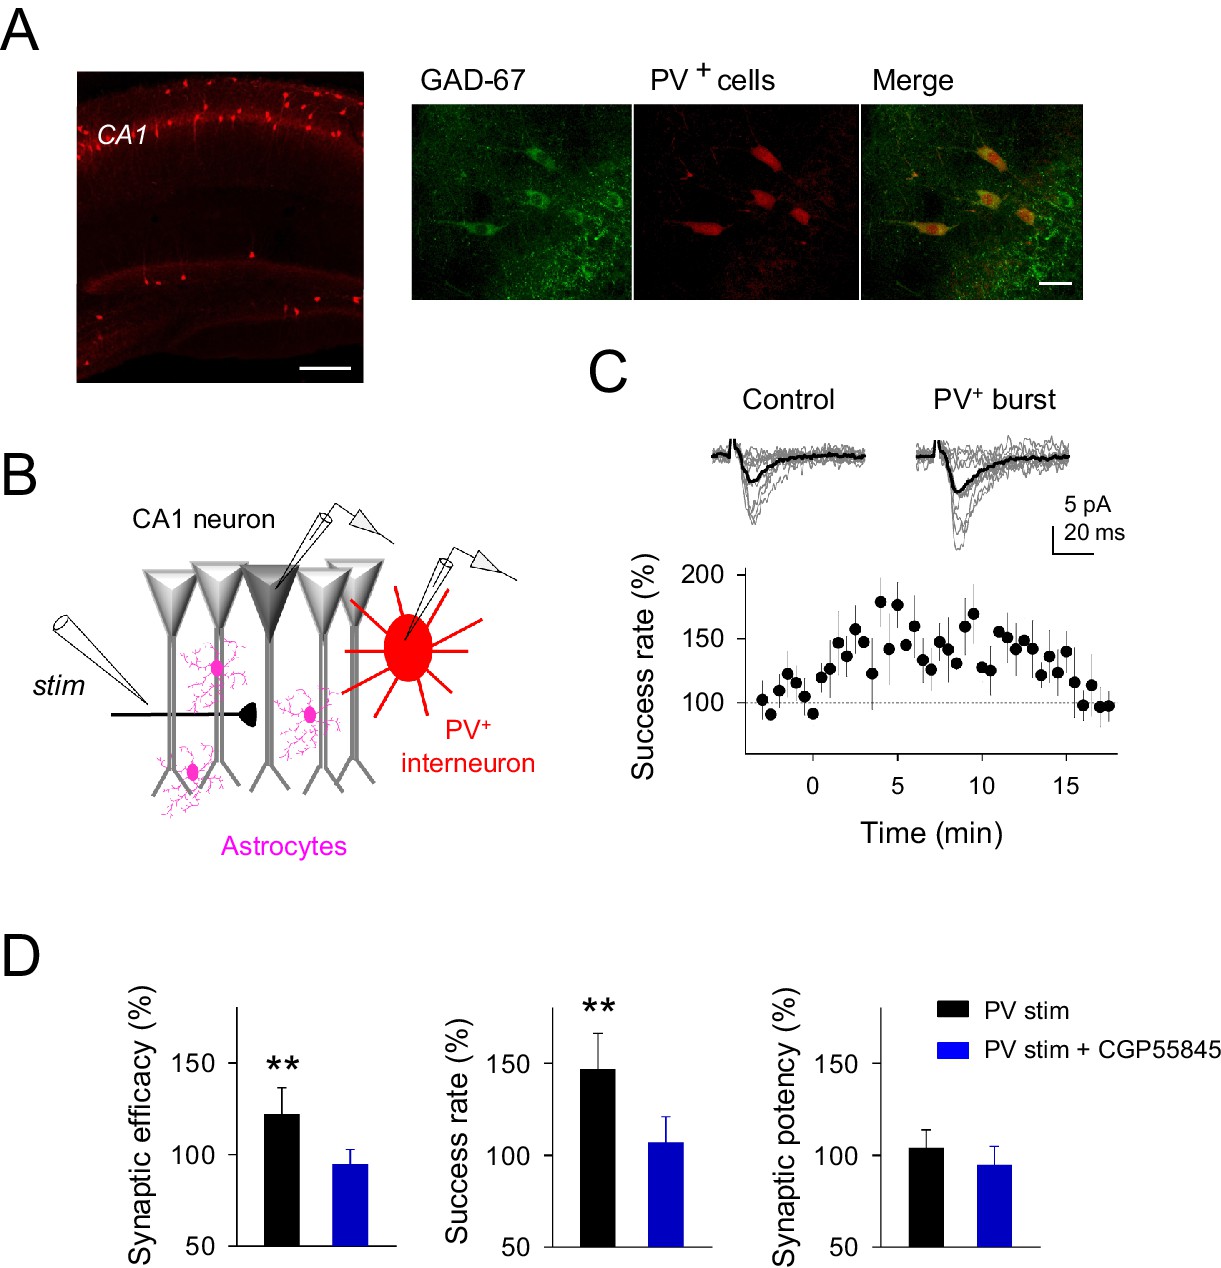
Parvoalbumin-positive CA1 interneuron stimulation potentiates excitatory synaptic transmission at single CA3-CA1 synapses.
(A) Left, confocal image of hippocampus from a Pvalb-cre/Ai9-rcl-tdTomato mouse. Scale bar, 800 μm. Right, immunostaining for GAD-67 expressing interneurons in the CA1 hippocampal region. Note the colocalization of GAD-67 labeling (green) and PV+-tomato cells (red), indicating the GABAergic nature of PV+ neurons. Scale bar, 30 μm. (B) Scheme depicting paired recordings from PV+-interneuron (red) and CA1 pyramidal cells (gray), Schaffer collateral stimulating electrode (stim), and surrounding astrocytes (pink). (C) Top, synaptic responses evoked by minimal stimulation showing EPSC amplitudes and transmission failures (12 consecutive stimuli; light gray), and averaged EPSCs (40 consecutive stimuli; black) before and after PV+-cell APs bursting. Bottom, the time course of the success rate of neurotransmitter release before and after APs bursting of PV+-cell (n = 9; bin width, 30 s). Zero time indicates the onset of PV+-cell stimulation. (D) Relative changes of synaptic parameters from basal (white) elicited by pairing SC stimuli with bursts of PV+-cell APs (black), in control (n = 9) and in presence of CGP55845 (n = 5). **p<0.01; paired t-test. Error bars indicate SEM.
Figure 2

Interneuron activity regulates transmitter release at the same synapses depending on the firing rate.
(A) Synaptic efficacy, success rate and synaptic potency before and after pairing SC stimuli with single (red) or bursts (blue) of interneuron APs (n = 6). Horizontal bars indicate the time of pairing. (B) Raw values of synaptic parameters plotted for both IN-stimulation conditions: control (black), IN single AP (red), and IN burst (blue) stimulation (n = 6). Note that the IN-mediated effects were independent on the initial values of synaptic parameters. (C) Relative changes of synaptic parameters from basal (black) elicited by pairing SC stimuli with single (red) or bursts of interneuron APs (blue) (n = 6). Synaptic efficacy: p=0.008 (red), p<0.001 (blue). Synaptic potency: p=0.355 (red), p=0.407 (blue). Success rate: p<0.001 (red), p<0.001 (blue); paired t test. **p<0.01, #p<0.001; paired t test.
Figure 3 with 1 supplement
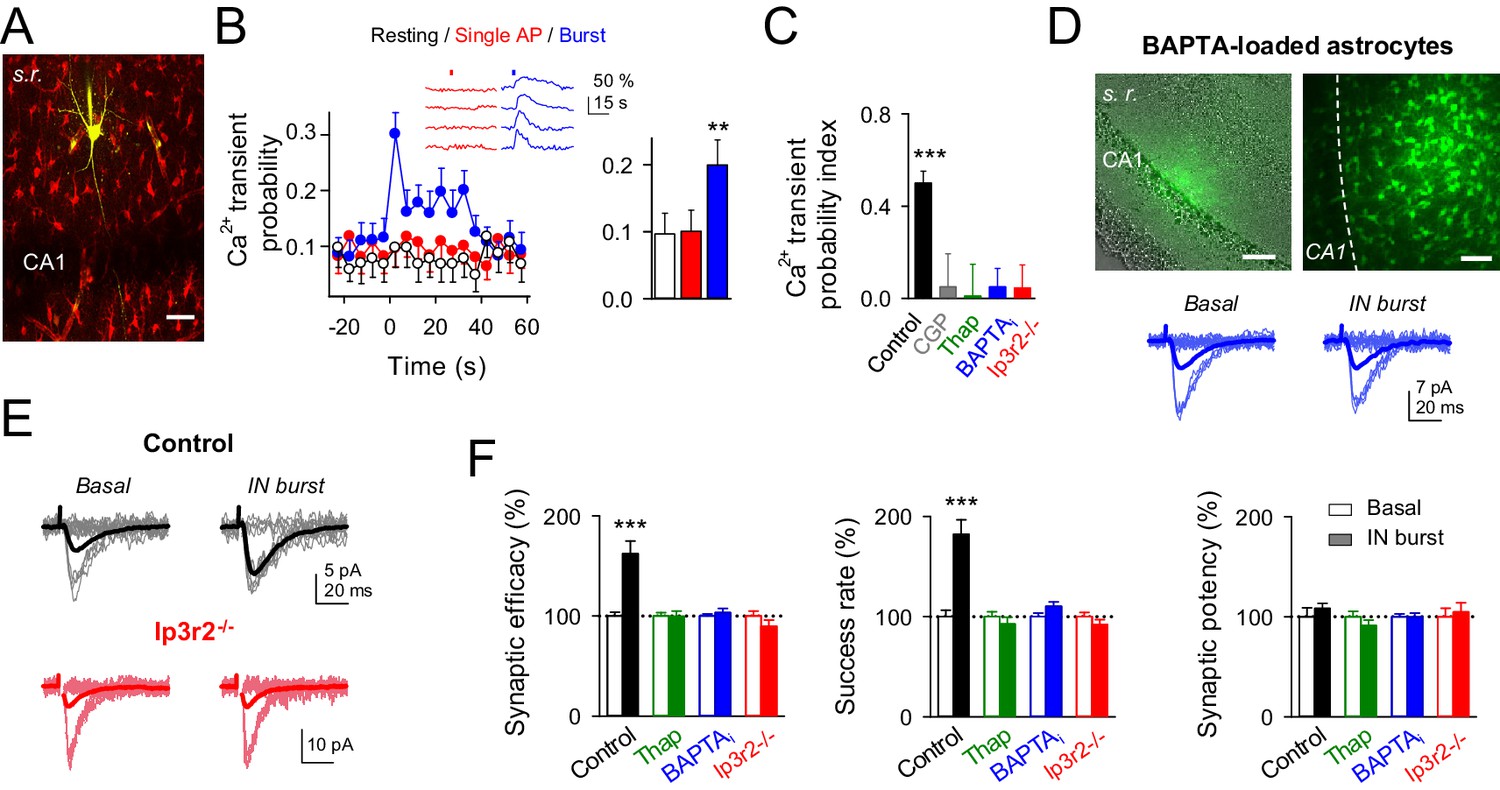
Interneuron-induced synaptic potentiation requires astrocyte Ca2+ elevations.
(A) Image of recorded interneuron (yellow) and SR101-labelled astrocytes (red) in CA1 region. Scale bar, 40 µm. (B) Left, astrocyte Ca2+ transient probability over time (zero time corresponds to interneuron depolarization) in resting conditions (white), and after evoking single (red) or bursts (blue) of interneuron APs, and somatic Ca2+ signals from four representative astrocytes in the field of view to single APs (red) and burst of interneuron APs (blue). Red and blue bars denote interneuron stimulation. Right, average values for those conditions. Single APs (red; p=0.92; paired t test), burst of interneuron APs (blue; p=0.007; 58 astrocytes, nine slices). (C) Ca2+ transient probability index after bursts of interneuron APs in control (58 astrocytes, nine slices; p<0.001; Wilcoxon rank-sum test), CGP55845 (91 astrocytes, 10 slices; p=0.824; Wilcoxon rank-sum test), thapsigargin (41 astrocytes, five slices; p=0.37; Wilcoxon rank-sum test), BAPTA-loaded astrocytes (41 astrocytes, nine slices; p=0.2622; Wilcoxon rank-sum test), and Ip3r2-/- mice (112 astrocytes, 14 slices; p=0.4319; Wilcoxon rank-sum test). (D) Left, merge DIC and fluorescence image of the CA1 pyramidal layer and stratum radiatum (s.r.) showing the location of the biocytin-filled astrocyte network (green). Right, maximal projection confocal image of the astrocytic syncytium revealed by biocytin-loading via whole-cell astrocyte recording, showing the distribution of biocytin-coupled astrocytes. Scale bars, 50 µm. Bottom, synaptic responses evoked by minimal stimulation (15 consecutive stimuli; light traces), and averaged EPSCs (50 consecutive stimuli; dark traces) before and after interneuron AP bursts in BAPTA-loaded astrocytes (blue). (E) Synaptic responses evoked by minimal stimulation (15 consecutive stimuli; light traces), and averaged EPSCs (50 consecutive stimuli; dark traces) before and after interneuron AP bursts in control (black) and Ip3r2-/- mice (red). (F) Relative changes of synaptic parameters induced by bursts of interneuron APs (filled bars), in control (n = 6; p<0.001; paired t test), thapsigargin (n = 9), BAPTA-loaded astrocytes (n = 11), and Ip3r2-/- mice (n = 8). See also Figure 3—figure supplement 1. **p<0.01, ***p<0.001; paired t test.
Figure 3—figure supplement 1
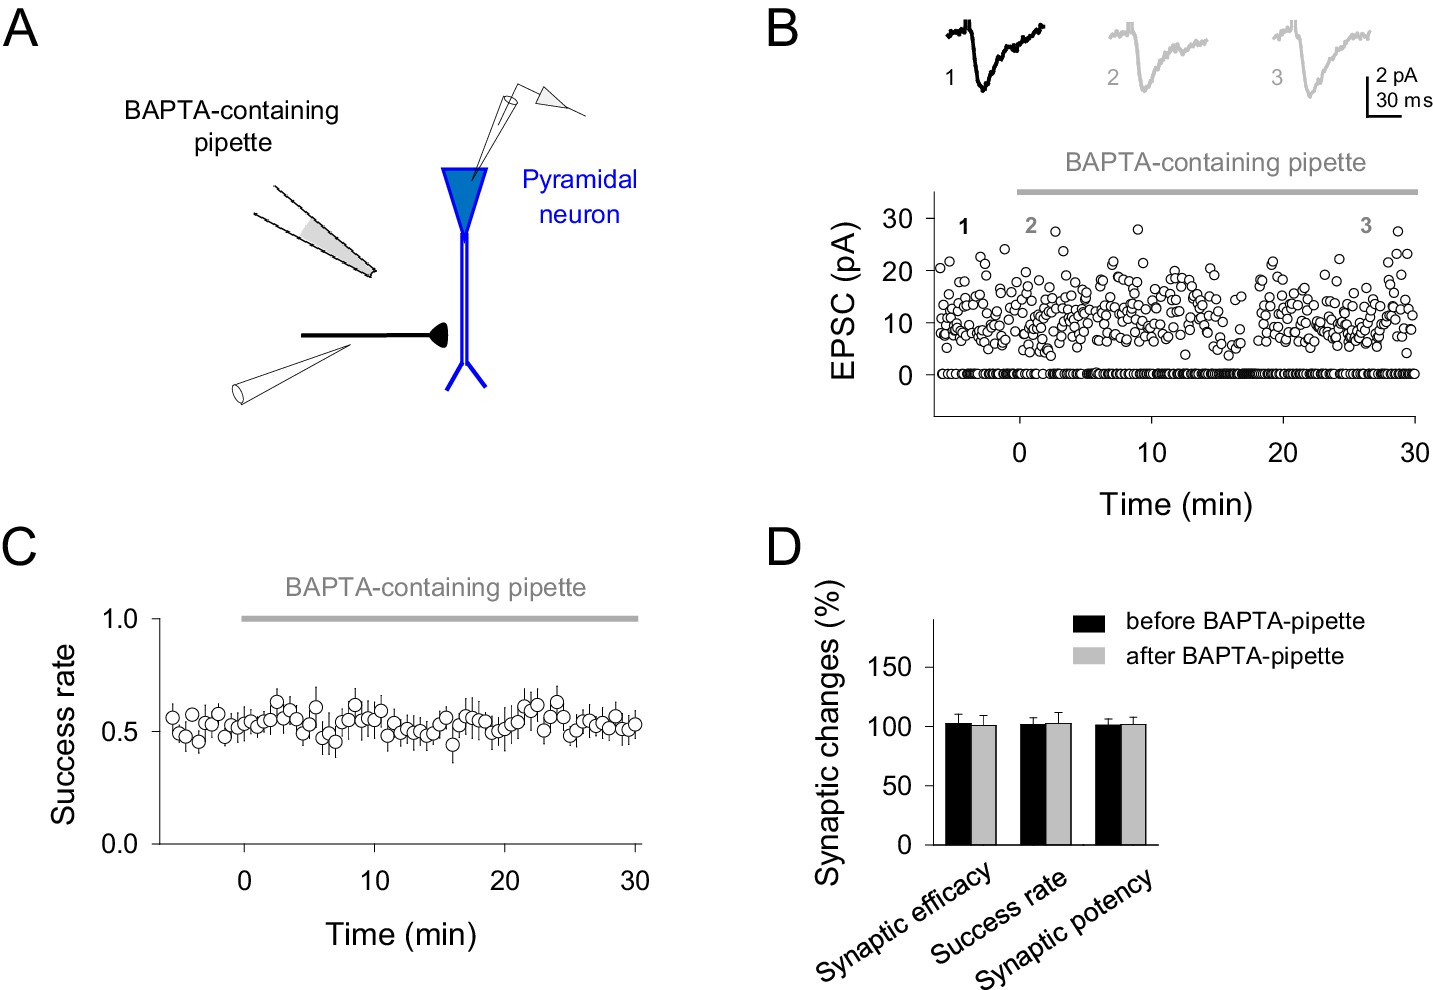
BAPTA-containing pipette in the extracellular space does not affect synaptic responses.
(A) Schematic experimental design showing the single synapse stimulation, neuronal recording and BAPTA-containing pipette location. (B) Representative EPSCs before and after different time points placing the BAPTA-containing pipette at the slice (top; gray bar) and temporal course of single synapse activity in the presence of BAPTA-containing pipette (bottom). (C) Average success rate values from different experiments (n = 10 synapses). (D) Relative changes of synaptic parameters relative to basal before (black) and after placing BAPTA-containing pipette (gray bars; n = 10). Note that absence of synaptic effects after buffering Ca2+ into astrocytes were not caused by the leakage of BAPTA in extracellular space and buffering Ca2+, thus reducing transmitter release, because the presence of the BAPTA-containing patch pipette for 30 min in slices did not affect synaptic parameters (Synaptic efficacy, p=0.887; Success rate, p=0.938; Synaptic potency, p=0.923). Error bars indicate SEM.
Figure 4

Interneuron-induced synaptic potentiation requires astrocytic GABAB receptor and presynaptic mGluR activation.
(A) Synaptic responses evoked by minimal stimulation (15 consecutive stimuli; top) and averaged EPSCs (bottom) before and after evoking bursts of interneuron APs in presence of AM251 (orange), MPEP+LY367385 (magenta), and AP5 (Blue). (B) Relative changes of synaptic parameters induced by bursts of interneuron APs before (open bars) and after (filled bars) receptor antagonist application (n ≥ 5 neurons for each bar). *p<0.05; paired t test. (C) Astrocyte Ca2+ transient probability index after evoking bursts of interneuron APs, before (open bars) and after (filled bars) receptor antagonist application (n ≥ 5 slices for each bar). (D) Scheme of the proposed mechanisms for GABAA mediated synaptic inhibition and GABAB-mGluR group I induced synaptic potentiation, respectively.
Figure 5 with 2 supplements

Effects of dynamic interplay between interneuron and astrocyte activity on excitatory synaptic transmission.
(A) Left, averaged relative success rate of up-EPSCs and down-EPSCs over time evoked by a stimulation paradigm (inset) consisting of SC stimuli at 6 Hz and bursts of interneuron APs elicited by 90 depolarizing pulses (166 ms delivered at 3 Hz for 30 s), in control (black; n = 13), picrotoxin (PTX, red; n = 11), CGP55845 (blue; n = 11), and MPEP+LY (magenta; n = 8). Note that SC stimuli were phase-locked at the interneuron depolarization (up-EPSC) or resting level (down-EPSC). Each point represents the simple moving average of 15 consecutive EPSCs (note the corresponding initial gap at interneuron stimulation). Horizontal bars indicate the time of pairing. Right, expanded view of gray-shaded areas. (B) Relative changes of synaptic parameters relative to basal of up-EPSCs (closed bars) and down-EPSCs (open bars) in control and after receptor antagonist application (PTX + CGP55845; n = 9). See also Figure 5—figure supplements 1 and 2. *p<0.05, **P<0.01, #p<0.001; paired t test.
Figure 5—figure supplement 1
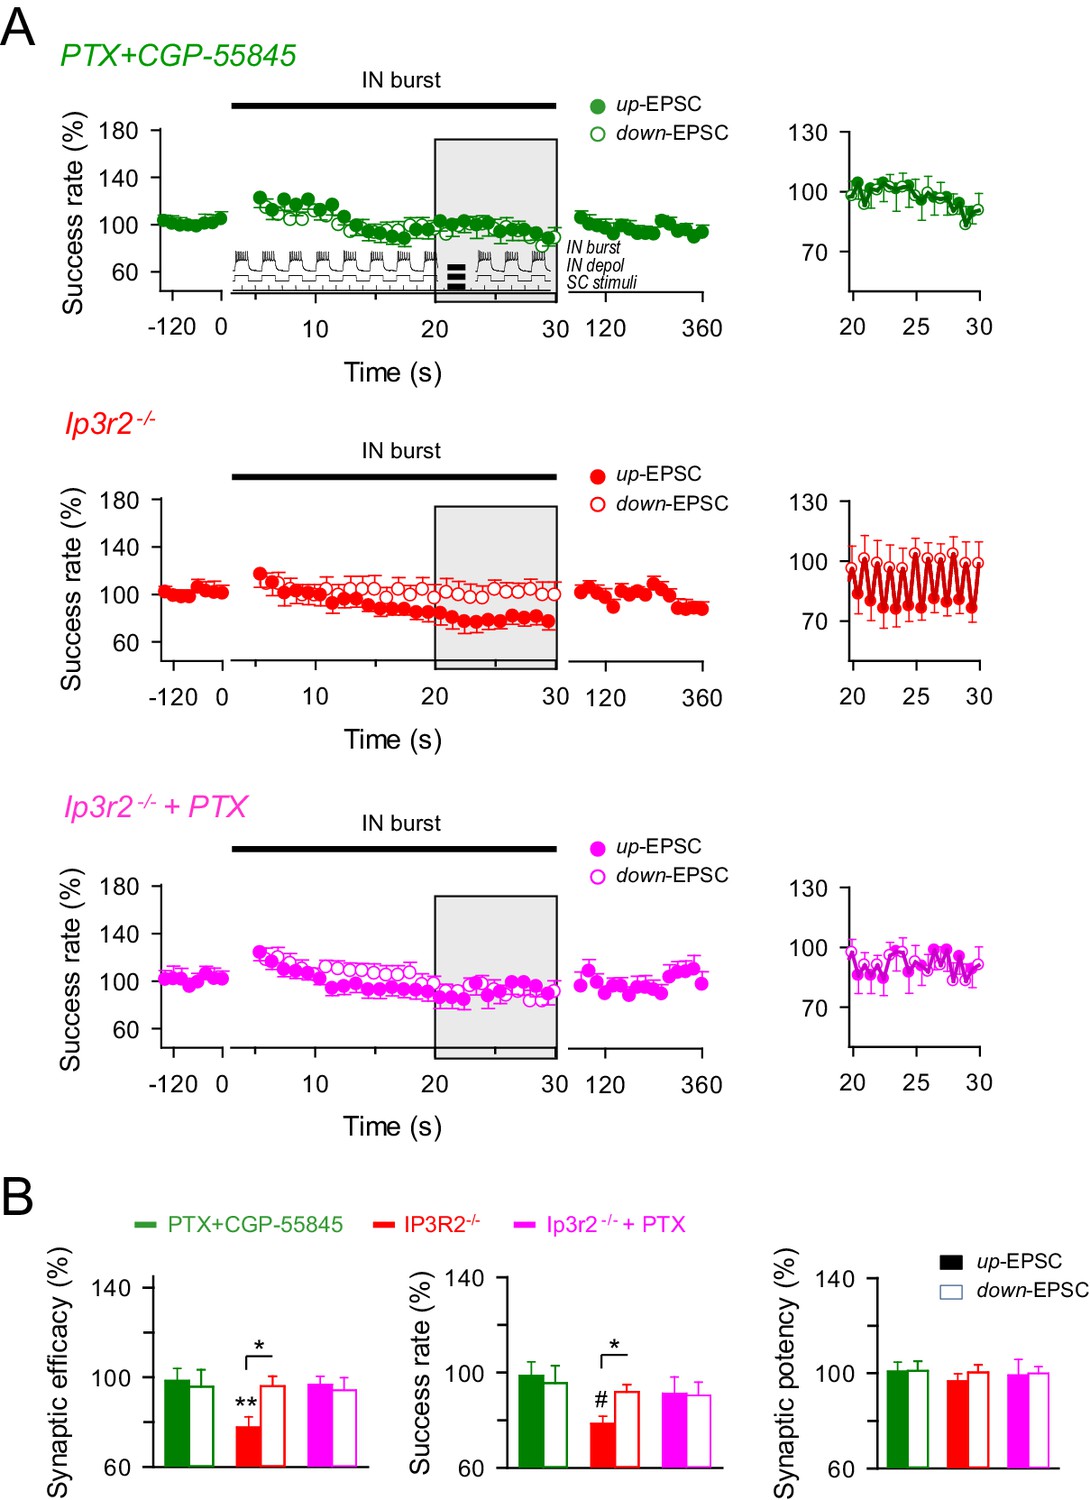
GABAA and GABAB interplay in the astrocyte-interneuron modulation of the excitatory synaptic transmission.
(A) Left, averaged relative success rate of up-EPSCs (closed circles) and down-EPCSs (open circles) evoked by the stimulation protocol described in Figure 5 (inset) over time in wild-type mice in the presence of picrotoxin plus CGP55845 (PTX+CGP; green), and in Ip3r2-/- mice in control (red) and in the presence of picrotoxin (PTX; pink). Each point represents the simple moving average of 15 consecutive EPSCs. Horizontal bars indicate the time of pairing. Right, expanded view of gray-shaded areas. (B) Relative changes of synaptic parameters for up-EPSCs (filled bars) and down-EPSCs (open bars) in wild-type mice in the presence of picrotoxin plus CGP55845 (PTX+CGP; green; n = 9; p=0.81 (synaptic efficacy up); p=0.61 (synaptic efficacy down); paired t test), and in Ip3r2-/- mice in control (red; n = 7; p=0.004 (synaptic efficacy up); p=0.37 (synaptic efficacy down); paired t test) and in the presence of picrotoxin (pink; n = 10; p=0.46 (synaptic efficacy up); p=0.35 (synaptic efficacy down); paired t test). *p<0.05, **p<0.01, #p<0.001. Error bars indicate SEM.
Figure 5—figure supplement 2
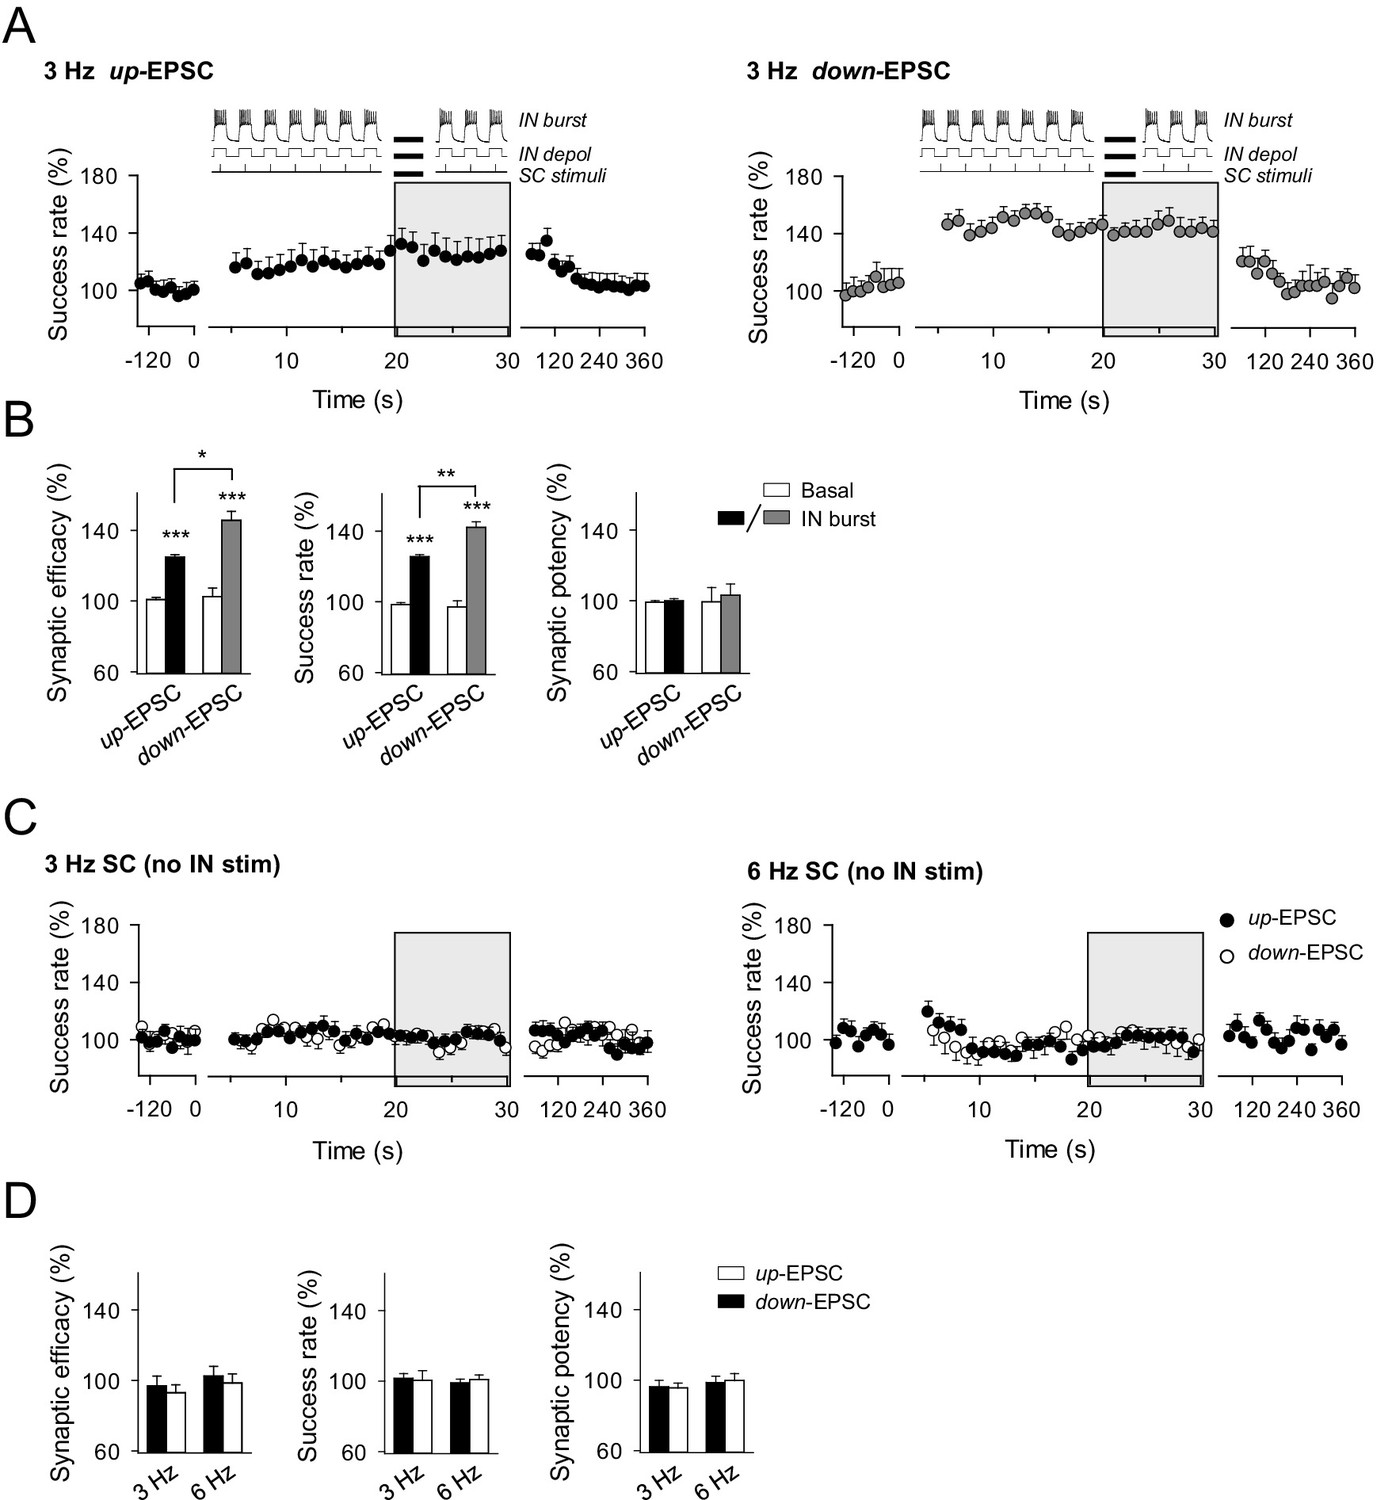
Effects of phase-locked activity between interneuron and excitatory synaptic activity.
(A) Averaged relative changes of success rate over time during a stimulation paradigm consisting of SC stimuli at 3 Hz and bursts of interneuron APs (top panel schemes, and described in Figure 5), when SC stimuli coincided with the interneuron up-state, i.e., during the interneuron bursts of APs (n = 6, left), or down-state, i.e., during the resting state between two consecutive interneuron bursts of APs (n = 5; right). (B) Relative changes of synaptic parameters for conditions shown in A. Synaptic efficacy up: p<0.001; paired t test. Synaptic efficacy down: p<0.001; paired t test. Synaptic efficacy up vs down: p=0.016; unpaired t test. (C) Relative changes of success rate over time for up-EPSCs and down-EPSCs, without interneuron stimulation, evoked by SC stimulation at 3 Hz (n = 8) and 6 Hz (n = 11). (D) Relative values of synaptic parameters in the absence of interneuron stimulation. SC stimulation 3 Hz (n = 8; p>0.05; paired t test) and 6 Hz (n = 11; p>0.05; paired t test). *p<0.05, **p<0.01, ***p<0.001. Error bars indicate SEM.
Figure 6
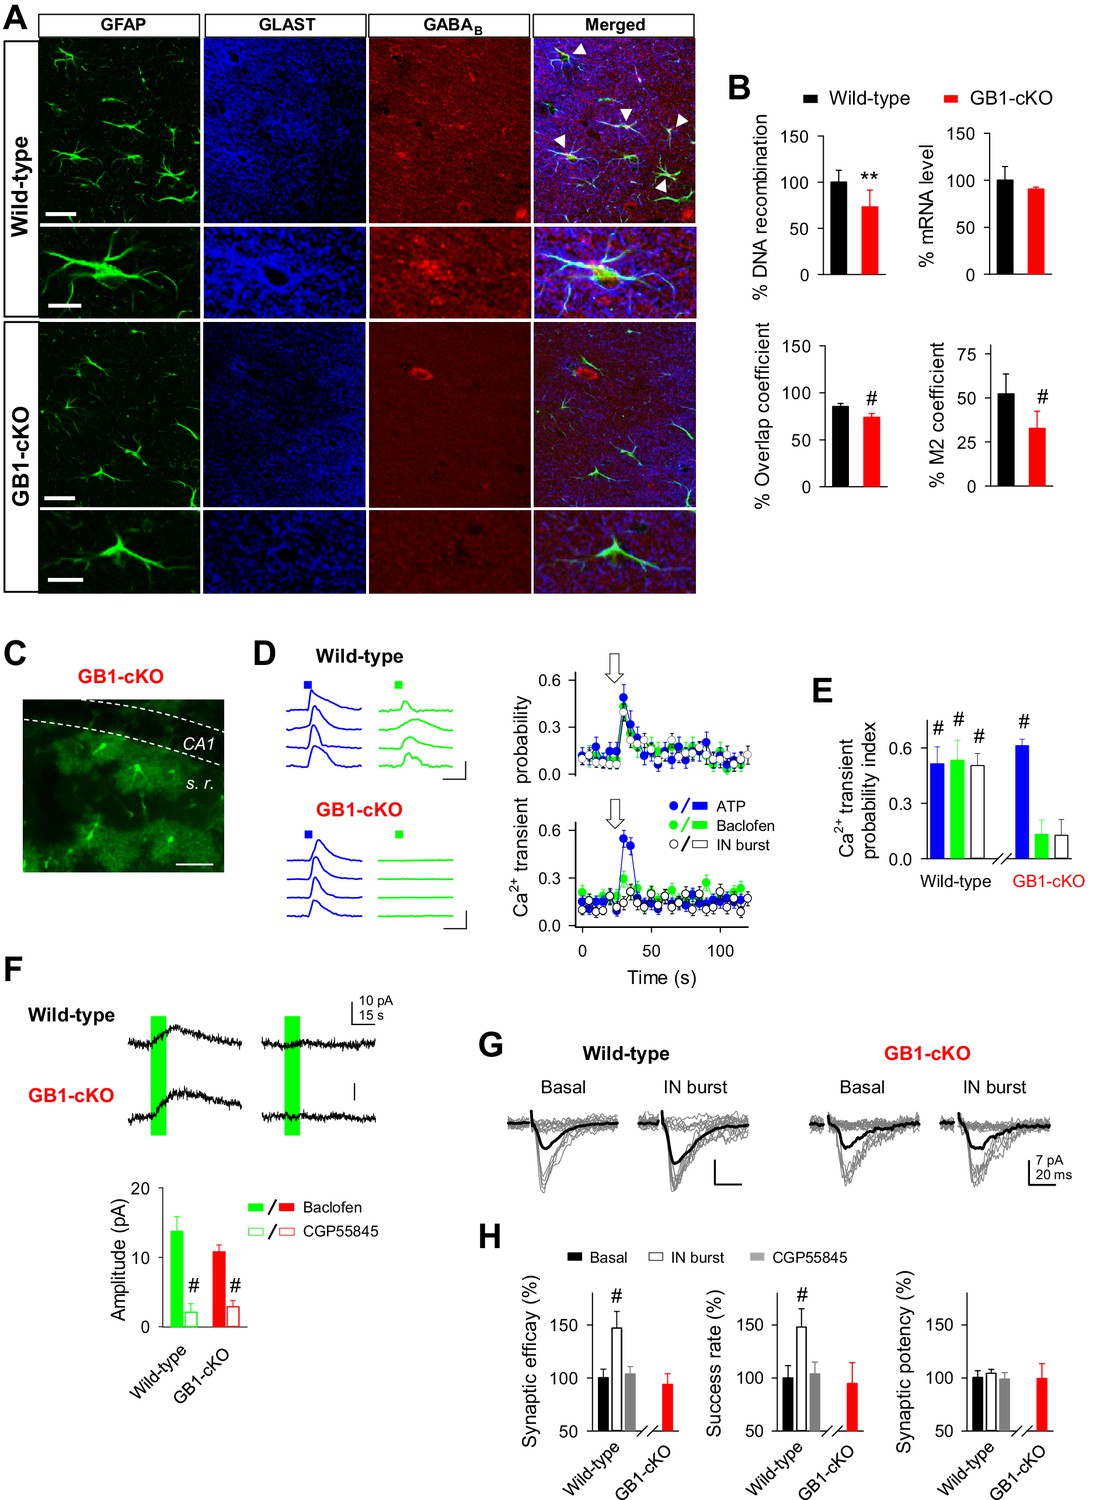
GABAB receptor knockout in astroglial cells (GB1-cKO mice) impairs interneuron-mediated synaptic potentiation.
(A) Confocal laser-scanning micrographs of hippocampal sections from wild-type (top row) and GB1-cKO (GLAST-CreERT2xGABBR1fl/fl; bottom row) wildtype mice immunostained for the glial fibrillary acidic protein GFAP, astroglial glutamate transporter GLAST, and the GABAB receptor GABBR1. Please note the white arrow heads in wild-type that point towards co-localization of the GABAB receptor on astroglial GFAP-positive structures. In contrast, such locations of co-localization are largely missing in the GB1-cKO mice. Scale bars, 30 µm; inset, 15 µm. (B) Top left, qRT-PCR of hippocampal genomic DNA reveals a reduction of the Gabbr1fl/fl alleles by 28.5% (p=0.003; unpaired t test), representing the percentage of astrocytes in the hippocampus. Top right, quantification of Gabbr1 mRNA levels by qRT-PCR does not show a reduction of the Gabbr1 message (p=0.25; unpaired t test), as expected by the high levels of neuronal versus glial expression. Quantification of the immunolabels for Glast and Gabbr1 were determined by the ImageJ plugin JACoP v.2 by calculating the overlap (p<0.001; unpaired t test; bottom left) and Mander’s M2 coefficients (p<0.001; unpaired t test; bottom right), both indicate a significant reduction of astroglial Gabbr1 expression (9 sections from 2 GB1-cKO and 11 sections from two control mice). (C) Confocal image from CA1 region of GB1-cKO mice showing the endogenous expression of GCaMP3 in astrocytes lacking Gabbr1 (in green). Scale bar, 60 µm. (D) Intracellular Ca2+ signals induced by local agonist application of ATP (blue) and baclofen (green) from four representative astrocytes in wild-type and GB1-cKO mice, and astrocyte Ca2+ transient probability over time induced by agonist stimulation or after evoking bursts of interneuron APs (white). Arrow, green and blue squares denote ATP, baclofen, or interneuron stimulation. Scale bar, 100%, 15 s. (E) Ca2+ transient probability index after astrocyte stimulation in wild-type (n = 35 astrocytes from seven slices; p<0.001; Wilcoxon rank-sum test) and GB1-cKO mice. GB1-cKO astrocytes failed to increase intracellular Ca2+ in response to baclofen (n = 88 astrocytes from eight slices; p=0.12; Wilcoxon rank-sum test), and IN stimulation (n = 71 astrocytes from eight slices; p=0.14; Wilcoxon rank-sum test), but were activated by ATP (n = 82 astrocytes from eight slices; p<0.001; Wilcoxon rank-sum test). (F) Baclofen-evoked currents in CA1 pyramidal neurons from wild-type and GB1-cKO mice before and after CGP55845 application (Wild-type: from 13.73 ± 2.12 to 2.09 ± 1.22 pA, before and after CGP55845; n = 7; paired t test; p<0.001; GB1-cKO: 10.76 ± 1.0 to 2.85 ± 0.89 pA; before and after CGP55845; n = 8; p<0.001). (G) Synaptic responses evoked by minimal stimulation (15 consecutive stimuli; gray traces), and averaged EPSCs (50 consecutive stimuli; black traces) before and after evoking bursts of interneuron APs in wild-type and GB1-cKO mice. (H) Relative changes of synaptic parameters from basal (black bars) induced by bursts of interneuron APs (white bars; n = 5; p<0.001; paired t test), and after CGP55845 application (n = 3; p=0.38; paired t test) in wild-type and GB1-cKO mice (n = 4; p=0.38; paired t test). **p<0.01; # p<0.001.
Figure 7 with 1 supplement

Astrocyte GABAB receptors participate in hippocampal theta and gamma oscillations in vivo.
(A) Schematic illustration of the hippocampal recording configuration and whisker stimulation in anesthetized mice. (B) Representative LFP recordings and corresponding analysis of theta-phase and gamma-amplitude relation for control littermate (left) and GB1-cKO (right) mice. The raw signals (black) were high-pass filtered (1st row; grey and red, respectively) and then computed to extract the theta phase (second row) and gamma envelope (third row; grey and red, respectively) for control and GB1-cKO mice. (C) Normalized LFP power spectrum analysis for theta (4–8 Hz) and gamma frequencies (30–50 Hz, low gamma; 70–90 Hz, high gamma) in control littermate (n = 6) and GB1-cKO mice (n = 6) after whisker stimulation. Inset, Relative power changes for GB1-cKO and control littermate mice (theta band, p=0.007; unpaired t test; low gamma, p=0.042; Wilcoxon rank-sum test; and high gamma oscillations, p=0.738; Wilcoxon rank-sum test). (D) Gamma-amplitude modulation by theta-phase for wild-type (left) and GB1-cKO mice (right), before (control) and after whisker stimulation (post stim). Note the enhancement of theta-gamma coupling in wild-type after stimulus that does not appeared in GB1-cKO mice. (E) Normalized Phase-Lock Value (PLV), either in control and after stimulation for wild-type (p=0.017; paired t test), and GB1-cKO mice (p=0.62; paired t test). See also Figure 7—figure supplement 1. *p<.05; **p<0.01. .
Figure 7—figure supplement 1
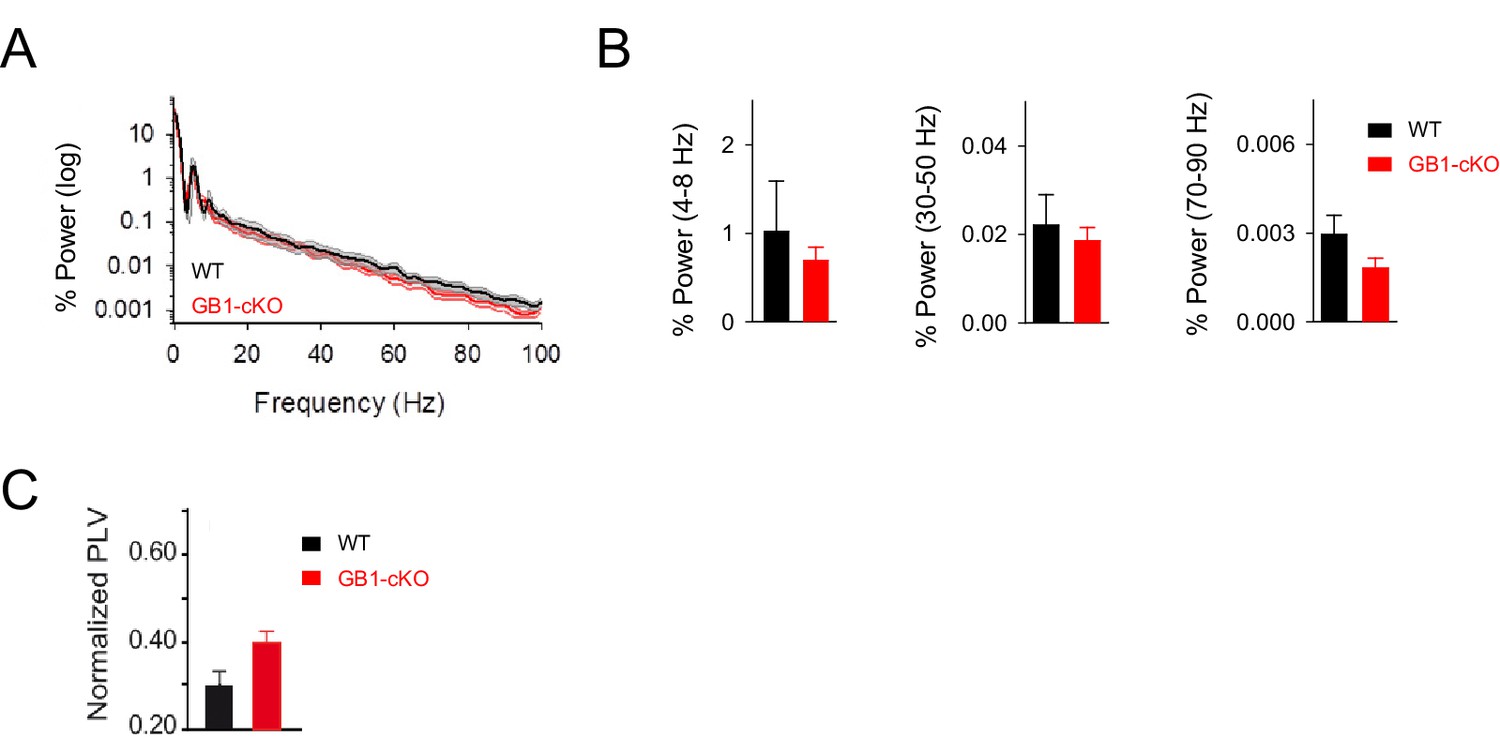
Resting activity in GB1-cKO and control littermate mice.
(A) Normalized power spectrum analysis of the LFP recordings in hippocampal CA1 region in GB1-cKO (red, n = 6) and control littermate mice (black, n = 6) in unstimulated conditions. (B) Relative changes of power at different oscillation frequencies for GB1-cKO and control littermate mice. No significant differences in network activity were observed in resting conditions between those mice. Theta band, p=0.485; unpaired t-test. Low gamma p=0.937; Wilcoxon rank-sum test. High gamma oscillations, p=0.158; Wilcoxon rank-sum test. (C) PVL index in resting conditions for GB1-cKO and control littermate mice did not show significant changes (PVL = 0.30 ± 0.03 and 0.39 ± 0.03 for control and GB1-cKO; n = 24 and 36 epochs, respectively; p=0.06; unpaired t test). Error bars indicate SEM.
Download links
A two-part list of links to download the article, or parts of the article, in various formats.
Downloads (link to download the article as PDF)
Open citations (links to open the citations from this article in various online reference manager services)
Cite this article (links to download the citations from this article in formats compatible with various reference manager tools)
Activity-dependent switch of GABAergic inhibition into glutamatergic excitation in astrocyte-neuron networks
eLife 5:e20362.
https://doi.org/10.7554/eLife.20362


