Differential methylation between ethnic sub-groups reflects the effect of genetic ancestry and environmental exposures
- University of California, United States
- University of California, San Francisco, United States
- Stanford University, United States
- Hospital Universitario Nuestra Señora de Candelaria, Spain
- Instituto de Salud Carlos III, Spain
- Baylor College of Medicine and Texas Children’s Hospital, Texas
- Feinberg School of Medicine, Northwestern University, Illinois
- Kaiser Permanente-Vallejo Medical Center, United States
- Bay Area Pediatrics, United States
- Children’s Hospital and Research Center, United States
- Jacobi Medical Center, United States
- Veterans Caribbean Health System, United States
- The Ann and Robert H Lurie Children’s Hospital of Chicago, United States
- Centro de Neumología Pediátrica, United States
- National Jewish Health, United States
- University of New York, United States
Figures
Figure 1
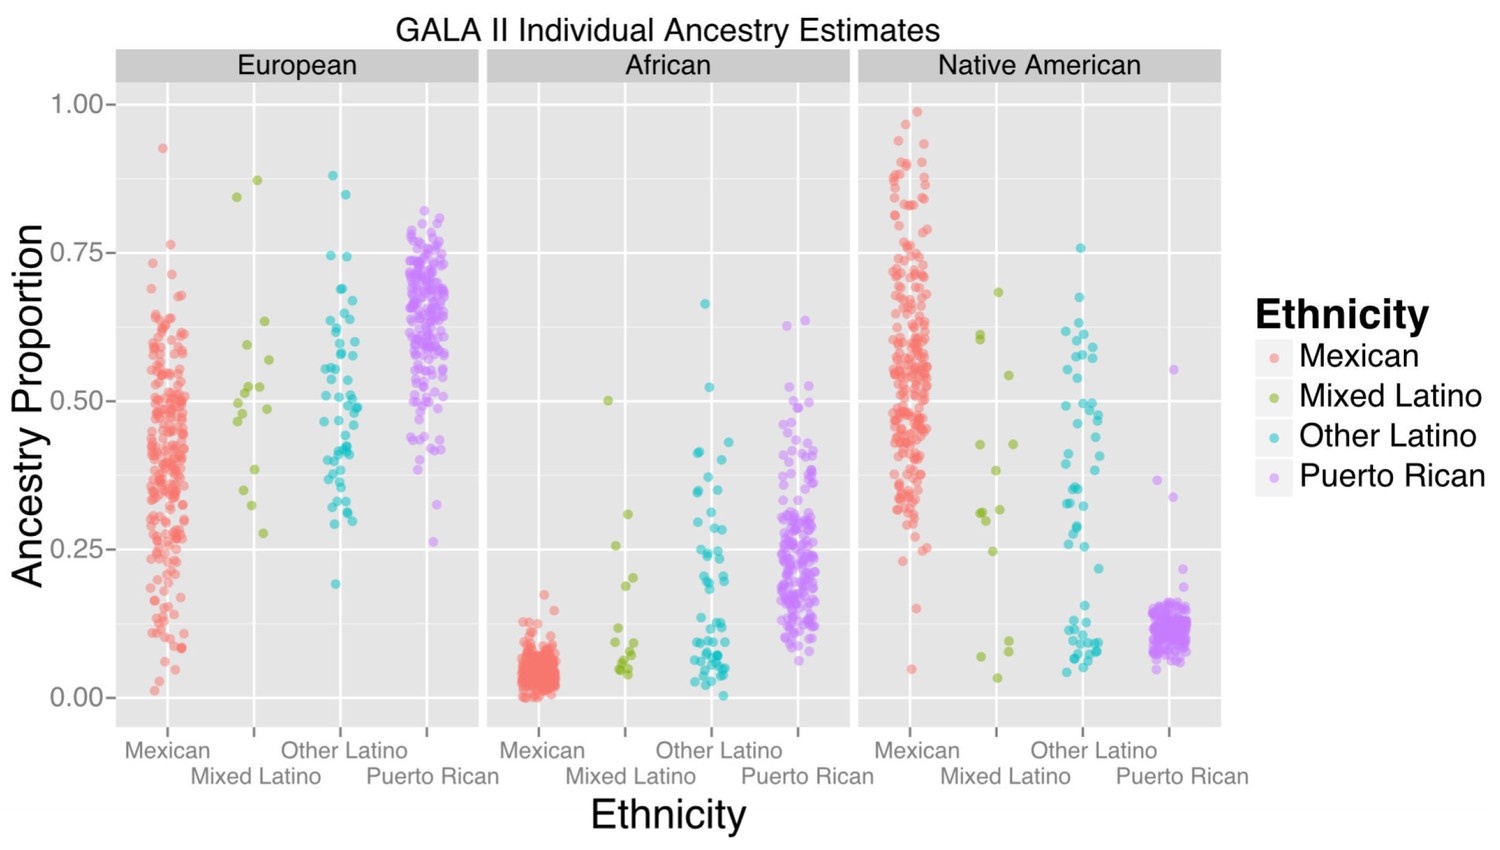
Ancestry estimates for GALA II participants, by ethnic group.
Mexicans, on average, had a greater proportion of Native American ancestry than Puerto Ricans; Puerto Ricans had a greater proportion of European and African ancestry. Mixed and other Latinos were intermediate.
Figure 2
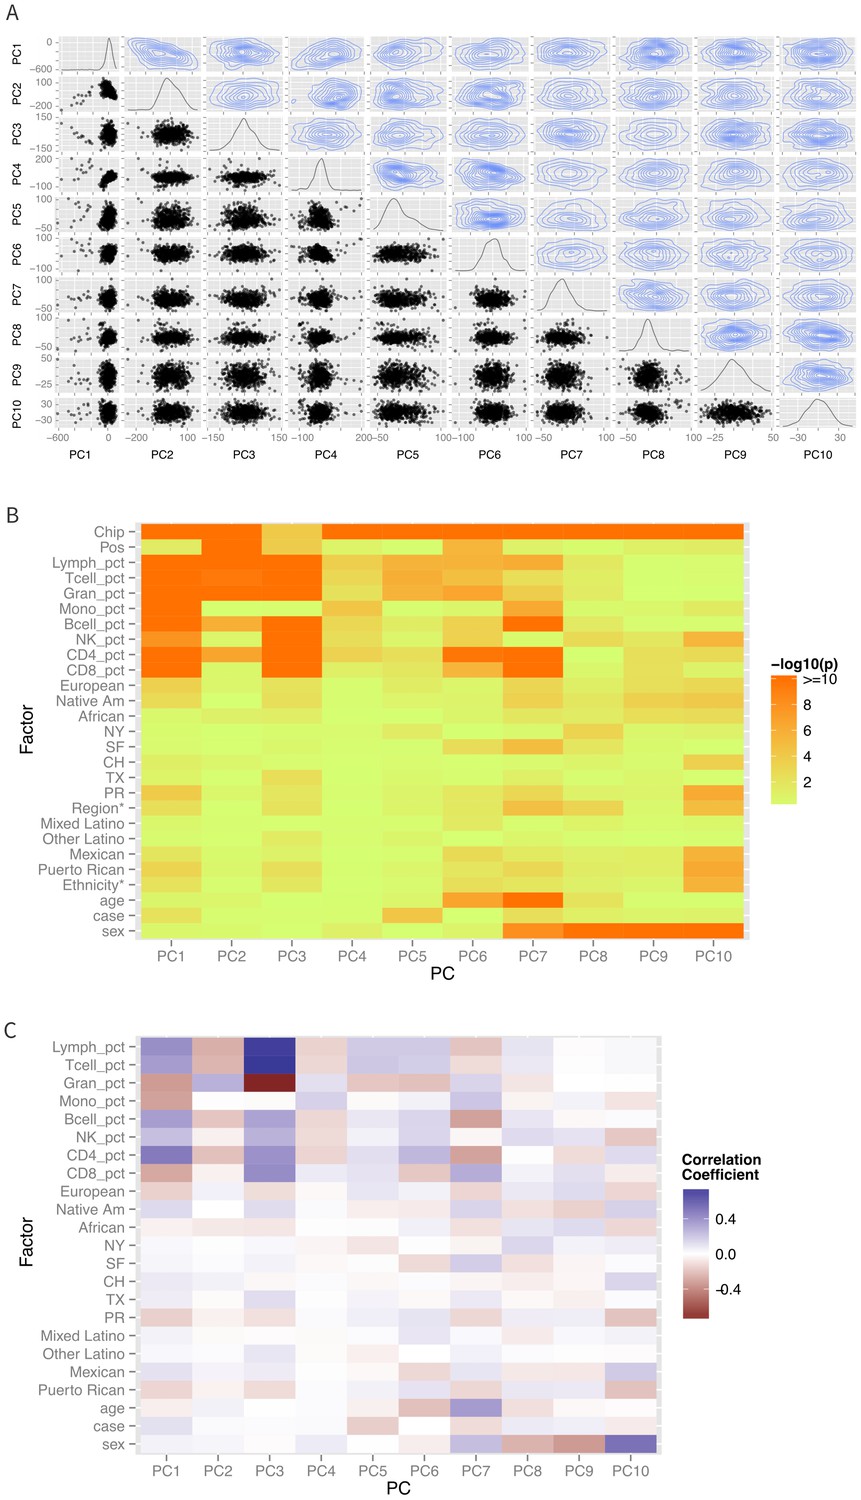
Patterns of global methylation.
(A) Distribution of the first 10 principal coordinates of the methylation data. Plots in the diagonal show the univariate distribution; those in the lower left triangle show bivariate relationship between each pair of PCs, while those in the upper right show the bivariate density. (B) Bivariate or ANOVA associations between principal coordinates and technical factors (chip, position), cell counts, genetic ancestry (European, Native American, African), recruitment site (New York, NY, San Francisco, CA, Chicago, IL, Houston, TX, and Puerto Rico), demographic factors (ethnicity, age, sex), and case status. (C) Correlation coefficients between the various factors and principal coordinates.
Figure 3
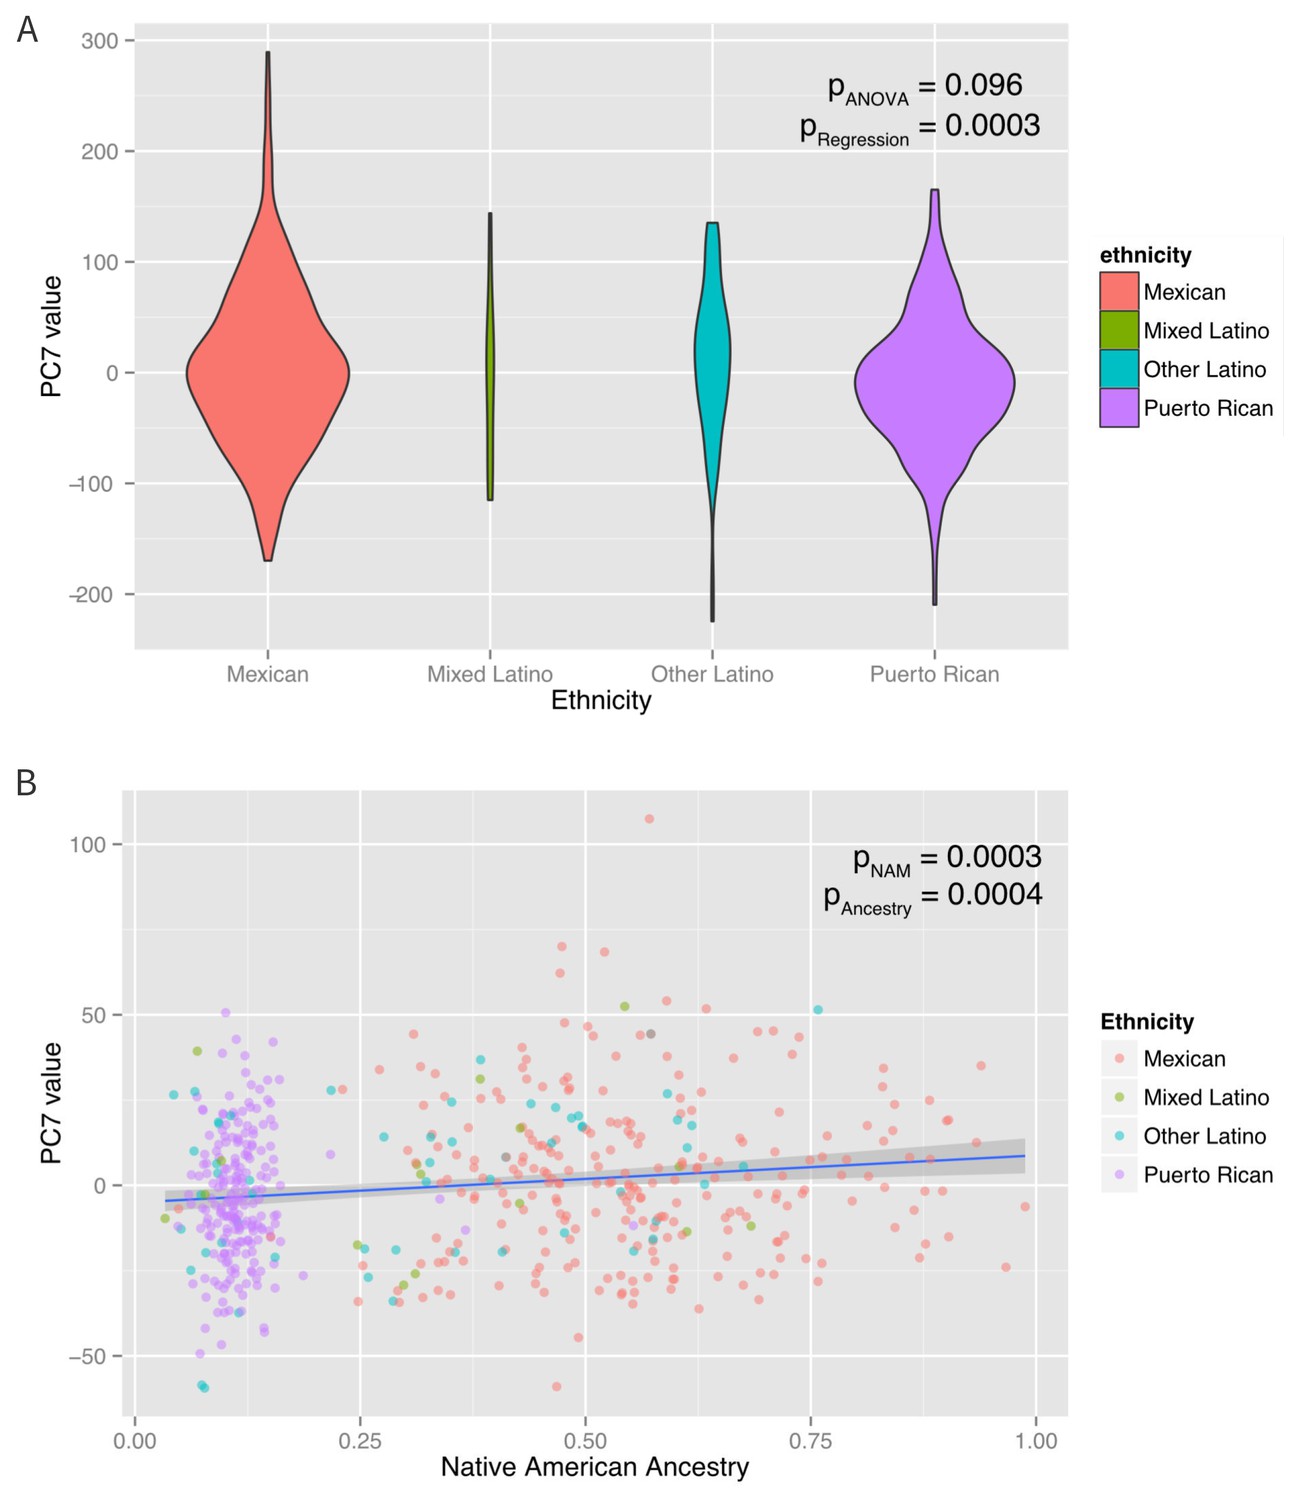
Associations between ethnicity, ancestry and global methylation.
(A) Association between ethnicity and principal coordinate 7. (B) Association between Native American ancestry proportion and PC7, colored by ethnicity. Native American ancestry explains approximately 81% of the association between PC7 and ethnicity.
Figure 4
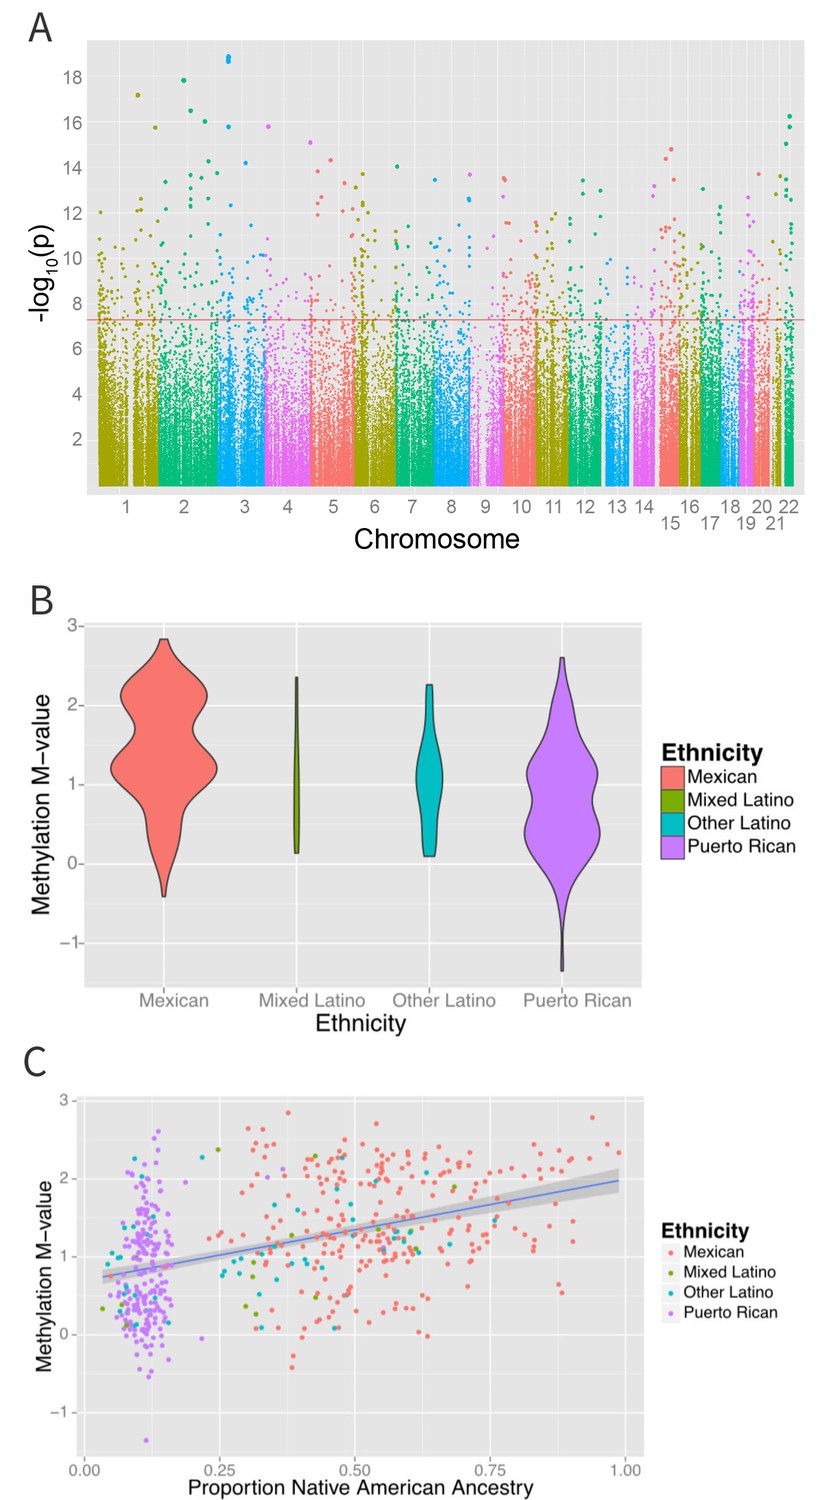
Associations between ethnicity and methylation (A) Manhattan plot showing the associations between ethnicity and methylation at individual CpG loci.
(B) Violin plot showing one such locus, cg19145607. Mexicans are relatively hypermethylated compared to Puerto Ricans (p=1.4×10⁻¹⁹). (C) Plot showing the association between Native American ancestry at the locus and methylation levels at the locus colored by ethnicity; Native American ancestry accounts for 58% of the association between ethnicity and methylation at the locus.
Figure 5
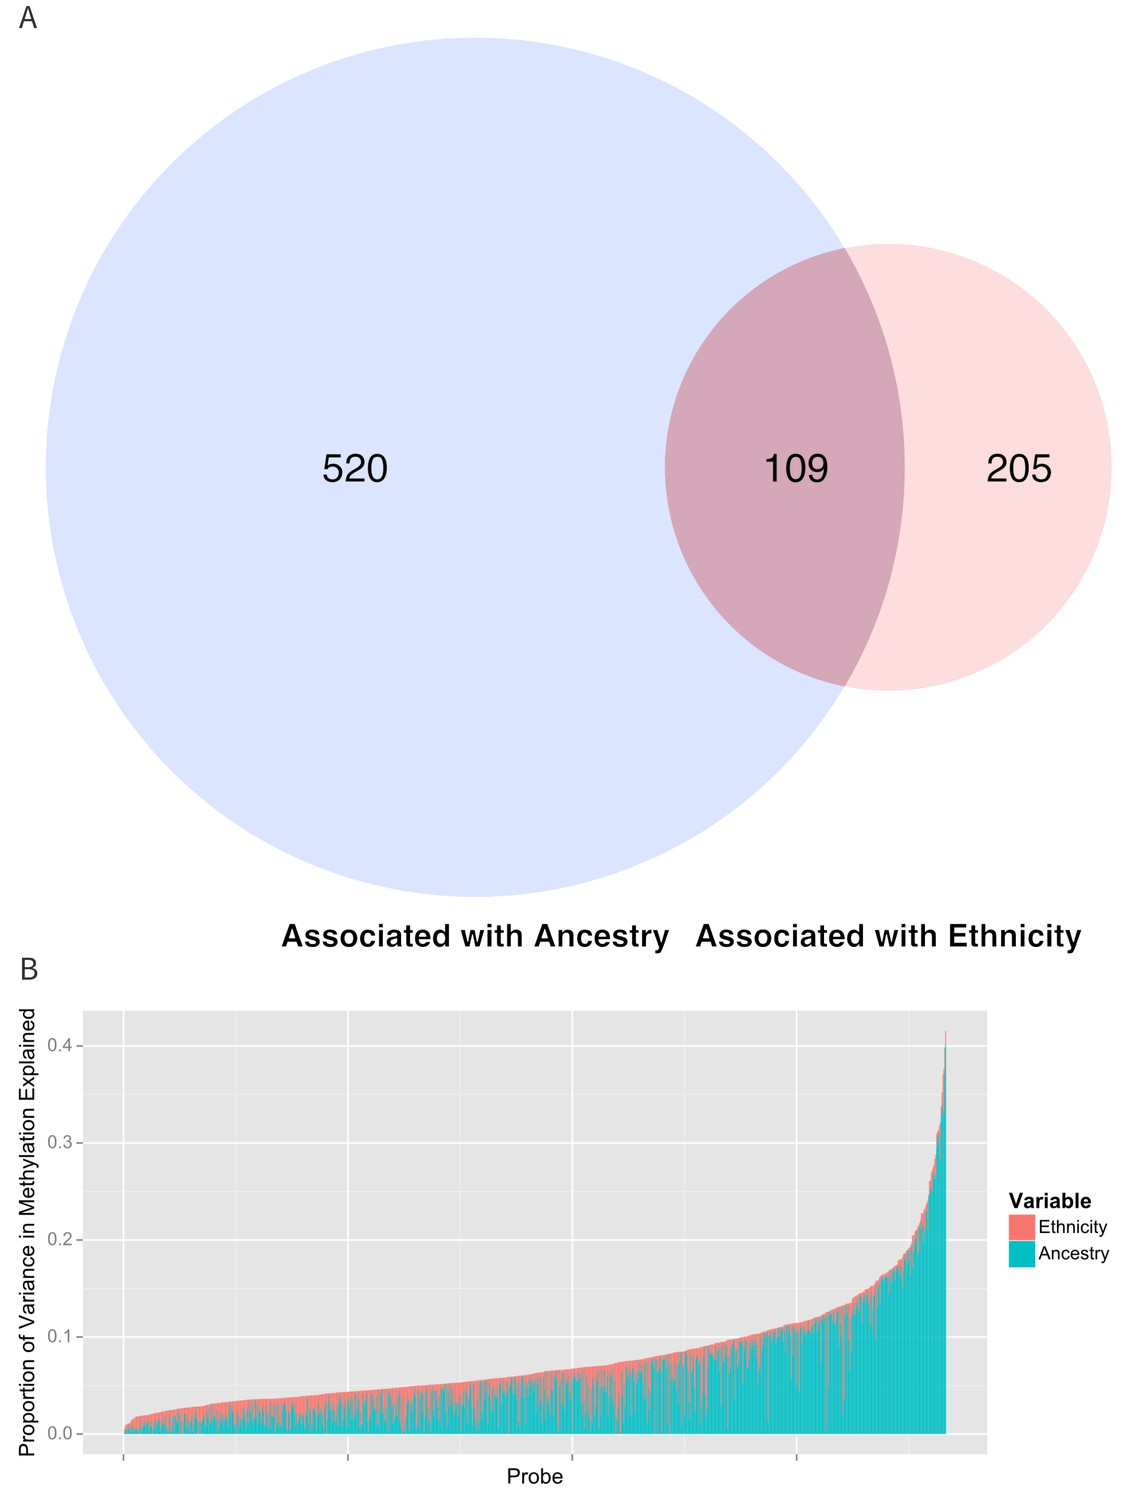
Relationship between genomic ancestry and the association between ethnicity and methylation.
(A) Venn diagram showing the effect of adjustment for ancestry on the association between ethnicity and methylation. The components of the diagram represent the number of CpG’s that remained associated with ethnicity after adjustment for ancestry and the number of CpG’s that were associated with ancestry. (B) Relative proportion of variance in methylation explained by ethnicity and genomic ancestry across loci significantly associated with ethnicity. Mediation analysis of associations between ethnicity and methylation M-values for (C) Native American ancestry and (D) African ancestry. For simplicity, only significant mediation effects are shown.
Figure 6
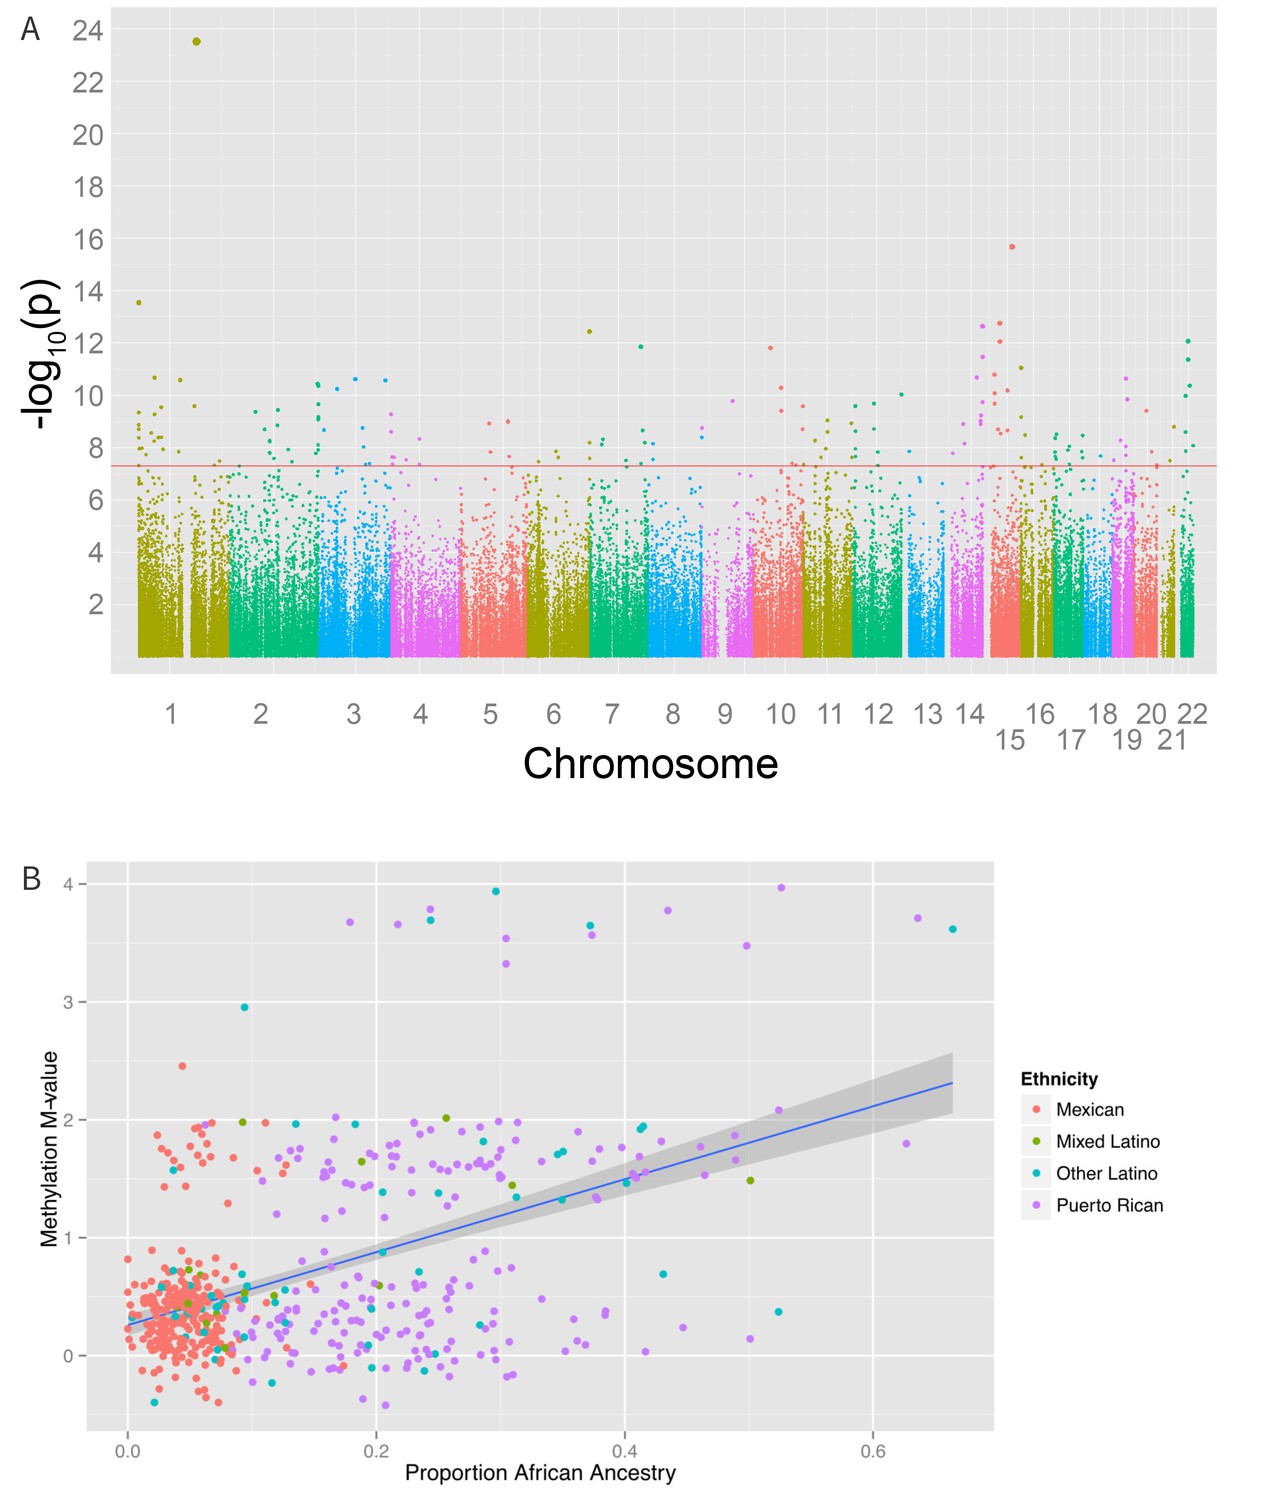
Associations between genomic ancestry and individual methylation loci.
(A) Manhattan plot showing the associations between genomic ancestry and methylation at individual CpG loci. (B) Plot showing one such locus, cg04922029, and genomic African ancestry, showing a strong correlation between African ancestry and hypermethylation at that site.
Figure 7
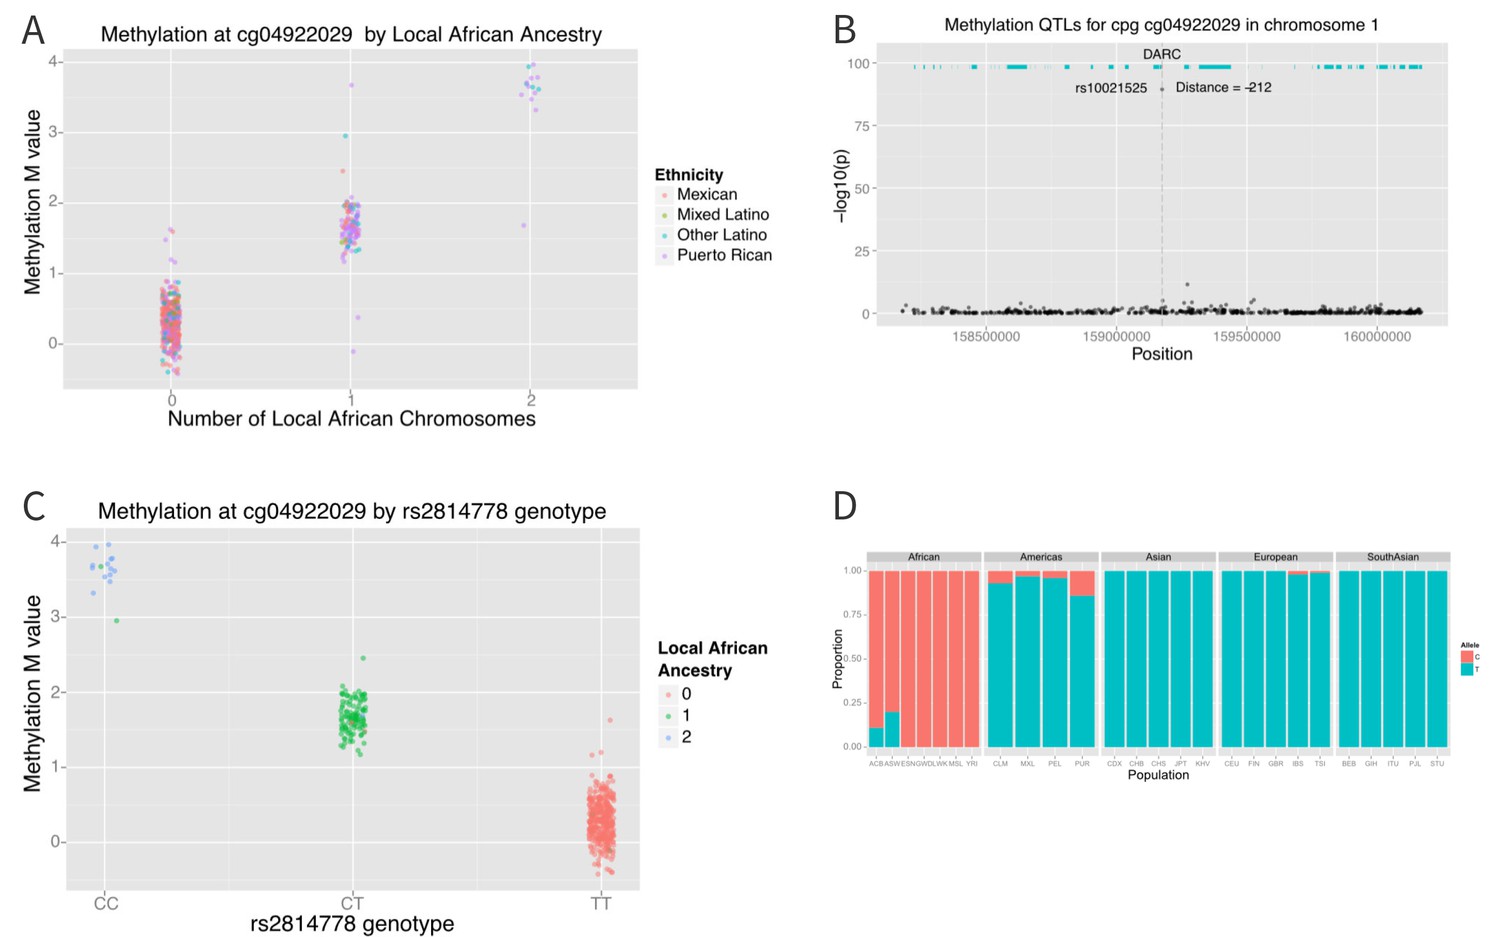
Association between local ancestry and methylation.
(A) Association between cg04922029 on the DARC locus and African ancestry, color coded by ethnic group. There is near perfect correlation between the two. (B) Association between SNPs located within 1 Mb of cg04922029 and methylation levels at that CpG. (C) Association between rs2814778 (Duffy null) genotype and methylation at cg04922029, color coded by the number of African alleles present. There is near perfect correlation between genotype, ancestry and methylation at the locus. (D) Allele frequency of rs2814778 by 1000 Genomes population. The C allele is nearly ubiquitous in African populations and nearly absent outside of African populations and their descendants.
Figure 8
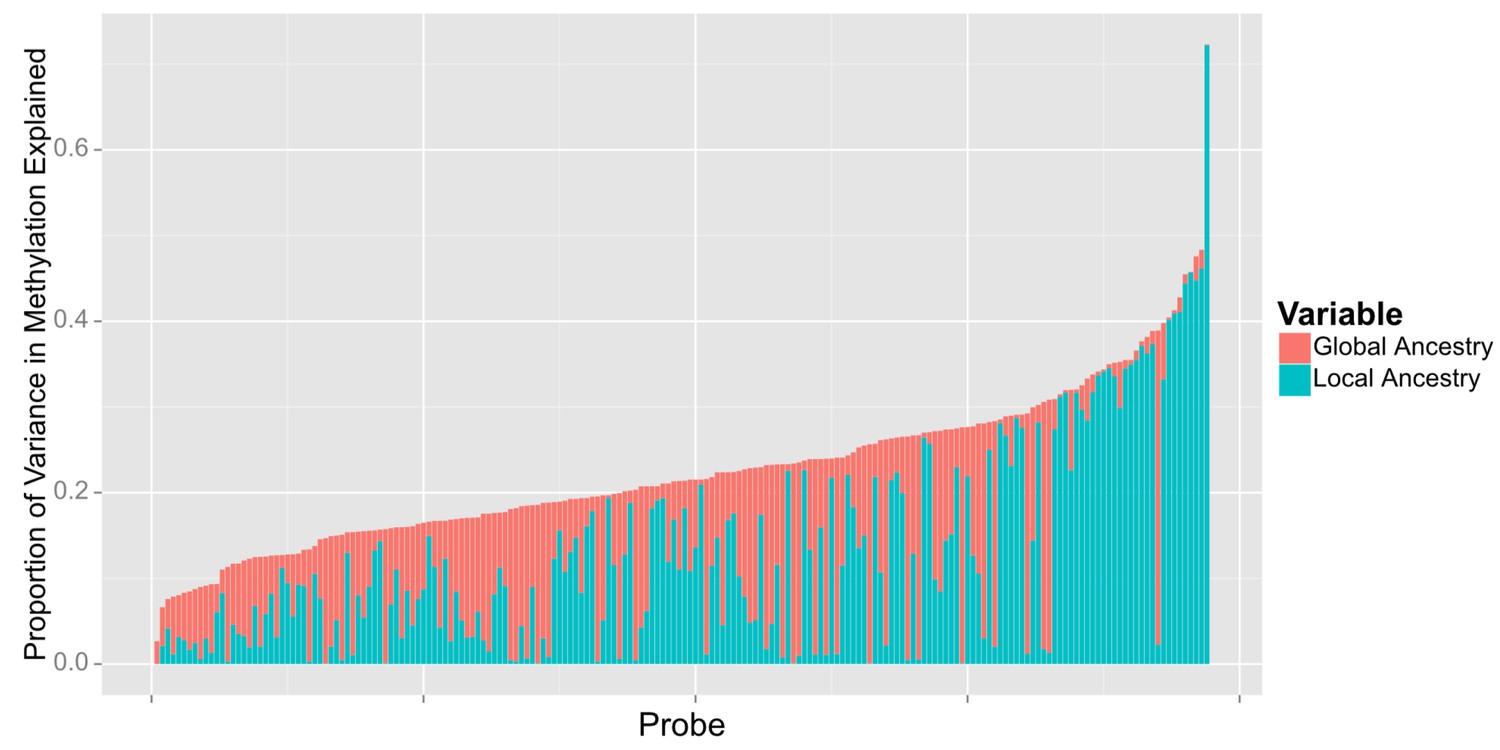
Relative proportion of variance in methylation explained by global and local ancestry across loci significantly associated with global ancestry.
https://doi.org/10.7554/eLife.20532.012Tables
Table 1
Baseline characteristics of GALA II participants with methylation data, stratified by ethnicity. Continuous variables are reported with inter-quartile range in brackets.
Mexican | Puerto rican | Mixed latino | Other latino | |
|---|---|---|---|---|
n | 276 | 220 | 16 | 61 |
Males (%) | 125 (45.3%) | 127 (57.7%) | 6 (37.5%) | 28 (45.9%) |
Age | 11.4 [9.3: 14.7] | 12.3 [10.4: 14.2] | 11.8 [10.7: 14.9] | 11.8 [10: 15.7] |
Asthma cases (%) | 124 (44.9%) | 147 (66.8%) | 9 (56.3%) | 31 (50.8%) |
Ancestry (n = 524) | ||||
African | 4.3% [2.9%: 6.0%) | 22.8% [16.6%: 29.4%) | 8.5% [5.6%: 19.2%) | 12.3% [6.3%: 25.8%) |
Native American | 55.4% [44.5%: 65.7%) | 11.2% [9.8%: 13%) | 31.5% [20.9%: 45.6%) | 32.8% [10.4%: 49.3%) |
European | 40.5% [29.9%: 50.2%) | 65.7% [59.2%: 71%) | 50.5% [44.6%: 57.6%) | 48.9% [40%: 58.5%) |
Recruitment Site | ||||
Chicago | 140 (50.7%) | 15 (6.8%) | 11 (68.9%) | 15 (24.6%) |
New York | 18 (6.5%) | 10 (4.5%) | 1 (6.3%) | 23 (37.7%) |
Puerto Rico | 0 | 193 (87.7%) | 0 | 0 |
San Francisco | 78 (28.3%) | 0 | 2 (12.5%) | 23 (37.7%) |
Houston | 40 (14.5%) | 2 (0.9%) | 2 (12.5%) | 5 (8.2%) |
Cell Counts (estimated) | ||||
Granulo cytes | 51.2% [46.0%: 55.7%) | 51.6% [46.8%: 57%) | 51% [43.6%: 57.2%) | 49.1% [43.8%: 55.8%) |
Lympho cytes | 41.9% [36.9%: 46.6%) | 41.8% [36.9%: 46.5%) | 41.9% [36.1%: 51.6%) | 43.9% [36.8%: 49.6%) |
Mono cytes | 7.1% [5.8%: 8.3%) | 6.74% [5.74%: 8.24%) | 6.6% [5.7%: 7.6%) | 7.4% [6.2%: 8.6%) |
Table 2
Proportion of variance in methylation explained by ethnicity and ancestry. Numbers represent the median and interquartile range.
Component | All CpG’s associated with ethnicity (n = 916) | CpG’s associated with ethnicity after adjusting for ancestry (n = 314) | CpG’s whose association with ethnicity is explained by ancestry (n = 520) |
|---|---|---|---|
Joint | 6.8% (4.5% to 10%) | 6.2% (4.4% to 8.8%) | 7.8% (5.3% to 11.1%) |
Ethnicity | 1.7% (0.78% to 3.0%) | 3.5% (2.2% to 5.1%) | <1% |
Ancestry | 4.2% (1.8% to 8.3%) | 1.8% (0.8% to 4.0%) | 6.6% (4.0% to 10.2%) |
Additional files
-
Supplementary file 1
(A) Methylation principal components and ethnicity and ancestry. (B) Significant associations between ethnicity and methylation. (C) Effect of adding cubic spline ancestry terms to the association between ethnicity and methylation. (D) Effect of adding quadratic and cubic ancestry terms to the association between ethnicity and methylation. (E) Effect of adding genetic principal components 3–10 to the association between ethnicity and methylation. (F) Significant associations between ethnicity and methylation (p<1.6×10⁻⁷), and effect of adjustment for ancestry on the association of ethnicity and methylation, excluding participants of ‘Mixed Latino’ ethnicity. (G) Association of ethnicity and methylation in loci previously associated with maternal smoking during pregnancy. (H) Significant associations between ethnicity and methylation loci previously associated with environmental exposures. (I) Significant associations between global ancestry and methylation.
- https://doi.org/10.7554/eLife.20532.013
Download links
A two-part list of links to download the article, or parts of the article, in various formats.
Downloads (link to download the article as PDF)
Open citations (links to open the citations from this article in various online reference manager services)
Cite this article (links to download the citations from this article in formats compatible with various reference manager tools)
Differential methylation between ethnic sub-groups reflects the effect of genetic ancestry and environmental exposures
eLife 6:e20532.
https://doi.org/10.7554/eLife.20532


