Activity patterns of serotonin neurons underlying cognitive flexibility
- Champalimaud Centre for the Unknown, Portugal
- MIT-Portugal Program, Portugal
- Institut de Biologie de l’Ecole Normale Supérieure, Centre National de la Recherche Scientifique, UMR8197, Institut National de la Santé et de la Recherche Médicale, France
Figures
Figure 1 with 1 supplement

Inhibition of DRN 5-HT neurons causes perseverative responding.
(A) Injections of Cre-dependent hM4Di-mCherry (right) in the dorsal raphe nucleus (DRN) of SERT-Cre mice (left). (B) Trial structure of the task (top) and mean lick rate of an example session along the four trial types (bottom). (C) Reversal procedure (top) and example of adaptation in mean anticipatory licking (baseline lick rate subtracted) across trials around reversals (bottom, gray), with exponential fits to the reversed odors (red and black traces). Gray shade represents the trials of sessions after CNO injection. (D) Mean exponential fits of anticipatory licking for each group of mice after reversal. (E) Mean time constants for the groups in (D) (one-way ANOVA, F2,19 = 6.28, p=0.008 for negative reversal, F2,16 = 0.34, p=0.715 for positive reversal; multiple comparisons indicated in the figure). *p<0.05.
Figure 1—figure supplement 1
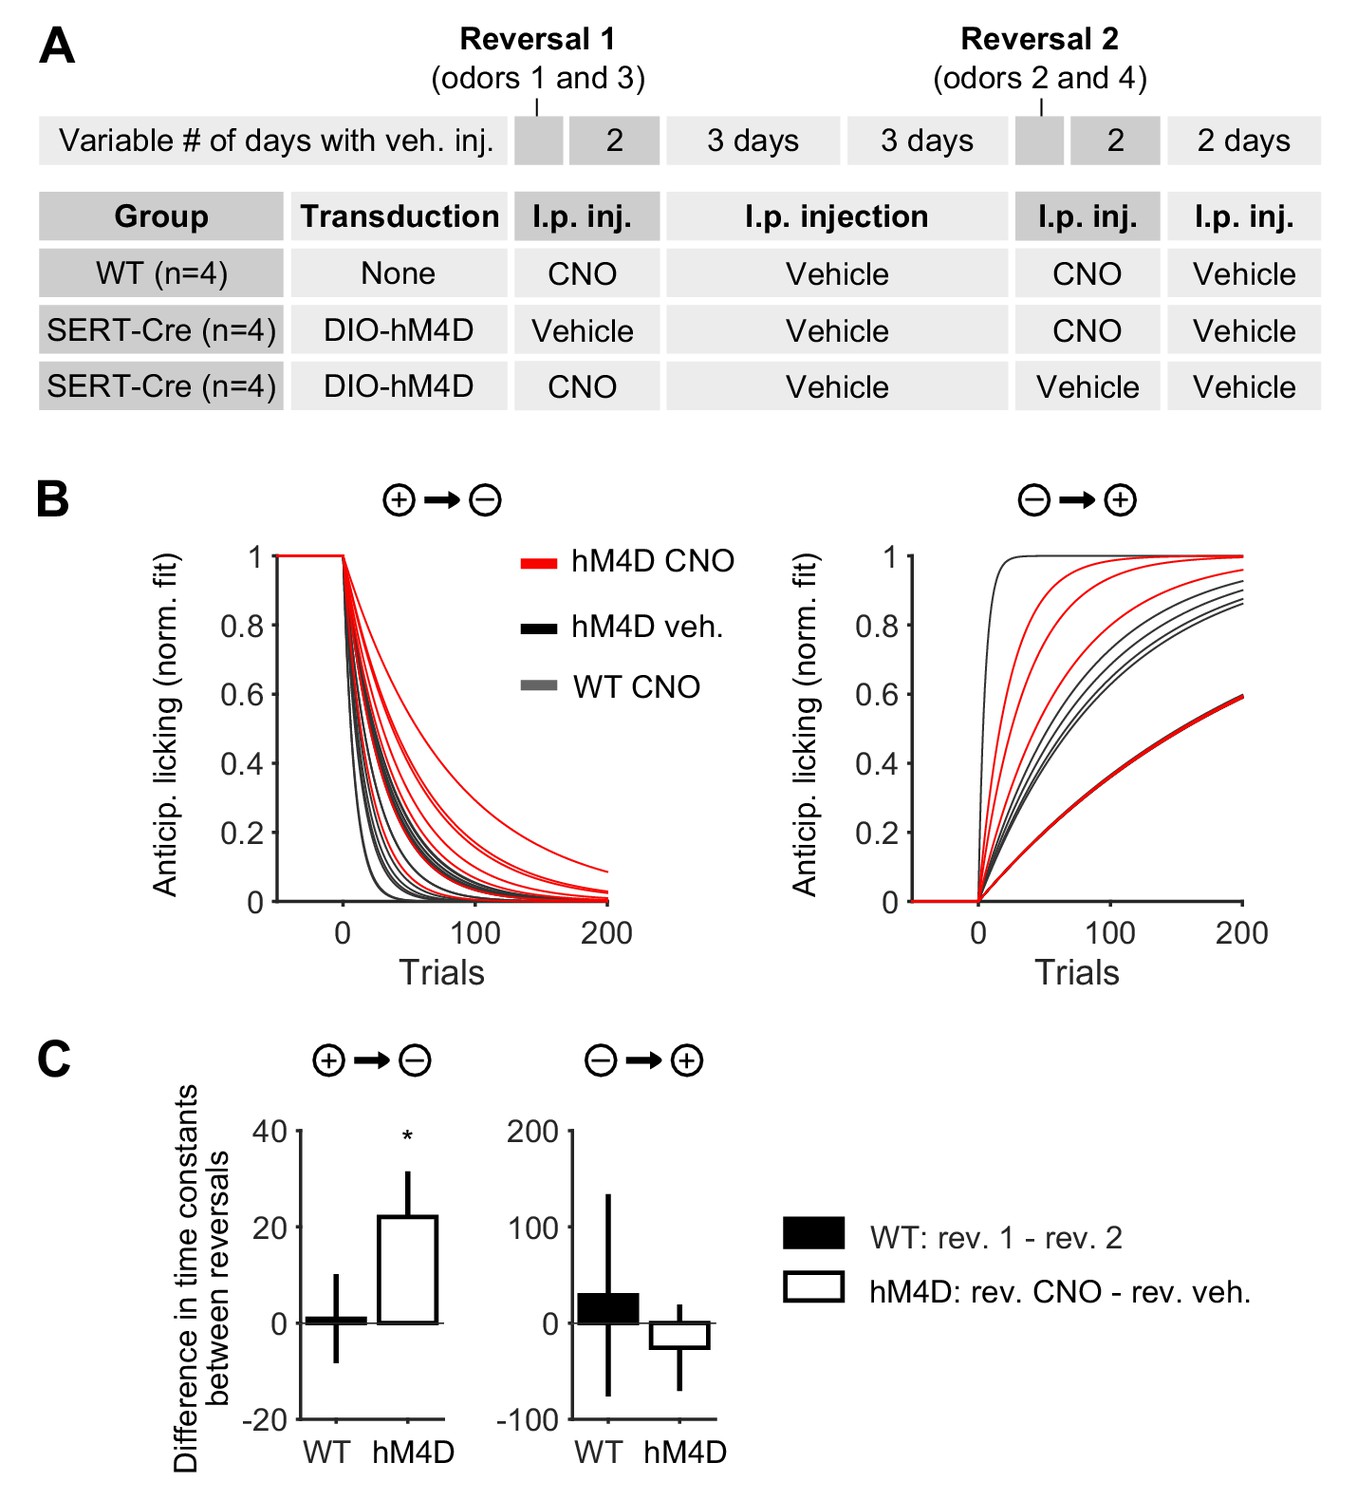
Anticipatory licking is more perseverative when DRN 5-HT neurons are inhibited.
(A) Detailed schematics of the manipulation experiment, including the viral transduction and i.p. injection received by experimental and control animals. (B) Exponential fits of anticipatory licking for individual mouse–odor pairs after the reversal (grouped as a negative or positive reversal). (C) In negative reversals (but not in positive reversals or in WT controls receiving CNO in both reversals), adaptation in anticipatory licking takes longer when experimental animals receive CNO injection, compared to when they receive vehicle (one-sample Student’s t-test). *p<0.05.
Figure 2

Behavior of head-fixed mice trained in a reversal task.
(A) Schematics of the trial structure in the classical conditioning task (before reversal) with four different outcomes. In each trial, one of four odors was randomly selected and presented for 1 s after a variable foreperiod (Forep). The associated outcome was delivered after a 2 s trace period, together with a tone (same tone for all trial types). Mice were presented with 140 to 346 interleaved trials (mean ± SD: 223 ± 30) per session (day). (B) Top: Mean lick rate of SERT-Cre mice in this task (n = 10) along the duration of each trial type. For each mouse, three sessions of the classical conditioning task where initial associations had already been learned were averaged. Bottom: Mean eye movement of SERT-Cre mice (n = 6) along the duration of each trial type. Shaded areas represent s.e.m. (C) Reversal of CS–US contingencies (negative reversal: CS 1 and 2; positive reversal: CS 3 and 4). (D) Anticipatory licking (mean of 500–2800 ms after odor onset, after subtracting the baseline) across mice for sessions around reversal, showing that the lick rate triggered by the presentation of each odor is adjusted after reversal (n = 8, two-way ANOVA with factors day (days −2 and −1 are considered together) and mouse, main effect of day: F4,2597 = 722.14, p<0.001 for odor 1, F4,2554 = 355.53, p<0.001 for odor 2, F4,2513 = 104.93, p<0.001 for odor 3, F4,2559 = 381.55, p<0.001 for odor 4). Colors follow odor identity as in (A). ***p<0.001.
Figure 3 with 5 supplements
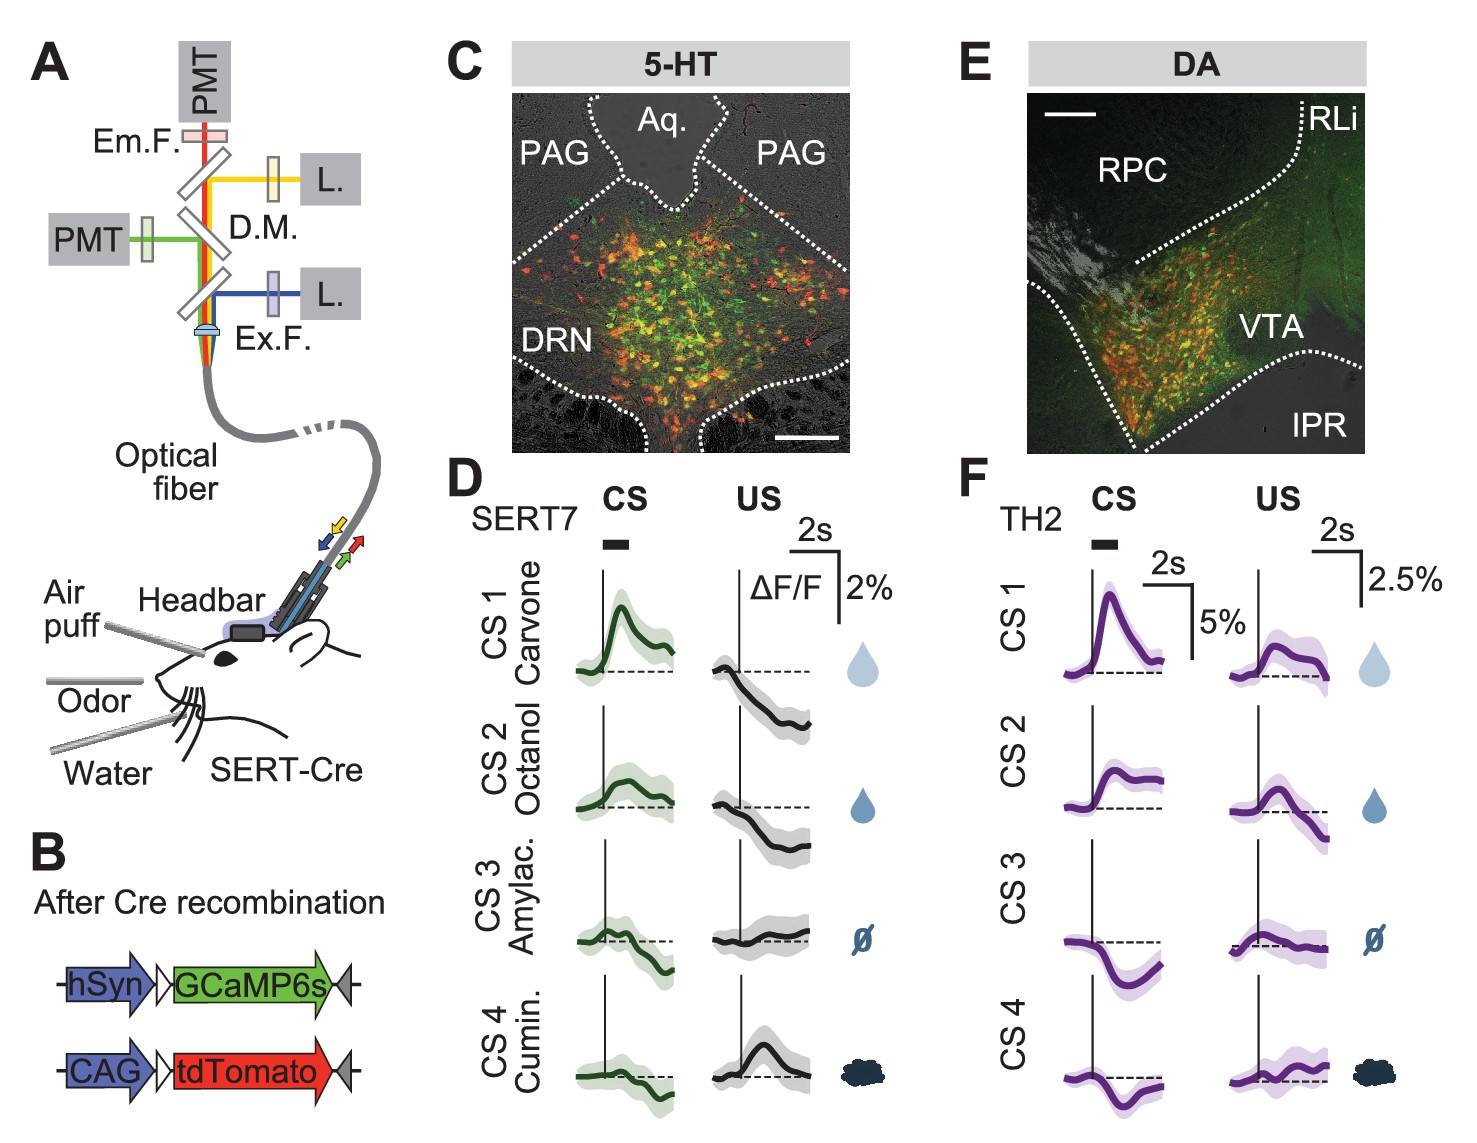
Responses of 5-HT and DA neurons before reversal.
(A) Fiber photometry with movement artifact correction in head-fixed mice. L: laser; PMT: photomultiplier tube; D.M: dichroic mirror; Ex: excitation; Em: emission; F: filter. (B) Cre-dependent fluorophores used. (C) Coronal section showing expression of GCaMP6s and tdTomato in the DRN of a SERT-Cre mouse (scale bar: 200 µm). PAG: periaqueductal gray; Aq: Aqueduct. (D) Mean responses of 5-HT neurons to the four CSs and USs during an example session of a mouse before reversal. Shaded areas represent 95% confidence interval (CI). (E) Coronal section showing expression of GCaMP6s and tdTomato in the ventral tegmental area (VTA) of a TH-Cre mouse (scale bar: 200 µm). RLi: rostral linear nucleus of the raphe; RPC: red nucleus, parvicellular part; IPR: interpeduncular nucleus. (F) Mean responses of DA neurons to the four CSs and USs during an example session of a mouse before reversal. Shaded areas represent 95% CI.
Figure 3—figure supplement 1

Expression of GCaMP6s and of tdTomato in DRN 5-HT neurons.
(A) Confocal picture of a coronal slice showing GCaMP6s expression in DRN 5-HT neurons of a SERT-Cre mouse (scale bar: 100 μm). (B) Confocal pictures showing DAPI staining, GCaMP6s expression, 5-HT immunoreactivity and overlay (scale bar: 20 μm). (C) Schematics of a coronal slice showing the DRN and the area in (A), indicated by a violet rectangle (top, black scale bar: 1 mm). Quantification of specific expression of GCaMP6s in 5-HT neurons (bottom, specificity: 93.2% ± 0.3%, infection success: 73.3% ± 3.5%, mean ± s.e.m, n = 4 mice). (D) Expression of GCaMP6s and tdTomato in DRN 5-HT neurons (scale bars: 100 μm, aq: aqueduct). (E) Expression of YFP and tdTomato in DRN 5-HT neurons (scale bars: 100 μm). (F) Total number of cells expressing green fluorophore (GCaMP6s or YFP), tdTomato, or both in SERT-Cre experimental and control mice (counted from three sections at the center of infection for each mouse, n = 6 GCaMP6s mice, n = 3 YFP mice). (G) Percentage of green and red cells that express both fluorophores in GCaMP6s and YFP infected mice (n = 6 GCaMP6s mice, n = 3 YFP mice, no statistical difference was obtained between the percentage of green cells that co-express tdTomato in GCaMP vs YFP mice, nor between the percentage of red cells that co-express a green fluorophore in GCaMP vs YFP mice, Mann-Whitney U test, n.s. for p<0.05). (H) Anteroposterior location of the center of infection (circles) and of the fiber tip location (crosses) in the SERT-Cre mice used in behavioral experiments with good histology (n = 9 for GCaMP6s infection center, n = 8 for GCaMP6s fiber placement, n = 3 for YFP control mice).
Figure 3—figure supplement 2
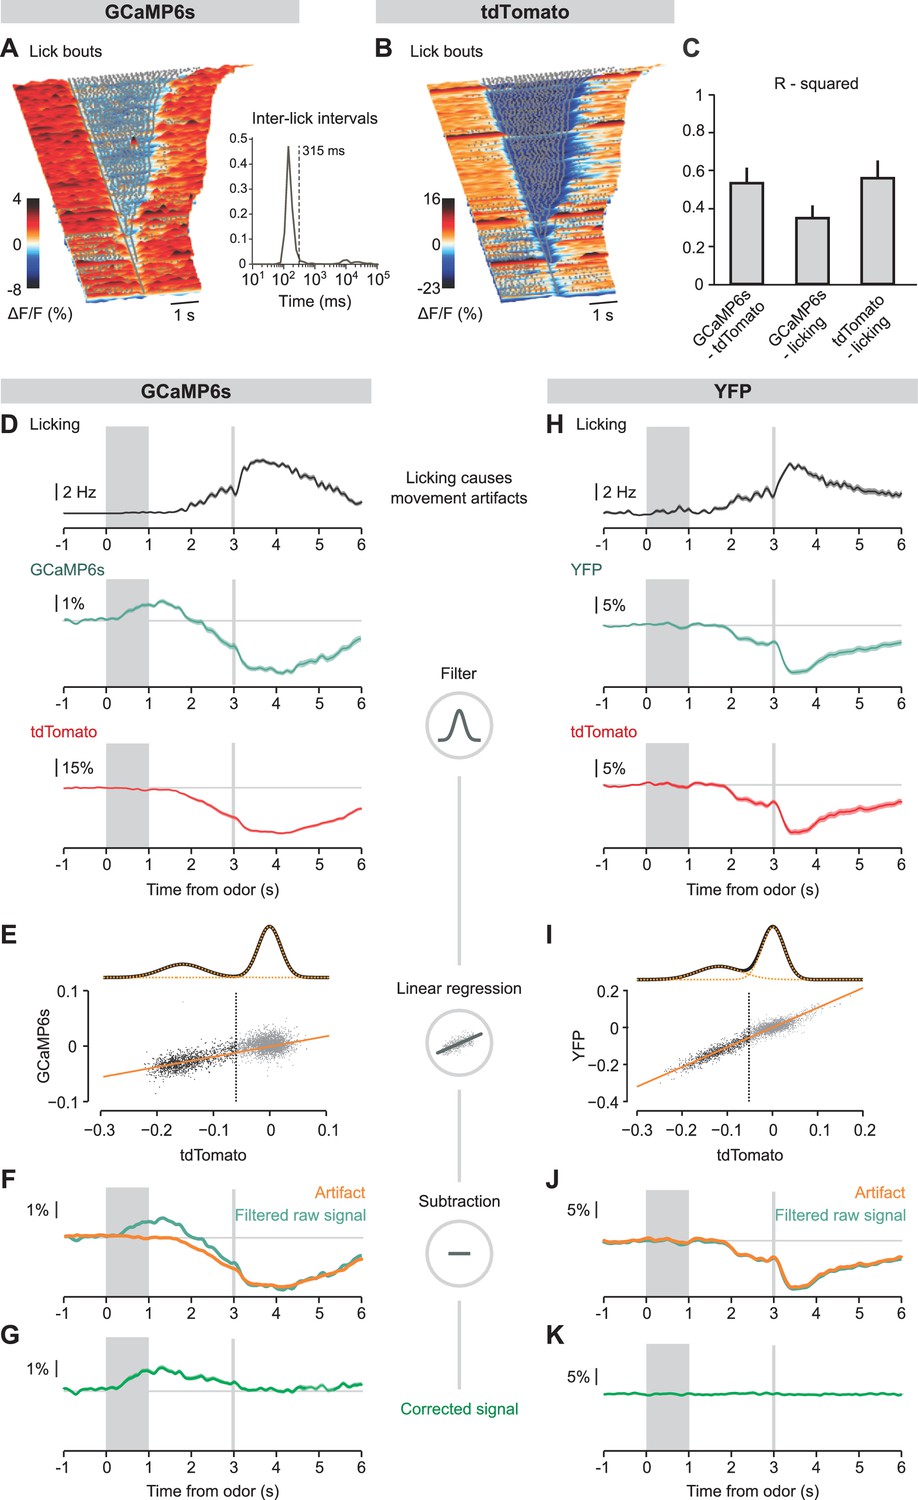
Linear regression approach to eliminate movement artifacts from neuronal photometric data.
(A), (B) Surface plots showing raw GCaMP6s (A) and tdTomato (B) fluorescence signals aligned on the onsets of lick bouts during an example session of a SERT-Cre mouse infected with the corresponding fluorophore. Gray dots represent single licks. Inset in (A, right) shows the distribution of inter-lick intervals for this session: lick bouts were defined as sequences of licks separated by no more than 315 ms. The surface plots are aligned from the longer lick bouts at the top to the shorter ones at the bottom (the last ones are single licks that do not belong to any bout). Fluorescence data are shown from 2 s before to 2 s after the bouts. (C) Bar plot showing R-squared values comparing GCaMP6s, tdTomato and licking signals, calculated during three imaging sessions and averaged across all SERT-Cre mice (n = 9). (D), (H) Mean licking (top), mean filtered green fluorescence of GCaMP6s (D) or YFP (H), and mean filtered tdTomato fluorescence in large water reward trials in an example session of a SERT-Cre mouse transduced with GCaMP6s and tdTomato, and of a SERT-Cre example mouse transduced with YFP and tdTomato. Data in (D) belong to the same session represented in (A,B). (E), (I) Scatter plot and linear regression between tdTomato and GCaMP6s (E) or YFP (I) signals for the same sessions as before. tdTomato signals were often bimodal, and well fit as a sum of two Gaussians (top; orange dotted curves, individual Gaussians; black curve, their sum). In order to avoid fitting noise, only data from the Gaussian not centered at zero were included in the linear regression calculation (black dots to the left of the vertical line). Orange lines indicate regression curves. (F), (J) Mean filtered raw GCaMP6s (F) or YFP (J) signals and corresponding artifact predictions (calculated using linear regression as shown in E and I). (G), (K) Corrected fluorescence signal obtained after the subtraction of the filtered raw signal by the artifact signal presented in (F) and (J). While a calcium signal is still visible in the mouse infected with GCaMP6s, no signal is observed in the YFP control.
Figure 3—figure supplement 3

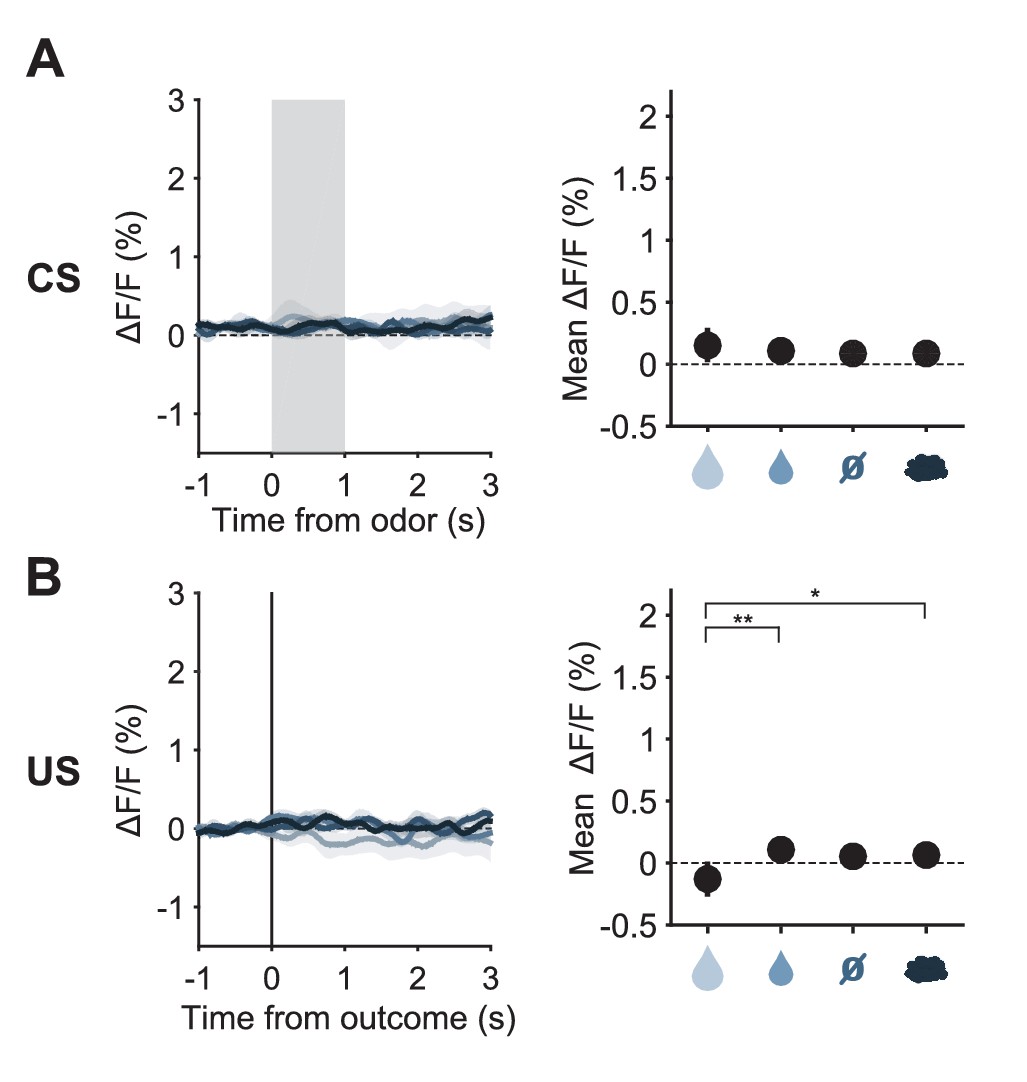
Responses of DRN 5-HT neurons to odor cues and to predicted outcomes.
(A) Left: Mean (± s.e.m) CS responses (corrected fluorescence) of all SERT-Cre mice expressing GCaMP6s (n = 9) to the four odors (CSs), after having learned the CS-US associations; Middle: quantification of the mean (± s.e.m) CS response amplitude (in a 1.5 s period from odor onset) across mice (three-way ANOVA with factors day, mouse and trial type, main effect of trial type F3,94 = 16.22, p<0.001, only statistically significant effects of trial type after post hoc correction for multiple comparisons are shown: vertical ticks signal events being compared, horizontal bars without vertical ticks below them are used for grouping non-statistically different events); Right: z-scores of mean response amplitude for individual mice (gray dots, n = 9 mice) and their mean (± s.e.m., black dots). (B) Same as (A) but for US responses of SERT-Cre mice (F3,94 = 12.41, p<0.001). The predicted large reward US responses of 5-HT neurons have a slightly negative value because of the response that the corresponding CS triggered before, and which takes longer to go back to baseline than the 2 s trace period. *p<0.05, **p<0.01, ***p<0.001.
Figure 3—figure supplement 4
Fluorescence changes to odor cues and to predicted outcomes in YFP control mice.
(A) Left: Mean (± s.e.m.) CS responses (corrected fluorescence) of all SERT-Cre mice infected with YFP instead of GCaMP6s (n = 4) to the four odors after having learned the CS–US associations; Right: quantification of the mean (± s.e.m.) CS response amplitude (in a 1.5 s period from odor onset) across mice (three-way ANOVA with factors day, mouse and trial type, main effect of trial type F3,39 = 0.42, p=0.7426). (B) Same as (A), but for US responses of YFP-expressing SERT-Cre mice (F3,39 = 4.85, p=0.0058). *p<0.05, **p<0.01.
Figure 3—figure supplement 5

Responses of midbrain DA neurons before reversal.
(A) Confocal picture of a coronal slice showing GCaMP6s expression in VTA DA neurons of a TH-Cre mouse (left, scale bar: 100 μm); close up showing DAPI staining, GCaMP6s expression, TH immunoreactivity and overlay (middle, scale bar: 20 μm); schematics of a coronal slice showing the VTA and the area on the left signaled by a violet rectangle (scale bar: 1 mm) with quantification of specific expression of GCaMP6s in DA neurons in the infection center (right, specificity: 89.9% ± 2.5%, infection success: 86.7% ± 2.5%, mean ± s.e.m, n = 4 mice). (B) Left: Mean (± s.e.m) CS responses (corrected fluorescence) of all TH-Cre mice expressing GCaMP6s (n = 3) to the four odors (CSs), after having learned the CS-US associations; Middle: quantification of the mean (± s.e.m) CS response amplitude (in a 1.5 s period from odor onset) across mice (three-way ANOVA with factors day, mouse and trial type, main effect of trial type F3,28 = 52.11 p<0.001, only statistically significant effects of trial type after post hoc correction for multiple comparisons are shown: vertical ticks signal events being compared, horizontal bars without vertical ticks below them are used for grouping non-statistically different events); Right: z-scores of mean response amplitude for individual mice (gray dots, n = 3 mice) and their mean (± s.e.m., black dots). (C) Same as (B), but for US responses of TH-Cre mice (F3,28 = 1.05, p=0.386). ***p<0.001.
Figure 4 with 1 supplement

US responses of 5-HT and DA neurons to the large reward during reversal.
(A) Schematic of the reversal procedure following the large reward US. (B) Top: Mean large reward US responses of an example mouse (SERT1) across days around reversal (shaded areas represent 95% CI); Bottom: change in mean large reward response amplitude (z-scored across days): gray dots represent individual mice (n = 8), black dots average (± s.e.m.) of mice (two-way ANOVA with factors day and mouse, the main effect of day is F4,2592 = 31.47 p<0.001; multiple comparisons with the two days before reversal, corrected using Scheffé’s method, are indicated in the figure). (C) Same as (B) for DA neurons (n = 3 mice): F4,853 = 32.46, p<0.001. *p<0.05, ***p<0.001.
Figure 4—figure supplement 1
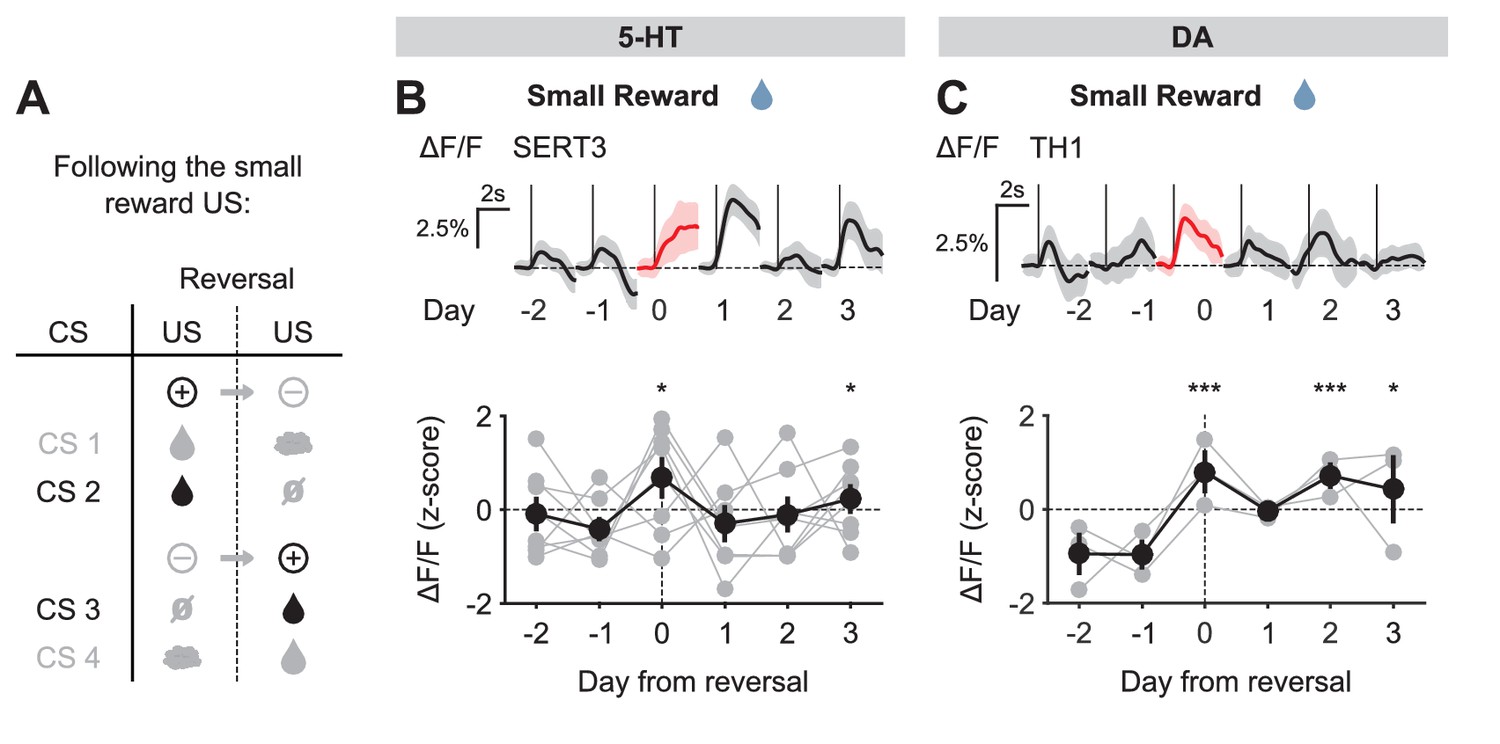
US responses of 5-HT and DA neurons to small reward during reversal.
(A) Schematic of the reversal procedure following the small reward US. (B) Top: Mean small reward US responses of an example mouse (SERT3) across days around reversal (shaded areas represent 95% CI); Bottom: change in mean small reward response amplitude (z-scored across days): gray dots represent individual mice (n = 8), black dots average (± s.e.m.) of mice (two-way ANOVA with factors day and mouse, the main effect of day F4,2532 = 5.98, p<0.001; multiple comparisons with the two days before reversal, corrected using Scheffé’s method, are indicated in the figure). (C) Same as (B) for DA neurons (n = 3 mice): F4,911 = 8.52, p<0.001. *p<0.05, ***p<0.001.
Figure 5 with 1 supplement
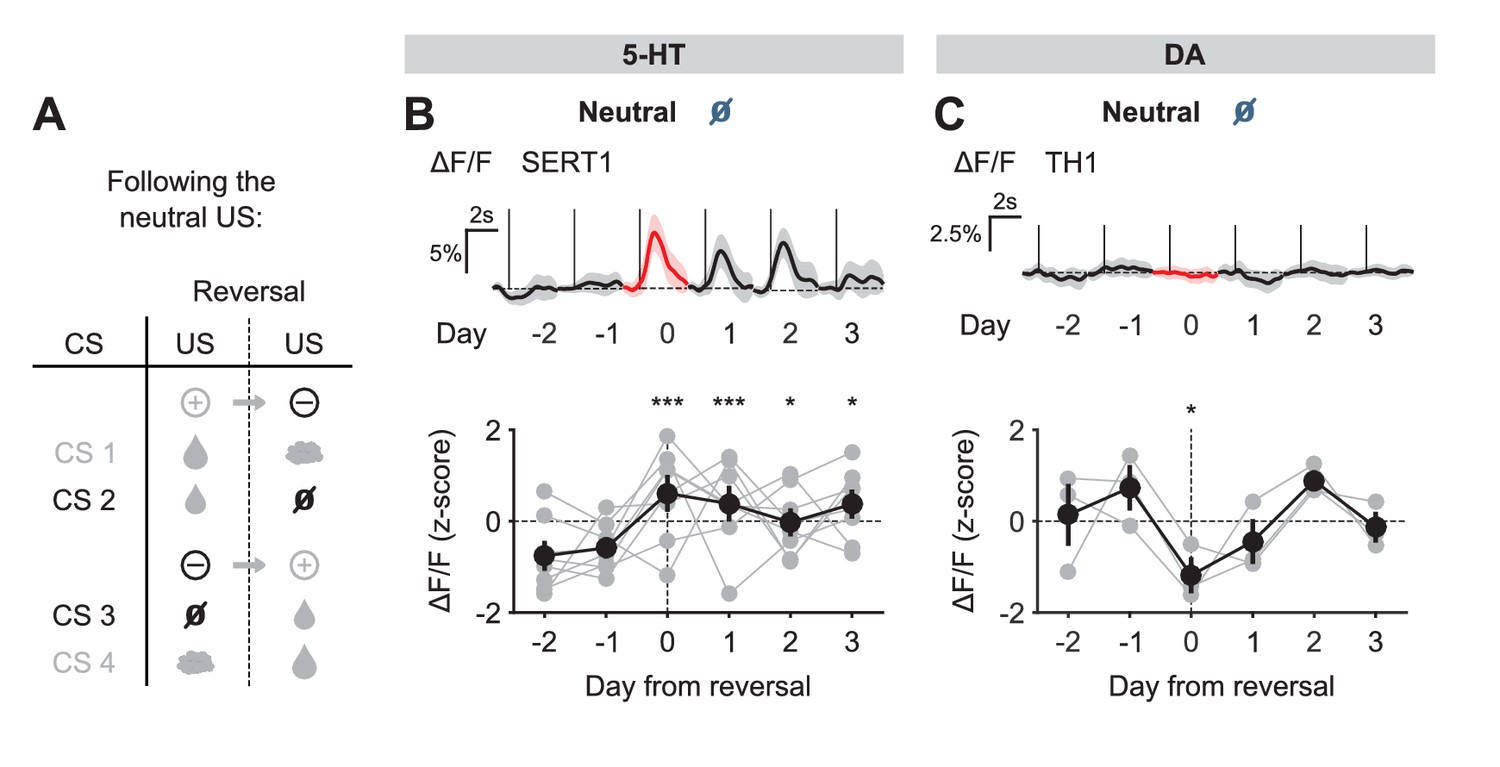
US responses of 5-HT and DA neurons to neutral outcome during reversal.
(A) Schematic of the reversal procedure following neutral US. (B) Top: Mean neutral US responses of an example mouse (SERT1) across days around reversal (shaded areas represent 95% CI); Bottom: change in mean neutral response amplitude (z-scored across days): gray dots represent individual mice (n = 8), black dots average (± s.e.m.) of mice (two-way ANOVA with factors day and mouse, the main effect of day F4,2535 = 10.71, p<0.001; multiple comparisons with the two days before reversal, corrected using Scheffé’s method, are indicated in the figure). (C) Same as (B) for DA neurons (n = 3 mice): F4,843 = 4.54, p=0.001. *p<0.05, ***p<0.001.
Figure 5—figure supplement 1
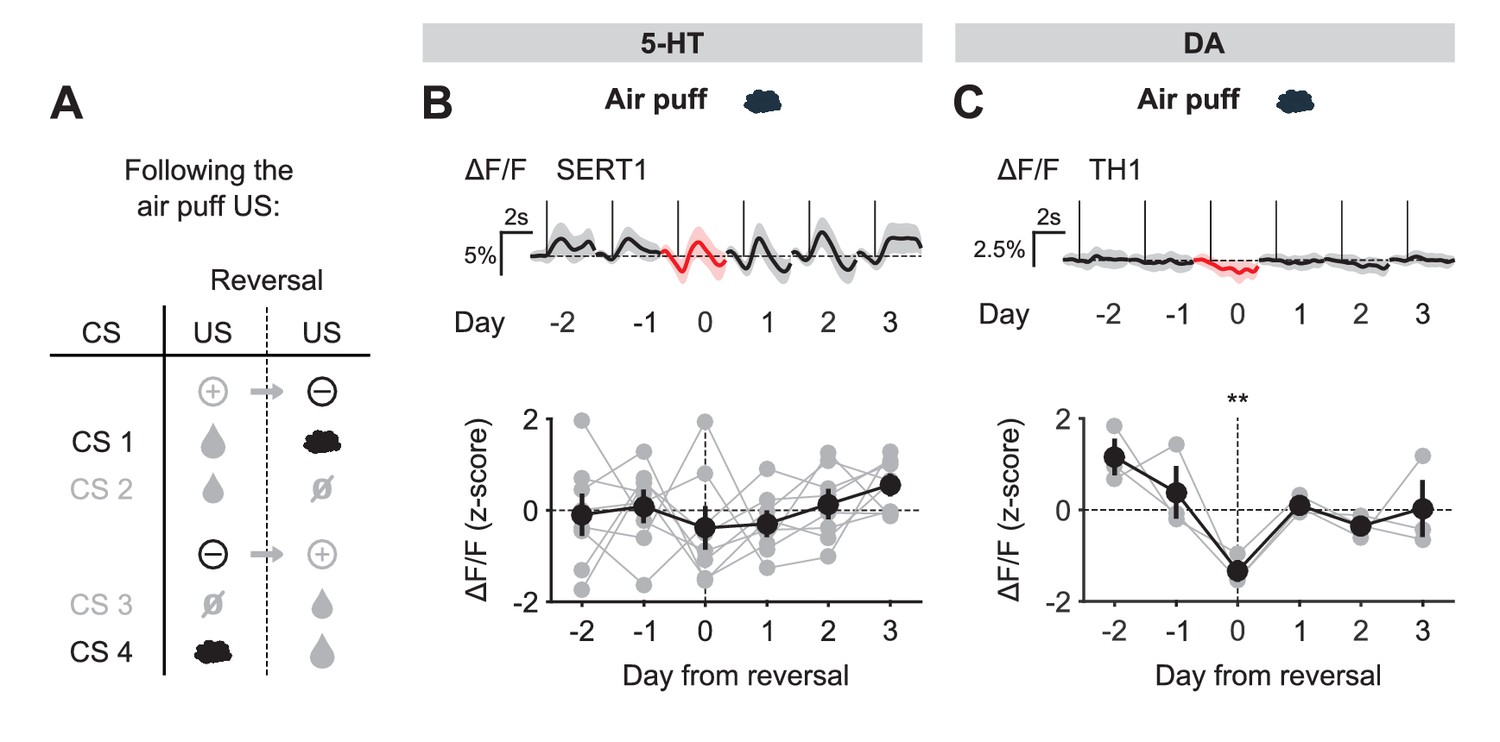
US responses of 5-HT and DA neurons to air puff during reversal.
(A) Schematic of the reversal procedure following the air puff US. (B) Top: Mean air puff US responses of an example mouse (SERT1) across days around reversal (shaded areas represent 95% CI); Bottom: change in mean air puff response amplitude (z-scored across days): gray dots represent individual mice (n = 8), black dots average (± s.e.m.) of mice (two-way ANOVA with factors day and mouse, the main effect of day F4,2564 = 2.55, p=0.037; multiple comparisons with the two days before reversal, corrected using Scheffé’s method, are indicated in the figure). (C) Same as (B) for DA neurons (n = 3 mice): F4,881 = 5.21, p<0.001. **p<0.01.
Figure 6
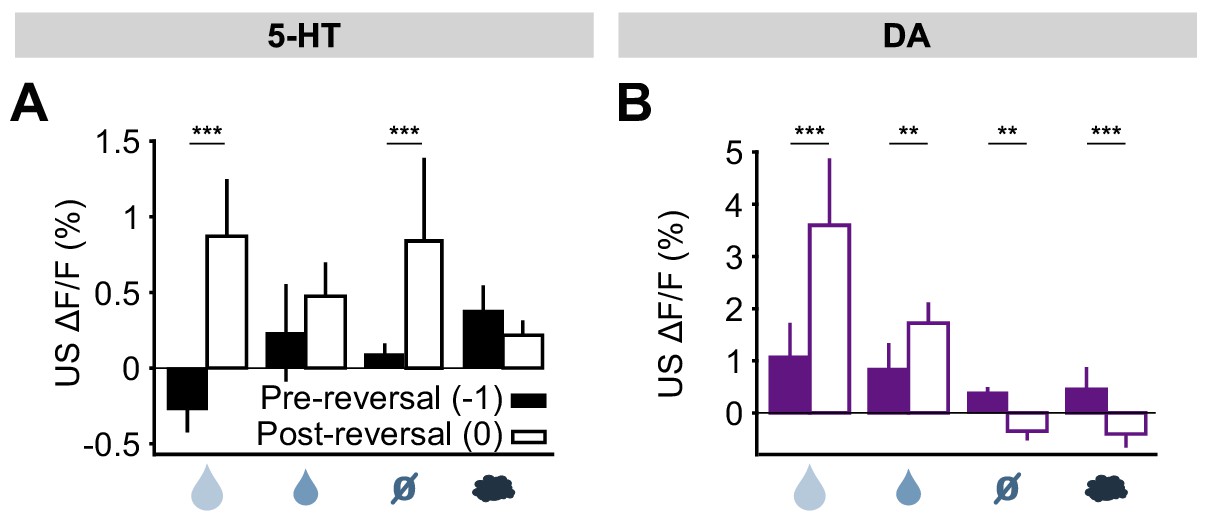
Responses of 5-HT and DA neurons to outcomes are differentially modulated by expectations.
(A) Mean (± s.e.m.) response of 5-HT neurons, across mice, to the four USs before (day −1, filled bars) and right after (day 0, open bars) reversal (n = 8 mice, two-way ANOVA with factors mouse and day, the main effect of day F1,764 = 84.36, p<0.001 for large reward, F1,748 = 3.49, p=0.062 for small reward, F1,756 = 38.17, p<0.001 for neutral, F1,766 = 2.79, p=0.095 for air puff). (B) Same as (A) for midbrain DA neurons (n = 3 mice, F1,249 = 67.9, p<0.001 for large reward, F1,277 = 8.49, p=0.004 for small reward, F1,278 = 10.95, p=0.001 for neutral, F1,250 = 12.74, p<0.001 for air puff. **p<0.01, ***p<0.001.
Figure 7 with 1 supplement
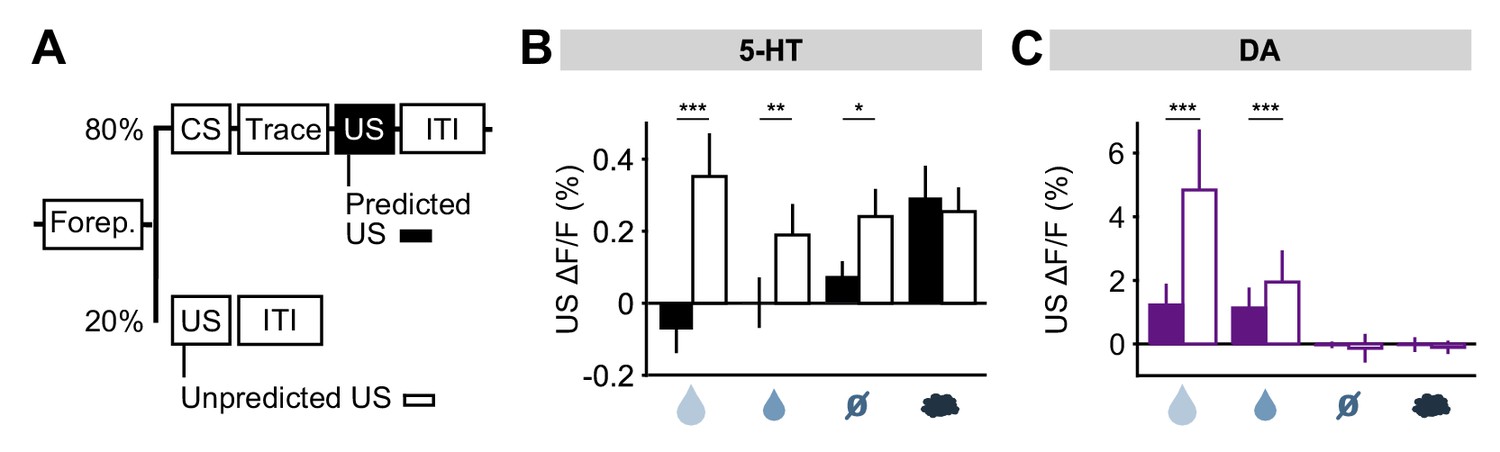
DRN 5-HT neurons respond more to uncued outcomes.
(A) Behavioral task diagram. (B) Mean (± s.e.m.) response of DRN 5-HT neurons across mice to the four USs when they are predicted (filled bars) and when they are unpredicted (open bars) (n = 4 mice, two-way ANOVA with factors type (predicted or unpredicted) and mouse, the main effect of type: large reward F1,923 = 45.17, p<0.001, small reward F1,944 = 8.42, p=0.0038, neutral F1,924 = 5.36, p=0.0208, air puff F1,924 = 0.61, p=0.4331). (C) Same as (B) but for midbrain DA neurons (n = 3 mice, large reward F1,642 = 175.05, p<0.001, small reward F1,589 = 17.53, p<0.001, neutral F1,673 = 0.52, p=0.4707, air puff F1,601 = 0.34, p=0.5598). *p<0.05, **p<0.01, ***p<0.001.
Figure 7—figure supplement 1
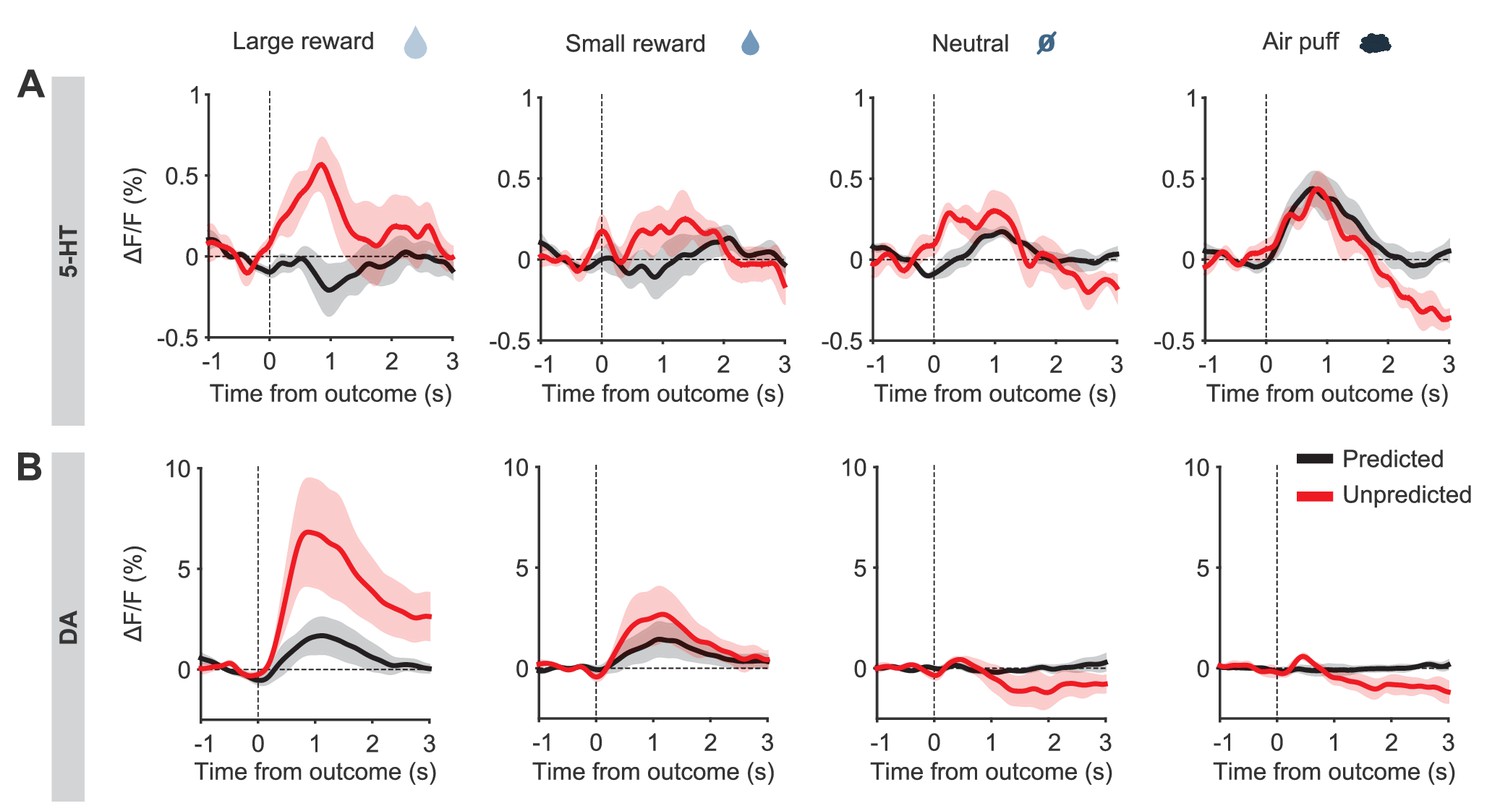
Responses of 5-HT and DA neurons to predicted and unpredicted outcomes.
(A) Mean US responses of SERT-Cre mice (n = 4) to predicted (black) and unpredicted (red) outcomes (shaded areas represent s.e.m.). (B) Same as (A) for TH-Cre mice.
Figure 8
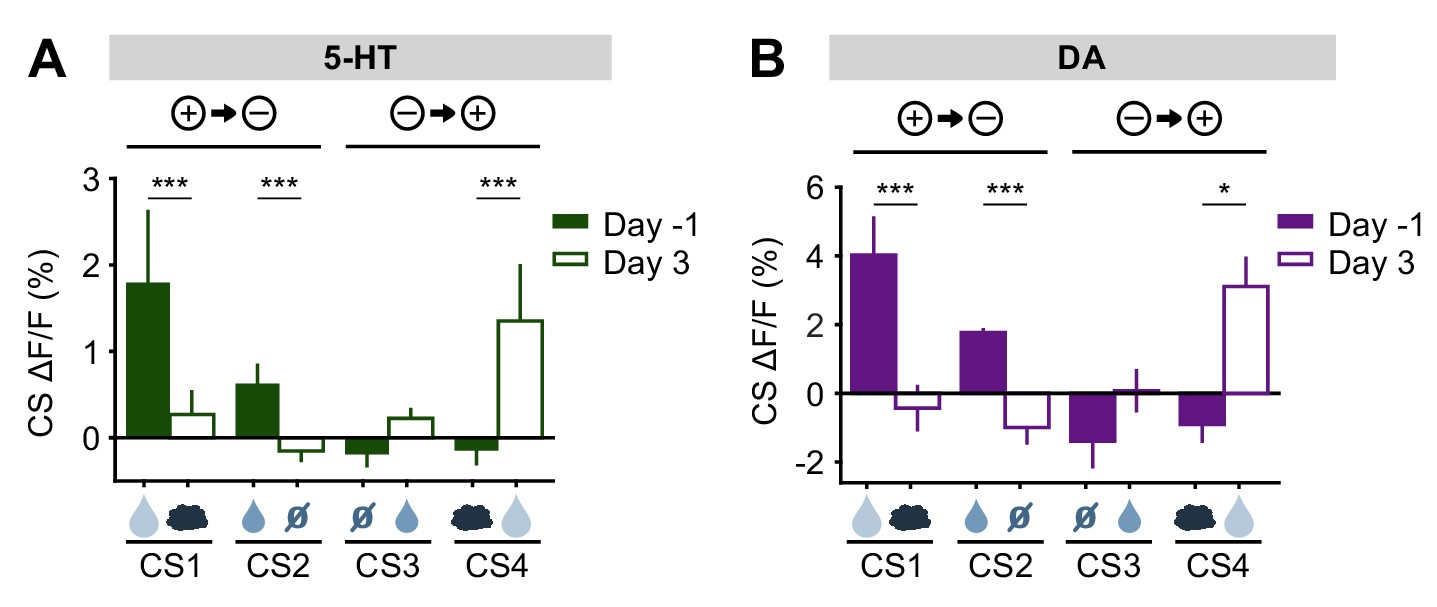
5-HT and DA CS responses are relearned after the reversal.
(A) Mean (± s.e.m.) response of 5-HT neurons across mice to the four CSs before reversal (filled bars) and after adaptation to the reversed contingencies (open bars) (n = 8 mice, two-way ANOVA with factors day and mouse, the main effect of day: large reward F1,906 = 17.35, p<0.001, small reward F1,902 = 14.87, p<0.001, neutral F1,882 = 0.13, p=0.72, air puff F1,914 = 17.12, p<0.001). (B) Same as (A) for midbrain DA neurons (n = 3 mice, large reward F1,294 = 15.35, p<0.001, small reward F1,336 = 71.72, p<0.001, neutral F1,282 = 3.45, p=0.06, air puff F1,312 = 6.56, p=0.01). *p<0.05, ***p<0.001.
Figure 9 with 2 supplements
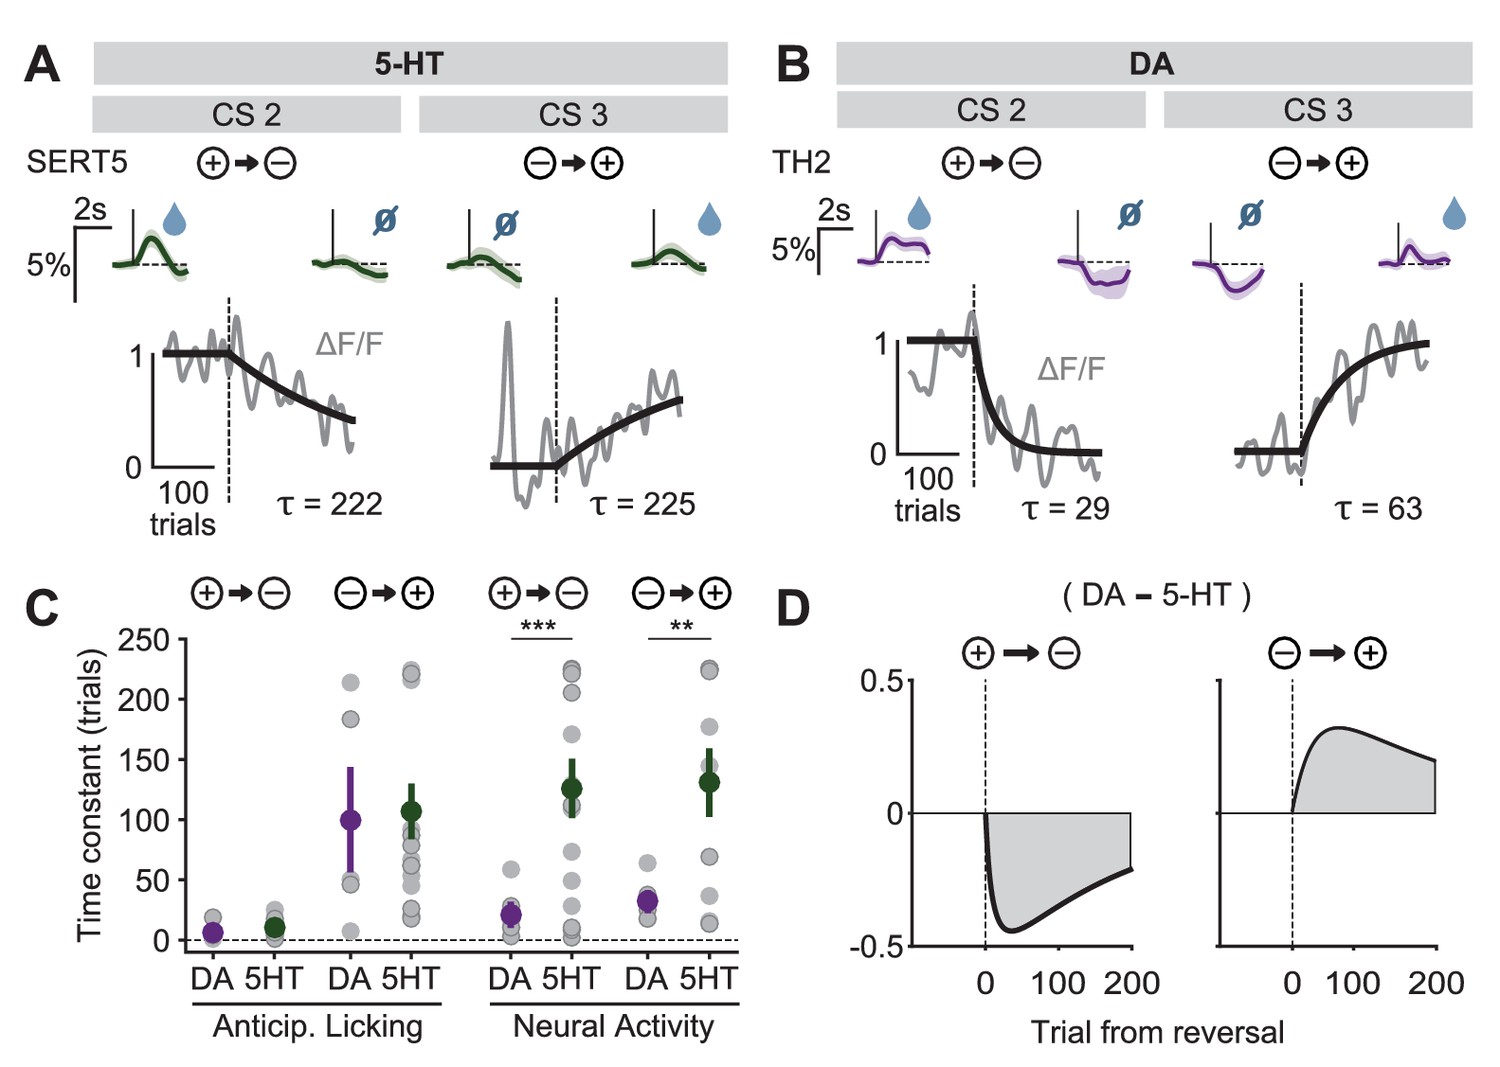
Distinct speed of CS reversal learning in DRN 5-HT and midbrain DA neurons.
(A) Normalized exponential fits (black traces) to the mean amplitude of the CS responses (gray traces) across trials for CS 2 and CS 3 of an example SERT-Cre mouse. Insets on top show mean CS response (and 95% CI) on days −1 (left) and 3 (right). (B) Same as (A) for an example TH-Cre mouse. (C) Mean time constants (± s.e.m., green and purple dots) of the exponential fits of CS responses obtained for TH-Cre and SERT-Cre mice during reversal learning (neural activity: unpaired t-tests, p<0.001 for negative reversal, p=0.0023 for positive reversal; no significance obtained for anticipatory licking). Gray dots represent individual mouse–odor pairs for each category of reversal type; gray dots with darker edges represent odors 2 or 4, while the remaining dots represent odors 1 or 3. (D) Difference in the mean fitted amplitude of CS response between DA and 5-HT during negative reversal (left) and during positive reversal (right). **p<0.01, ***p<0.001.
Figure 9—figure supplement 1
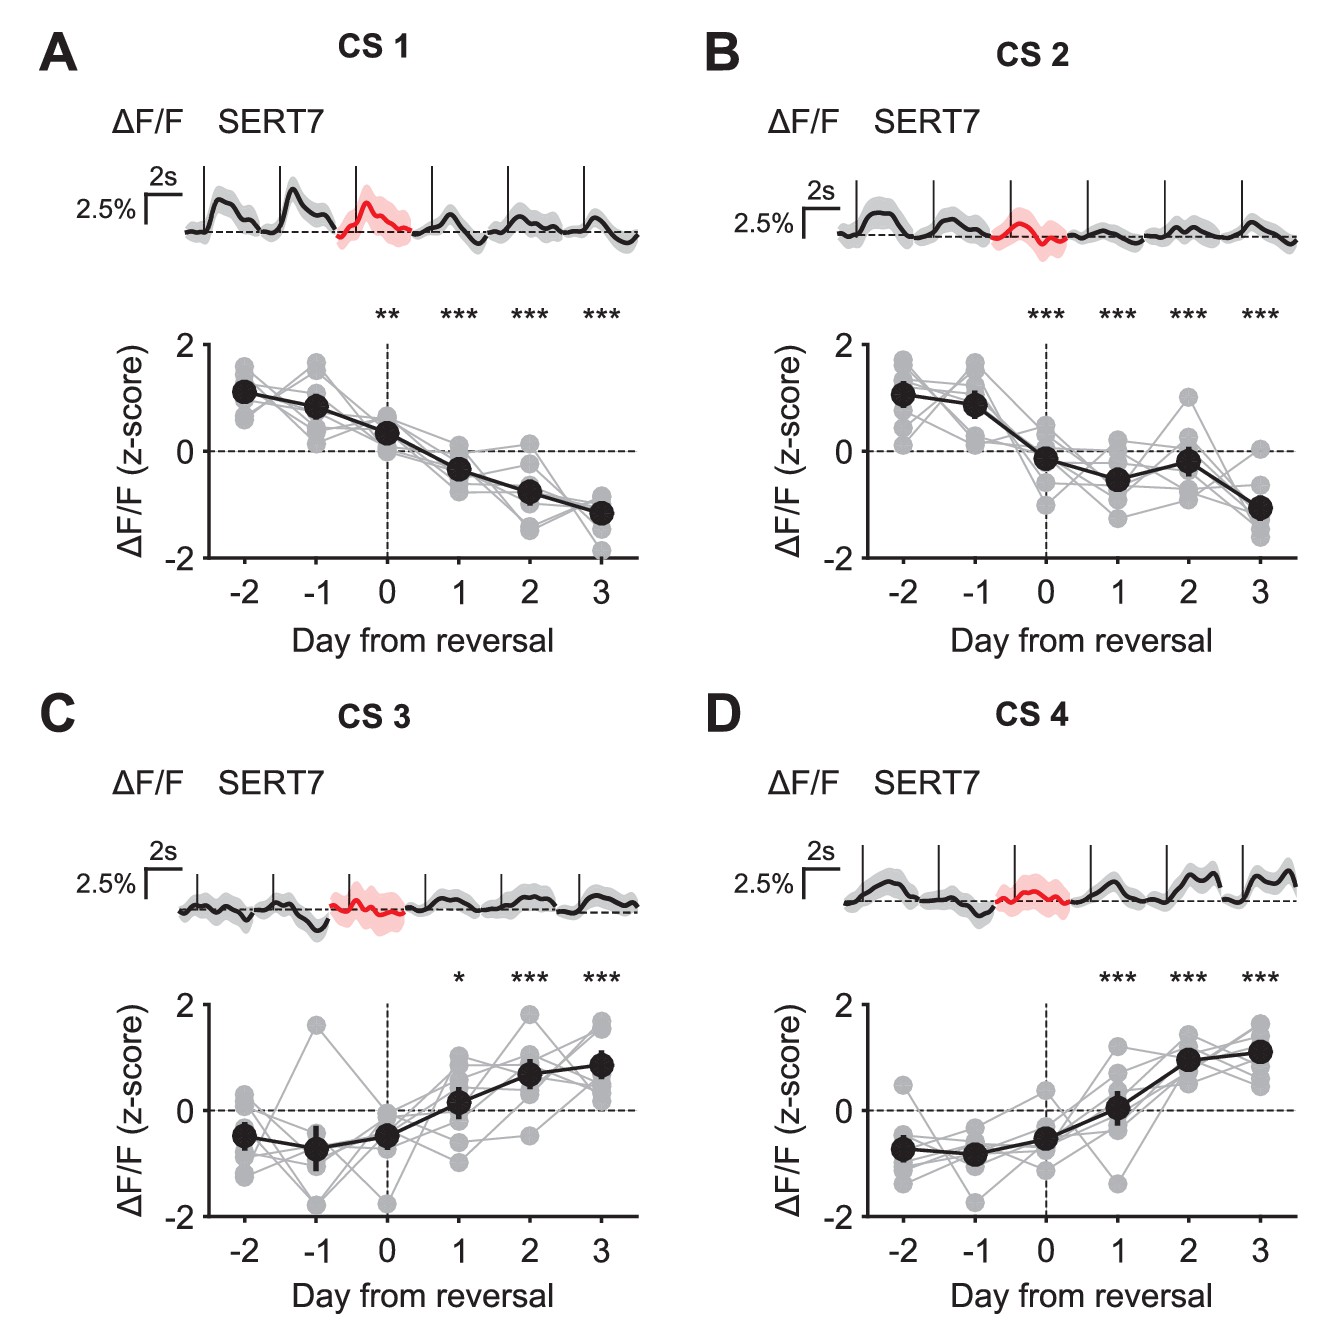
CS responses of DRN 5-HT neurons during reversal.
(A) Top: Mean responses of an example mouse (SERT7) to odor one across days around reversal (shaded areas represent 95% CI); Bottom: change in mean response amplitude to odor 1 (z-scored across days): gray dots represent individual mice (n = 8), black dots average (± s.e.m.) of mice (two-way ANOVA with factors day and mouse, the main effect of day: F4,2597 = 72.1, p<0.001; multiple comparisons with the two days before reversal, corrected using Scheffé’s method, are indicated in the figure). (B), (C), (D) Same as (A), but for odor 2 (F4,2554 = 33.37, p<0.001), odor 3 (F4,2513 = 10.88, p<0.001), and odor 4 (F4,2559 = 73.36, p<0.001), respectively. *p<0.05, **p<0.01, ***p<0.001.
Figure 9—figure supplement 2
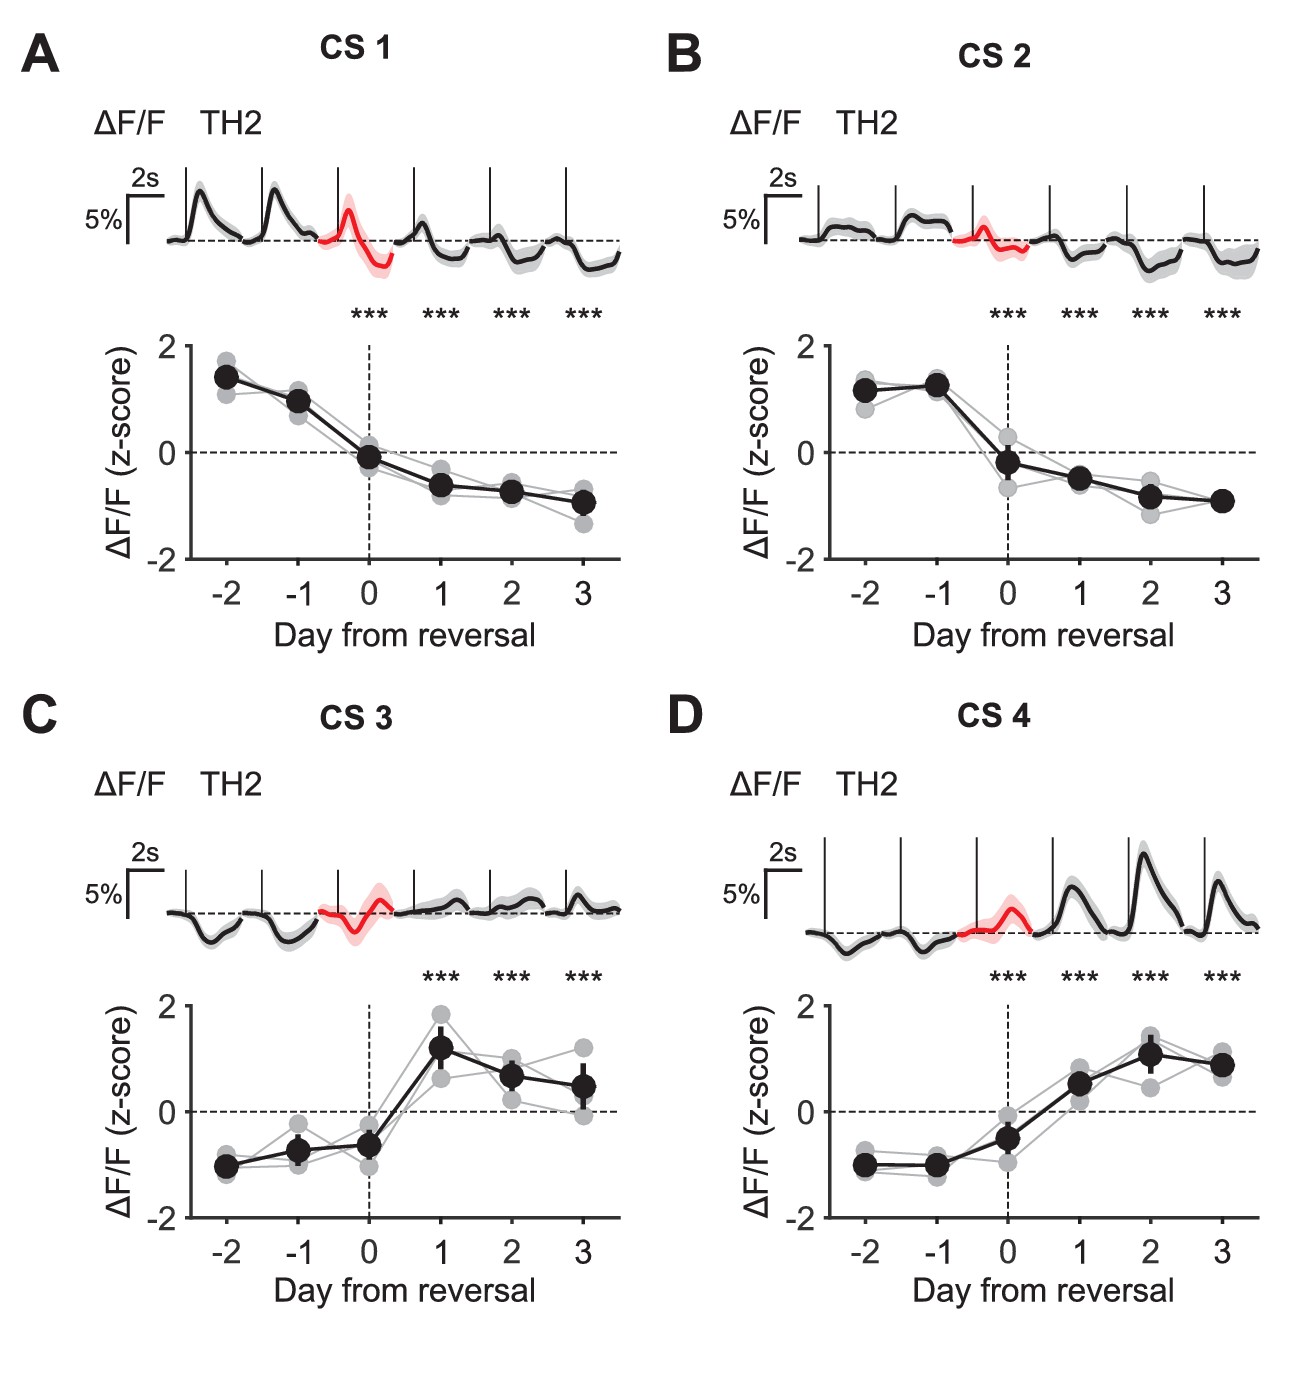
CS responses of midbrain DA neurons during reversal.
(A) Top: Mean responses of an example mouse (TH2) to odor one across days around reversal (shaded areas represent 95% CI); Bottom: change in mean response amplitude to odor 1 (z-scored across days): gray dots represent individual mice (n = 3), black dots average (± s.e.m.) of mice (two-way ANOVA with factors day and mouse, the main effect of day: F4,882 = 223.44, p<0.001; multiple comparisons with the two days before reversal, corrected using Scheffé’s method, are indicated in the figure). (B), (C), (D) Same as (A), but for odor 2 (F4,856 = 84.97, p<0.001), odor 3 (F4,898 = 29.86, p<0.001), and odor 4 (F4,852 = 151.95, p<0.001), respectively. ***p<0.001.
Figure 10 with 1 supplement
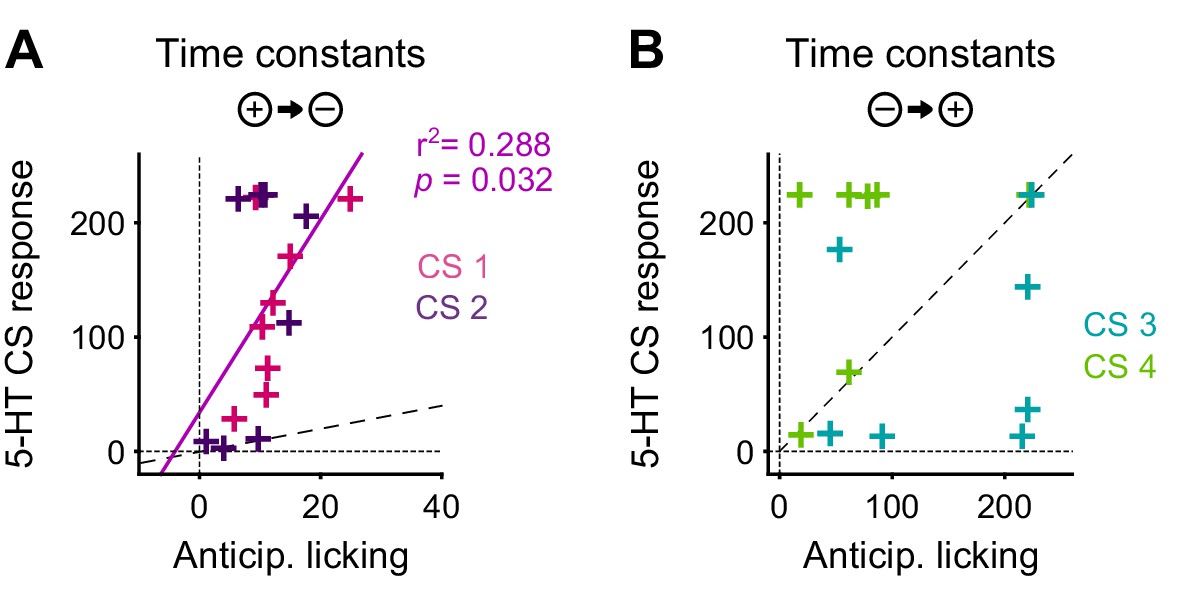
The correlation between the speed of DRN 5-HT cue learning and anticipatory licking.
(A) Correlation between time constants of 5-HT CS responses and anticipatory licking for the negative reversal. A significant linear relationship was found: y = 8.4*x + 34; r2: 0.288; F = 5.67, p=0.032. (B) Same as (A) for positive reversals (no relationship was found). Diagonal dashed lines represent y = x.
Figure 10—figure supplement 1
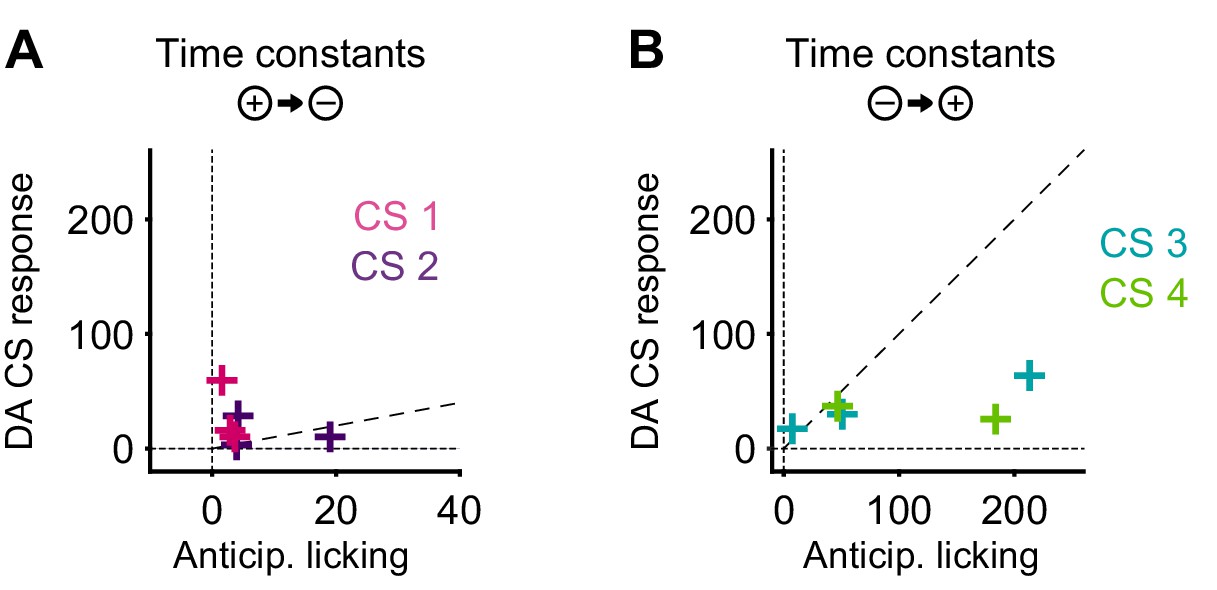
Time constant of DA CS response versus time constant of corresponding anticipatory licking.
(A) For negative reversals. (B) For positive reversals. Diagonal dashed lines represent y = x.
Download links
A two-part list of links to download the article, or parts of the article, in various formats.
Downloads (link to download the article as PDF)
Open citations (links to open the citations from this article in various online reference manager services)
Cite this article (links to download the citations from this article in formats compatible with various reference manager tools)
Activity patterns of serotonin neurons underlying cognitive flexibility
eLife 6:e20552.
https://doi.org/10.7554/eLife.20552


