Transcriptional signatures of somatic neoblasts and germline cells in Macrostomum lignano
- University of Groningen, University Medical Center Groningen, The Netherlands
- Hubrecht Institute-KNAW, The Netherlands
- University Medical Centre Utrecht, The Netherlands
Figures
Figure 1 with 5 supplements
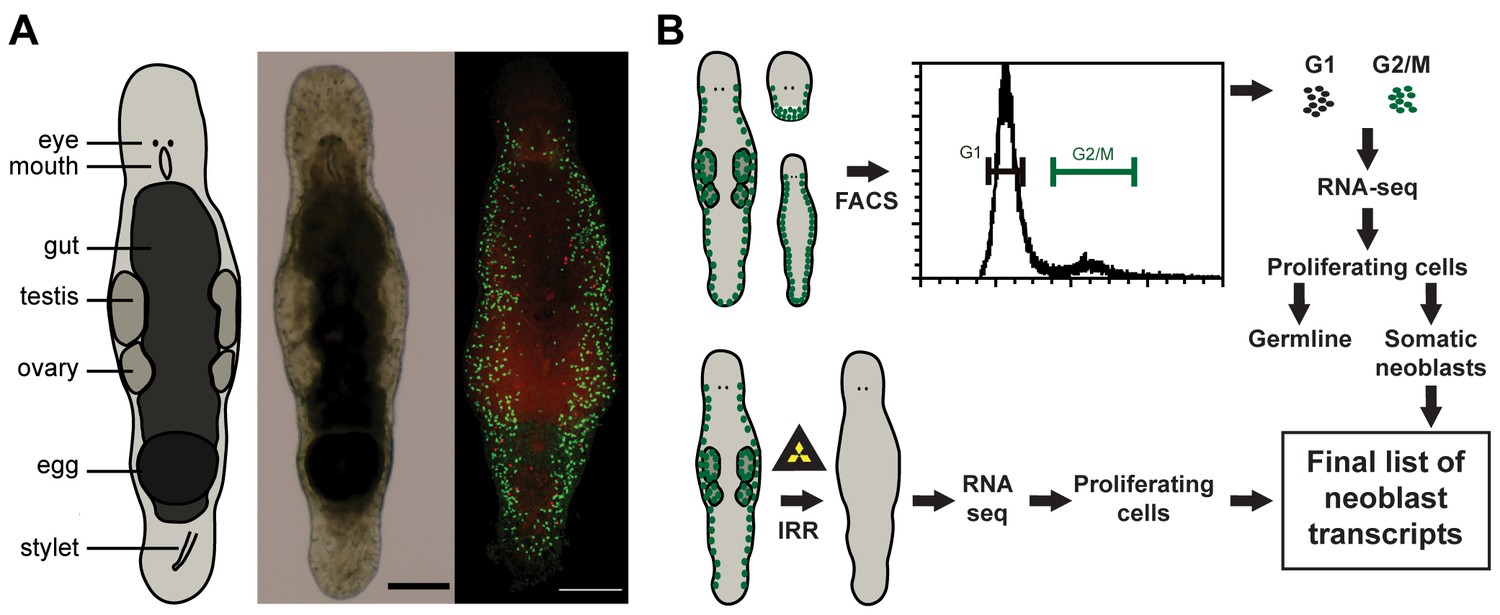
Macrostomum lignano as model organism and experimental set up.
(A) Schematic representation, bright field image, and confocal projection of BrdU and phospho-histone H3 immunostaining (green: S-phase cells, red: mitotic cells) of an adult M. lignano. (B) Schematic representation of the experimental setup. Scale bar 100 µm.
-
Figure 1—source data 1
TransRate contigs scores for MLRNA150904 transcriptome assembly.
- https://doi.org/10.7554/eLife.20607.003
-
Figure 1—source data 2
Gene counts, fold changes and FDR for various gene expression comparisons, and classification of genes into categories.
- https://doi.org/10.7554/eLife.20607.004
-
Figure 1—source data 3
GO term enrichment analysis in various gene lists.
- https://doi.org/10.7554/eLife.20607.005
-
Figure 1—source data 4
Enrichment of S. mediterranea and human markers in various transcript sets.
- https://doi.org/10.7554/eLife.20607.006
Figure 1—figure supplement 1
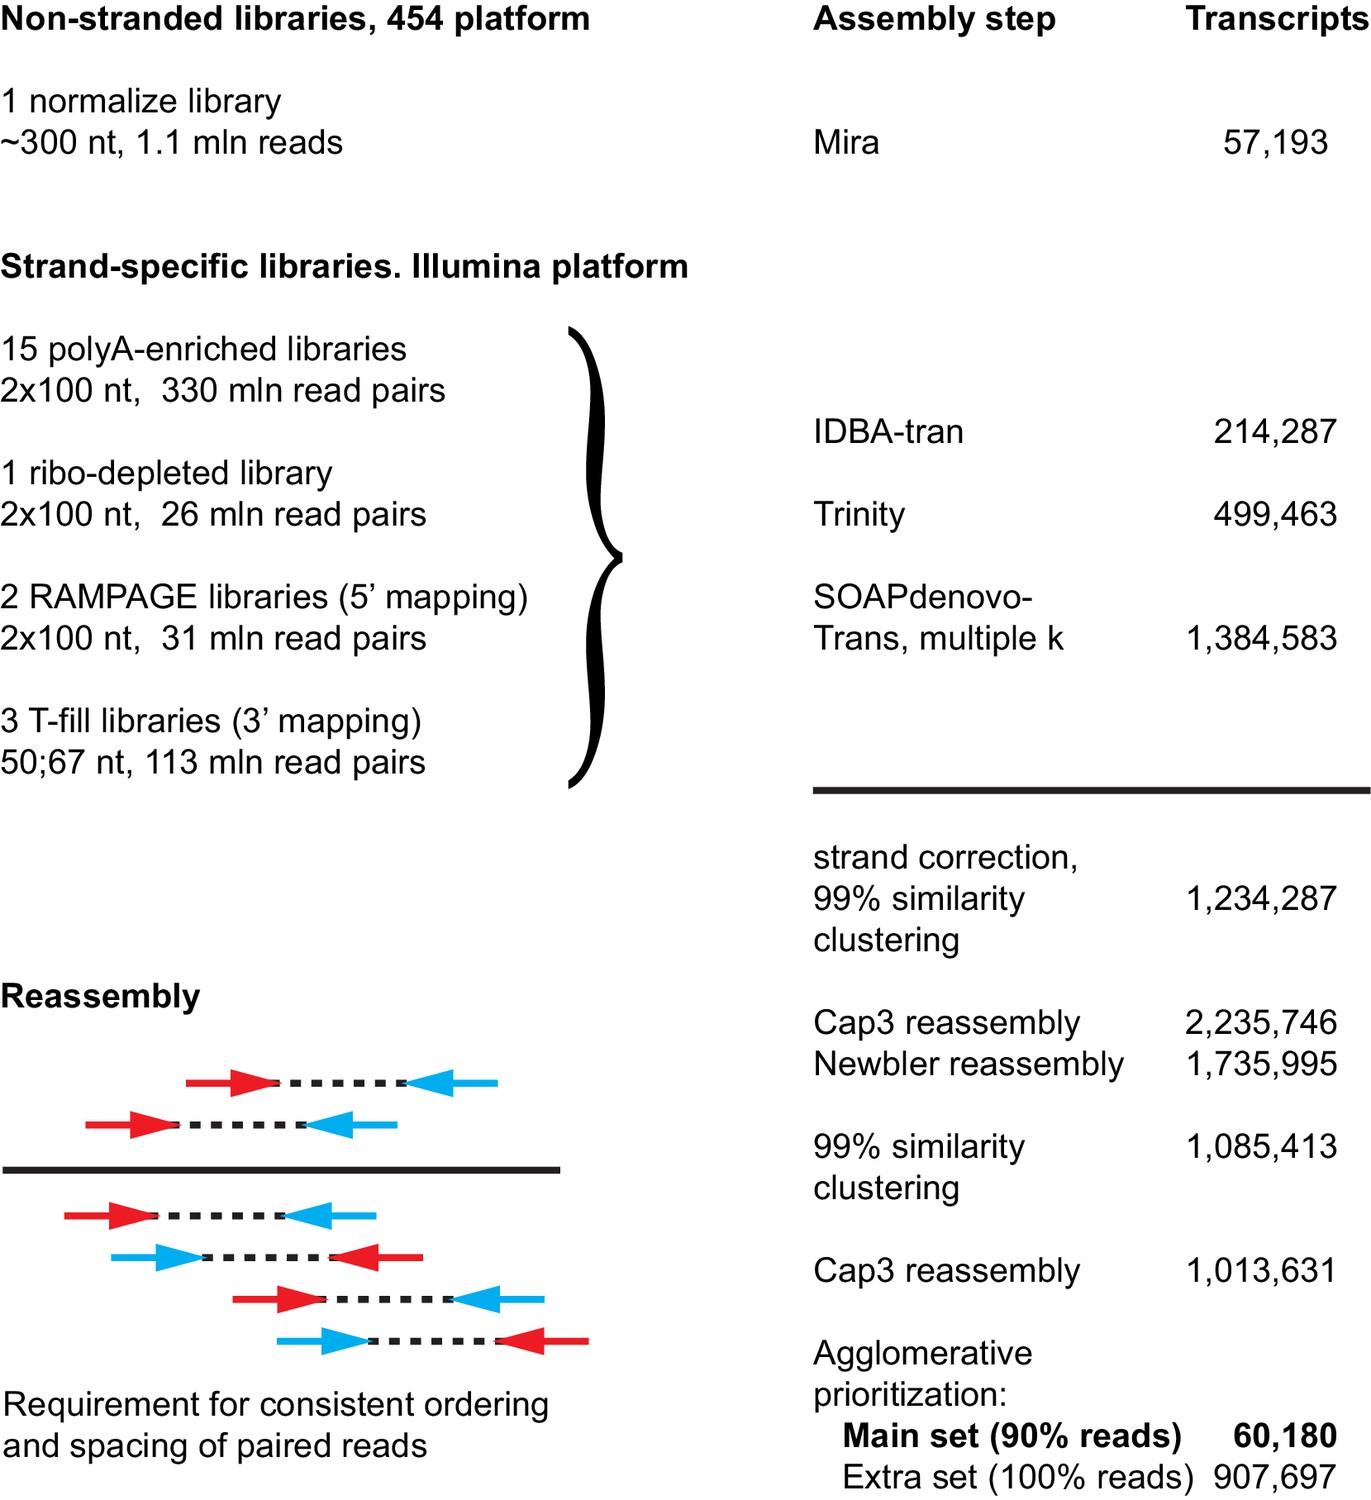
Approach used to generate the Macrostomum lignano de novo transcriptome assembly MLRNA150904.
https://doi.org/10.7554/eLife.20607.007
Figure 1—figure supplement 2
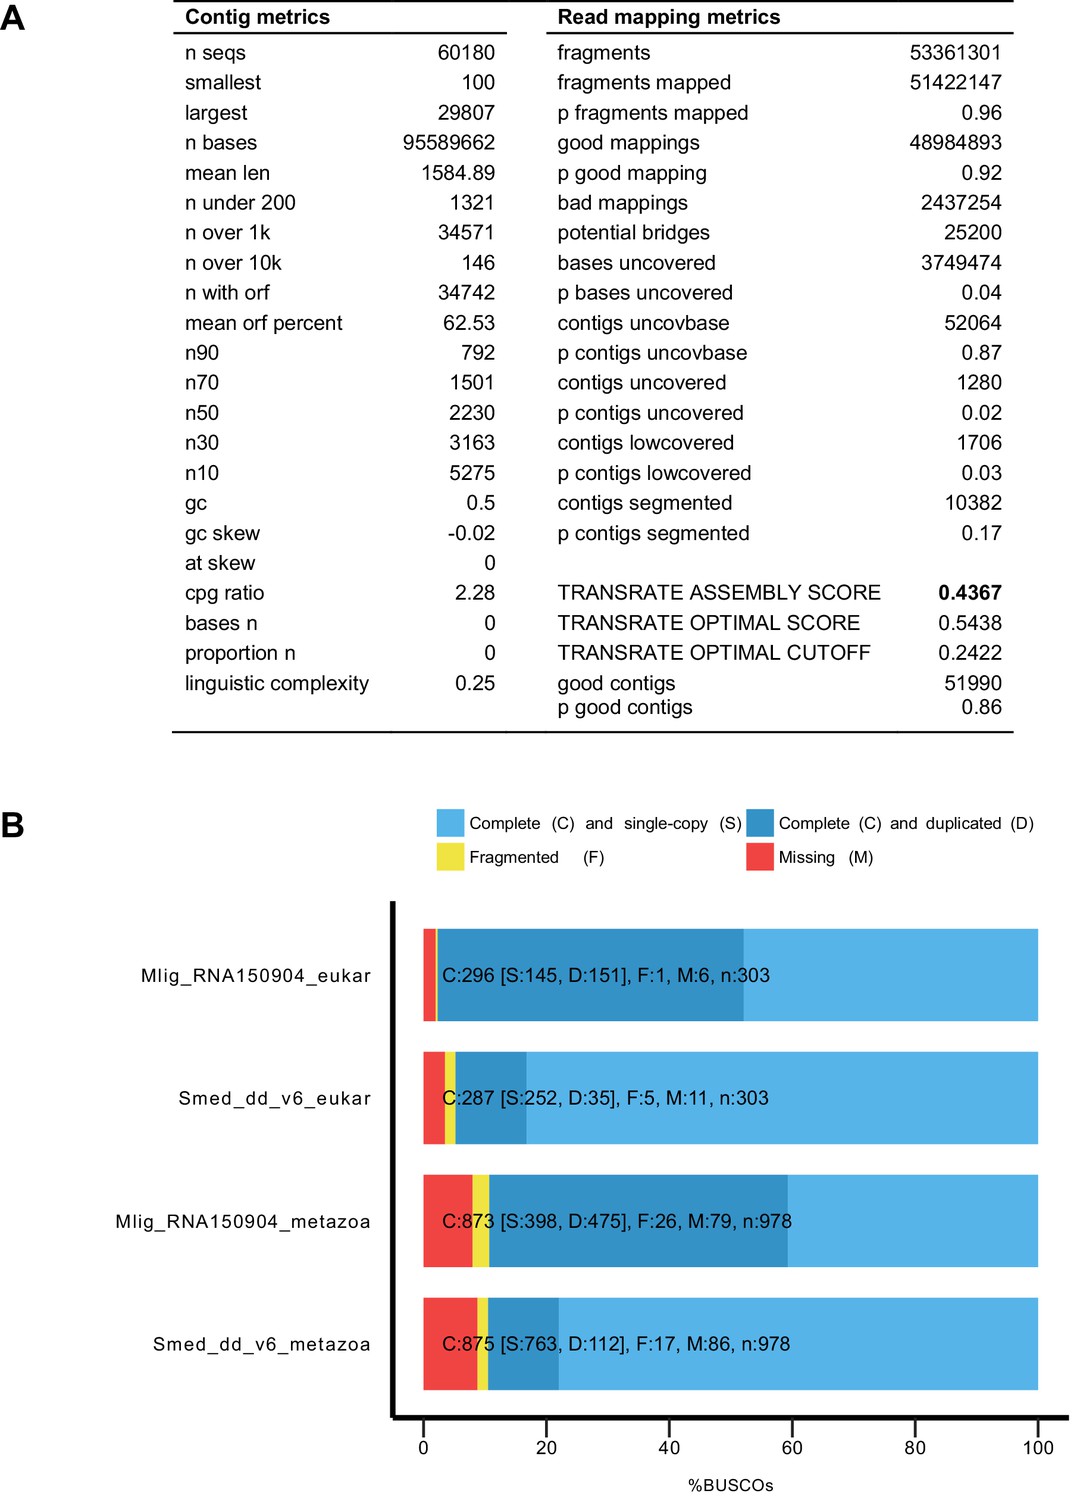
Characteristics of MLRNA150904 transcriptome assembly.
(A) TransRate (Smith-Unna et al., 2016) statistics for the assembly quality based on poly-A enriched and RiboMinus-depleted libraries. TransRate score of 0.4367 puts MLRNA150904 assembly in the top 5% of the 155 de novo transcriptome assemblies analyzed in Smith-Unna et al. (2016). (B) BUSCO (Simão et al., 2015) statistics for transcriptome completeness using eukaryotic and metazoan gene sets. Schmidtea mediterranea transcriptome assembly Smed_dd_v6 (Liu et al., 2013) is included for comparison.
Figure 1—figure supplement 3
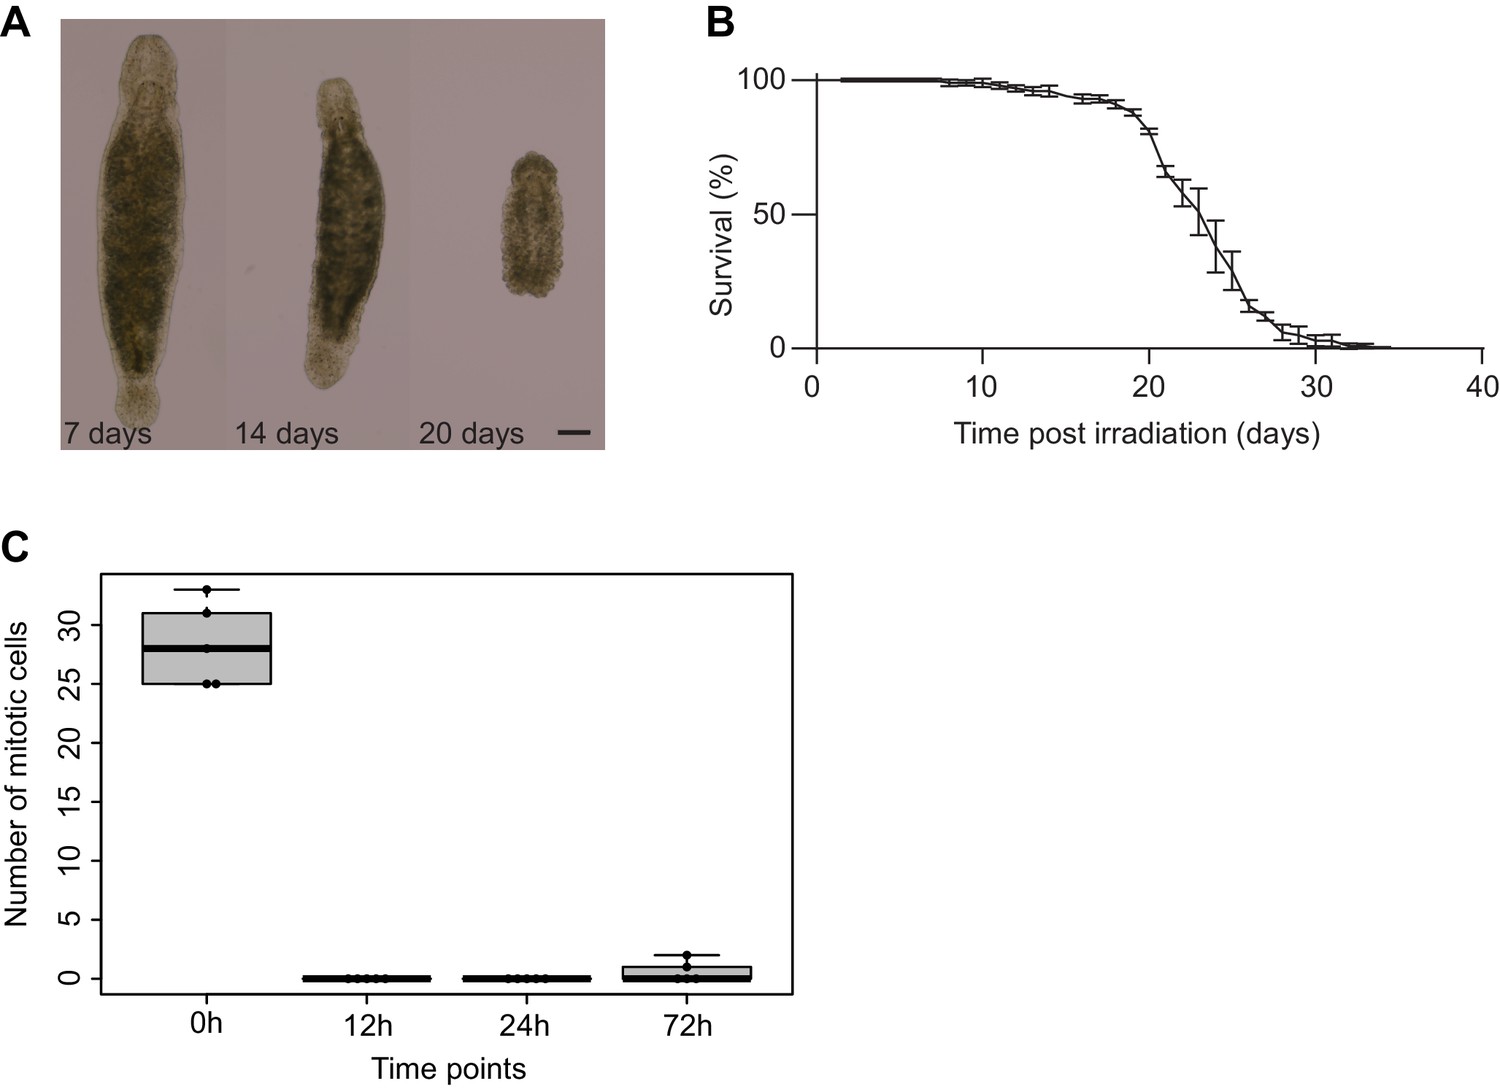
Effects of γ-irradiation on Macrostomum lignano.
(A) Morphologic changes of an adult worm following γ-irradiation treatment. Note the disappearance of the gonads, formation of bulges, and shrinkage of the worm. Scale bar 100 µm. (B) Survival curve following γ-irradiation procedure. Three replicate experiments starting with 100 animals each. Error bars represent SD. (C) The effect of γ-irradiation on the number of mitotic cells in an adult worm (0 hr – non-irradiated control; 12, 24, and 72 hr – hours post-irradiation). Each dot represents one animal (N = 5). Error bars denote SD.
Figure 1—figure supplement 4
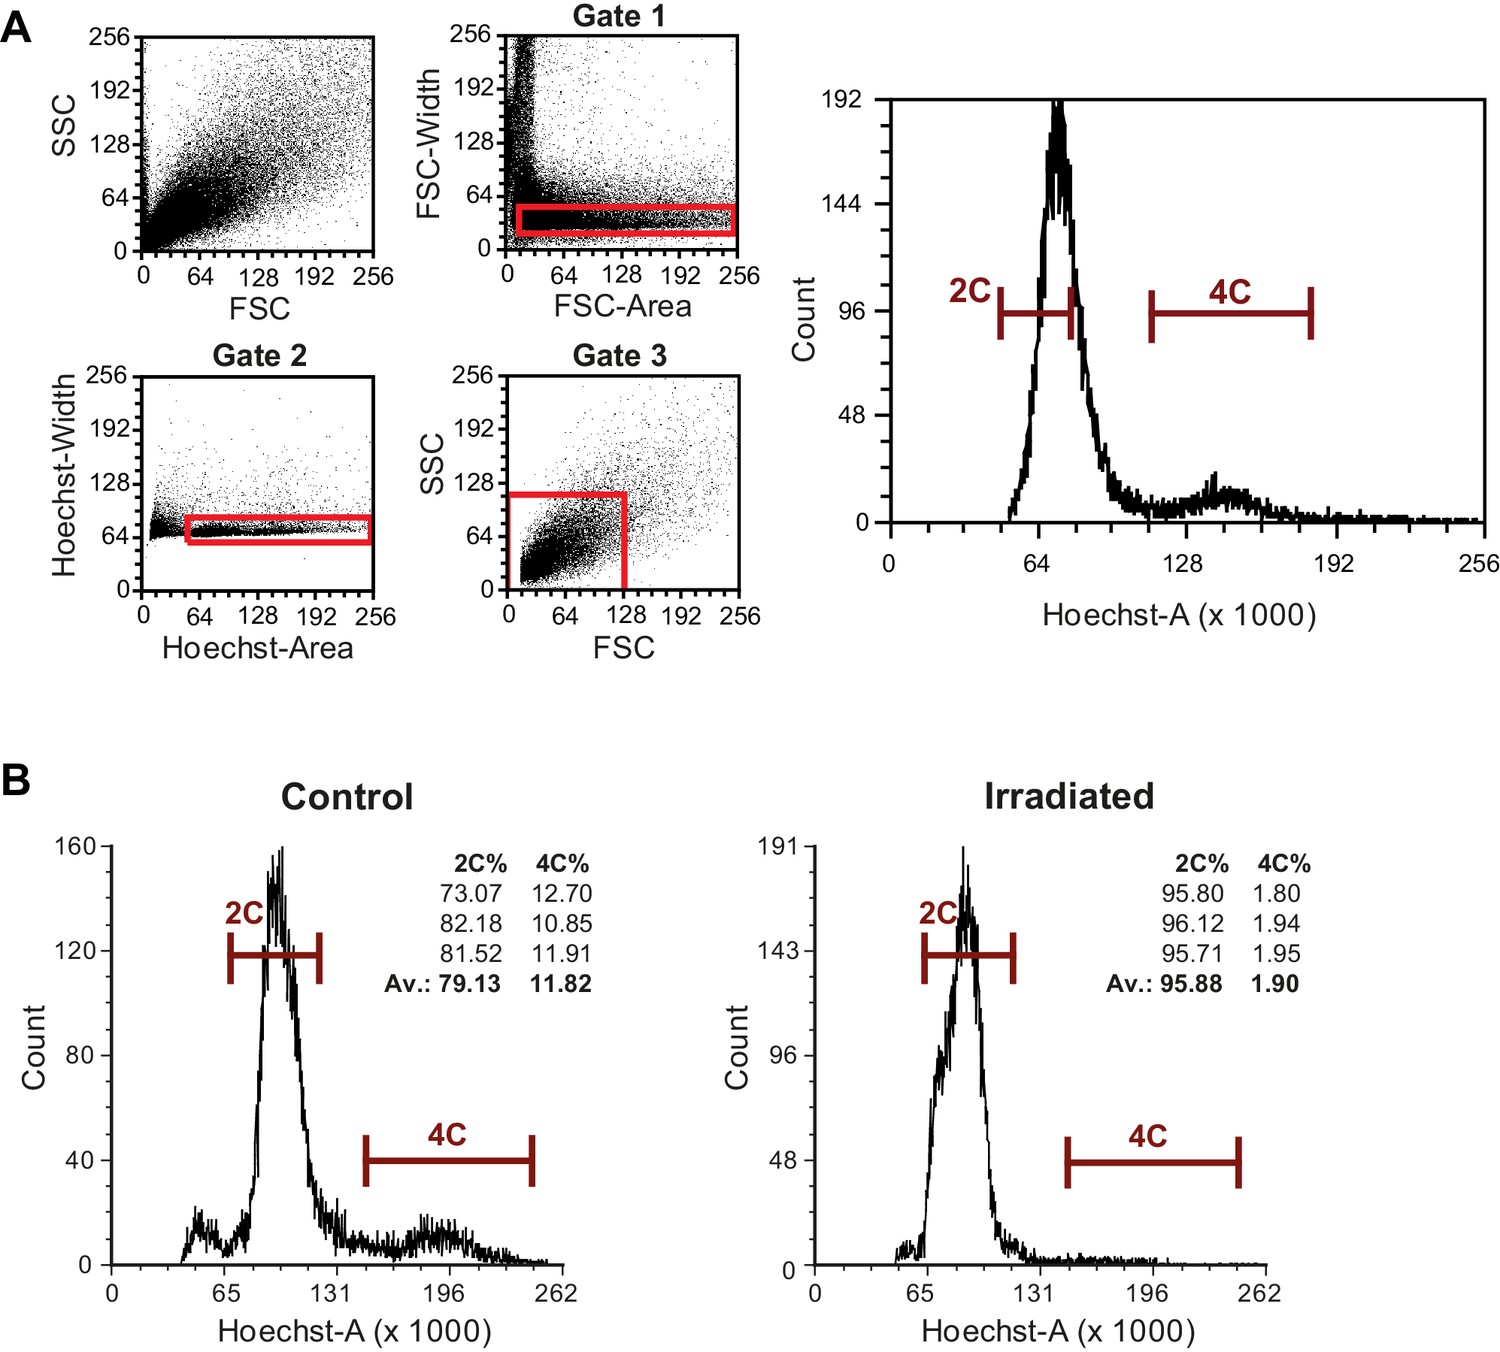
Isolation of M. lignano proliferating cell by fluorescence activated cell sorting (FACS).
(A) FACS gating strategy. The representative plots are obtained from macerated adult worms. The cell suspension was labeled with Hoechst. Forward scatter (FSC) reflects the cell size. Side scatter (SSC) reflects internal complexity. Cells are selected with three consecutive gates indicated in red. Based on FSC and SSC, no different cell populations can be distinguished. Width-area plots (Gate one and Gate 2) and FSC-SSC plot (Gate 3) are used to remove cell clusters and debris from the selection. The final selection of differentiated cells (2C) and proliferating cells (4C), as used for sorting, is indicated in the final Hoechst-plot. (B) Flow cytometry analysis of control and irradiated animals. The percentage of single Hoechst-positive cells in the 4C gate for three independent replicates and their average is show. Note the six-fold reduction in the number of cells in the 4C gate upon irradiation, indicating the specificity of the 4C gate toward proliferating cells.
Figure 1—figure supplement 5
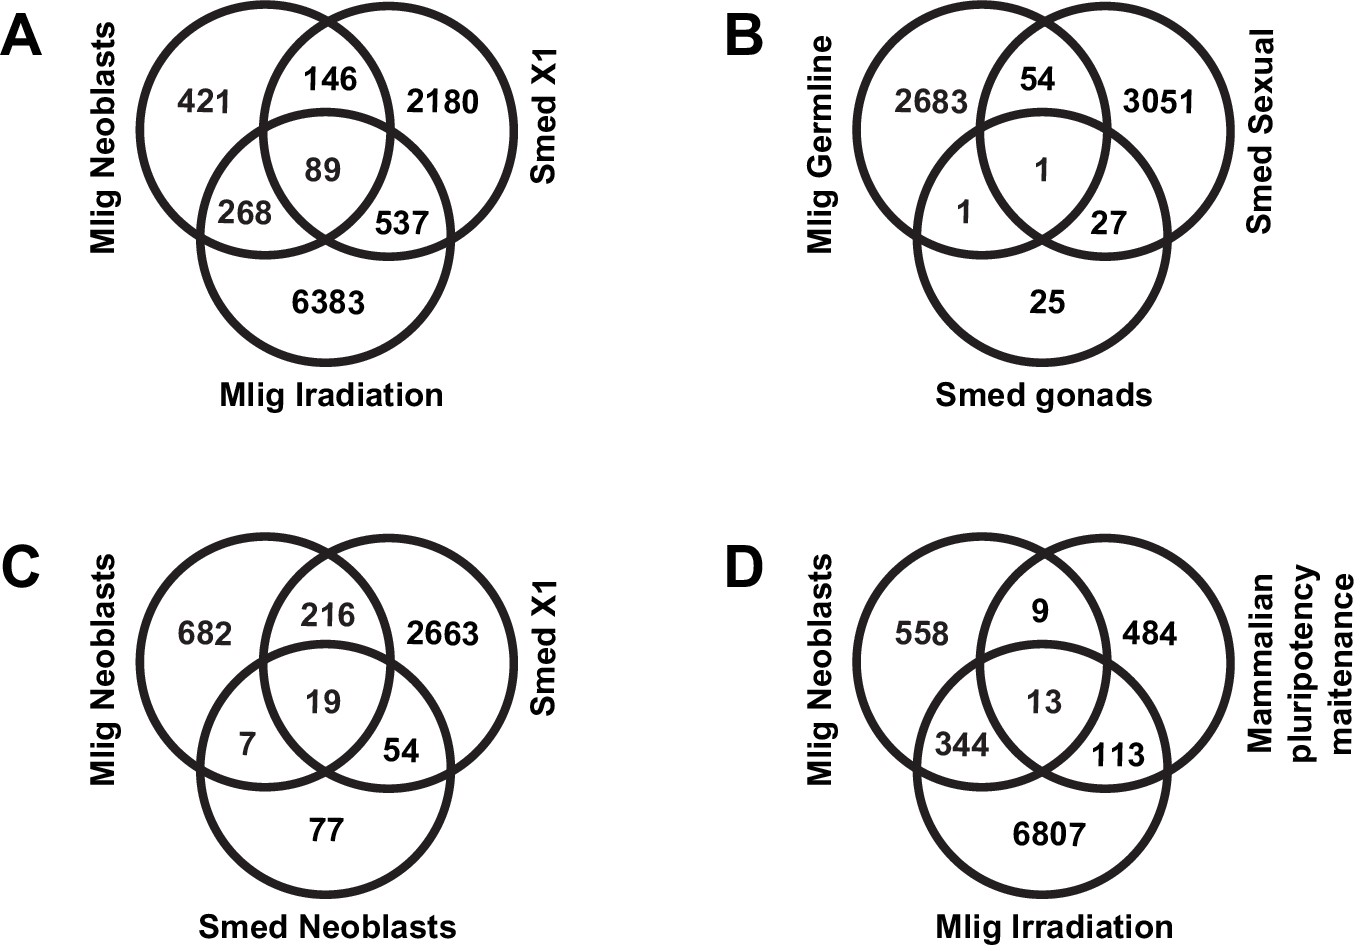
Classifications of overlaps between M. lignano genes and S. mediterranea and human homologs.
(A) M. lignano neoblasts and irradiation versus X1 S. mediterranea genes from Onal et al. (2012). (B) M. lignano germline genes versus S. mediterranea gonad genes from Wang et al. (2010) and Chong et al. (2011) and sexual biased/specific genes from Resche et al., 2012. (C) M. lignano neoblasts versus S. mediterranea neoblasts from Wurtzel et al. (2015) and X1 genes from Onal et al. (2012). (D) M. lignano neoblasts and irradiation versus human/mouse pluripotency maintenance genes from Tang et al. (2010).
Figure 2
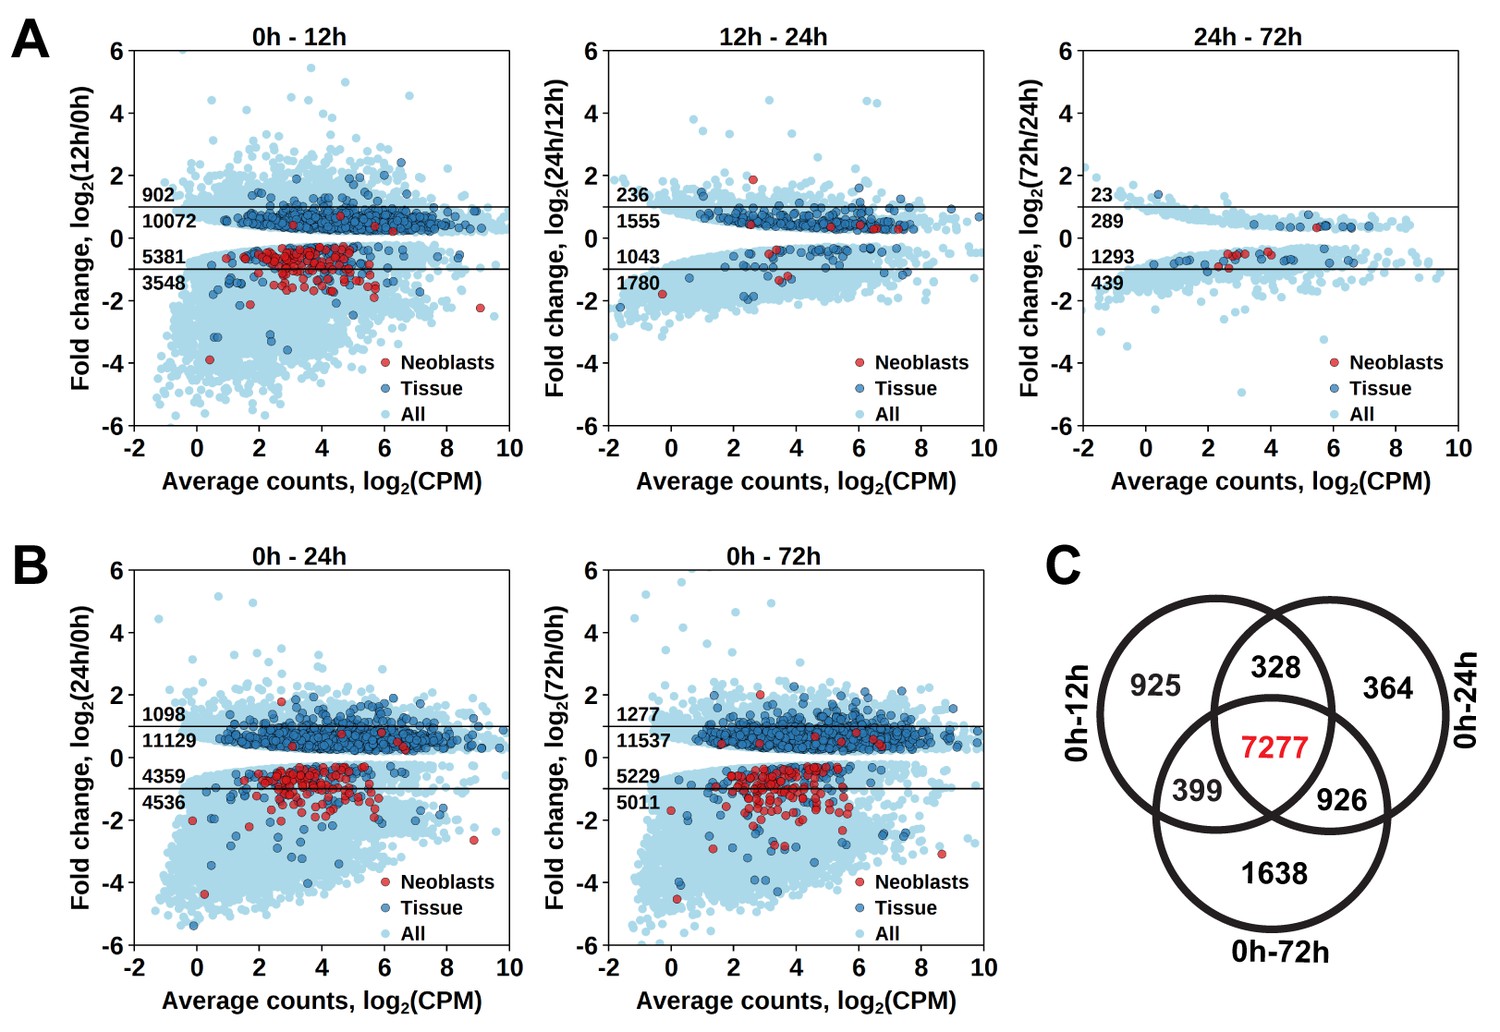
Identification of differentially expressed genes based on γ-irradiation approach.
(A) Temporal profile of differentially expressed genes between all three time points. (B) Genes differentially expressed between 0 hr and 24 hr and 0 hr and 72 hr. Classification of genes as ‘Neoblast’ and ‘Tissue’ in A and B is based on homology to S. mediterranea genes from Wurtzel et al. (2015). (C) Venn diagram representation of the number of genes enriched in proliferating cells (indicated in red).
Figure 3 with 2 supplements
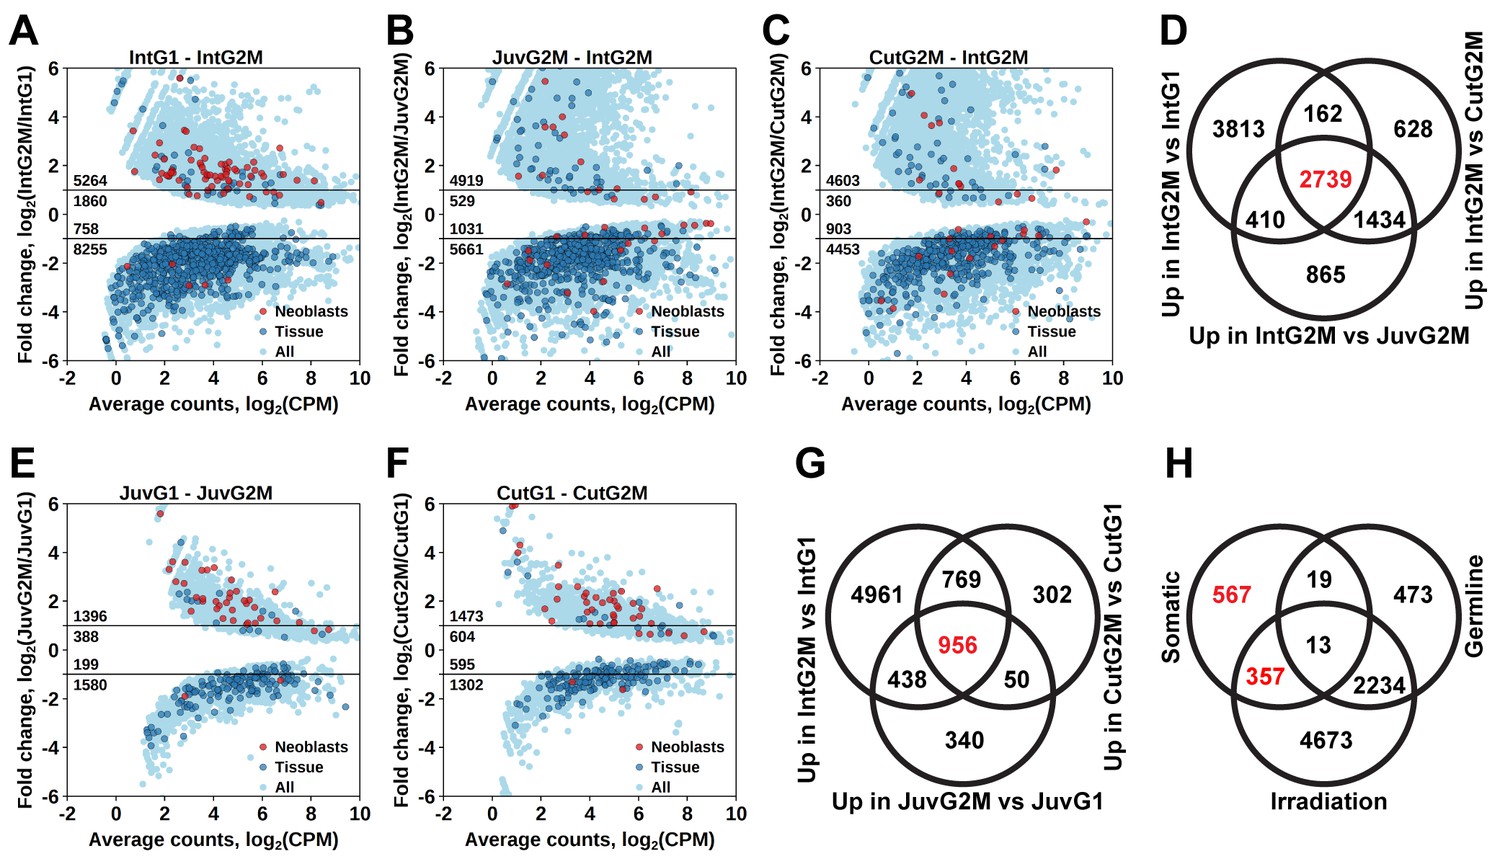
Identification of differentially expressed genes based on FACS approach.
(A) Genes differentially expressed between differentiated (G1 phase of cell cycle, 2C DNA content) and proliferating (G2/M phase of cell cycle, 4C DNA content) cells of intact worms. (B) Genes differentially expressed between proliferating cells of juvenile and intact worms. (C) Genes differentially expressed between proliferating cells of cut and intact worms. (D) Venn diagram representation of the number of genes enriched in the germline (indicated in red). (E) Genes differentially expressed between differentiated and proliferating cells of juvenile worms. (F) Genes differentially expressed between differentiated and proliferating cells of cut worms. (G) Venn diagram representation of the number of genes enriched in somatic neoblasts (indicated in red). (H) Venn diagram representation of the number of genes enriched in somatic neoblasts based on both approaches: irradiation and FACS (indicated in red). Classification of genes as ‘Neoblast’ and ‘Tissue’ in A, B, C, E, and F is based on homology to S. mediterranea genes from Wurtzel et al. (2015).
-
Figure 3—source data 1
Germline candidate genes, in situ hybridization and RNAi results.
- https://doi.org/10.7554/eLife.20607.015
-
Figure 3—source data 2
Stringent neoblast candidate genes and RNAi results.
- https://doi.org/10.7554/eLife.20607.016
Figure 3—figure supplement 1
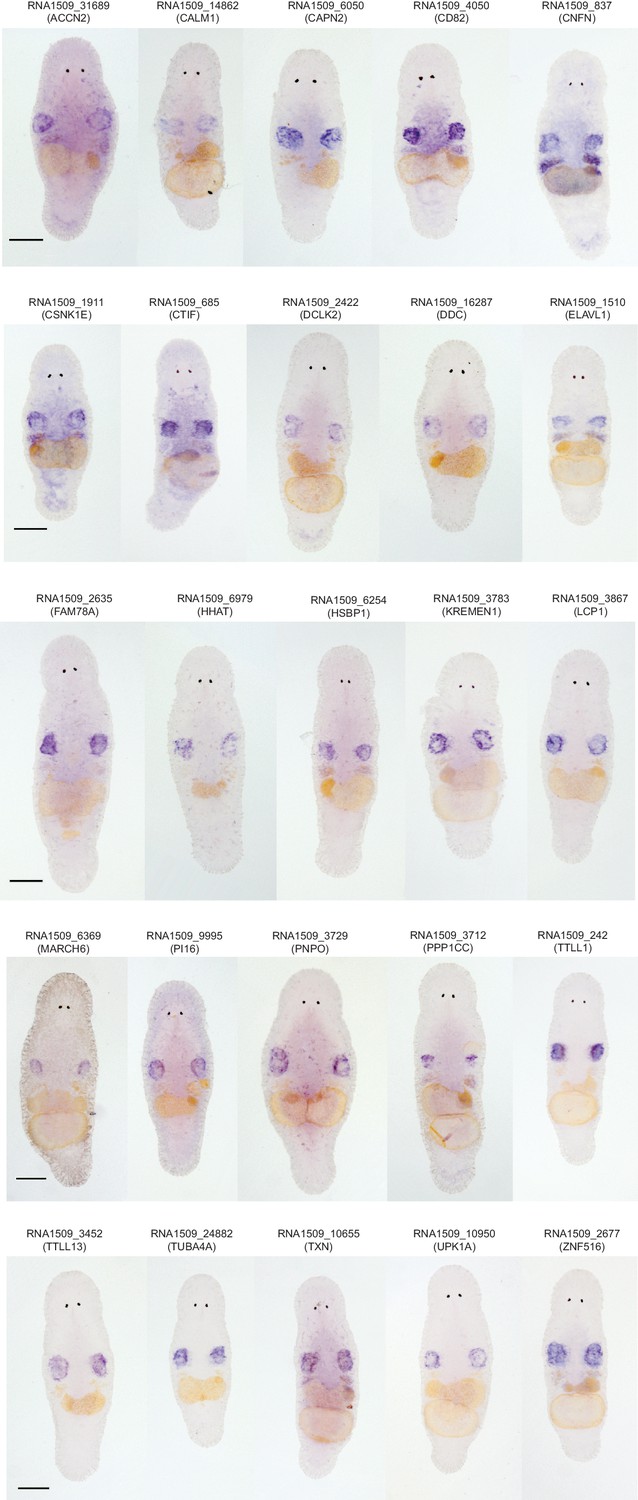
Gene expression patterns for genes enriched in the germline.
In total, 39 genes were screened using in situ hybridization. Identified patterns included testes-specific patterns, and testes and ovaries expression patterns. Scale bar 100 µm.
Figure 3—figure supplement 2
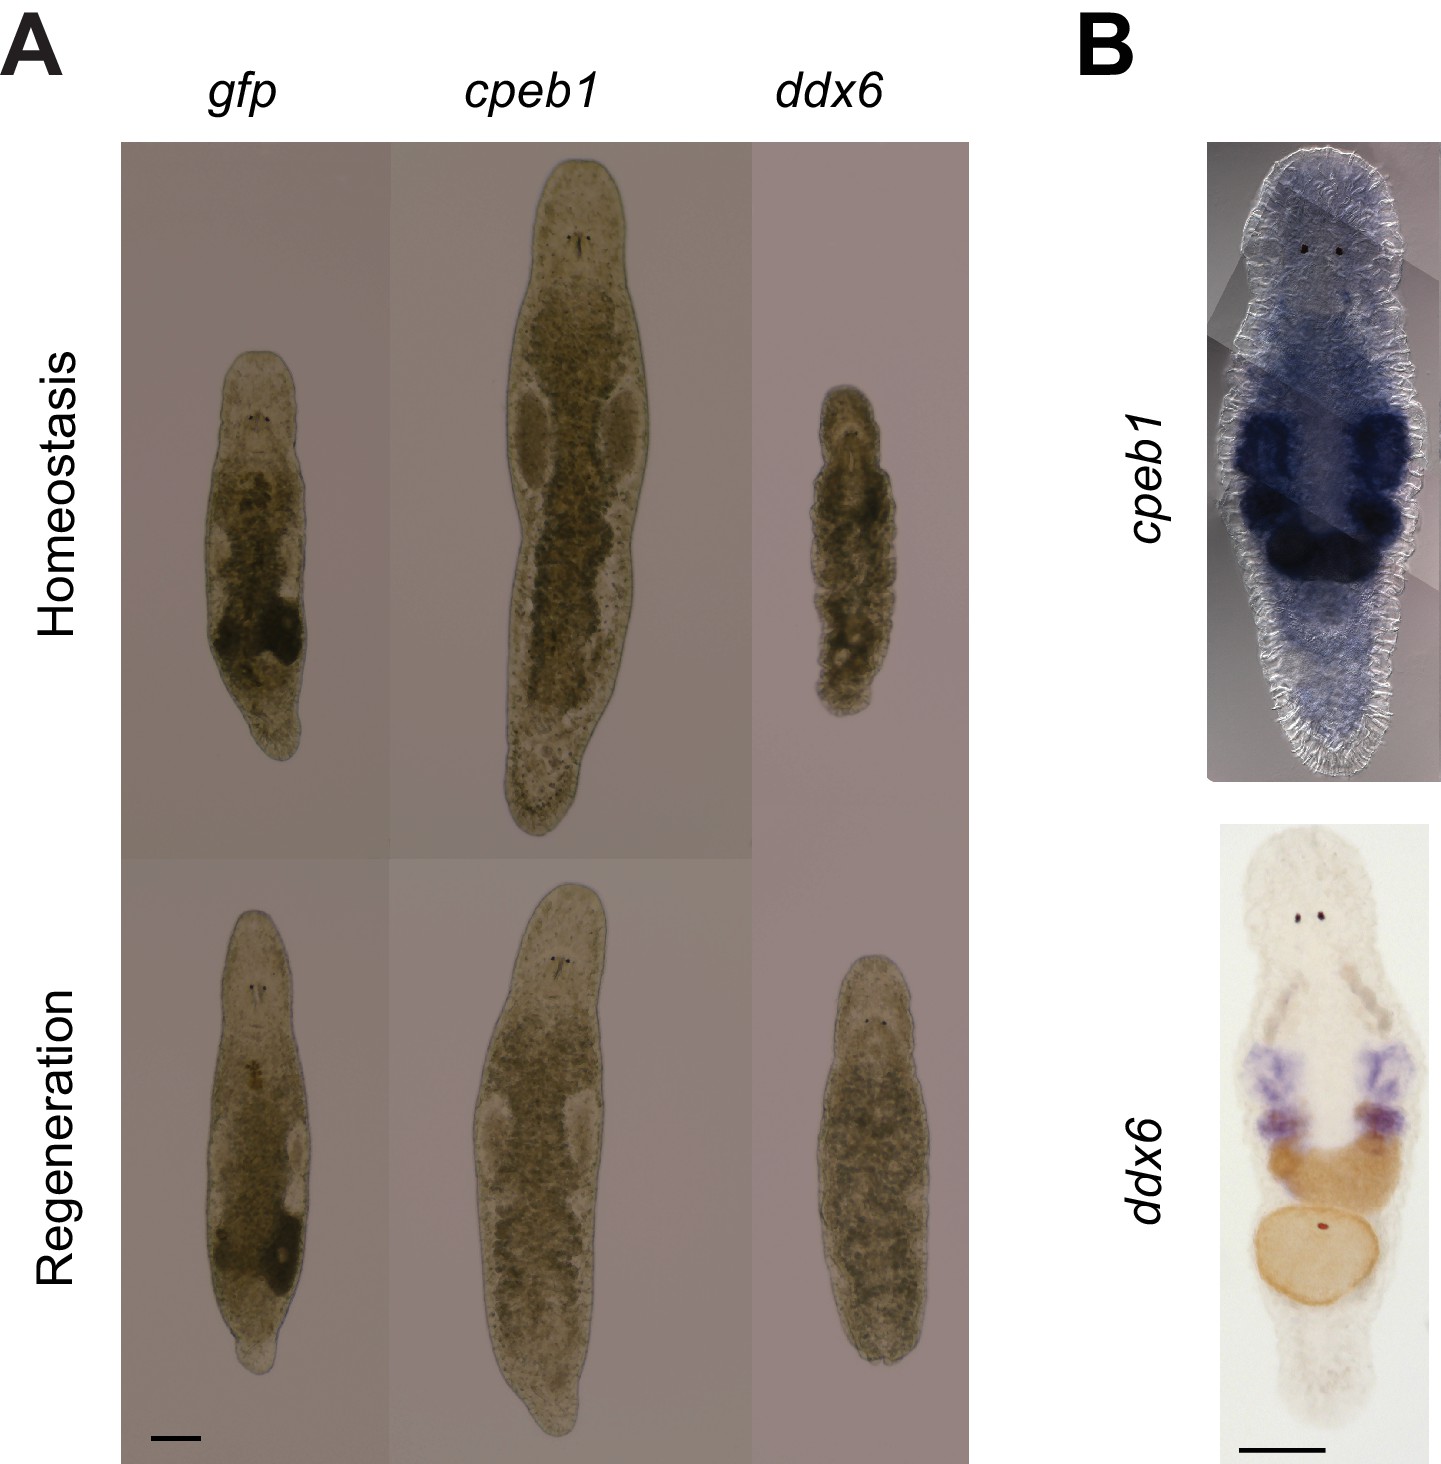
Mlig-cpeb1 and Mlig-ddx6 RNAi-phenotypes and ISH.
(A) RNAi phenotypes of Mlig-cpeb1 and Mlig-ddx6. Photos of uncut worms are taken after 21 days of treatment. Mlig-cpeb1(RNAi) results in enlarged testes and a lack of developing eggs. Mlig-ddx6(RNAi) results in disintegration of gonads and the presence of bulges in the body wall. Photos of worms of which the tail was amputated at the eighth day of treatment are taken 1 week after amputation. Mlig-cpeb1 (RNAi) can regenerate, while Mlig-ddx6 (RNAi) cannot. (B) ISH of Mlig-cpeb1 showing enriched expression in testes, ovaries, and developing eggs and ISH of Mlig-ddx6 with expression specific in the testes and ovaries. Scale bars 100 µm.
Figure 4 with 1 supplement
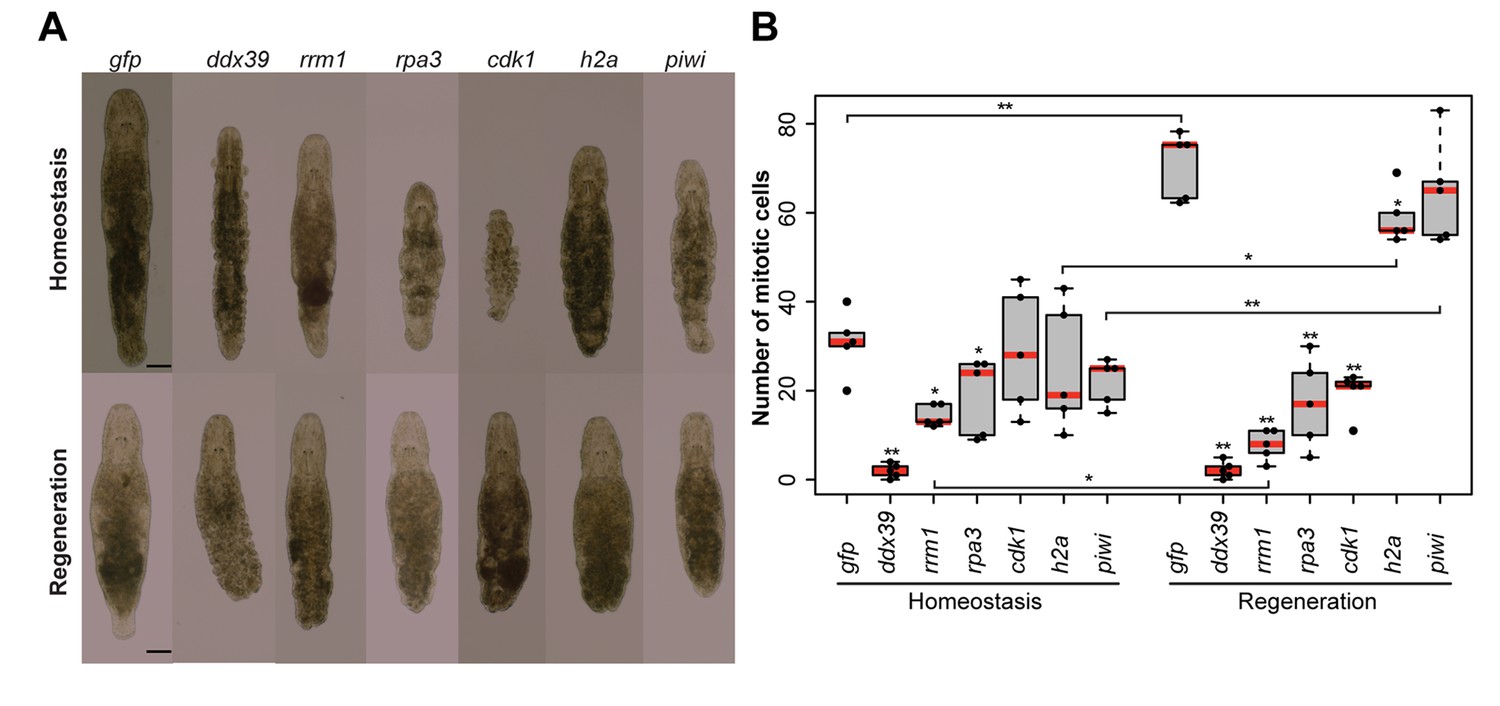
RNA interference screen.
(A) Effects of gene knockdown on homeostasis and regeneration capacity. Phenotypes often include: shrinkage of the worms, appearance of bulges, disappearance of the gonads, and the lack of regeneration after amputation of the tail. Scale bar 100 µm. (B) Effects of RNAi on the number of mitotic cells during homeostasis and regeneration. Each dot represents one animal. In the Homeostasis group, stars represent significant differences compared to gfp(RNAi) homeostasis animals. In the Regeneration group, stars represent significant differences compared to gfp(RNAi) regenerating animals. Lines represent significant differences between cut ant intact worms. *p<0.05, **p<0.001 (two sample t-test).
Figure 4—figure supplement 1
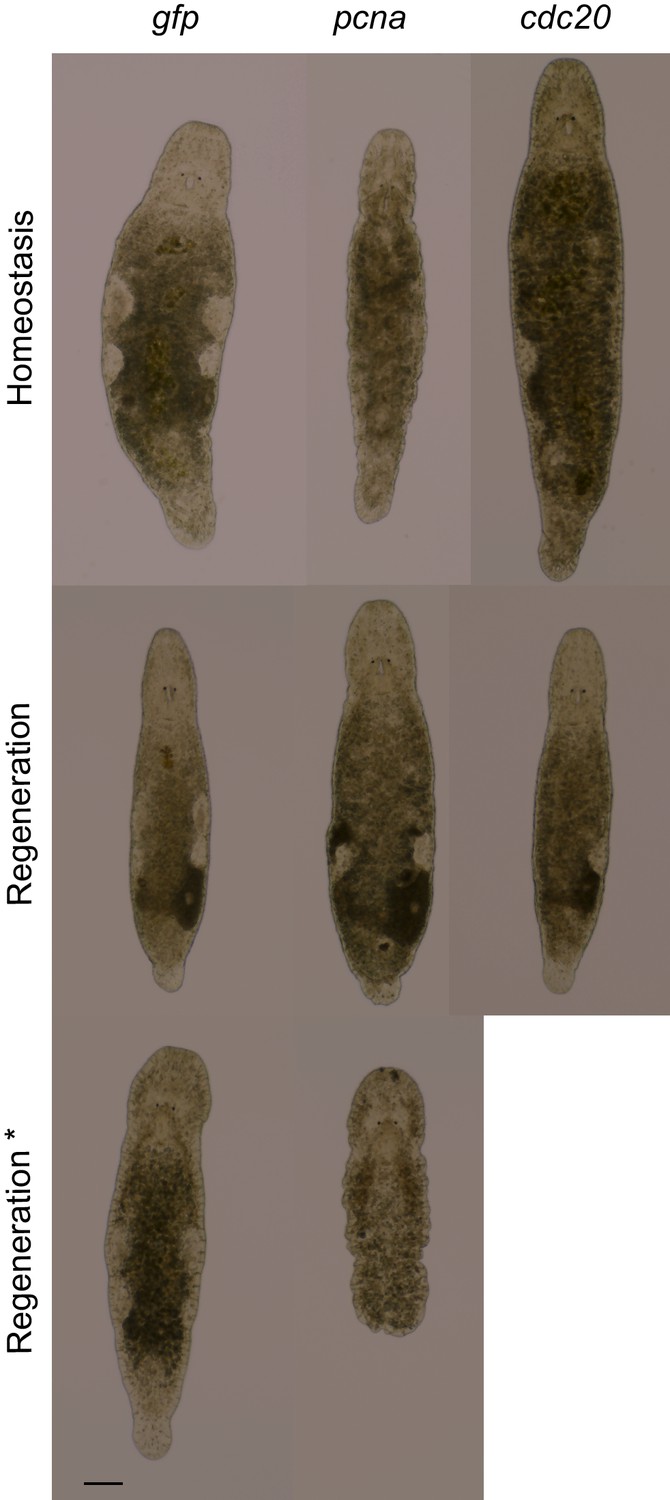
Mlig-pcna and Mlig-cdc20 RNAi-phenotypes.
Homeostasis represents intact worms after 21 days of treatment. Regeneration represents worms of which the tail was amputated at the eighth day of treatment. Photos are taken 1 week later. Regeneration* represent worms of which the tail was amputated at the 21st day of treatment. Photos are taken 4 days later. The gfp(RNAi) worms have a normal morphology and can always regenerate the tail. In the case of Mlig-pcna(RNAi), gonads disintegrate and worms develop small bulges in the epidermis. While they can regenerate a small tail when cut after 1 week of treatment, they cannot when cut after 3 weeks of treatment. In case of Mlig-cdc20 (RNAi), the gonads slowly disintegrate, starting with the testes. Worms are able to regenerate a tail. Scale bar 100 µm.
Figure 5
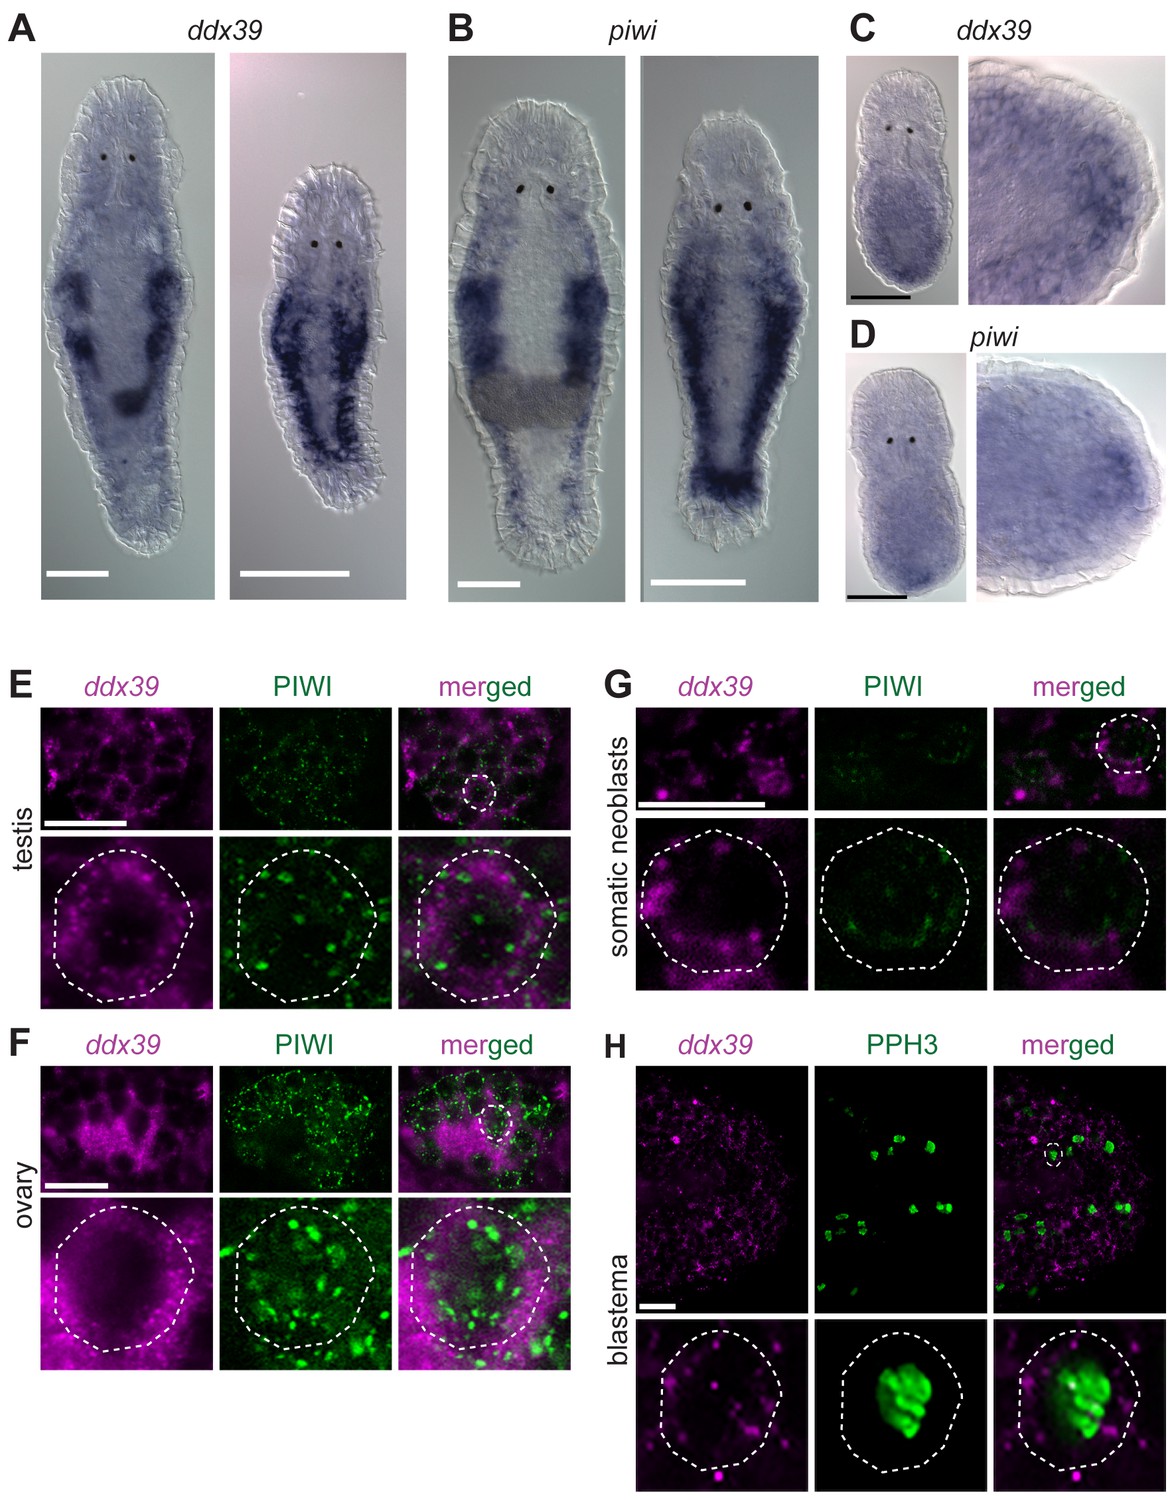
Mlig-piwi and mlig-ddx39 expression patterns.
(A,B) WISH expression pattern in adult and juvenile worms for Mlig-ddx39 and Mlig-piwi. Both genes are expressed in the testes, ovaries, developing eggs and somatic stem cells located in bilateral bands. (C,D) WISH expression patterns for Mlig-ddx39 and Mlig-piwi in the blastema, 12 hr post-amputation. (E–G). Mlig-ddx39 FISH and Macpiwi antibody double labeling of testis, ovary, and somatic neoblasts. (H) Mlig-ddx39 FISH and mitotic phospho H3 antibody double labeling of the wound site, 48 hr post-amputation. Individual cells are outlined and magnified in the second rows in panels E-H. Scale bars: 100 µm (A–D) and 25 µm (E–H).
Tables
Table 1
Properties of MLRNA150904 transcriptome assembly.
Number of transcripts | 60,180 |
Total length, nt | 95,589,662 |
Average transcript length, nt | 1588 |
Shortest transcript, nt | 100 |
Longest transcript, nt | 29,807 |
CEG homologs* | 247 out of 248 |
Transspliced transcripts | 6167 |
TransRate score† | 0.4367 |
Good TransRate transcripts | 86% |
Human homolog genes | 8458 |
PFAM domains | 3503 |
S. mediterranea cell type-specific gene homologs‡ | 1697 |
-
*Core Eukaryotic genes according Parra et al. (2009).
-
†Assembly quality score according to Smith-Unna et al. (2016).
-
‡Cell-type-specific genes from Wurtzel et al. (2015).
Download links
A two-part list of links to download the article, or parts of the article, in various formats.
Downloads (link to download the article as PDF)
Open citations (links to open the citations from this article in various online reference manager services)
Cite this article (links to download the citations from this article in formats compatible with various reference manager tools)
Transcriptional signatures of somatic neoblasts and germline cells in Macrostomum lignano
eLife 5:e20607.
https://doi.org/10.7554/eLife.20607


