Design principles of autocatalytic cycles constrain enzyme kinetics and force low substrate saturation at flux branch points
- The Weizmann Institute of Science, Israel
- Memorial Sloan Kettering Cancer Center, United States
- ETH Zurich, Switzerland
Figures
Figure 1
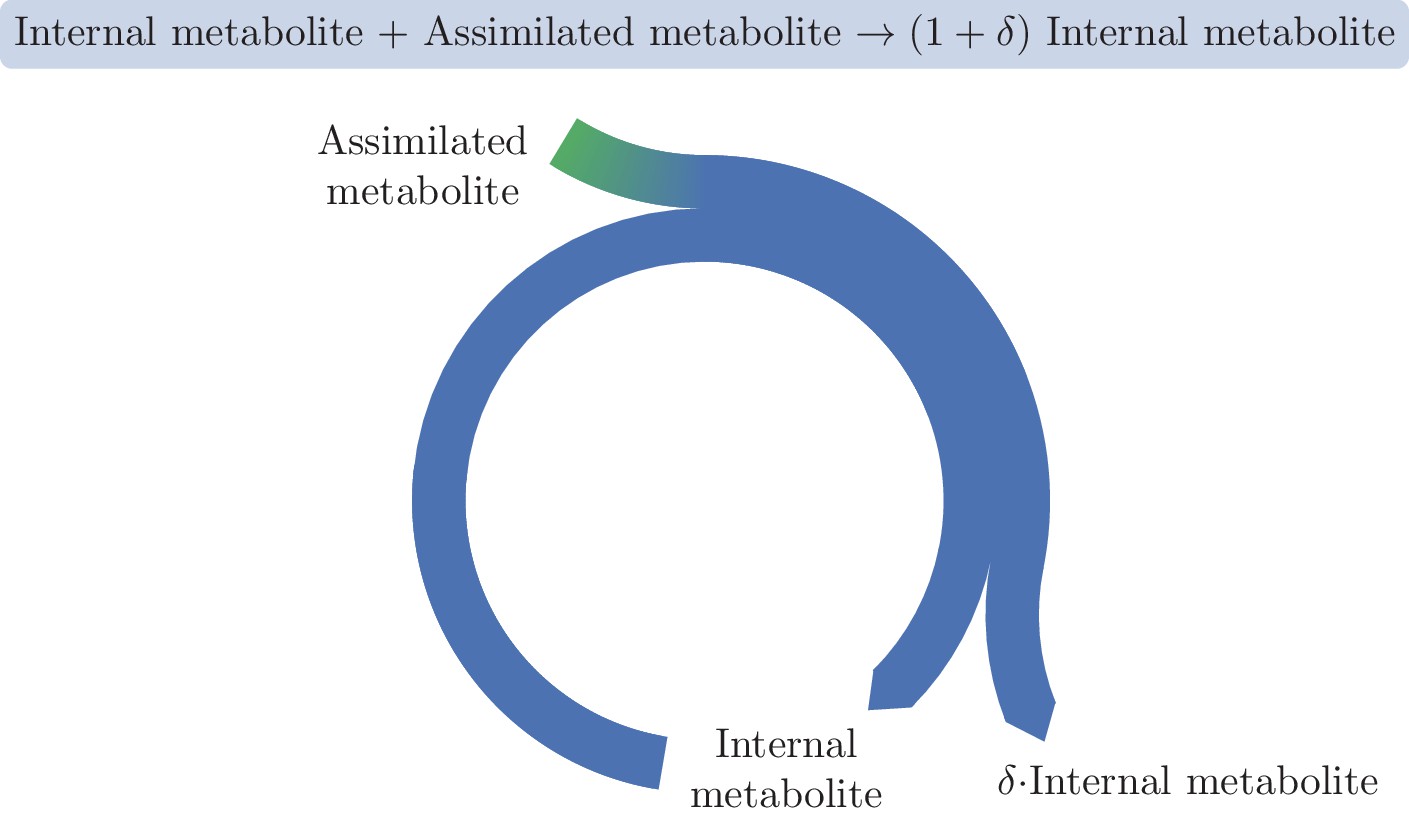
A basic autocatalytic cycle requires an internal metabolite to be present in order to assimilate the external metabolite into the cycle, increasing the amount of the internal metabolite by some amount, .
https://doi.org/10.7554/eLife.20667.003
Figure 2 with 2 supplements

Three representative autocatalytic cycles in central carbon metabolism: (I) The Calvin-Benson-Bassham cycle (yellow); (II) The glyoxylate cycle (magenta); (III) A cycle using the phosphotransferase system (PTS) to assimilate glucose (cyan).
Assimilation reactions are indicated in green. Arrow width in panels represent the relative carbon flux.
Figure 2—figure supplement 1
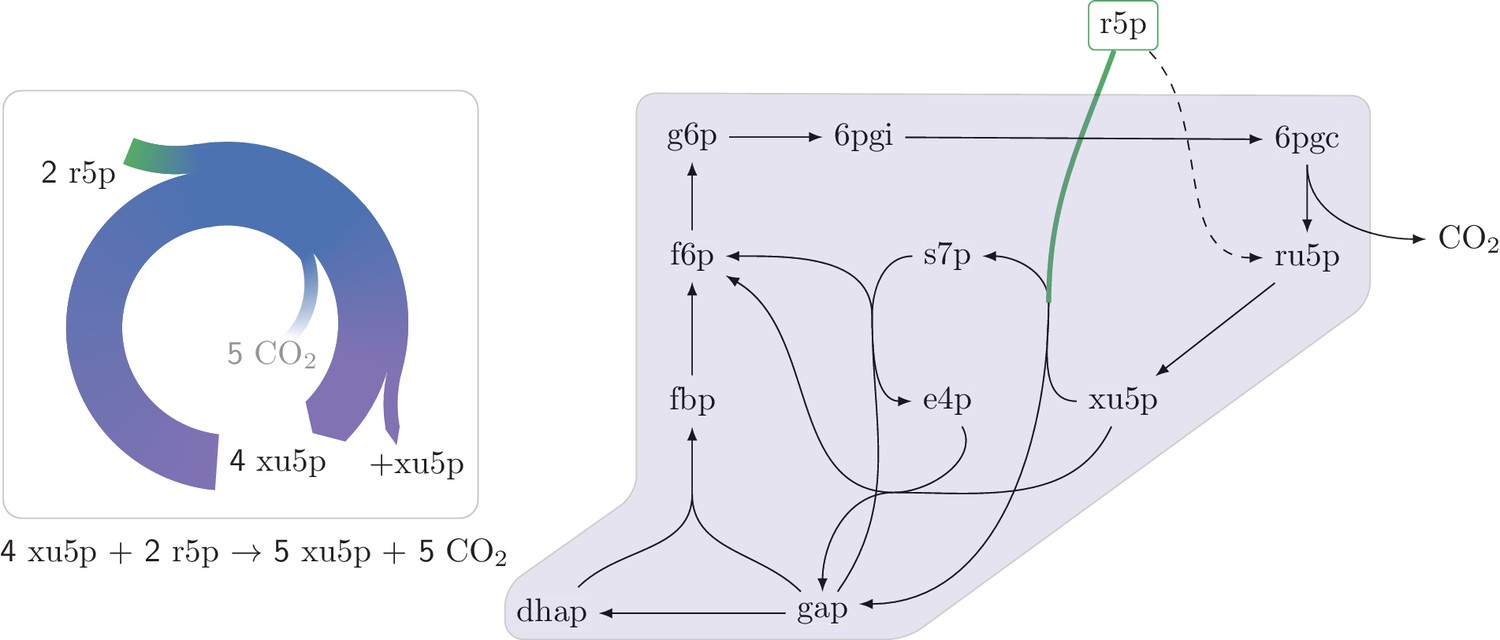
An autocatalytic cycle assimilating ribose-5-phosphate using the pentose phosphate pathway.
This cycle contains a direct input reaction (rpi, dashed line) allowing the cycle to operate with broader sets of kinetic parameters than cycles missing this feature. A knockout strain where rpi is eliminated, does not grow under ribose despite having the theoretical ability to do so.
Figure 2—figure supplement 2
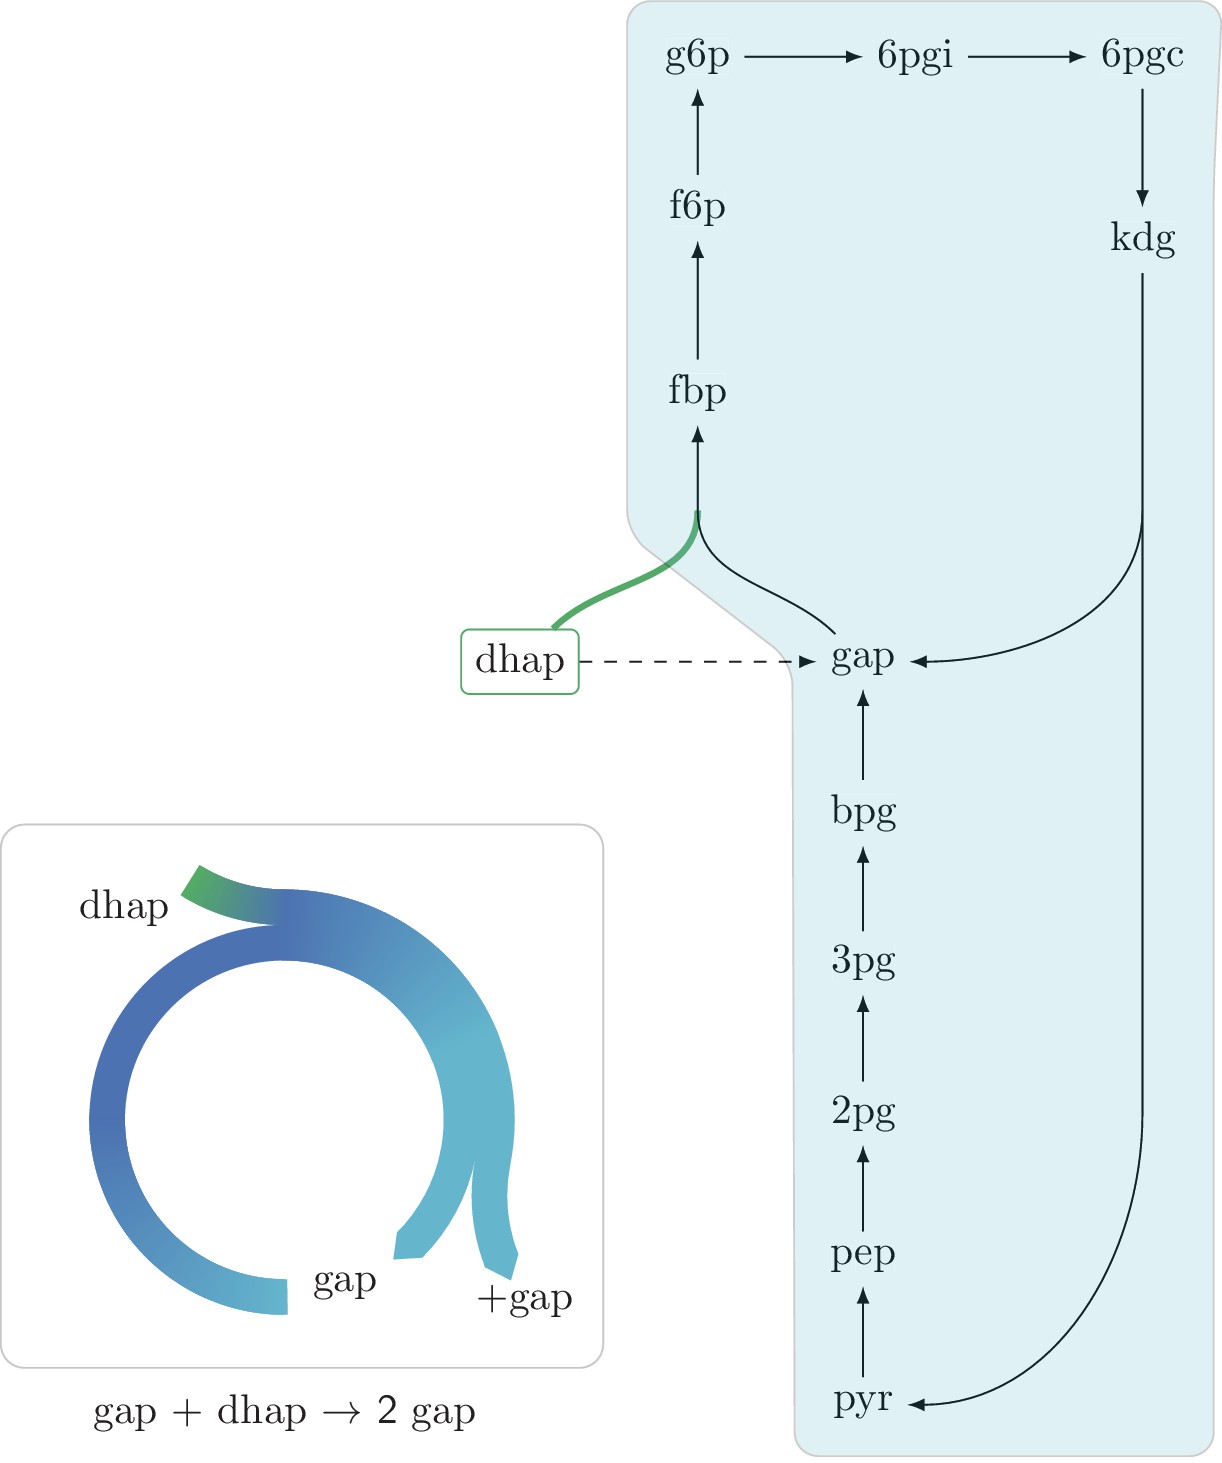
An autocatalytic cycle assimilating dhap while consuming gap using the fba reaction in the gluconeogenic direction.
This cycle contains a direct input reaction (tpi, dashed line) allowing the cycle to operate with broader sets of kinetic parameters than cycles missing this feature. According to fluxomics data this cycle does not operate in vivo as a more energy efficient alternative in growth under glycerol is to use the tpi reaction and proceed in the glycolitic direction in the lower part of glycolysis. A knockout strain where tpi reaction is eliminated, does not grow under glycerol despite having the theoretical ability to do so.
Figure 3
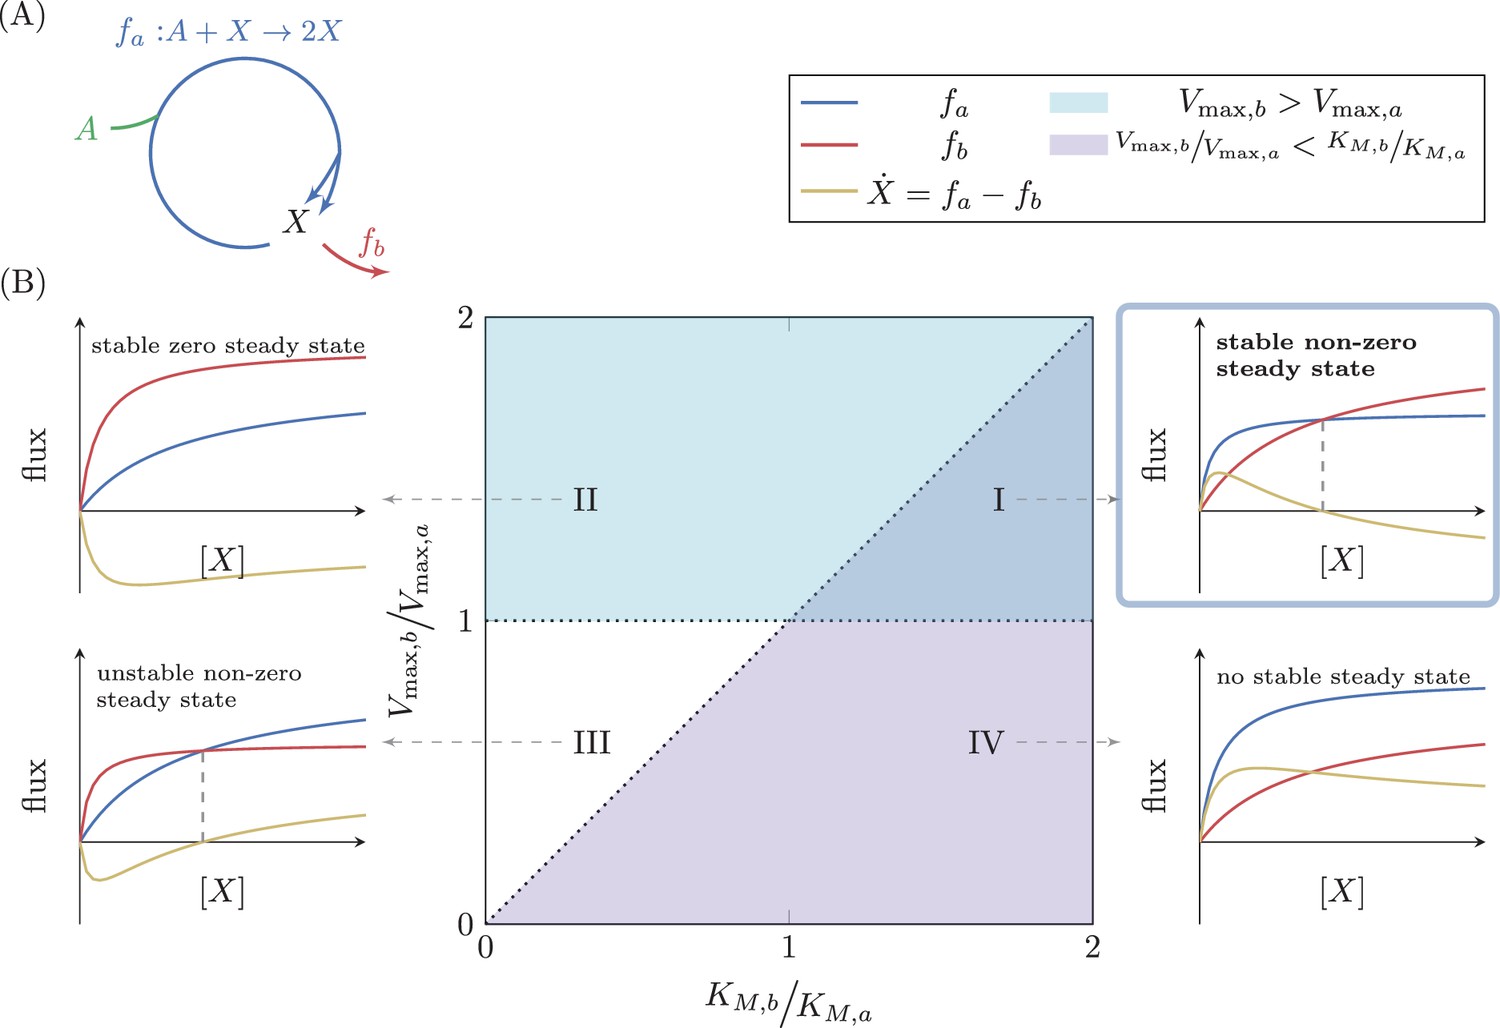
Analysis of a simple autocatalytic cycle.
(A) A simple autocatalytic cycle induces two fluxes, and as a function of the concentration of . These fluxes follow simple Michaelis-Menten kinetics. A steady state occurs when , implying that . The cycle always has a steady state (i.e. ) at . The slope of each reaction at is . A steady state is stable if at the steady state concentration . (B) Each set of kinetic parameters, determines two dynamical properties of the system: If , then a stable steady state concentration must exist, as for high concentrations of the branching reaction will reduce the concentration of (cyan domain, cases (I) and (II)). If , implying that , then zero is a non-stable steady state concentration as if is slightly higher than zero, the autocatalytic reaction will carry higher flux, further increasing the concentration of (magenta domain, cases (I) and (IV)). At the intersection of these two domains a non-zero, stable steady state concentration exists, case (I).
Figure 4

Analysis of an autocatalytic cycle with input flux.
(A) The effect of a fixed input flux, , on the possible steady states of a simple autocatalytic cycle. A steady state occurs when . If then there is always a single stable steady state (I). If then there can either be no steady states (II), or two steady states where the smaller one is stable (III).
Figure 5
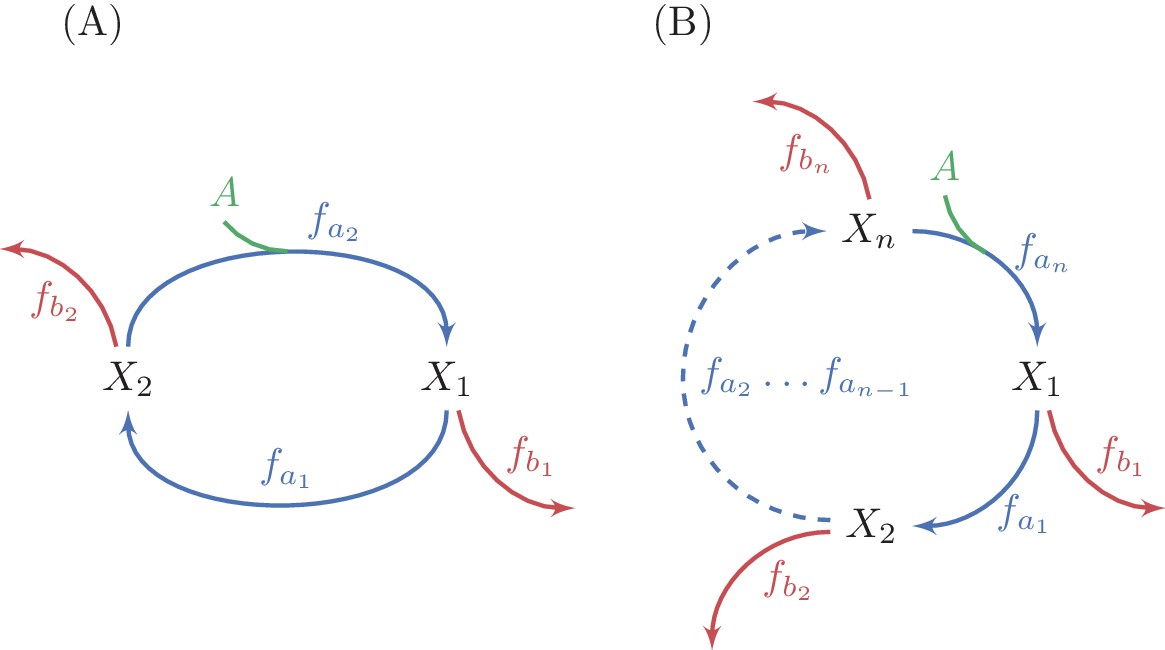
Generalization of analysis to multiple-reaction autocatalytic cycles with a single assimilating reaction.
(A) A two reaction system. (B) A generic -reaction system. The system is at steady state when the total consumption of intermediate metabolites by the branch reactions is equal to the flux through the autocatalytic reaction, because the autocatalysis is in a 1:2 ratio. A sufficient condition for the stability of a steady state in these systems is that the derivative of at least one branch reaction with respect to the substrate concentration is larger than the derivative of the equivalent autocatalytic reaction at the steady state concentration. Given the connection between derivatives of fluxes and saturation levels of reactions (see methods), this condition implies that at a stable steady state, the saturation level of at least one branch reactions is smaller than the saturation level of the corresponding autocatalytic reaction.
Figure 6
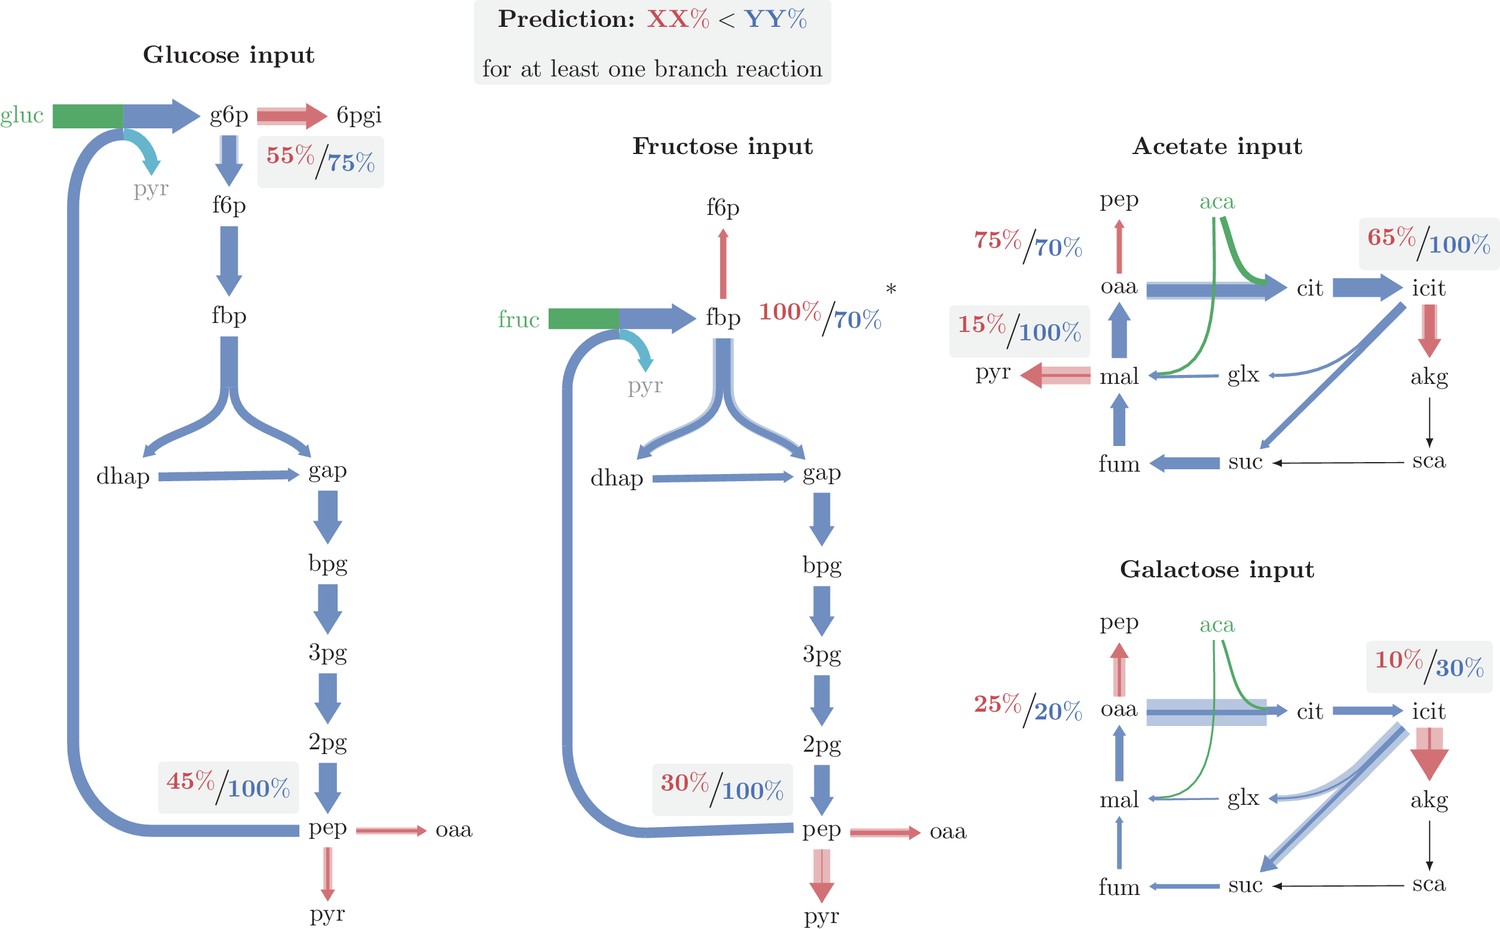
Major branch points and relative enzyme saturation in operating autocatalytic cycles.
Solid arrow width represents carbon flux per unit time. Shaded arrow width represents the maximal carbon flux capacity per unit time, given the expression level of the catalyzing enzyme. In all cases there is enough excess capacity in the branching reactions to prevent the cycle from overflowing. A flux from pep to biomass was neglected in growth under glucose and fructose. Only in one out of the nine branch points observed (the branch point at fbp in growth under fructose), the outgoing reaction is significantly more saturated than the autocatalytic reaction. (*) A branch point at which the branching reaction is more saturated than the autocatalytic reaction, which may result from neglecting fructose transport directly as f6p when deriving fluxes (see text).
Additional files
-
Supplementary file 1
Contains the tables used in the data analysis in this work.
The ‘contents’ sheet includes the description of the different tables and is provided here as well: Fluxes source: The metabolic fluxes sheet from Data S1 in Gerosa et al. (2016). Cell size source: The cell sizes used for calculations as taken from Supplementary tables, Table ‘Content and abbreviations’ in Schmidt et al. (2016). Protein abundance: Protein abundance data from Supplementary tables, Table S6 in Schmidt et al. (2016). Reaction-Protein mapping: Mapping between reactions and genes of catalyzing enzymes. lux per enzyme: Calculation of the flux per enzyme for all the reactions listed in the ‘Reaction-Protein mapping’ table. Reaction Saturation: Estimated saturation of enzymes across conditions. Non autocatalytic cycles reaction saturation: Comparison of saturation levels of branch versus cycle reactions for non-autocatalytic cycles. Allosteric regulation: Listing allosteric interactions between autocatalytic components.
- https://doi.org/10.7554/eLife.20667.011
Download links
A two-part list of links to download the article, or parts of the article, in various formats.
Downloads (link to download the article as PDF)
Open citations (links to open the citations from this article in various online reference manager services)
Cite this article (links to download the citations from this article in formats compatible with various reference manager tools)
Design principles of autocatalytic cycles constrain enzyme kinetics and force low substrate saturation at flux branch points
eLife 6:e20667.
https://doi.org/10.7554/eLife.20667


