Targeted deletion of AKAP7 in dentate granule cells impairs spatial discrimination
- University of Washington School of Medicine, United States
- Albert Einstein College of Medicine, United States
Figures
Figure 1 with 2 supplements

AKAP7 is highly expressed in the dentate gyrus.
(A) Map of Akap7 gene (introns not to scale) showing engineered loxP sites and location of primer sets to distinguish between long and short isoforms. AKAP7 proteins resulting from alternate splicing showing phosphoesterase (PE), PKA-RII–binding (RII), and modified leucine zipper (LZ) domains and N-terminal lipid modifications on AKAP7α. (B) Immunoblot of hippocampal lysates shows that the AKAP7α protein is expressed at much higher levels than AKAP7γ. The protein expression of PKA-RIIβ is not reduced in AKAP7 KO hippocampus. Transcription factor SP1 was used as a loading control. Immunoblots were done using the hippocampus from one animal and replicated three or more times. (C) RiboTag analysis of DG-specific transcripts compared to total hippocampal transcripts shows enrichment for AKAP7α and de-enrichment of AKAP7γ/δ and AKAP5. (D) Immunofluorescence microscopy of WT or KO hippocampus with an antibody against AKAP7 reveals expression in DGCs but not areas CA1 or CA3. (E) Immunofluorescence microscopy with an antibody against the presynaptic zinc transporter-3 (ZNT3) shows normal morphology of the mossy fiber field and hippocampal layering in KO compared to WT. Images are representative of multiple slices from ≥3 mice.
Figure 1—figure supplement 1

AKAP7 is widely expressed throughout the brain and in some regions appears restricted to specific neurons.
(A) Immunofluorescence microscopy of AKAP7 as in Figure 1C shows strong, diffuse expression in striatum (STR), thalamus (TH), and cortex (CTX). Expression in cerebellum (CB) is restricted to the granule cell layer (gcl). Non-specific staining is seen in nuclei in KO sections. LII-LVI, cortical layers; ml, molecular layer. (B) Immunoblot of brain region lysates as in Figure 1B showing expression of AKAP7 throughout the brain.
Figure 1—figure supplement 2
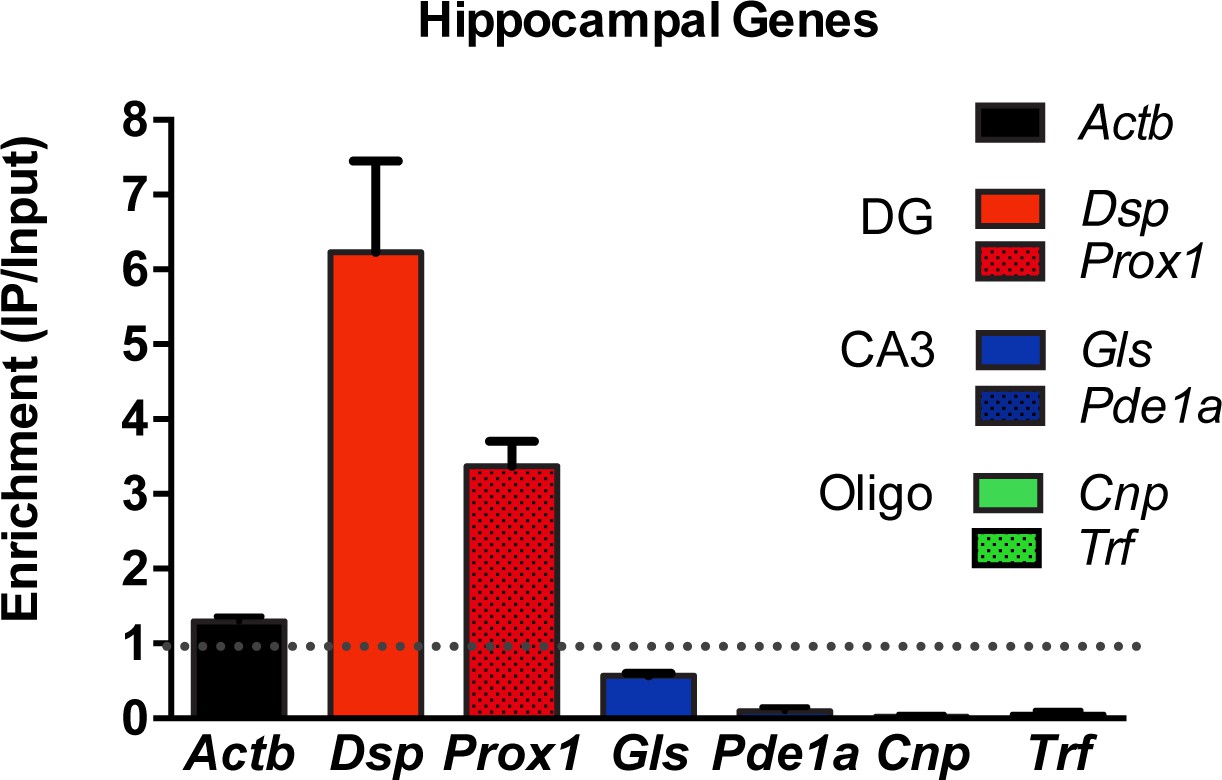
Validation of DG-specificity of RiboTag Immunoprecipitation.
RiboTag analysis of actively transcribed mRNA transcripts immunoprecipitated from the DG neurons of Pomc-Cre;Rpl22ha+/- mice were quantified by qRT-PCR (n = 4, mean +/- SEM). Demonstration of enrichment of genes known to be specific to DG neurons compared to de-enrichment of CA3- or Oligodendrocyte-specific transcripts. DG-specific: Desmoplakin (Dsp), Proximal 1 (Prox1). CA3-specific: Glutaminase (Gls), Phosphodiesterase 1a (Pde1a). Oligodendrocyte-specific: CNPase (Cnp), Transferrin (Trf) and β-actin (Actb).
Figure 2
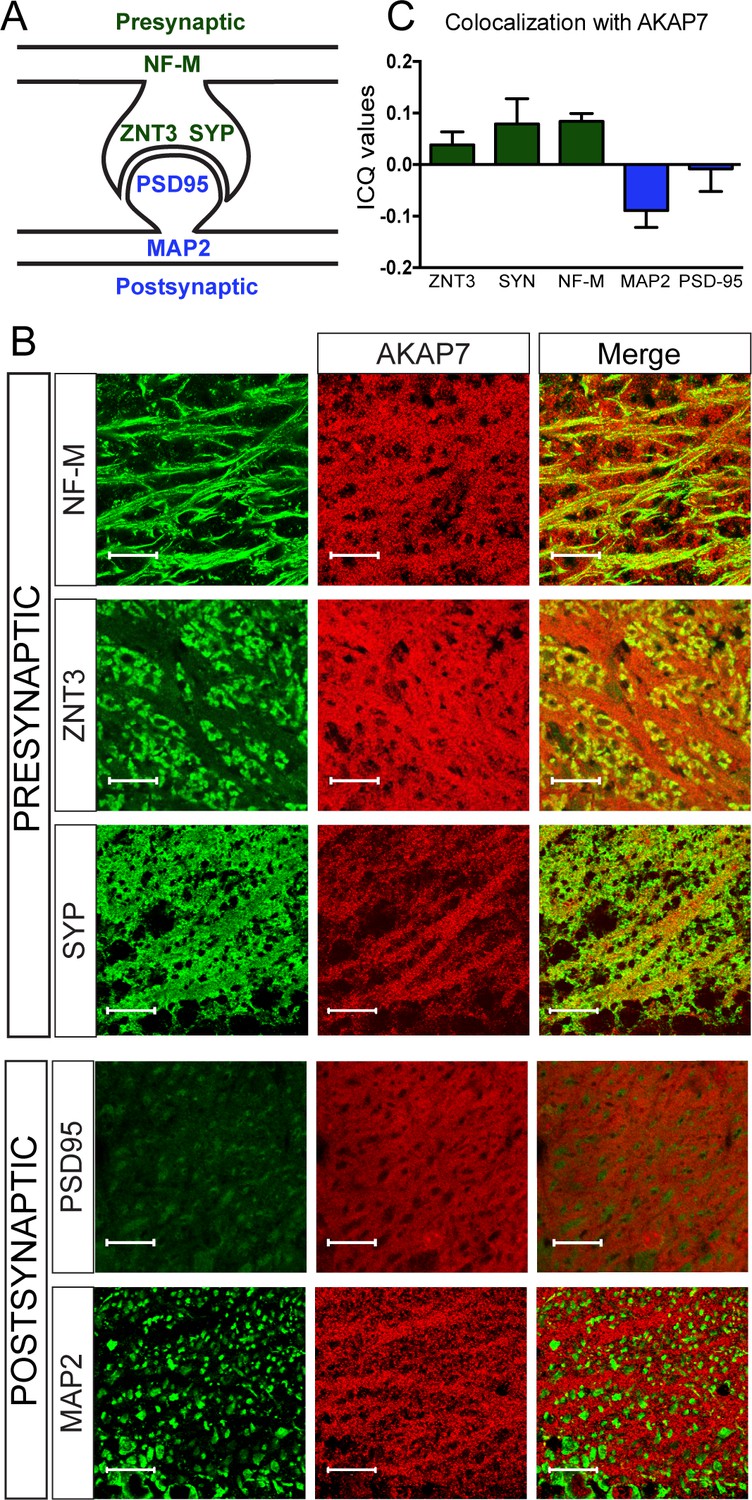
AKAP7 localizes throughout the mossy fiber axons and terminals.
(A) Model of the localization of pre- and postsynaptic proteins. (B) Confocal images of stratum lucidum show AKAP7 distributed throughout mossy fiber axons and boutons but not in postsynaptic compartments. Top: AKAP7 in red, Presynaptic markers: neurofilament-M (NF-M), zinc transporter 3 (ZnT3), synaptophysin (SYP). Bottom: Post-synaptic markers: post-synaptic density protein-95 (PSD95), or microtubule-associated protein 2 (MAP2) in green. Images are representative of multiple slices from ≥3 mice. Scale bars, 20 µm. (C) Colocalization analysis of regions of interest within stratum lucidum using the Coloc2 plug-in from Fiji (ImageJ) as described in Materials and methods. Intensity correlation quotient (ICQ) values between 0 and 0.5 indicate some colocalization and values between 0 and −0.5 indicate segregated staining.
Figure 3
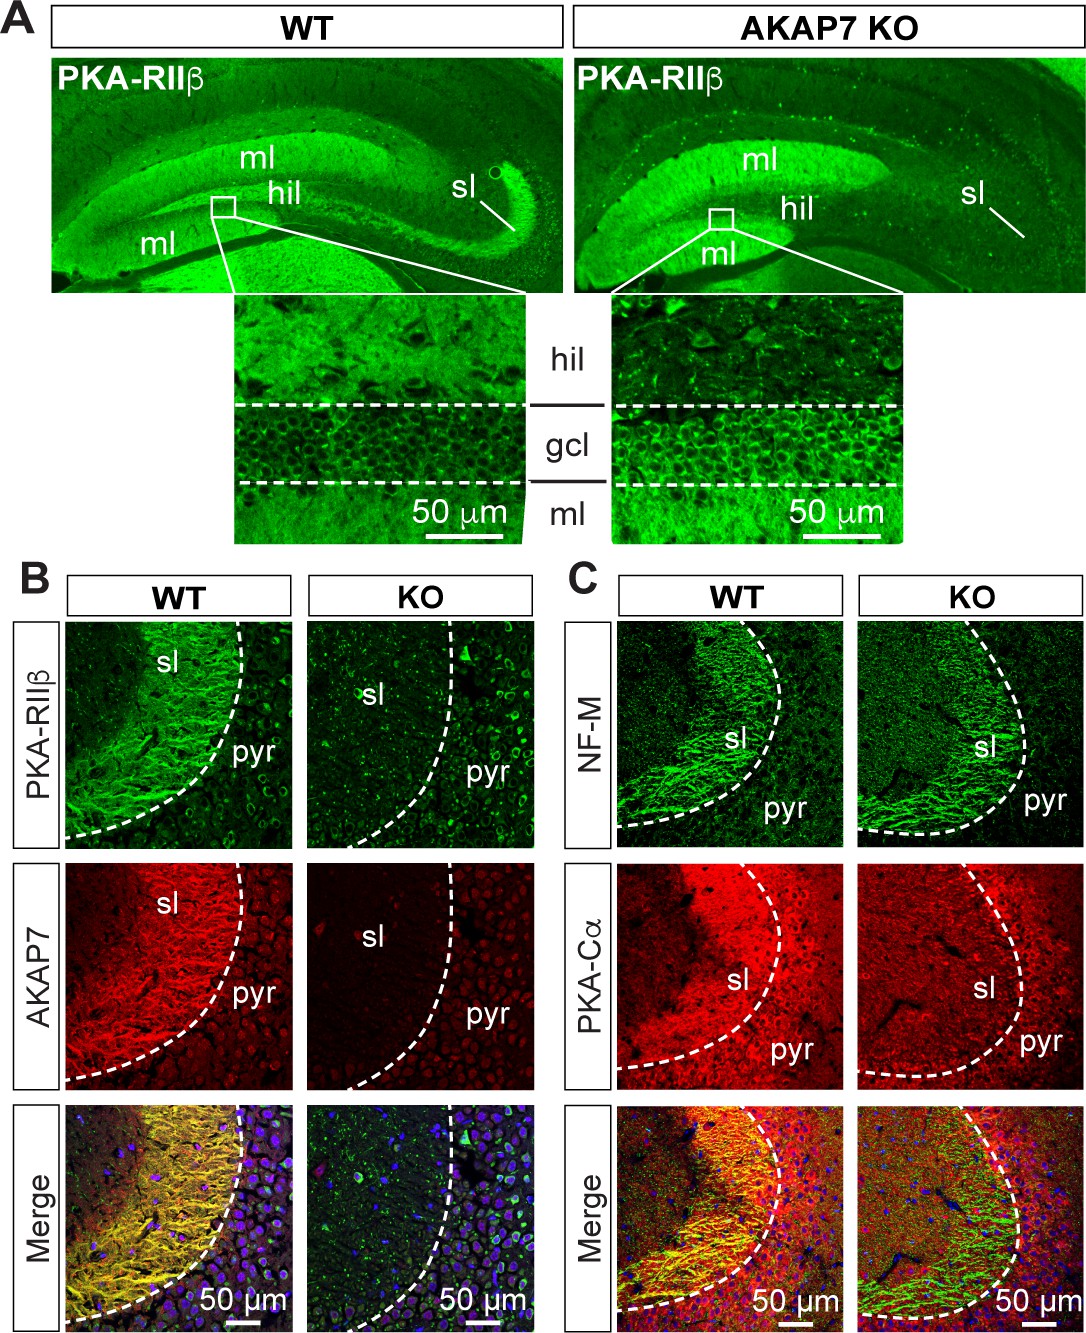
AKAP7 anchors PKA in the mossy fiber axons and terminals of DGCs.
(A) PKA-RIIβ is lost from mossy fibers in the hillus (hil) and stratum lucidum (sl) but increased in soma (gcl) and dendrites (ml) in AKAP7 KO. (B). Confocal images of stratum lucidum (sl) showing PKA-RIIβ (green) colocalized with AKAP7 (red) in mossy fibers in WT but not KO animals. Nuclei are stained with DAPI (blue); CA3 pyramidal cell layer (pyr). (C) Confocal images as in B showing NF-M (green) colocalized with PKA-Cα (red) in mossy fibers in WT but not KO animals. Regions of interest within stratum lucidum were analyzed using the Coloc2 plug-in from Fiji (ImageJ) as described in Materials and methods and the analysis of PKA-Cα and NF-M gave an ICQ value of 0.13 in WT and −0.035 in the KO indicating colocalization in the WT but not in the KO. Images are representative of multiple slices from ≥three mice. Nuclei are stained with DAPI (blue) in merged images.
Figure 4 with 1 supplement
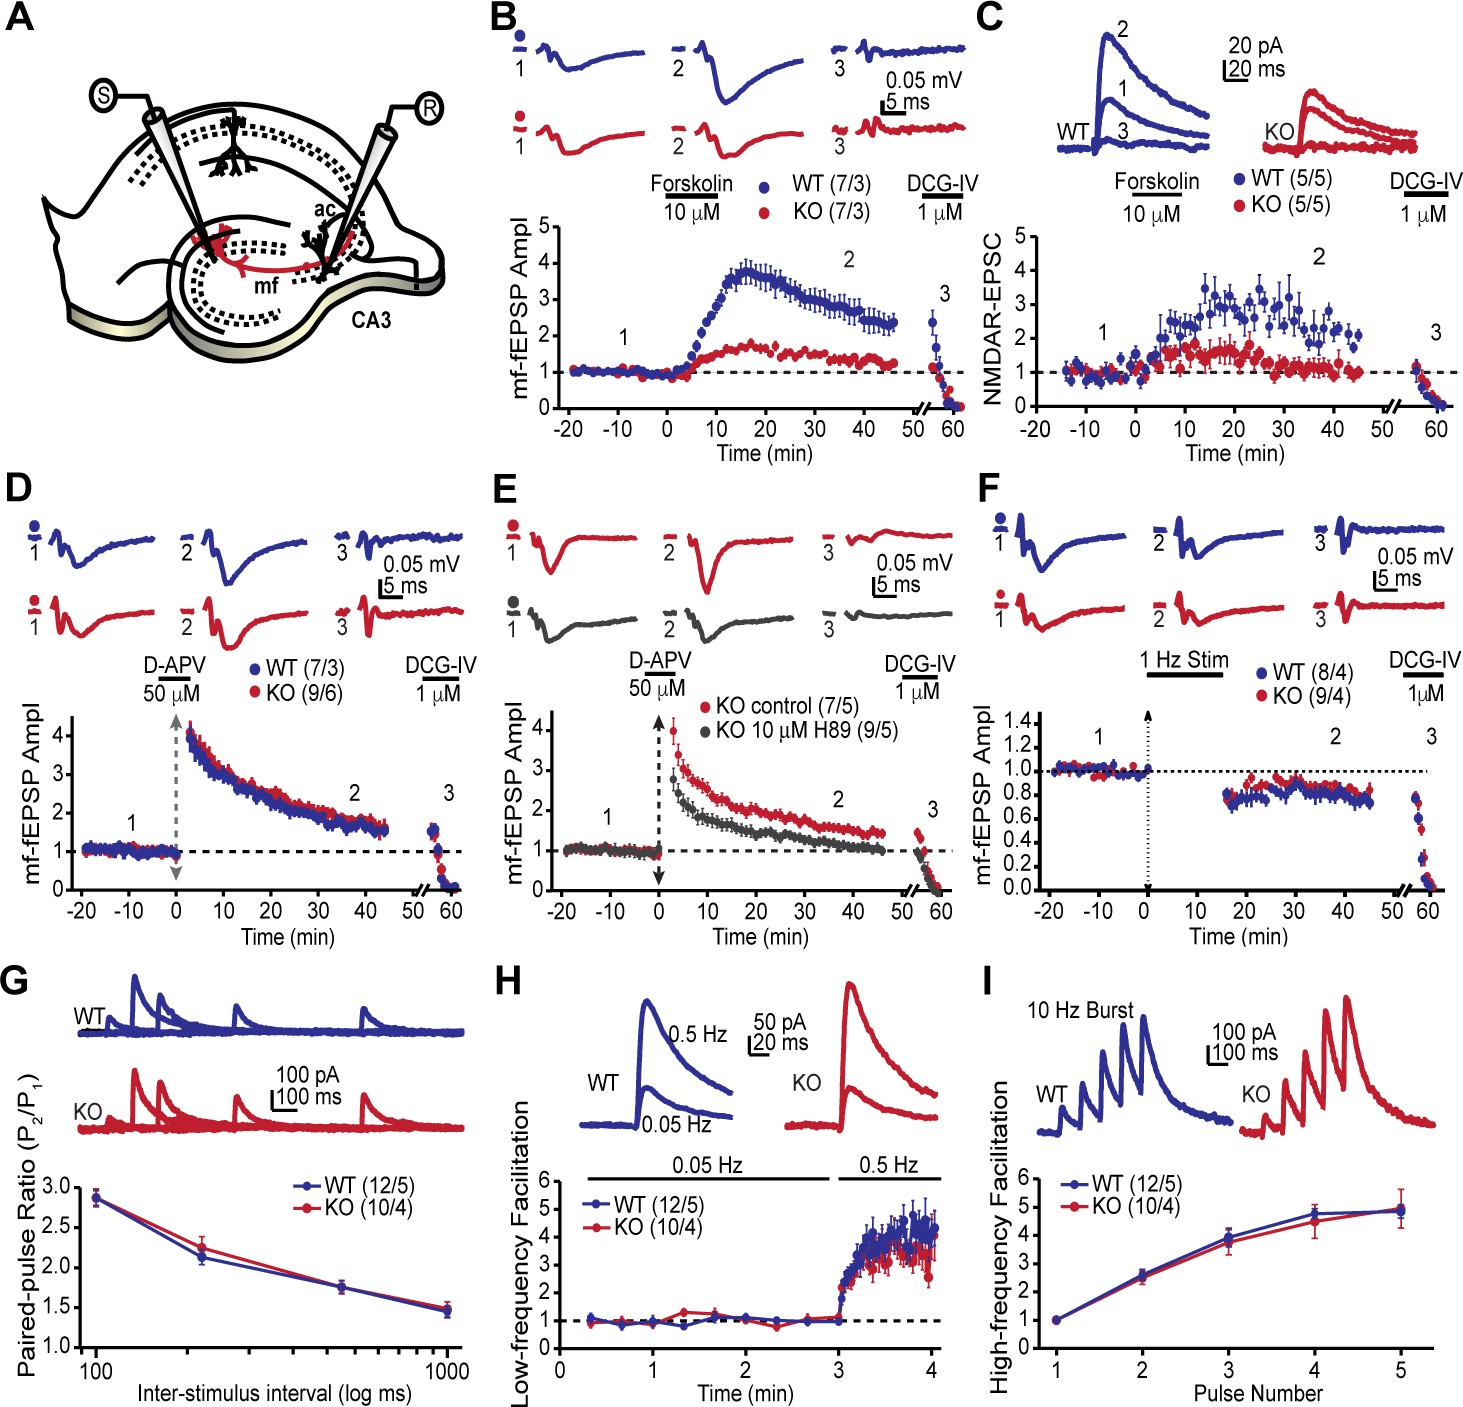
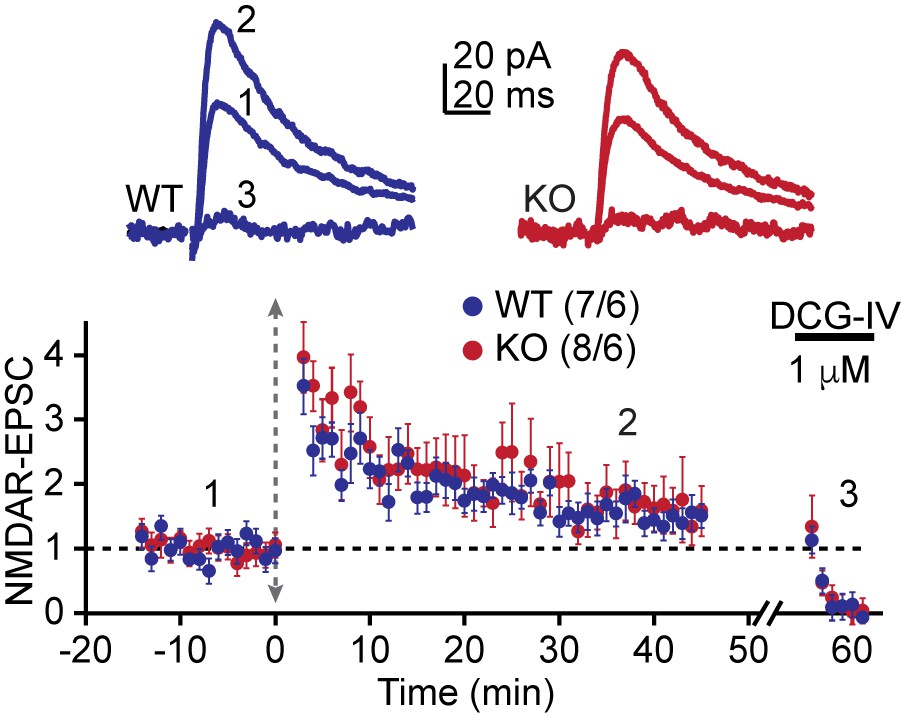
AKAP7 is required for cAMP-induced LTP at MF-CA3 pyramidal cell synapses.
(A) Model of the placement of stimulating and recording electrodes. (B) cAMP-induced LTP at the MF-CA3 synapse was tested by both field EPSPs (fEPSPs), and (C) whole cell recordings from acutely isolated WT and AKAP7 KO brain slices. Field EPSPs (WT: 2.4 ± 0.3 of baseline vs. KO: 1.28 ± 0.07 of baseline; p=0.0029; Student’s unpaired t-test; Cohen's d = 1.98). Intracellular whole-cell voltage-clamp recordings from CA3 pyramidal cells (WT: 2.13 ± 0.16 of baseline vs. KO: 1.09 ± 0.18 of baseline; p=0.0027; Student’s unpaired t-test; Cohen's d = 2.70). Magnitude of LTP was assessed 35–45 min post application of forskolin to elevate cAMP. (D) Tetanus-induced MF-LTP was intact in AKAP7 KO slices. Experimental conditions identical to panel B, but LTP was induced with a tetanus (vertical double arrow) consisting of two bursts (each with 125 pulses at 25 Hz) spaced by 20 s. To block postsynaptic NMDA receptor-mediated MF-LTP, the NMDA receptor antagonist D-APV (50 μM, horizontal black bar) was bath applied before and washed out immediately after the tetanus. (E) Tetanus-induced MF-LTP was inhibited in AKAP7 KO slices pre-incubated (1 hr) and continuously perfused with the PKA inhibitor H89 (10 μM). Control: 1.48 ± 0.08 of baseline vs. H89: 1.08 ± 0.06; p=0.0013 (Student’s unpaired t-test); Cohen's d = 2.00. Experimental conditions were otherwise identical to panel D. (F) Long-term depression at the MF-CA3 synapse was normal in AKAP7 KO mice. Long-term depression was induced (first horizontal black bar) with the classical 1 Hz, 15-min protocol. For panels B-F representative traces are shown above with numbers corresponding to the summary time course plot below the electrophysiology figures. 1 μM DCG-IV (second horizontal black bar) was bath applied at the end of each experiment to confirm identity of mossy fiber synaptic responses. Since the DCG-IV application time was slightly different between experiments, a break in the x-axis was introduced and the DCG-IV effect was time-aligned. Measures of short-term plasticity at the MF-CA3 synapse were intact in the AKAP7 KO mice compared to WT controls: basal probability of release (G), low-frequency facilitation (H), and high-frequency facilitation (I) were tested. Release probability was inferred from measurements of the paired-pulse ratio, calculated by dividing the second of two successive pulses by the first. Short-term plasticity was measured using whole-cell voltage clamp recordings of isolated NMDAR-EPSCs. For each group of mice the values in parentheses correspond to the number of slices/number of mice.
Figure 4—figure supplement 1
Whole-cell voltage clamp recordings confirm intact tetanus-induced MF-LTP.
LTP was induced with a tetanus as in Figure 4. Consistent with the fEPSP recordings, there was also no significant difference in tetanus-induced LTP between AKAP7 WT and KO mice under this recording configuration. Experimental recording conditions identical to Figure 4C. For each group of mice, the values in parentheses correspond to the number of slices/number of mice.
Figure 5 with 2 supplements
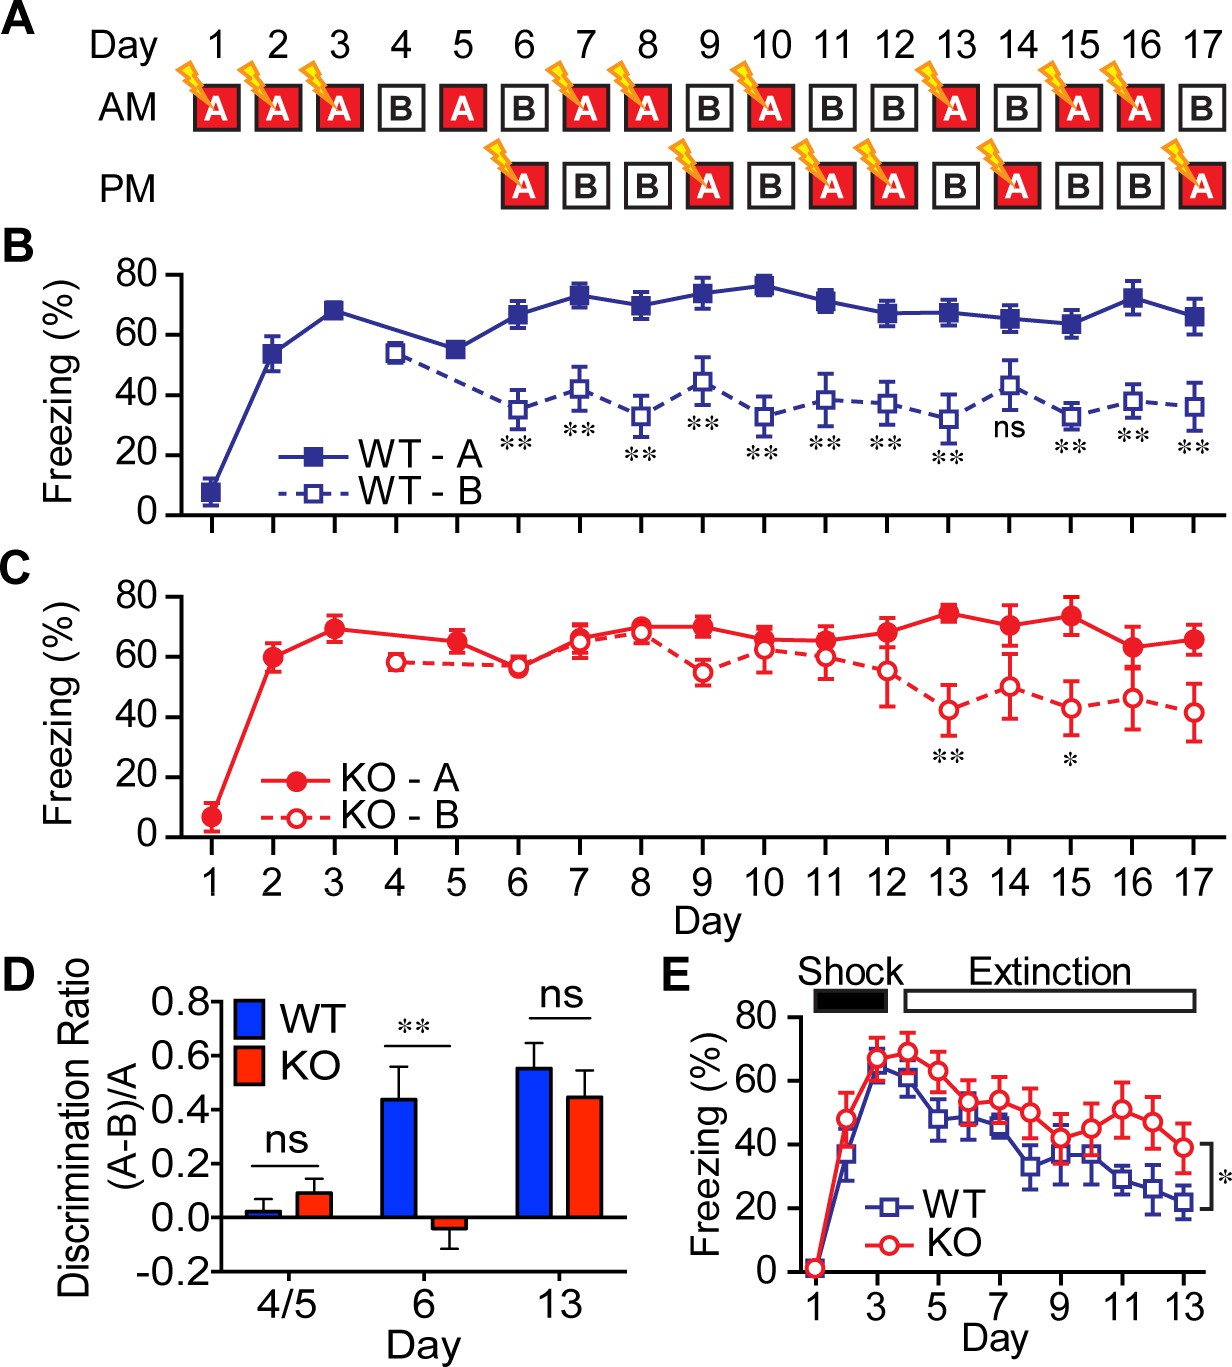
AKAP7 KO animals show impaired contextual discrimination.
(A) Experimental protocol to test contextual fear discrimination. Animals were probed for freezing (% time immobile) in either ‘context A’ where they received a single footshock (0.65 mA, 2 s) (except Day 5, when there was no footshock) or the no-shock ‘context B’, which had a different floor and a striped pattern on one wall. (B) WT animals exhibited a comparable duration of freezing behavior in both contexts on Days 4 and 5, respectively, but by Day 6 and thereafter demonstrated reduced freezing behavior in ‘context B’. (C) KO animals did not begin to discriminate between contexts A and B until Day 13. (D) Discrimination ratio for Days 5, 6 and 13 demonstrate differences between WT and KO animals on key days (n = 7 animals per group); data are presented as mean ± SEM (p values determined using Student’s unpaired t-test in panels B-D). (E) Following 3 days of footshock delivery only in ‘context A’, AKAP7 KO animals demonstrated a slight but significant deficit in contextual fear extinction compared to WT animals (n = 6–8 animals per group). Animals were never introduced to ‘context B.’ Two-way ANOVA was used for the effect of genotype. *p<0.05, **p<0.01.
Figure 5—figure supplement 1
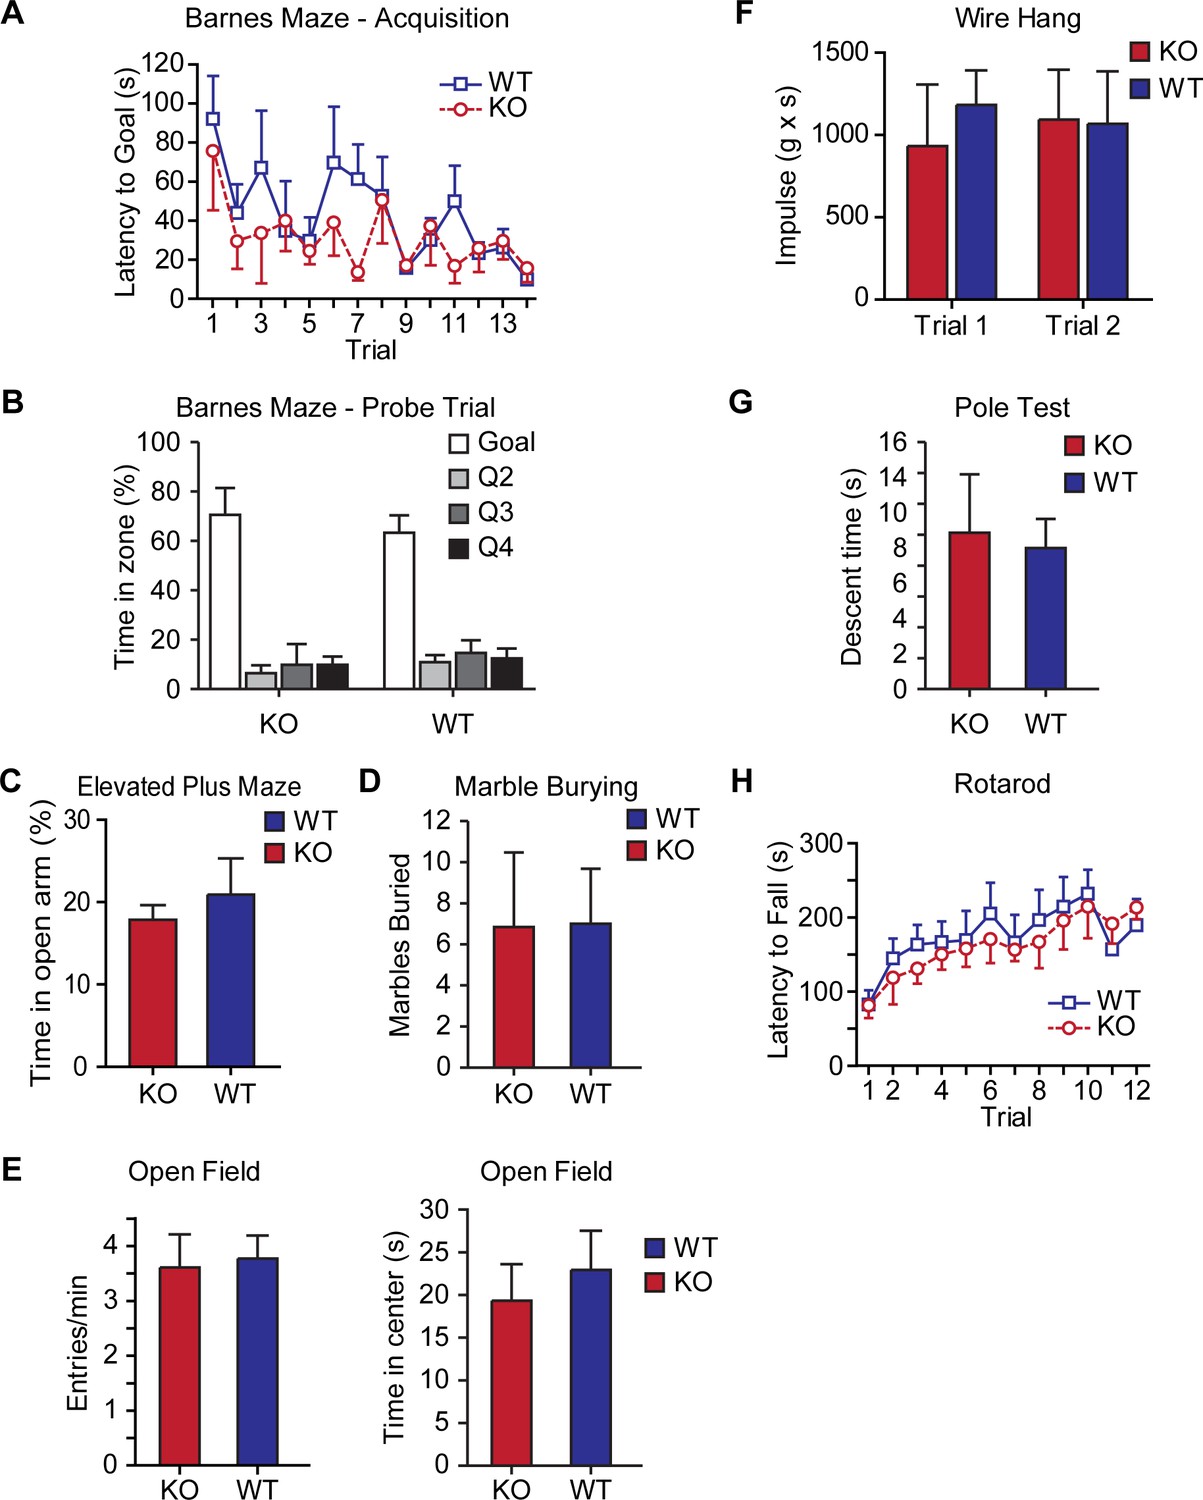
AKAP7 KO mice show normal spatial learning, anxiety, and motor behaviors.
AKAP7 KO mice behave similarly to WT on spatial learning (A–B) Barnes maze (n = 4–6 per group), measures of anxiety (C) elevated plus maze (n = 12 per group), (D) marble burying (n = 13 per group), (E) open field (n = 11–13 per group) and motor coordination (F) wire hang (n = 13 per group), (G) vertical pole descending (n = 9–11 per group), and (H) accelerating rotarod (n = 8 per group). Results are shown as the mean ± SEM.
Figure 5—figure supplement 2
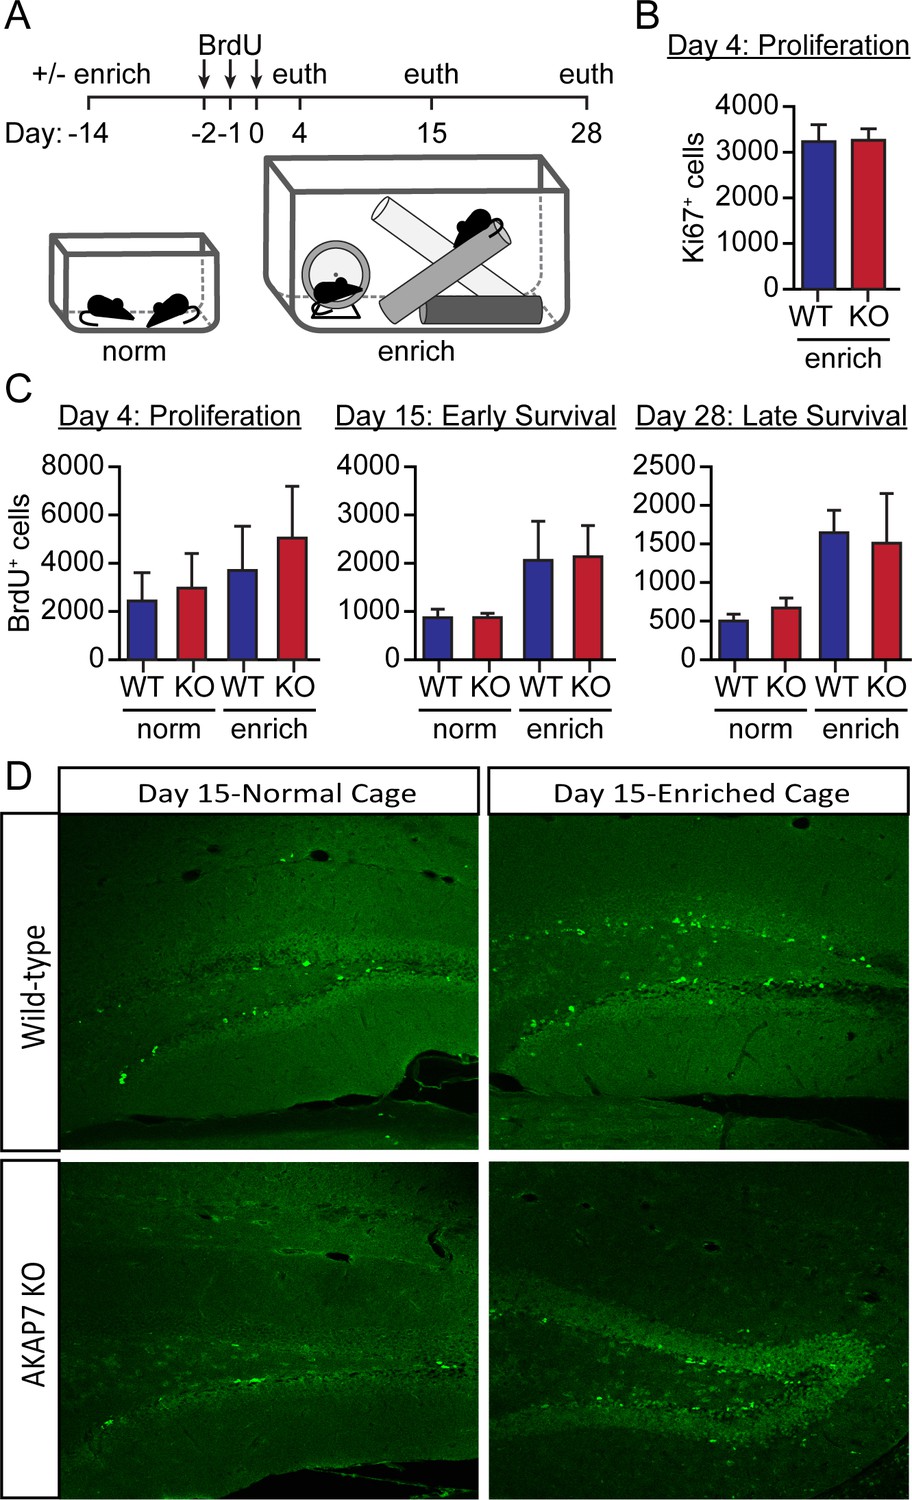
Adult neurogenesis is normal in AKAP7 KO animals.
(A) Cartoon of experimental protocol. (B) As a measure of proliferating adult neurogenesis, we stained for Ki67, a protein expressed only in the nuclei of proliferating neurons. We saw no differences in the number of Ki67-positive cells between WT and KO. Cell counts were made for every eighth 35 µm section across the entire hippocampus (total cells counts = total count from every eighth section x 8) (n = 5 per group). (C) We quantified BrdU-positive neurons in WT and KO mice that had been housed in normal or in enriched cages at multiple timepoints to demonstrate proliferation and maturation of adult born neurons. We found no differences in the number of BrdU-positive cells within the subgranular zone of WT versus KO at any time point (Days 4, 15, 28). Environmental enrichment and exercise promoted neurogenesis equally in both genotypes. These results suggest that adult neurogenesis is not affected by loss of AKAP7 and therefore does not underlie the deficits in discrimination behavior. Cell counts were made for every eighth 35 µm section across the entire hippocampus (total cells counts =total count from every eighth section x 8) (n = 3–5 per group). Results are shown as the mean ±SEM. (D) Representative images with staining for BrdU from day 15/17 from WT and KO animals housed in either normal cages or enriched cages.
Figure 6

DG-specific AKAP7 KO shows plasticity deficits similar to global KO.
(A) Fluorescent protein TdTomato expression in the hippocampus of Pomc+/Cre crossed to TdTomato reporter mice is restricted to dentate granule neurons. (B) Merged image of TdTomato expression and AKAP7 staining show that Pomc-Cre was active in the majority of AKAP7-expressing DGCs. (C) Pomc+/Cre;Akap7lox/- (DG-KO) animals lose AKAP7 in the dentate gyrus but not the neighboring thalamus (TH) (or other brain regions; not shown). PKA-RIIβ is displaced from MFs in DG-KO animals, although some staining is still present in stratum lucidum likely due to incomplete Cre recombination. Akap7lox/- (Het) animals show AKAP7 expression and PKA-RIIβ distribution comparable to WT. (D) cAMP-induced MF-LTP is impaired in DG-KO animals, similar to global AKAP7 KO. Het (control): 2.73 ± 0.25 of baseline vs. DG-KO: 1.54 ± 0.20 of baseline; p=0.0053 (Student’s unpaired t-test); Cohen's d = 2.40. Experimental conditions are as in Figure 4B. (E) Tetanus-induced MF-LTP remains intact in DG-KO compared with Het control. We also assessed basal synaptic function by measuring the paired pulse ratio (with a 40 ms interspike interval) in the DG-specific KO and found no significant difference from the control (control HET: 2.34 ± 0.08 vs DG-KO: 2.3 ± 0.09, p=0.76, t-test, n = 10. Experimental conditions are as in Figure 4. For each group of mice, the values in parentheses correspond to the number of slices/number of mice.
Figure 7
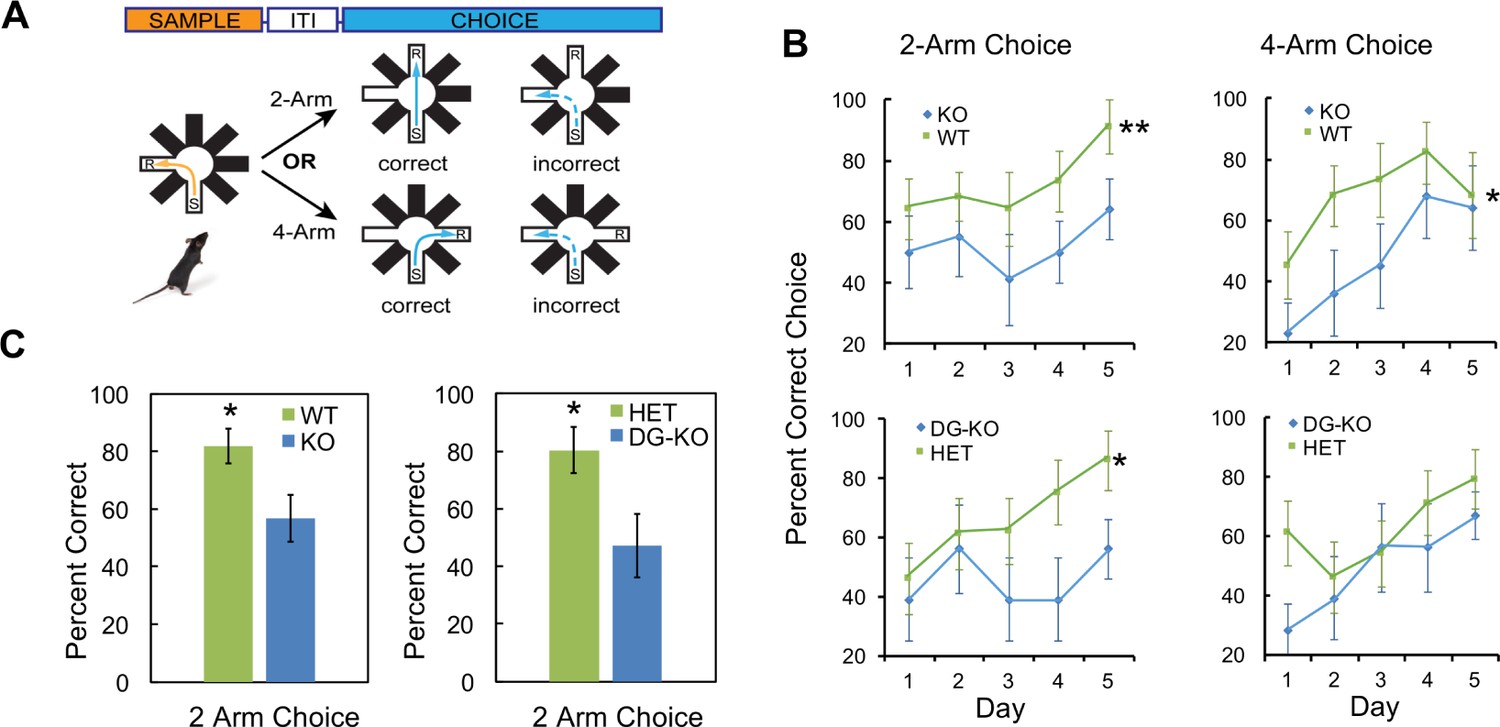
AKAP7 KO and DG-KO animals demonstrate impaired non-cued spatial pattern separation.
(A) Experimental protocol to test non-cued spatial discrimination by delayed non-matching-to-place (DNMP) using an 8-arm radial arm maze. Food restricted animals were placed in the start (S) arm and the froot loop reward (R) placed in the goal arm. (B) Learning curves for each genotype over a 5-day experiment. Animals were randomly assigned two trials in the two-arm separation and two trials in the four-arm separation each day and the results averaged and expressed as percent correct choice. The results were analyzed by two-way ANOVA and showed an effect of genotype in the two-arm separation (KO:WT, p=0.004, DG-KO:HET, p=0.013). In the four-arm separation the KO:WT comparison was significant, (p=0.012); the DG-KO:HET comparison was not significant (p=0.095). (C) AKAP7 global KO and DG-KO animals discriminate poorly compared to their respective controls in the more difficult two-arm separation test. The performance on days 4–5 in the two-arm separation test was pooled and analyzed by two-tailed, unpaired T-test (WT:KO, p=0.023, Cohen's d = 1.04; HET:DG-KO, p=0.025, Cohen's d = 1.01). In the four-arm separation trials the WT:KO and HET:DG-KO comparisons did not show significant differences (p=0.565 and p=0.346 respectively). WT and HET groups in both the two-arm and four-arm trials performed significantly better than 50% at days 4–5 (p<0.05), whereas the KO and DG-KO did not. KO (n = 11), WT (n = 11), HET (n = 14), and DG-KO (n = 9). *p<0.05, **p<0.01.
Download links
A two-part list of links to download the article, or parts of the article, in various formats.
Downloads (link to download the article as PDF)
Open citations (links to open the citations from this article in various online reference manager services)
Cite this article (links to download the citations from this article in formats compatible with various reference manager tools)
Targeted deletion of AKAP7 in dentate granule cells impairs spatial discrimination
eLife 5:e20695.
https://doi.org/10.7554/eLife.20695


