Decreased microRNA levels lead to deleterious increases in neuronal M2 muscarinic receptors in Spinal Muscular Atrophy models
- Brown University, United States
- University of Cologne, Germany
- Brown Institute for Brain Science, United States
Figures
Figure 1 with 2 supplements
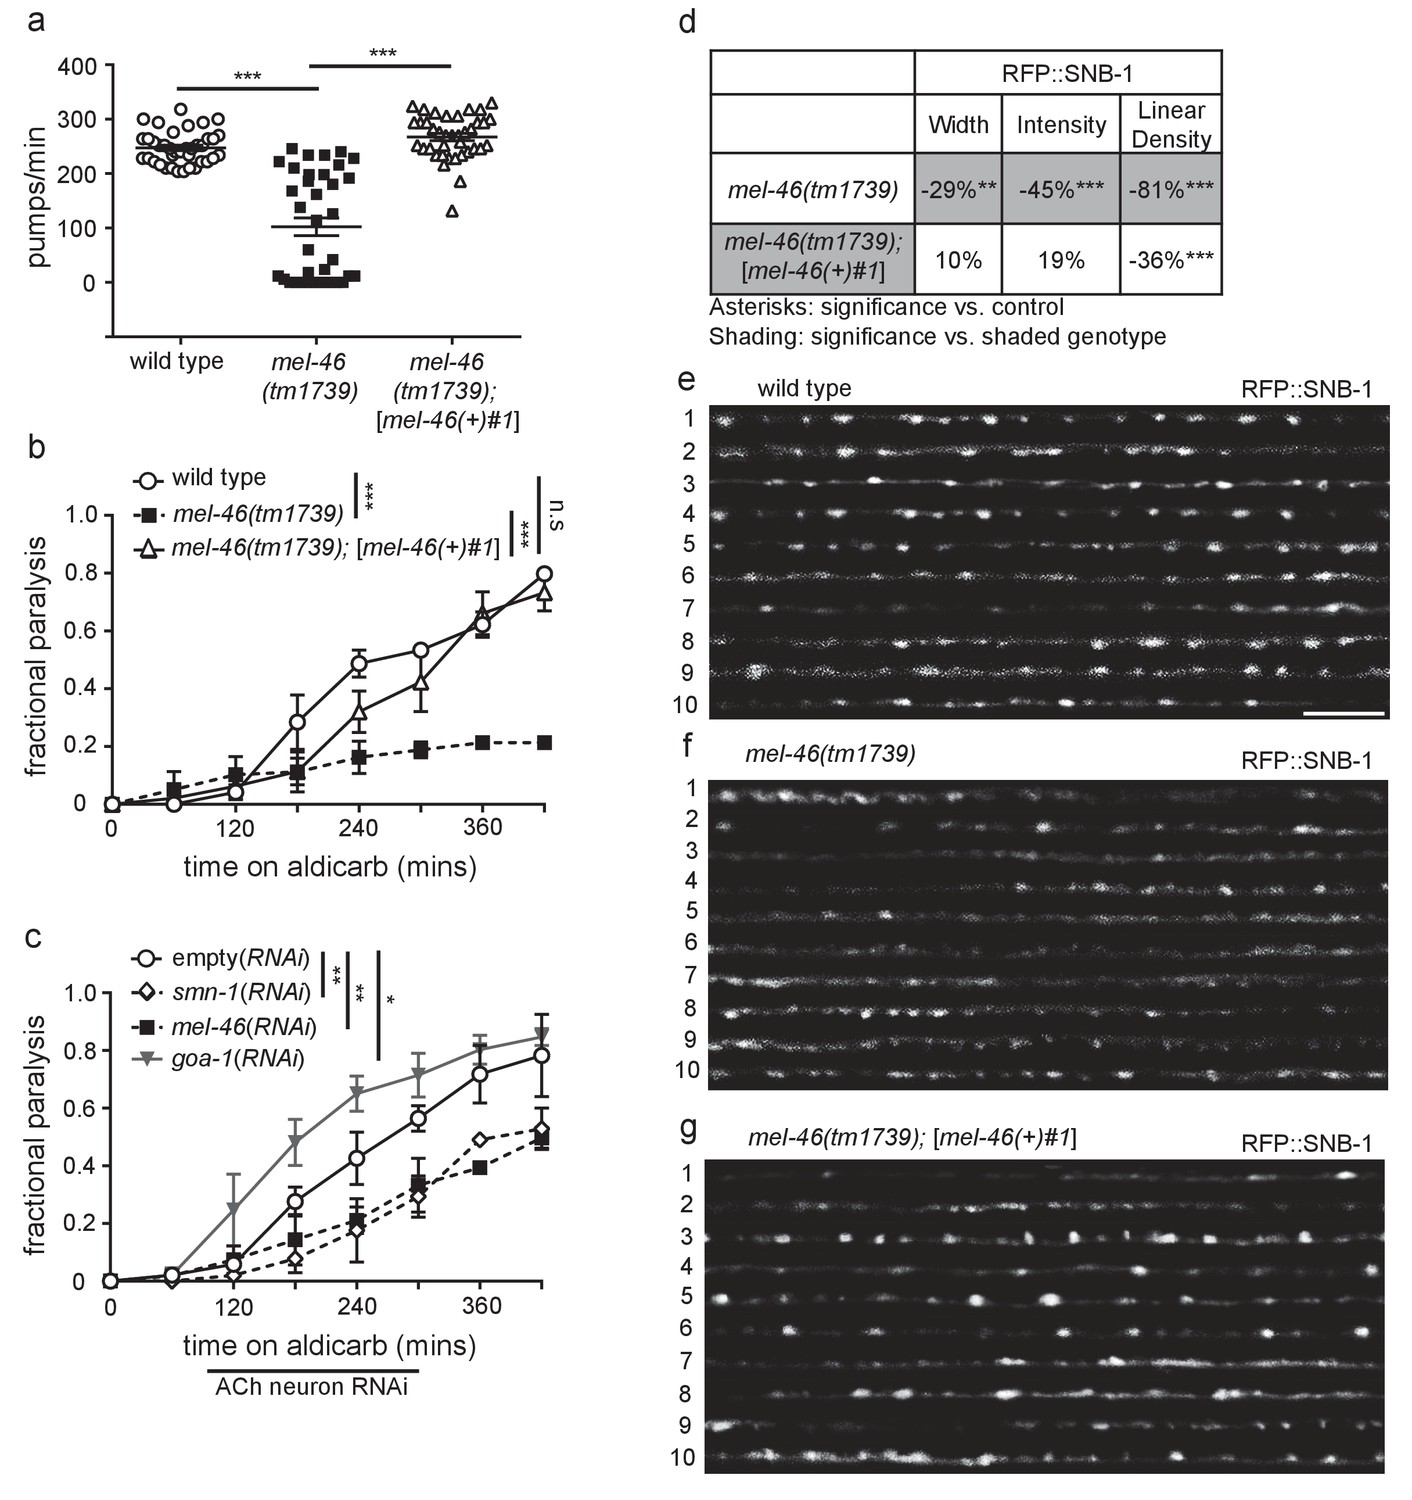
Decreased MEL-46 function in C. elegans results in defective NMJ signaling.
(a) mel-46(tm1739) animals had reduced pharyngeal pumping rates versus wild type (N2) control animals. Defects were fully rescued by global expression of MEL-46 behind its own promoter ([mel-46(+)#1]). Mean ± SEM; Mann-Whitney U-test, two-tailed. (b) mel-46(tm1739) animals paralyzed more slowly when exposed to aldicarb, an acetylcholinesterase inhibitor. Time course for paralysis on 1 mM aldicarb for wild type (N2), mel-46(tm1739), and mel-46(tm1739);[mel-46(+)#1] early larval stage L4 animals. Reintroduction of mel-46 restored normal aldicarb sensitivity. Log-rank test. (c) Cholinergic neuron-specific mel-46(RNAi) causes resistance to aldicarb. Time course for paralysis on 1.5 mM aldicarb for empty(RNAi), smn-1(RNAi), mel-46(RNAi), and goa-1(RNAi) young adult animals. Animals sensitive to RNAi in only cholinergic neurons (XE1581) were fed bacteria expressing double-stranded RNA (dsRNA) against mel-46, smn-1, or goa-1 (positive control). Control animals were fed bacteria expressing an empty vector control: empty(RNAi). Data set previously published without mel-46(RNAi) (Dimitriadi et al., 2016). Log-rank test. (d) mel-46(tm1739) animals had reduced RFP::SNB-1 (synaptobrevin). Percent change from wild type (N2) control for RFP::SNB-1 in the dorsal cord of mel-46(tm1739) and mel-46(tm1739);[mel-46(+)#1] animals for ‘punctaanalyzer’ parameters: puncta width (μm), intensity (AU), and linear density (number/μm). Asterisks denote significance compared to wild type; shading indicates significant change for mel-46(tm1739) versus mel-46(tm1739);[mel-46(+)#1]. Mann-Whitney U-test, two-tailed. Expression of mel-46 rescued RFP::SNB-1 puncta width defects in mel-46(tm1739) animals (wild type versus mel-46(tm1739);[mel-46(+)#1] p=0.82); mel-46(tm1739) versus mel-46(tm1739);[mel-46(+)#1] p=0.03), rescued SNB-1 puncta intensity defects (wild type versus mel-46(tm1739);[mel-46(+)#1] p=0.85; mel-46(tm1739) versus mel-46(tm1739);[mel-46(+)#1] p=0.005) and partially ameliorated SNB-1 puncta linear density defects (wild type versus mel-46(tm1739);[mel-46(+)#1] p=0.0004); mel-46(tm1739) versus mel-46(tm1739);[mel-46(+)#1] p=0.0001). (h–j) Representative images of RFP::SNB-1 expressed in the dorsal cord of cholinergic DA MNs for wild type, mel-46(tm1739), and mel-46(tm1739);[mel-46(+)#1] animals. These images were taken as part of data collection. Scale bar, 5 μm. For statistical analyses in all figures: *p≤0.05, **p<0.01, ***p<0.001. A helpful summary of C. elegans phenotypes reported throughout this article for selected loss of function alleles can be found in Supplementary file 1. Additional information on C. elegans strains used in Figures 1–6 is provided in Supplementary file 2A.
-
Figure 1—source data 1
Raw Data for Figure 1—figure supplement 2.
Raw data and statistical analysis that correspond to RFP::SNB-1 localization analysis in Figure 1—figure supplement 2.
- https://doi.org/10.7554/eLife.20752.004
Figure 1—figure supplement 1
MEL-46(Gemin3) is necessary for proper NMJ function.
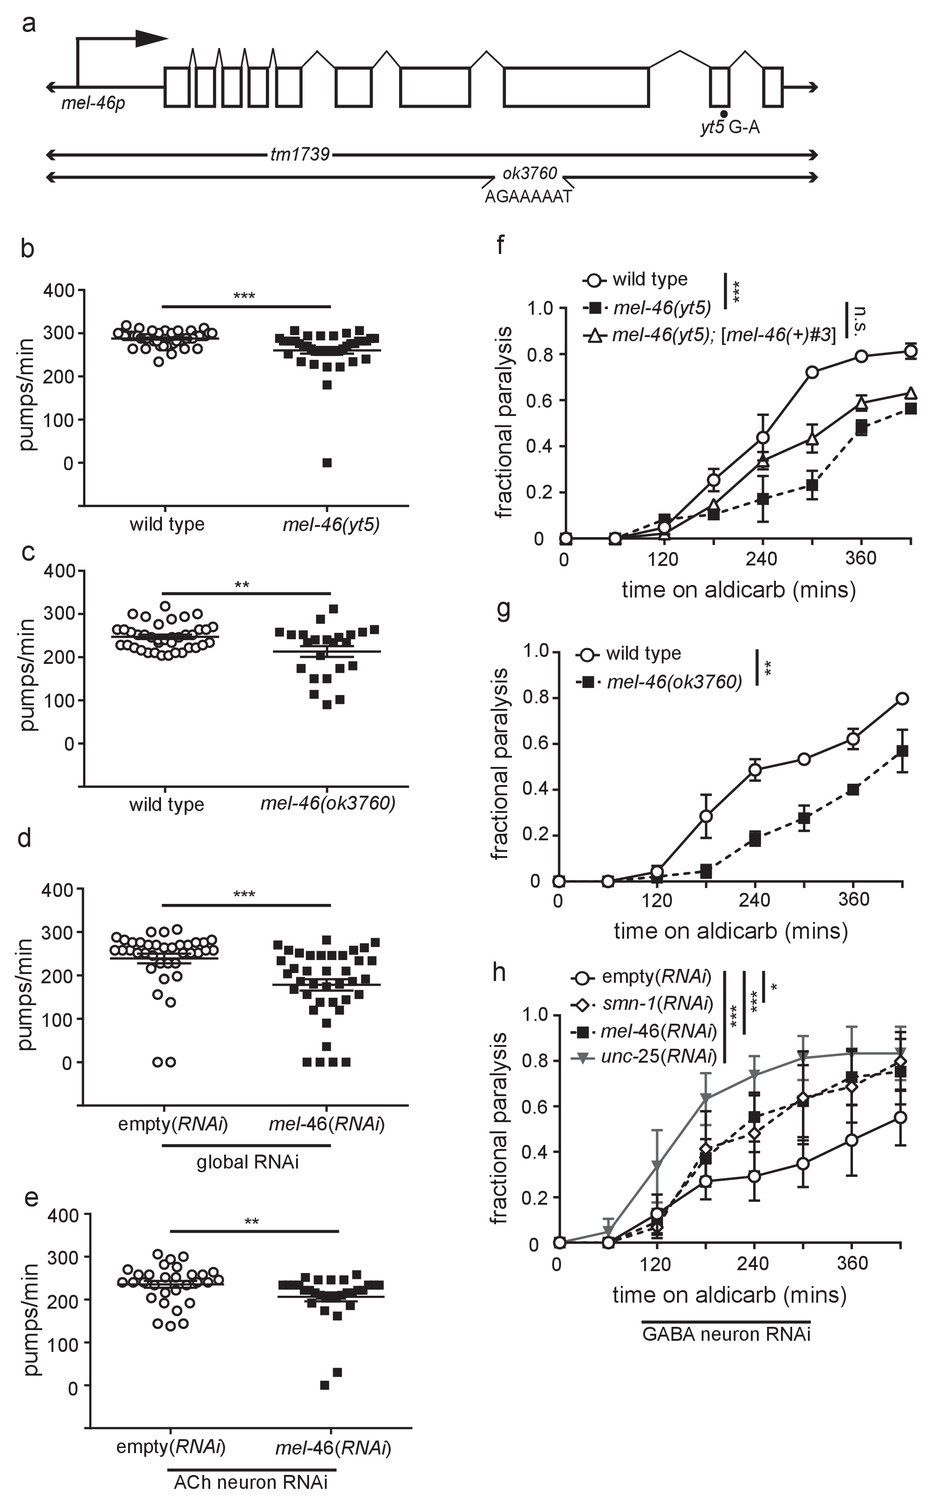
(a) Schematic representation of the predicted mel-46 gene. Large arrow indicates the direction of translation. Also shown are the positions of the yt5 G to A transition, the tm1739 deletion and the ok3760 complex substitution, for which the inserted sequence is indicated (Minasaki et al., 2009). (b) mel-46(yt5) animals had reduced pharyngeal pumping rates versus wild type (N2) control. Mean ± SEM; Mann-Whitney U-test, two tailed. (c) mel-46(ok3760) animals had reduced pharyngeal pumping rates versus wild type (N2) control. Mean ± SEM; t-test, two tailed. This data was collected alongside data in Figure 1A. (d) Animals sensitive to RNAi in all tissues (KP3948) fed bacteria expressing double-stranded RNA (dsRNA) against mel-46 had reduced pharyngeal pumping rates versus control animals fed bacteria expressing an empty vector control. Mean ± SEM; Mann-Whitney U-test, two tailed. (e) Animals sensitive to RNAi in only cholinergic neurons (XE1581) fed bacteria expressing double-stranded RNA (dsRNA) against mel-46 had reduced pharyngeal pumping rates versus control animals fed bacteria expressing an empty vector control. Mean ± SEM; Mann-Whitney U-test, two tailed. (f) mel-46(yt5) animals were resistant to the acetylcholinesterase inhibitor, aldicarb. Broad expression of MEL-46 with [mel-46(+)#3], which uses the mel-46 promoter, did not significantly restore mel-46(yt5) aldicarb resistance. Time course for paralysis on 1 mM aldicarb for wild type (N2), mel-46(yt5), and mel-46(yt5);[mel-46(+)#3] early larval stage L4 animals. Log-rank test. (g) mel-46(ok3760) animals were resistant to the acetylcholinesterase inhibitor, aldicarb. Time course for paralysis on 1 mM aldicarb for wild type (N2) and mel-46(ok3760) young adult animals. Log-rank test. This data was collected alongside data in Figure 1B. (h) GABA neuron-specific mel-46 RNAi or smn-1 RNAi results in aldicarb hypersensitivity. Time course for paralysis on 1 mM aldicarb for empty(RNAi), smn-1(RNAi), mel-46(RNAi), and unc-25(RNAi) animals. Animals sensitive to RNAi in only GABAergic neurons (XE1375) were fed bacteria expressing double-stranded RNA (dsRNA) against mel-46, smn-1, or unc-25 (positive control). Control animals were fed bacteria expressing an empty vector control: empty(RNAi). Log-rank test. For all statistical analyses in figure supplements: *p≤0.05, **p<0.01, ***p<0.001.
-
Figure 1—figure supplement 1—source data 1
Raw Data for Figure 1—figure supplement 1.
Raw data and statistical analysis that correspond to pumping and aldicarb resistance assays in Figure 1—figure supplement 1.
- https://doi.org/10.7554/eLife.20752.006
Figure 1—figure supplement 2
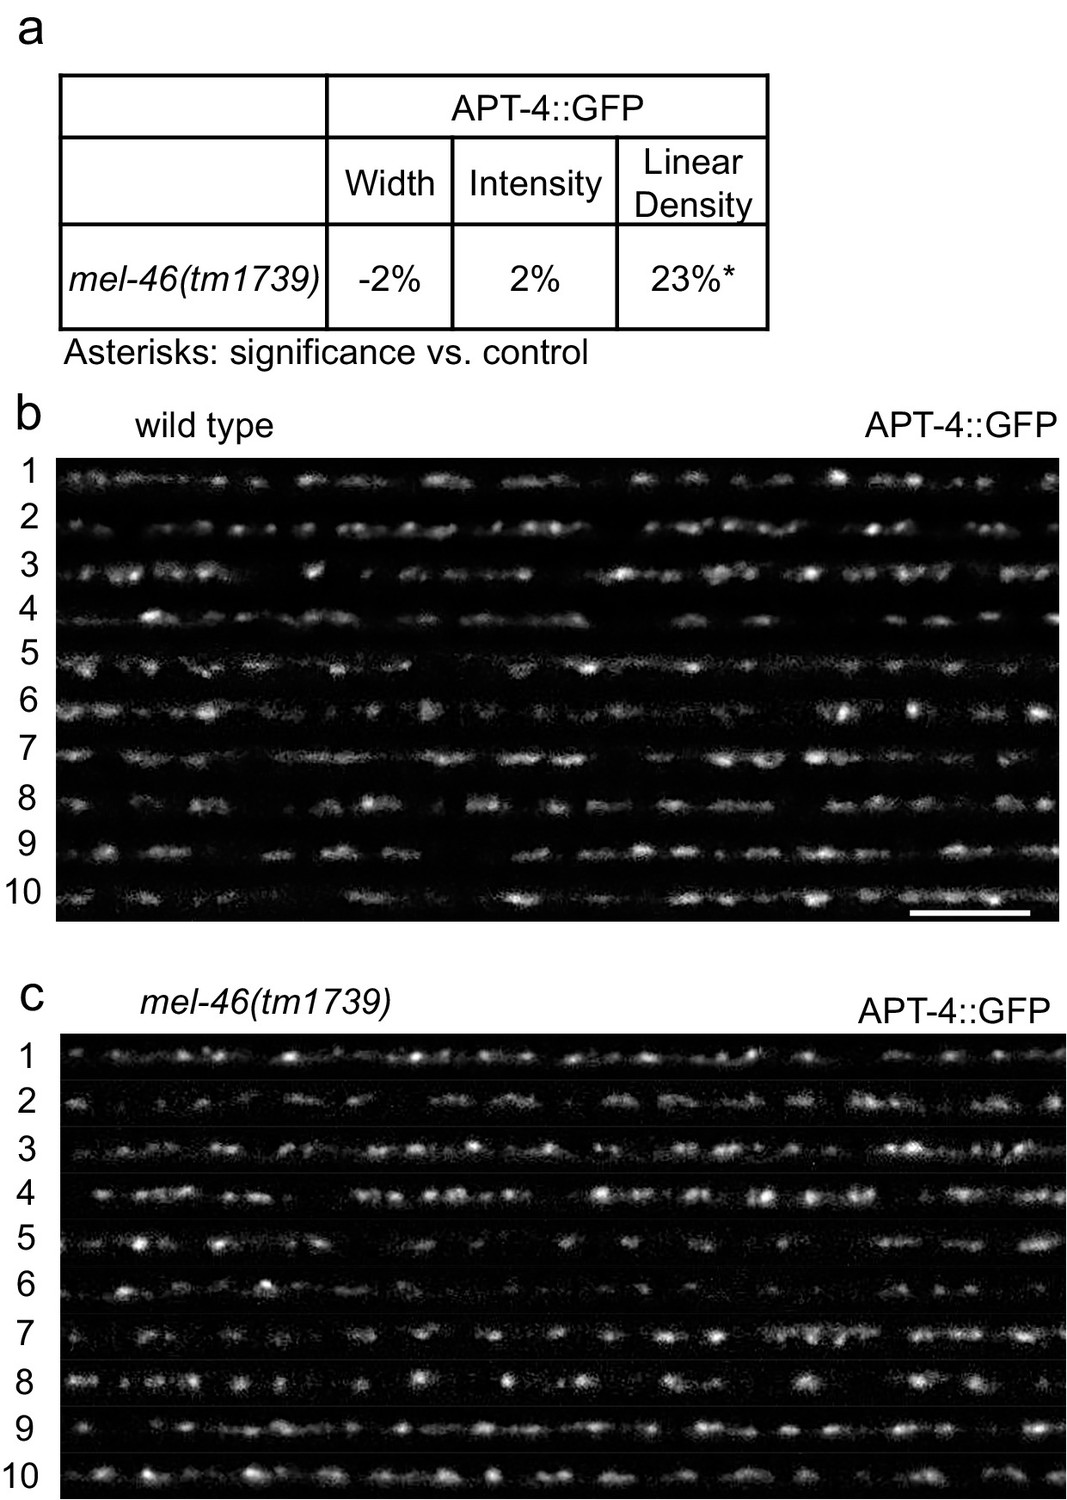
MEL-46(Gemin3) loss causes increased APT-4(AP2 α-adaptin) linear density.
(a) mel-46(tm1739) animals had increased APT-4 (AP2 α-adaptin) linear density. Percent change from wild type control for APT-4 in the dorsal nerve cord of mel-46(tm1739) animals for ‘punctaanalyzer’ parameters: puncta width (μm), intensity (AU), and linear density (number/μm). Mann-Whitney U-test, two-tailed. (b–c) Representative images of APT-4::GFP in the dorsal nerve cord of cholinergic DA MNs of wild type and mel-46(tm1739) animals. These images were taken as part of data collection. Scale bar, 5 μm.
-
Figure 1—figure supplement 2—source data 1
Raw Data for Figure 1—figure supplement 2.
Raw data and statistical analysis that correspond to RFP::SNB-1 localization analysis in Figure 1—figure supplement 2.
- https://doi.org/10.7554/eLife.20752.008
Figure 2 with 2 supplements
MEL-46 localization and levels are perturbed in smn-1(lf) animals.
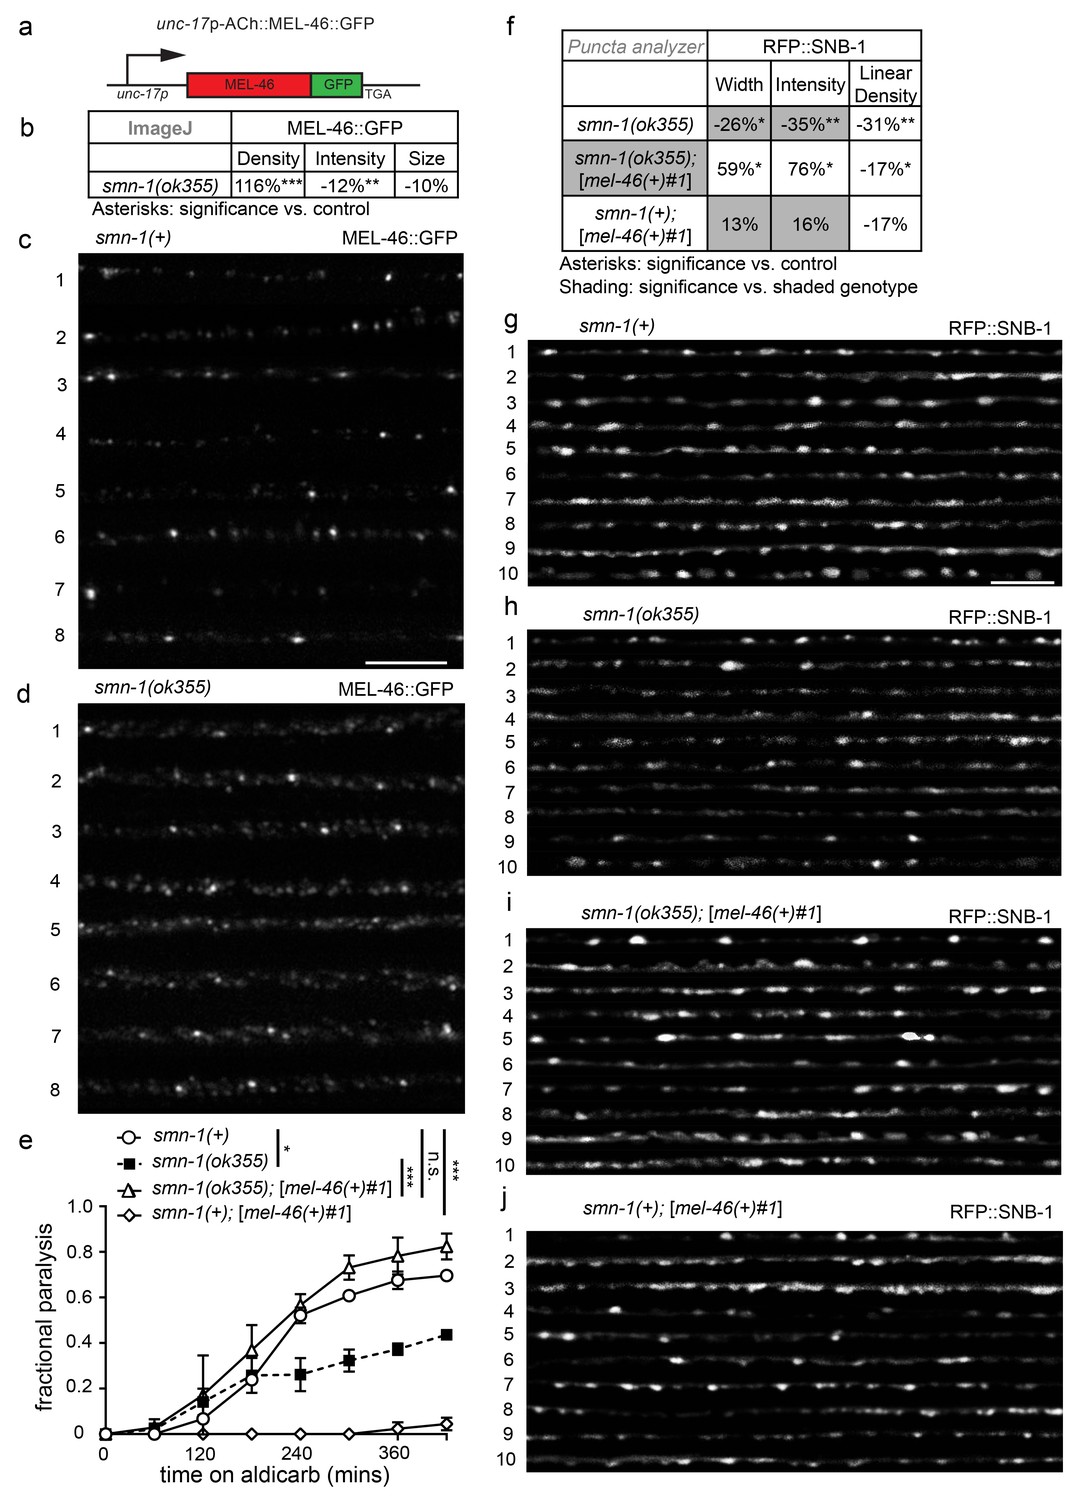
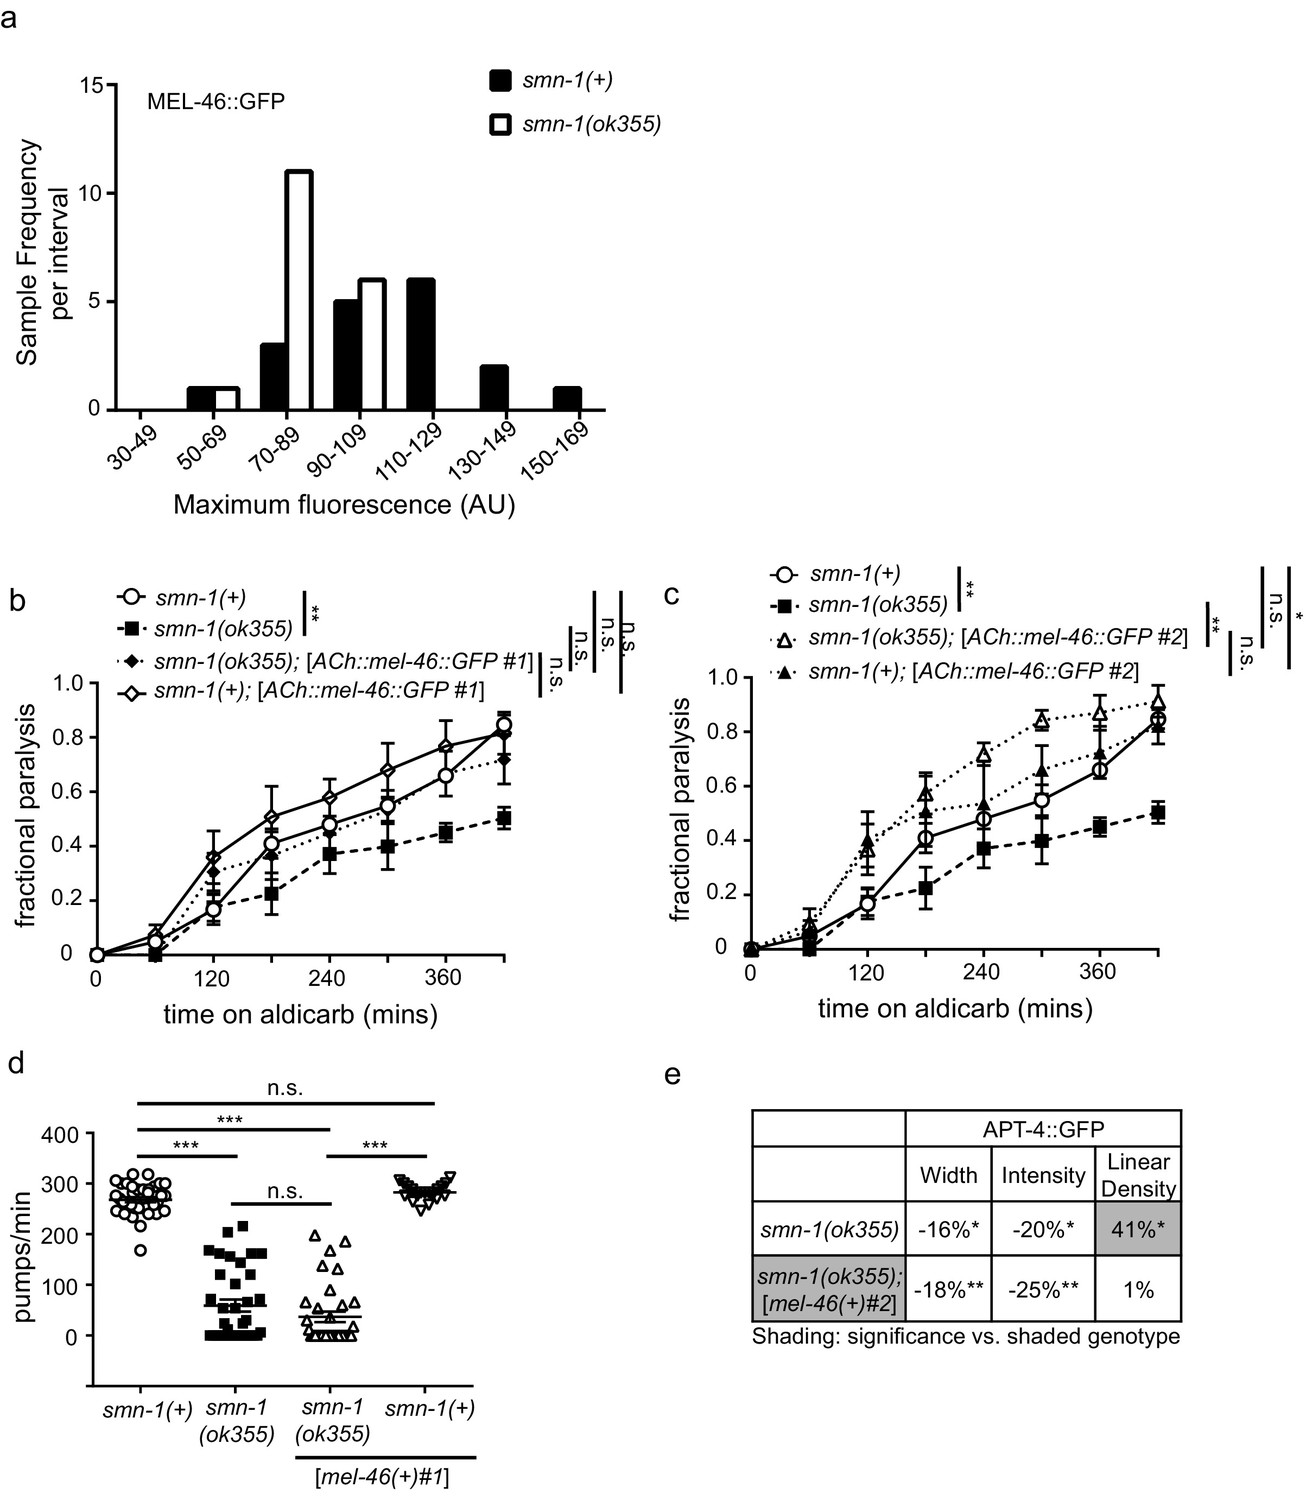
(a) Illustration: mel-46 was tagged with GFP at the C-terminus and expression was driven by the cholinergic (ACh) unc-17 promoter. Two lines were generated by UV integration. (b) smn-1(ok355) animals exhibited mislocalization and reduction of MEL-46::GFP in dorsal cord processes of cholinergic neurons. MEL-46::GFP localizes to granular punctate structures in dorsal cord processes. Percent change from smn-1(+) control for MEL-46::GFP in the dorsal cord of smn-1(ok355) animals for ImageJ parameters: puncta density (puncta/area), puncta intensity (AU), and puncta size (pixels/puncta). The ImageJ analysis was used instead of the ‘punctaanalyzer’ program since MEL-46::GFP had a scattered non-linear pattern in smn-1(ok355) animals; a linear pattern is necessary for accurate ‘punctaanalyzer’ analysis. Asterisks denote significance compared to wild type. Mann-Whitney U-test, two-tailed. (c–d) Representative images of MEL-46::GFP in dorsal cord cholinergic DA MN processes for control smn-1(+) and smn-1(ok355) animals. These images were taken as part of data collection. Scale bar, 5 μm. (e) Increasing expression of mel-46 rescued smn-1(ok355) aldicarb response defects. Time course for paralysis on 1 mM aldicarb for smn-1(+), smn-1(ok355), smn-1(ok355);[mel-46(+)#1], and smn-1(+);[mel-46(+)#1] early larval stage L4 animals. smn-1(+);[mel-46(+)#1] animals were resistant to paralysis by aldicarb. Log-rank test. (f) Increasing mel-46 rescued smn-1(ok355) RFP::SNB-1 synaptic localization defects. Percent change from smn-1(+) control for RFP::SNB-1 in the dorsal cord of smn-1(ok355), smn-1(ok355);[mel-46(+)#1], and smn-1(+);[mel-46(+)#1] animals for ‘punctaanalyzer’ parameters: puncta width (μm), intensity (AU), and linear density (number/μm). Asterisks denote significance compared to smn-1(+) control; shading indicates significant difference from smn-1(ok355);[mel-46(+)#1]. Mann-Whitney U-test, two-tailed. Expression of mel-46 restored RFP::SNB-1 puncta width defects (smn-1(+) control versus smn-1(ok355);[mel-46(+)#1] p=0.05; smn-1(ok355) versus smn-1(ok355);[mel-46(+)#1] p=0.001), rescued SNB-1 puncta intensity defects (smn-1(+) control versus smn-1(ok355);[mel-46(+)#1] p=0.035; smn-1(ok355) versus smn-1(ok355);[mel-46(+)#1] p=0.0004), but did not rescue SNB-1 puncta linear density defects (smn-1(+) control versus smn-1(ok355);[mel-46(+)#1] p=0.036; smn-1(ok355) versus smn-1(ok355);[mel-46(+)#1] p=0.19). (G–J) Representative images of cholinergic DA MN RFP::SNB-1 in the dorsal nerve cord of smn-1(+), smn-1(ok355) and smn-1(ok355);[mel-46(+)#1]. These images were taken as part of data collection. Scale bar, 5 μm.
-
Figure 2—source data 1
Raw Data for Figure 2.
Raw data and statistical analysis that correspond to MEL-46::GFP localization, aldicarb resistance assays, and RFP::SNB-1 localization analysis in Figure 2.
- https://doi.org/10.7554/eLife.20752.010
Figure 2—figure supplement 1
Expressing mel-46 restores neuronal defects in smn-1(lf) animals.
(a) Decreased SMN-1 resulted in a 21% decrease in maximum MEL-46::GFP fluorescence in dorsal cord DA motor neuron processes. Histogram of maximum fluorescence (AU) for smn-1(+) and smn-1(ok355) animals. t-test. p<0.01. (b) Increasing cholinergic expression using the unc-17 (ACh) promoter of mel-46 partially rescued smn-1(ok355) aldicarb response defects. Time course for paralysis on 1 mM aldicarb for smn-1(+), smn-1(ok355), smn-1(ok355);[ACh::mel-46::GFP #1], and smn-1(+);[ACh::mel-46::GFP #1] early larval stage L4 animals. Log-rank test. (c) Increasing cholinergic expression of mel-46 resulted in rescue of smn-1(ok355) aldicarb response defects. Time course for paralysis on 1 mM aldicarb for smn-1(+), smn-1(ok355), smn-1(ok355);[ACh::mel-46::GFP #1], and smn-1(+);[ACh::mel-46::GFP #1] early larval stage L4 animals. smn-1(+);[ACh::mel-46::GFP #1] were hypersensitive to paralysis by aldicarb. Log-rank test. (c–d) The same MEL-46::GFP integrated lines were used to evaluate levels and localization in Figure 2B–D. Despite rescue smn-1(ok355) aldicarb resistance, these animals expressing cholinergic MEL-46::GFP still exhibit MEL-46 mislocalization likely leading to decreased function. This rescue may occur because enough MEL-46::GFP is expressed to overcome mislocalization-related functional deficits. (d) smn-1(ok355) animals had reduced pharyngeal pumping rates versus smn-1(+) control animals; defects were not rescued by increasing mel-46 using the [mel-46)+)#1] array. smn-1(+); [mel-46(+)#1] animals had pharyngeal pumping rates indistinguishable from smn-1(+) controls. Mean ± SEM; Mann-Whitney U-test, two-tailed. (e) Broad expression of MEL-46 using the mel-46 promoter ameliorated the APT-4 (AP2 α-adaptin) linear density defect in smn-1(ok355) animals. Percent change from smn-1(+) control for APT-4 in the dorsal cord of smn-1(ok355) and smn-1(ok355);[mel-46(+)#2] animals for ‘punctaanalyzer’ parameters: puncta width (μm), intensity (AU), and linear density (number/μm). Asterisks denote significance versus smn-1(+) control; shading indicates smn-1(ok355) is significantly different from smn-1(ok355);[mel-46(+)#2]. Mann-Whitney U-test, two-tailed. Expression of MEL-46 did not rescue APT-4 puncta width (smn-1(+) control versus smn-1(ok355);[mel-46(+)#2] p=0.006; smn-1(ok355) versus smn-1(ok355);[mel-46(+)#2] p=0.48), did not rescue APT-4 total puncta intensity (smn-1(+) control versus smn-1(ok355);[mel-46(+)#2] p=0.002; smn-1(ok355) versus smn-1(ok355);[mel-46(+)#2] p=0.27), but ameliorated APT-4 puncta linear density (smn-1(+) control versus smn-1(ok355);[mel-46(+)#2] p=0.93; smn-1(ok355) versus smn-1(ok355);[mel-46(+)#2] p=0.05).
-
Figure 2—figure Supplement 1—source data 1
Raw Data for Figure 2—figure supplement 1.
Raw data and statistical analysis that correspond to MEL-46::GFP localization, APT-4::GFP localization analysis, aldicarb resistance and pumping assays in Figure 2—figure supplement 1.
- https://doi.org/10.7554/eLife.20752.012
Figure 2—figure supplement 2
Expressing mel-46 does not increase SMN-1 levels.
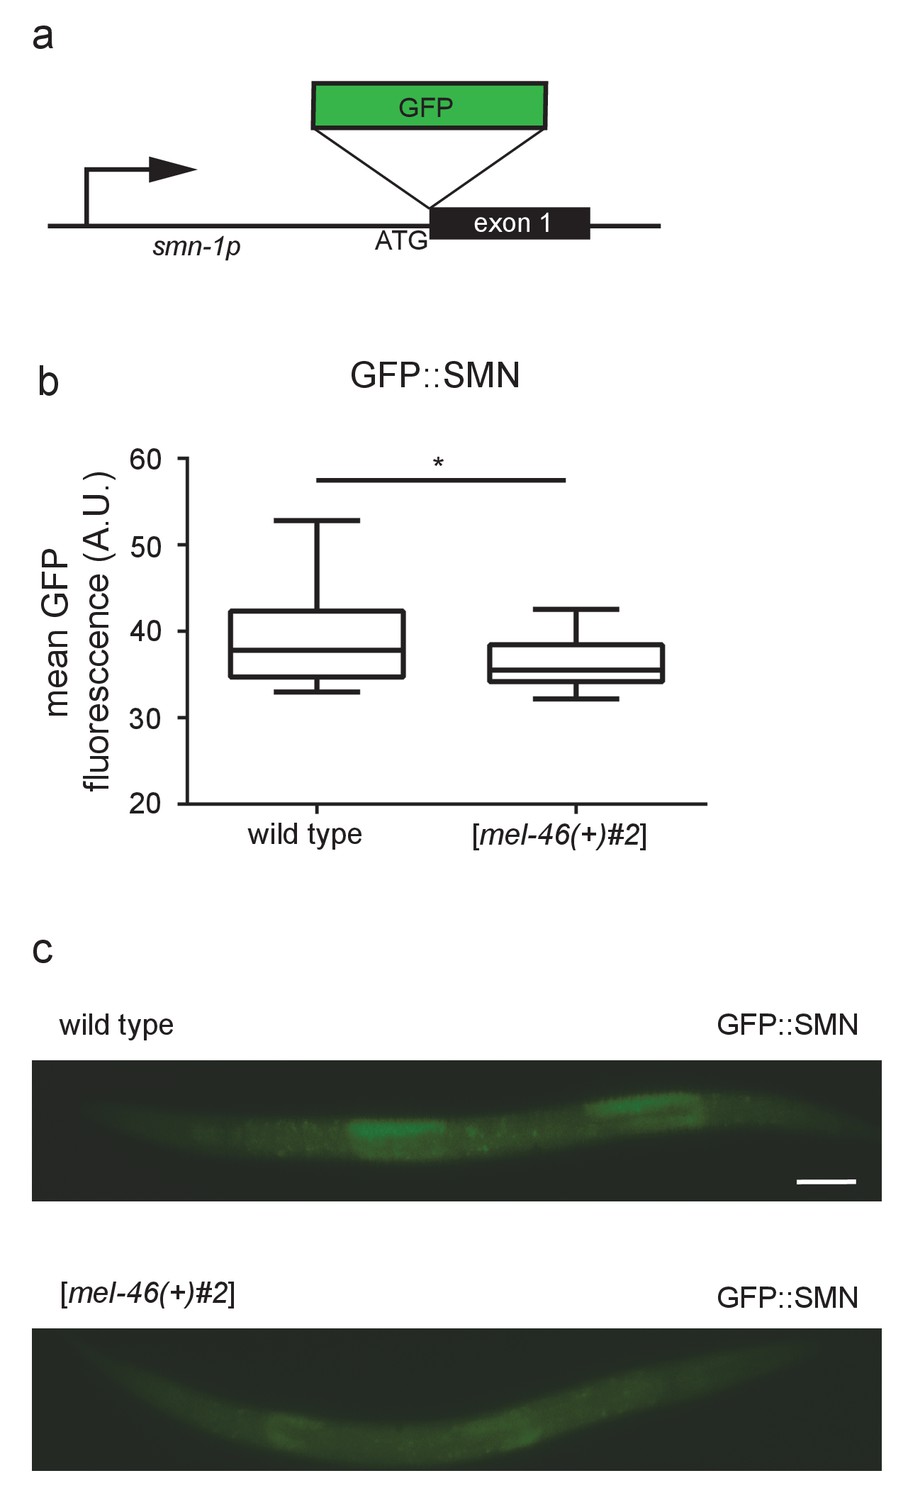
(a) Illustration: smn-1(rt280) was generated by CRISPR-mediated insertion of GFP upstream of smn-1 exon 1. (b) Increasing MEL-46 expression using the [mel-46(+)#2] array led to decreased GFP::SMN-1 fluorescence. Quantification of mean smn-1(rt280) GFP fluorescence in wild type and [mel-46(+)#2] backgrounds. Mean ± SEM; Mann-Whitney U-test, two tailed. (c) Representative images of smn-1(rt280) GFP expression in wild type and [mel-46(+)#2] larval stage L4 animals. Scale bar, 50 μm.
-
Figure 2—figure Supplement 2—source data 1
Raw Data for Figure 2—figure supplement 2.
Raw data and statistical analysis that correspond to GFP::SMN-1 quantification in Figure 2—figure supplement 2.
- https://doi.org/10.7554/eLife.20752.014
Figure 3 with 1 supplement
miR-2 is required in cholinergic neurons for proper NMJ function.
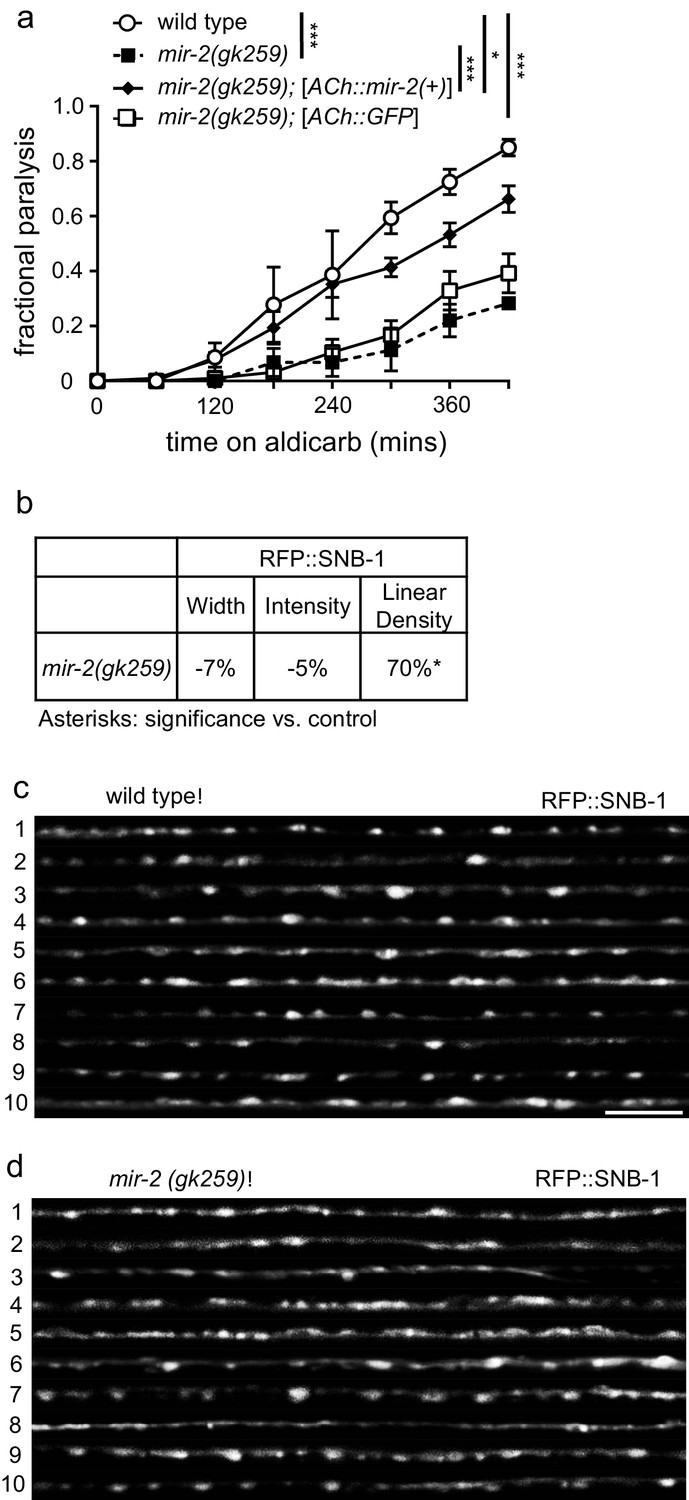
(a) mir-2(gk259) animals were resistant to paralysis by aldicarb. Expression of miR-2 behind the unc-17 (ACh) cholinergic promoter partially restored mir-2(gk259) sensitivity to aldicarb compared to transgenesis controls expressing GFP behind the same promoter. Time course for paralysis on 1 mM aldicarb for wild type (N2), mir-2(gk259), mir-2(gk259);[ACh::mir-2(+)] and mir-2(gk259);[ACh::GFP] young adult animals. Log-rank test. (b) mir-2(gk259) animals had increased RFP::SNB-1 (synaptobrevin) linear density. Percent change from wild type (N2) control for RFP::SNB-1 in the dorsal nerve cord of mir-2(gk259) animals for ‘punctaanalyzer’ parameters: puncta width (μm), intensity (AU), and linear density (number/μm). t-test, two-tailed. (c–d) Representative images of cholinergic DA MN RFP::SNB-1 in the dorsal cord of wild type and mir-2(gk259) animals. These images were taken as part of data collection. Scale bar, 5 μm.
-
Figure 3—source data 1
Raw Data for Figure 3.
Raw data and statistical analysis that correspond to aldicarb resistance assays and RFP::SNB-1 localization analysis in Figure 3.
- https://doi.org/10.7554/eLife.20752.016
Figure 3—figure supplement 1
miR-2 is required for NMJ function.
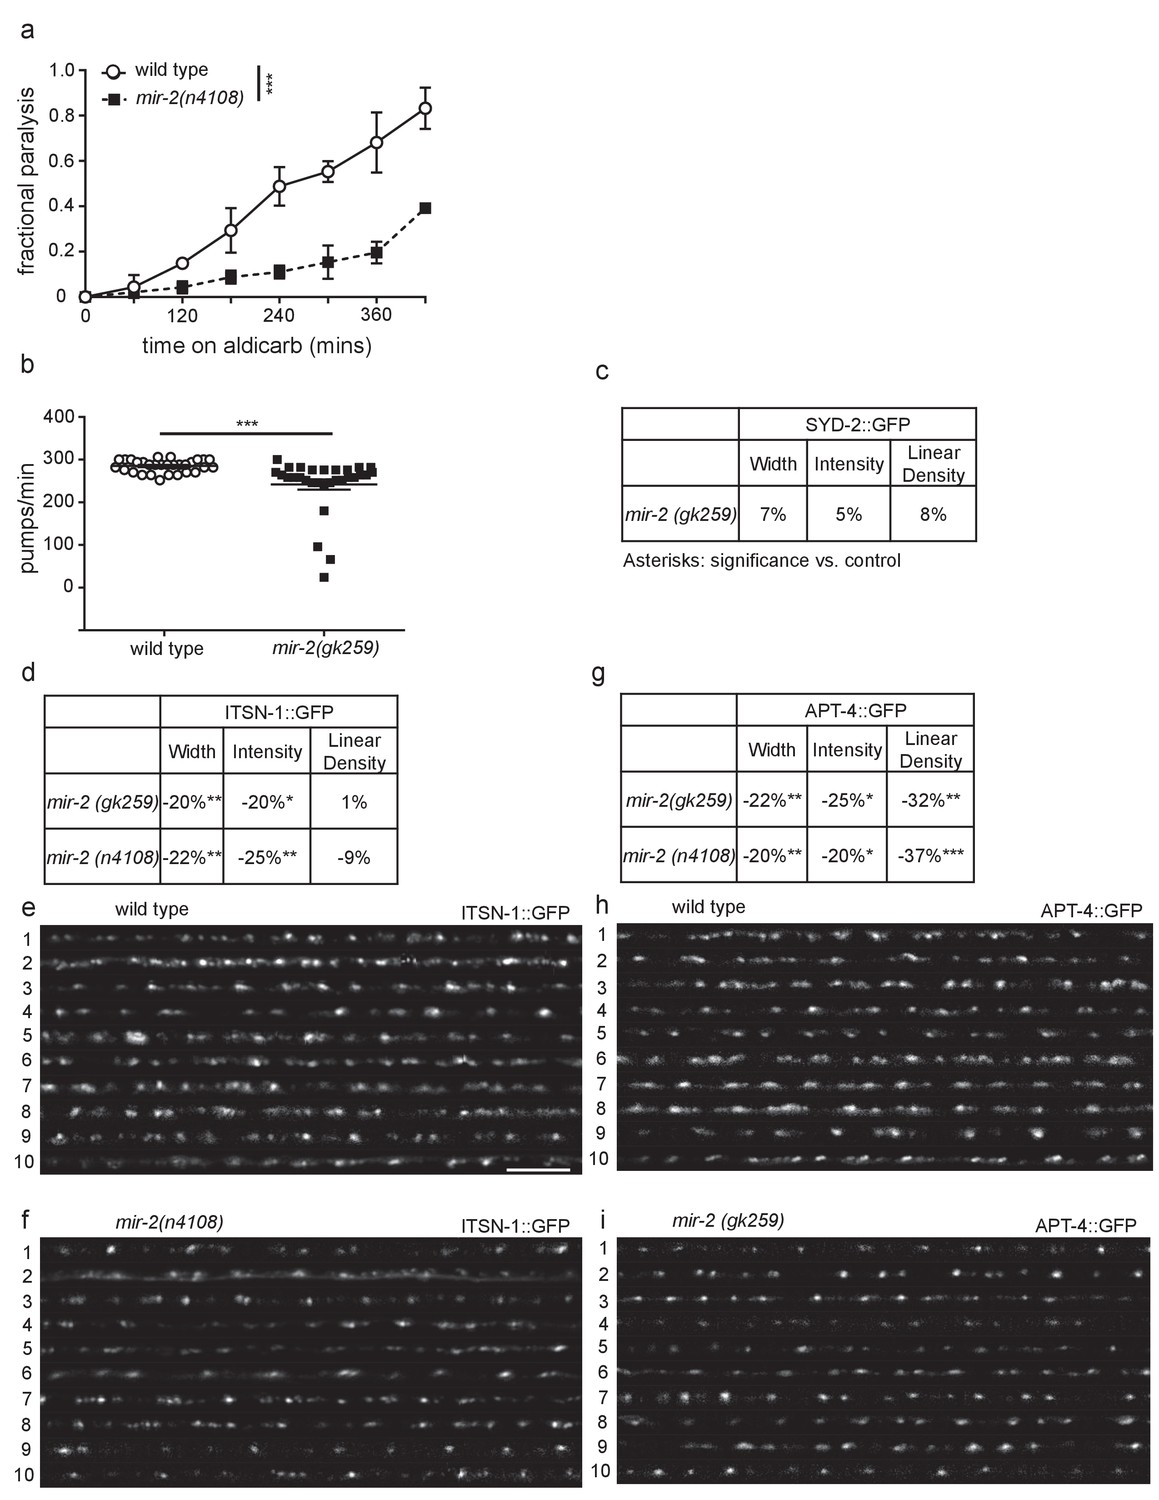
(a) mir-2(n4108) animals were resistant to the acetylcholinesterase inhibitor, aldicarb. Time course for paralysis on 1 mM aldicarb for wild type (N2) and mir-2(n4108) young adult animals. Log-rank test. (b) mir-2(gk259) animals had reduced pharyngeal pumping rates versus wild type control. Mean ± SEM; t-test, two-tailed. (c) mir-2(gk259) SYD-2 (α-liprin) levels were indistinguishable from wild type (N2). Percent change from wild type control for SYD-2 in the dorsal nerve cord of mir-2(gk259) animals for ‘punctaanalyzer’ parameters: average puncta width (μm), total intensity (AU), and linear density (number/μm). t-test, two-tailed. (d) mir-2(lf) had reduced expression of ITSN-1 (DAP160/Intersectin). Percent change from wild type (N2) control for ITSN-1 in the dorsal nerve cord of mir-2(gk259) and mir-2(n4108) animals as above. t-test, two-tailed. (e–f) Representative images of ITSN-1::GFP expressed in the dorsal nerve cord of cholinergic DA motor neurons for wild type and mir-2(n4108) animals. These images were taken as part of data collection. Scale bar, 5 μm. (g) mir-2(gk259) and mir-2(n4108) animals had reduced APT-4 (AP2 α-adaptin) levels. Percent change from wild type (N2) control for the APT-4 in mir-2(gk259) animals as above. t-test, two-tailed. (h–i) Representative images of cholinergic DA motor neuron APT-4::GFP in the dorsal cord of wild type (N2) and mir-2(gk259) animals. These images were taken as part of data collection.
-
Figure 3—figure Supplement 1—source data 1
Raw Data for Figure 3—figure supplement 1.
Raw data and statistical analysis that correspond to SYD-2::GFP localization analysis, ITSN-1::GFP localization analysis, APT-4::GFP analysis, aldicarb resistance and pumping assays in Figure 3—figure supplement 1.
- https://doi.org/10.7554/eLife.20752.018
Figure 4 with 2 supplements

miR-2 binds the gar-2 3’UTR and represses GAR-2 translation.
(a) Loss of m2R ortholog, GAR-2, suppressed aldicarb response defects of animals lacking mir-2(gk259). gar-2(ok520) animals were hypersensitive to paralysis by aldicarb. Time course for paralysis on 1 mM aldicarb for wild type (N2), mir-2(gk259), gar-2(ok520) and mir-2(gk259);gar-2(ok520) young adult animals. Log-rank test. (b) Schematic representation of changes made to the endogenous gar-2 3’UTR using CRISPR. For the wild type control (gar-2 UTRwtC), the miR-2 binding site remained intact, however, a C>T PAM site change was made. For the experimental condition (gar-2 UTRscrC), the miR-2 binding site was scrambled in addition to the C>T PAM site alteration. (c) gar-2(rt318), referred to as gar-2 UTRscrC, animals were resistant to the acetylcholinesterase inhibitor, aldicarb, compared to gar-2(rt317), referred to as gar-2 UTRwtC. Time course for paralysis on 1 mM aldicarb for young adult animals. Log-rank test. (d) Scrambling the predicted endogenous gar-2 3’UTR miR-2 binding site increased gar-2 messenger RNA levels. Quantification of gar-2 mRNA levels in young adult gar-2 UTRwtC and gar-2 UTRscrC animals. t-test, two-tailed (n = 4 for gar-2 UTRwtC and gar-2 UTRscrC). (e) Reporter constructs used to assess miR-2 regulation of gar-2 3’UTR in cholinergic neurons: rtIs56 (unc-17p-ACh::GFP::gar-2 3’UTRwt) and rtIs57 or rtIs58 (unc-17p-ACh::GFP::gar-2 3’UTRscr). unc-17p-ACh::GFP::gar-2 3’UTRwt construct contains the unc-17 promoter expressing NLS::GFP upstream of the gar-2 3’UTR, which has a predicted miR-2 binding site. Red text indicates intact seed region. unc-17p-ACh::GFP::gar-2 3’UTRscr is the same construct with the predicted miR-2 binding site scrambled identically to the sequence in gar-2 UTRscrC animals. (f) Representative images of unc-17p-ACh::GFP::gar-2 3’UTRwt expression in cholinergic neurons of wild type (N2) and mir-2(gk259) larval stage L4 animals. Scale bar, 50 μm. (g) Representative images of unc-17p-ACh::GFP::gar-2 3’UTRscr (rtIs57) expression in cholinergic neurons of wild type (N2) and mir-2(gk259) larval stage L4 animals. (h) Ratio representation of mean GFP fluorescence for wild type and mir-2(gk259) animals. t-test, two-tailed. Ratio was calculated by dividing the mean GFP fluorescence of unc-17p-ACh::GFP::gar-2 3’UTRwt for each genotype by the corresponding mean GFP fluorescence of unc-17p-ACh::GFP::gar-2 3’UTRscr for that genotype. UTRwt represents mean fluorescence for each genotype expressing the unc-17p-ACh::GFP::gar-2 3’UTRwt reporter, while UTRscr represents mean fluorescence for each genotype expressing the unc-17p-ACh::GFP::gar-2 3’UTRscr control reporter. Error bars represent the cumulative SEM for each genotype across transgenes. (see Figure 4—figure supplement 2D). (i) gar-2 transcript levels did not increase in a mir-2 loss of function background. Quantification of gar-2 mRNA levels in young adult mir-2(gk259) animals compared to wild type (N2) controls. t-test, two-tailed (n = 4 for mir-2(gk259) and N2).
-
Figure 4—source data 1
Raw Data for Figure 4.
Raw data and statistical analysis that correspond to aldicarb resistance assays, qPCR quantification, and GFP reporter analysis in Figure 4.
- https://doi.org/10.7554/eLife.20752.020
Figure 4—figure supplement 1
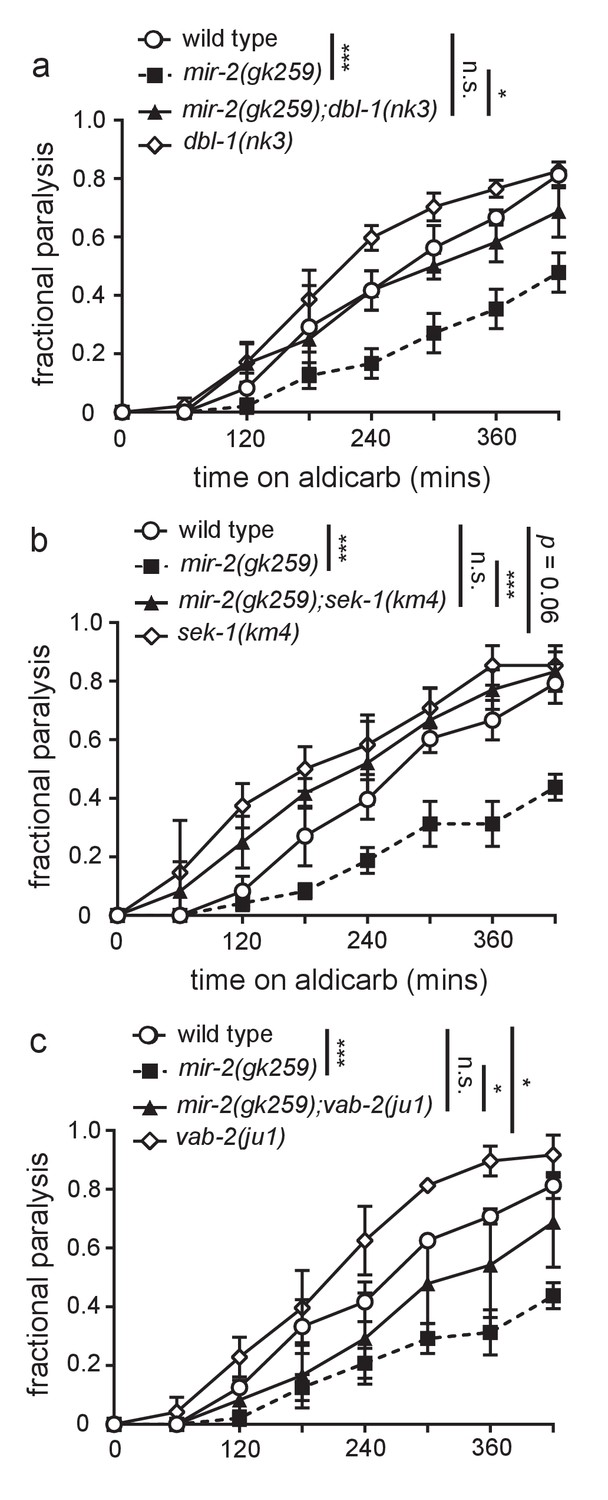
Loss of predicted miR-2 mRNA targets suppresses mir-2(lf) aldicarb resistance.
(a) Loss of DBL-1 suppressed mir-2(gk259) aldicarb resistance. Time course for paralysis on 1 mM aldicarb for wild type (N2), mir-2(n4108), mir-2(n4108);dbl-1(nk3), and dbl-1(nk3) young adult animals. Log-rank test. (b) Loss of SEK-1 suppressed mir-2(gk259) aldicarb resistance. Time course for paralysis on 1 mM aldicarb for wild type (N2), mir-2(n4108), mir-2(n4108);sek-1(km4), and sek-1(km4) young adult animals. Log-rank test. (c) Loss of VAB-2 suppressed mir-2(gk259) aldicarb resistance. Time course for paralysis on 1 mM aldicarb for wild type (N2), mir-2(n4108), mir-2(n4108);vab-2(ju1), and vab-2(ju1) young adult animals. Log-rank test.
-
Figure 4—figure Supplement 1—source data 1
Raw Data for Figure 4—figure supplement 1.
Raw data and statistical analysis that correspond to aldicarb resistance assays in Figure 4—figure supplement 1.
- https://doi.org/10.7554/eLife.20752.022
Figure 4—figure supplement 2
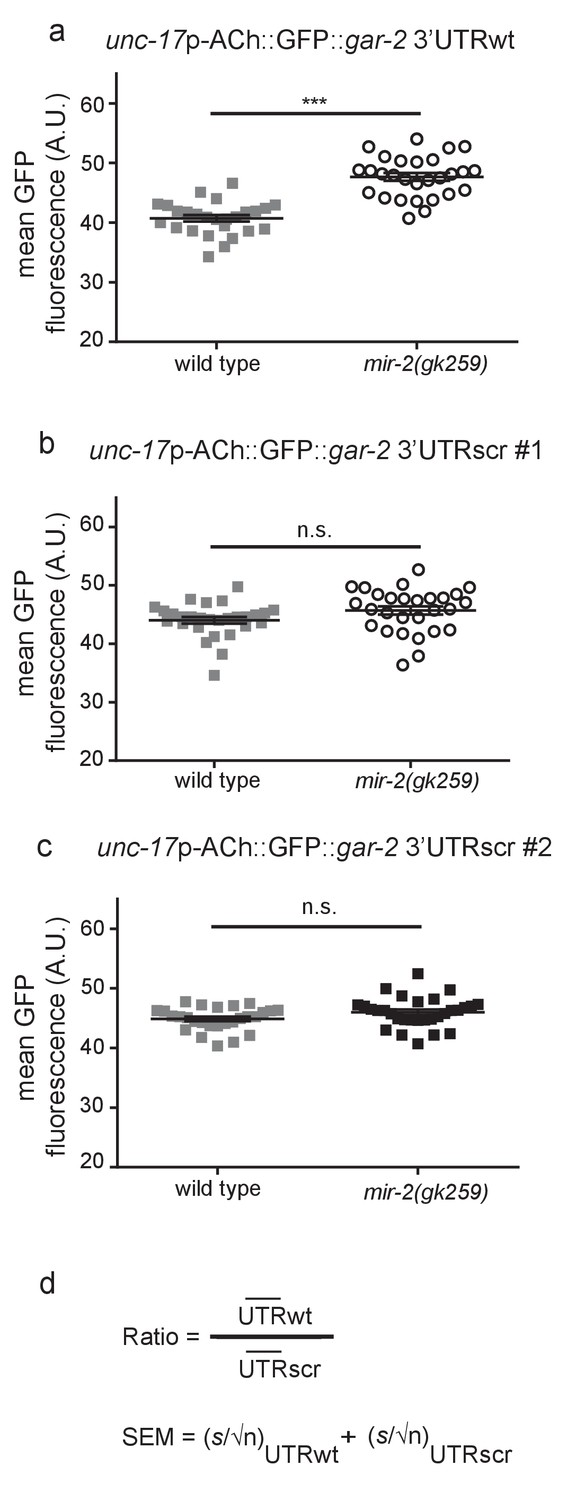
miR-2 inhibits translation by binding the gar-2 3’UTR.
(a) Loss of miR-2 results in increased expression of unc-17p-ACh::GFP::gar-2 3’UTRwt. unc-17p-ACh::GFP::gar-2 3’UTRwt mean GFP fluorescence in wild type (N2) and mir-2(gk259) backgrounds. Mean ± SEM; t-test, two-tailed. (b–c) Expression of unc-17p-ACh::GFP::gar-2 3’UTRscr was indistinguishable in mir-2(gk259) versus wild type (N2) animals for two independent integrated lines. unc-17p-ACh::GFP::gar-2 3’UTRscr mean GFP fluorescence in wild type (N2) and mir-2(gk259) backgrounds. Mean ± SEM; t-test, two-tailed. (d) Formula used to calculate the ratio and standard error of the mean (SEM) shown in Figure 4. UTRwt represents mean fluorescence for each genotype expressing the unc-17p-ACh::GFP::gar-2 3’UTRwt reporter, while UTRscr represents mean fluorescence for each genotype expressing the unc-17p-ACh::GFP::gar-2 3’UTRscr control reporter. For SEM, s represents the standard deviation of the population and n represents the number of animals analyzed.
-
Figure 4—figure Supplement 2—source data 1
Raw Data for Figure 4—figure supplement 2.
Raw data and statistical analysis that correspond to GFP reporter analysis in Figure 4—figure supplement 2.
- https://doi.org/10.7554/eLife.20752.024
Figure 5 with 1 supplement
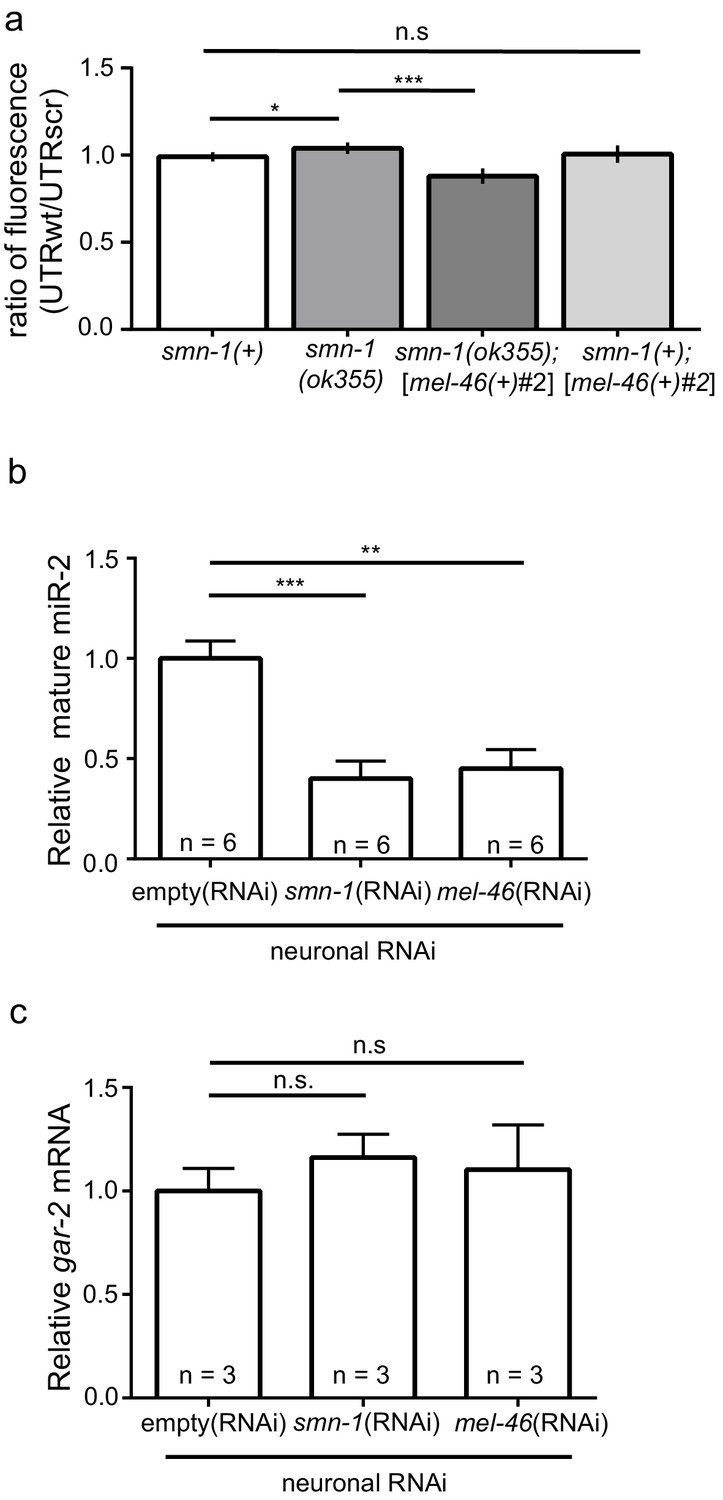
smn-1 loss of function abrogated miR-2 repression of GAR-2 expression.
(a) Loss of smn-1 caused a relative increase in unc-17p-ACh::GFP::gar-2 3’UTRwt expression. Expressing mel-46 using the broadly expressed [mel-46(+)#2] array decreased relative unc-17p-ACh::GFP::gar-2 3’UTRwt expression in smn-1(ok355) animals. Ratio representation of mean GFP fluorescence for smn-1(+), smn-1(ok355), smn-1(ok355);[mel-46(+)#2], and smn-1(+);[mel-46(+)#2] animals. Mann-Whitney U-test, two-tailed. Ratio calculation was completed in the same manner as Figure 4H (see also Figure 4—figure supplement 2D) (b) miR-2 levels were decreased in neurons when either SMN-1 or MEL-46 were decreased. Quantification of mature miR-2 for empty(RNAi), smn-1(RNAi), and mel-46(RNAi) young adult animals relative to housekeeping miRNA miR-60. t-test, two-tailed (n = 6 for each condition). (c) gar-2 transcript levels did not change when SMN-1 or MEL-46 levels decreased in neurons. Quantification of gar-2 mRNA for empty(RNAi), smn-1(RNAi), and mel-46(RNAi) young adult animals. t-test, two-tailed (n = 3 for each condition). (c–d) Animals sensitive to RNAi in only neurons (TU3401) were fed bacteria expressing double-stranded RNA (dsRNA) against mel-46 or smn-1. Control animals were fed bacteria expressing an empty vector control: empty(RNAi).
-
Figure 5—source data 1
Raw data for Figure 5.
- https://doi.org/10.7554/eLife.20752.026
Figure 5—figure supplement 1
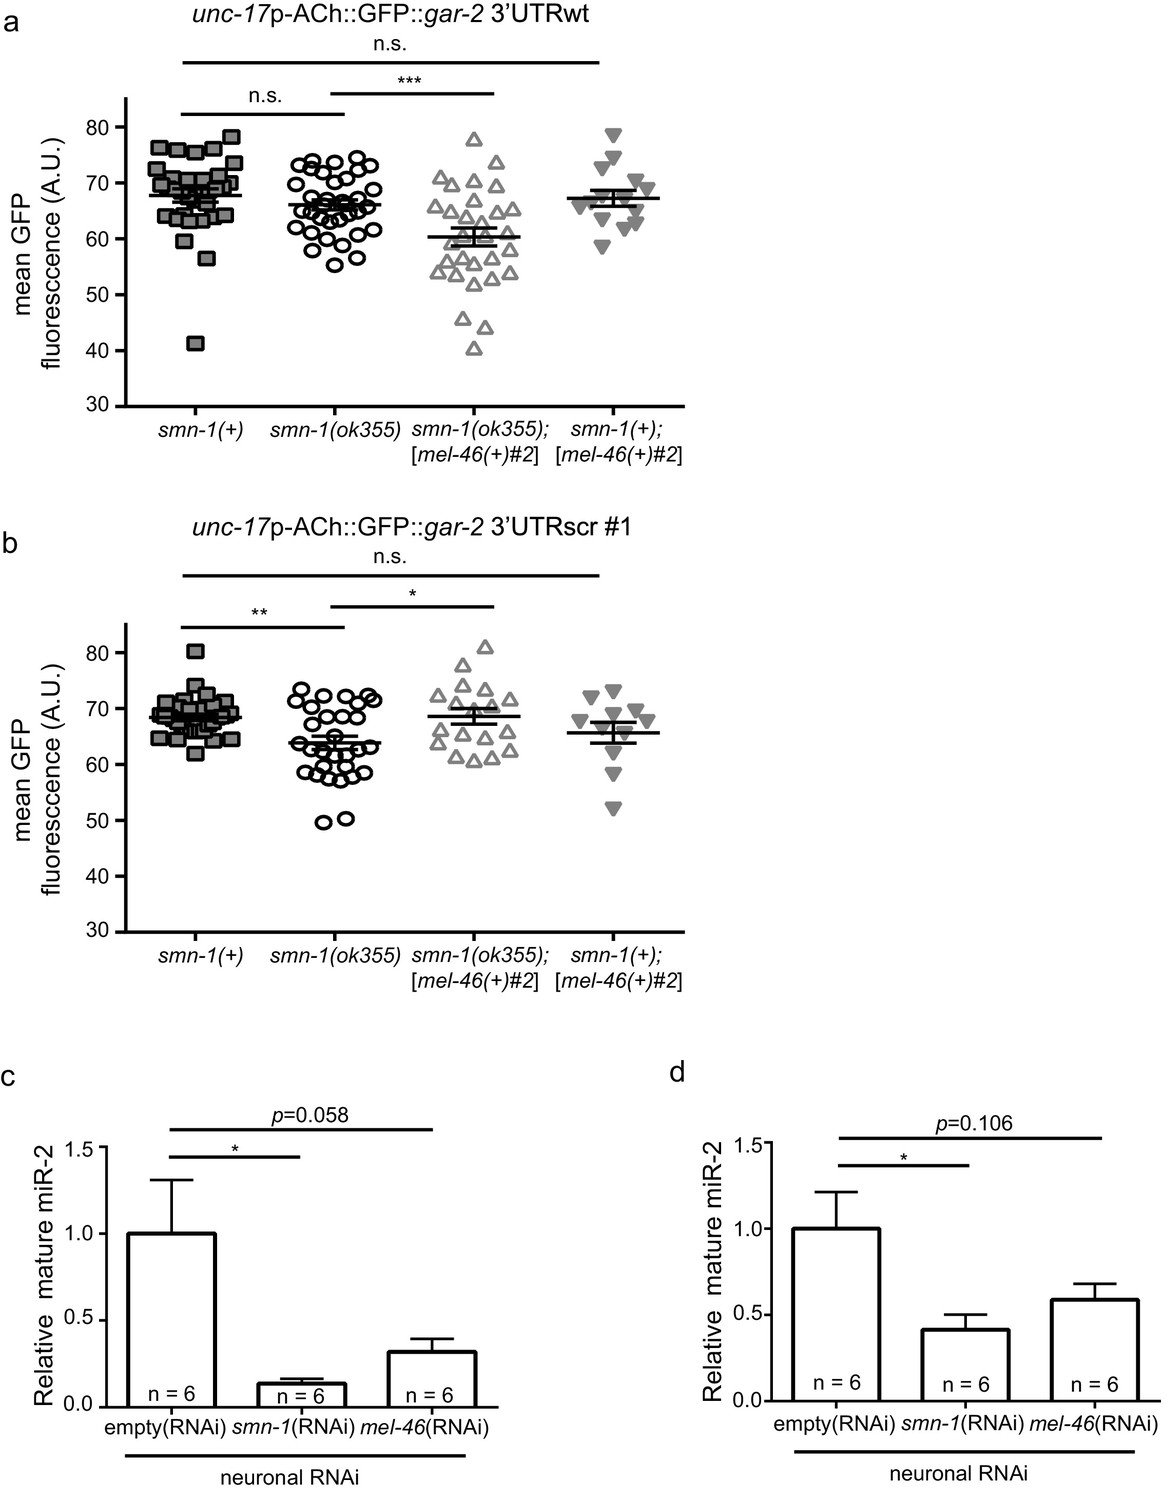
Increasing MEL-46(Gemin3) ameliorates smn-1(lf) defective miR-2 activity.
(a) Expression of mean unc-17p-ACh::GFP::gar-2 3’UTRscr (rtIs57) fluorescence was decreased in smn-1(ok355) compared to smn-1(+) control animals. Increasing MEL-46 levels using the [mel-46(+)#2] array did not alter expression versus smn-1(+) controls. Mean unc-17p-ACh::GFP::gar-2 3’UTRwt fluorescence in smn-1(+), smn-1(ok355), smn-1(ok355);[mel-46(+)#2], and smn-1(+);[mel-46(+)#2] animals. Mean ± SEM; Mann-Whitney U-test, two tailed. (b) Expression of mean unc-17p-ACh::GFP::gar-2 3’UTRwt fluorescence was indistinguishable between smn-1(+) and smn-1(ok355) animals; increasing MEL-46 using the [mel-46(+)#2] array reduced expression versus control. Mean unc-17p-ACh::GFP::gar-2 3’UTRwt fluorescence in smn-1(+), smn-1(ok355), smn-1(ok355);[mel-46(+)#2], and smn-1(+);[mel-46(+)#2] animals. Mean ± SEM; Mann-Whitney U-test, two tailed. (c) miR-2 levels were decreased in neurons when either SMN-1 or MEL-46 were decreased. Quantification of mature miR-2 for empty(RNAi), smn-1(RNAi), and mel-46(RNAi) young adult animals relative to housekeeping gene act-1. t-test, two-tailed (n = 6 for each condition). (d) miR-2 levels were decreased in neurons when either SMN-1 or MEL-46 were decreased. Quantification of mature miR-2 for empty(RNAi), smn-1(RNAi), and mel-46(RNAi) young adult animals relative to housekeeping rRNA 18s. t-test, two-tailed (n = 6 for each condition).
-
Figure 5—figure Supplement 1—source data 1
Raw Data for Figure 5—figure supplement 1.
Raw data and statistical analysis that correspond to GFP reporter analysis and qPCR quantification in Figure 5—figure supplement 1.
- https://doi.org/10.7554/eLife.20752.028
Figure 6 with 1 supplement

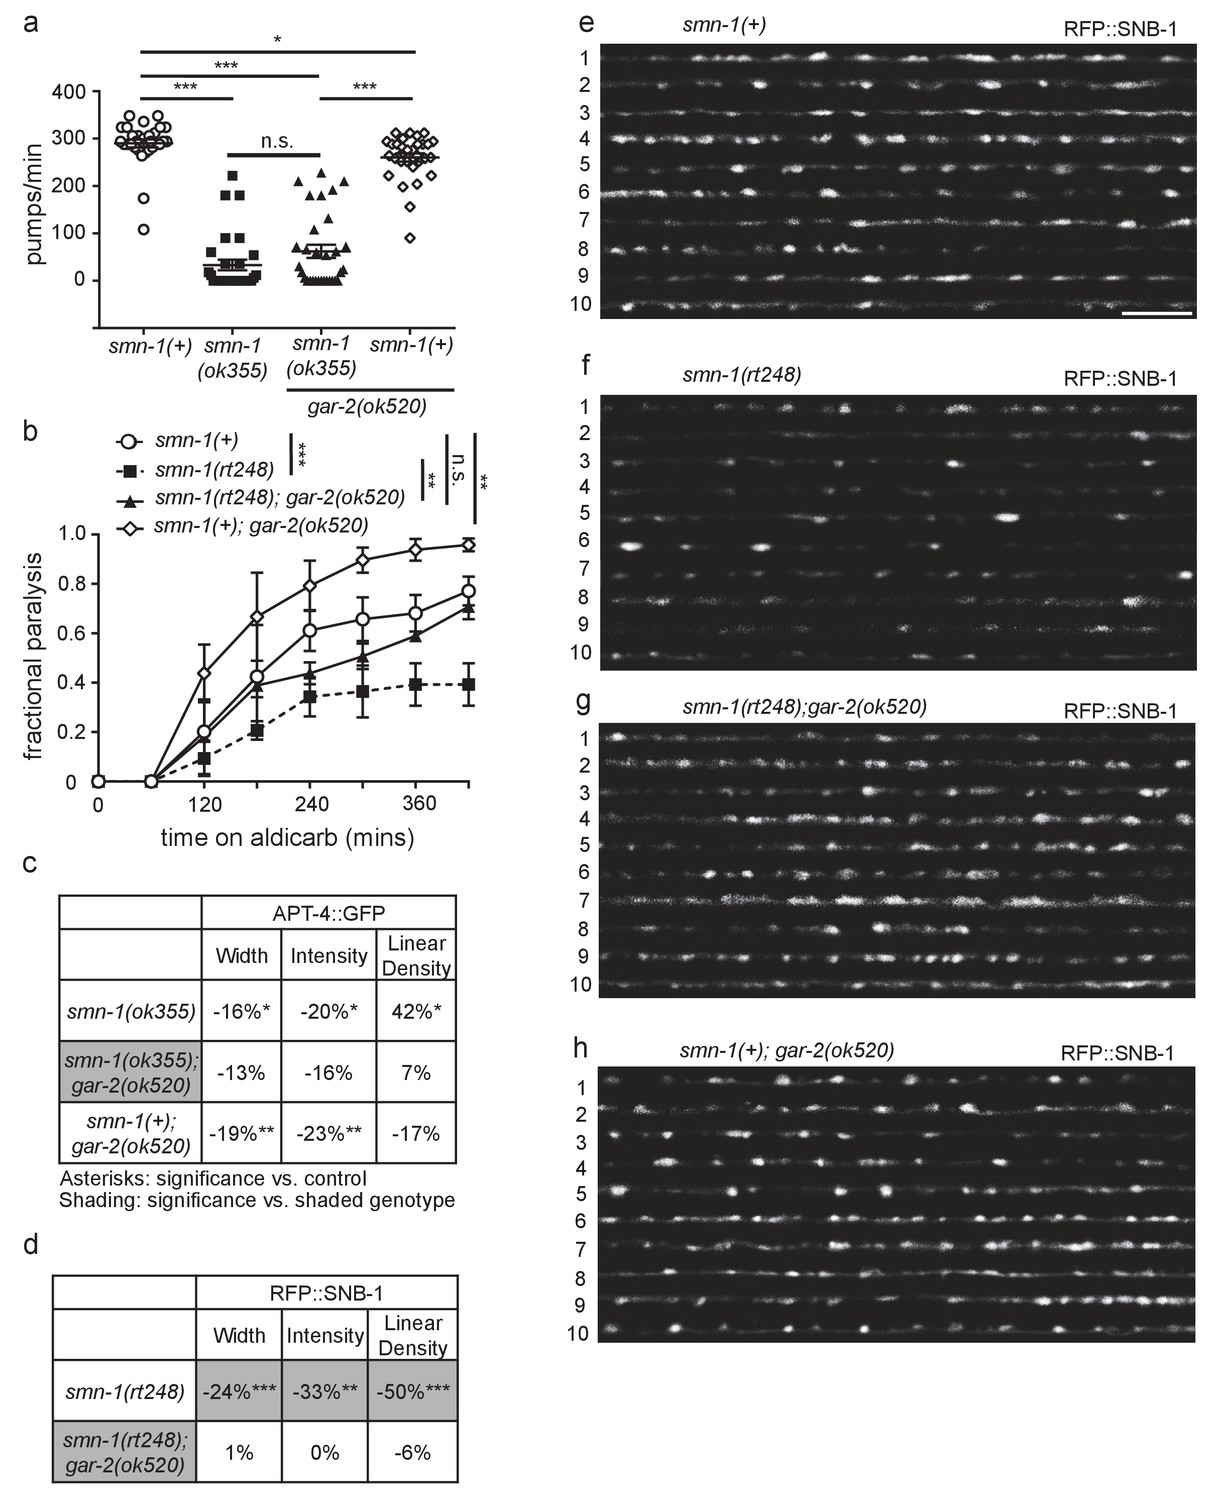
Loss of gar-2 ameliorated smn-1(lf) NMJ defects.
(a) Loss of gar-2 rescued smn-1(ok355) aldicarb response defect. Time course for paralysis on 1 mM aldicarb for smn-1(+), smn-1(ok355), smn-1(ok355);gar-2(ok520), and smn-1(+);gar-2(ok520) early larval stage L4 animals. Log-rank test. (b) Loss of gar-2 rescued mel-46(tm1739) aldicarb response defect. Time course for paralysis on 1 mM aldicarb for mel-46(+), mel-46(tm1739), mel-46(tm1739);gar-2(ok520), and smn-1(+);gar-2(ok520) early larval stage L4 animals. Log-rank test. For these experiments, mel-46(tm1739) was maintained over the nT1 balancer and therefore, control mel-46(+) animals were obtained as +/+ animals from +/nT1 heterozygous mothers. (c) Loss of gar-2 rescued smn-1(ok355) RFP::SNB-1 synaptic localization defects. gar-2 loss in the smn-1(+) background resulted in increased RFP::SNB-1 puncta width and intensity. Percent change from smn-1(+) control for RFP::SNB-1 in the dorsal nerve cord of smn-1(ok355), smn-1(ok355);gar-2(ok520), and smn-1(+);gar-2(ok520) animals for ‘punctaanalyzer’ parameters: puncta width (μm), intensity (AU), and linear density (number/μm). Asterisks denote significance compared to smn-1(+) control; shading indicates significant difference from smn-1(ok355);gar-2(ok520). Mann-Whitney U-test, two-tailed. Loss of gar-2 rescued RFP::SNB-1 puncta width defects (smn-1(+) control animals versus smn-1(ok355);gar-2(ok520) p=0.76; smn-1(ok355) versus smn-1(ok355);gar-2(ok520) p=0.0001), restored SNB-1 puncta intensity (smn-1(+) control animals versus smn-1(ok355);gar-2(ok520) p=1.00; smn-1(ok355) versus smn-1(ok355);gar-2(ok520) p=0.0001) and rescued SNB-1 puncta linear density defects (smn-1(+) control animals versus smn-1(ok355);gar-2(ok520) p=0.08; smn-1(ok355) versus smn-1(ok355);gar-2(ok520) p=0.02). (d–g) Representative images of cholinergic DA MN RFP::SNB-1 in the dorsal nerve cord of smn-1(+), smn-1(ok355), smn-1(ok355);gar-2(ok520), and smn-1(+);gar-2(ok520). These images were taken as part of data collection. Scale bar, 5 μm. Figures D and G are also shown in Figure 6—figure supplement 1 since this control data was collected alongside both ok355 and rt248 RFP::SNB-1 data.
-
Figure 6—source data 1
Raw Data for Figure 6.
Raw data and statistical analysis that correspond to RFP::SNB-1 localization analysis and aldicarb resistance assays in Figure 6.
- https://doi.org/10.7554/eLife.20752.030
Figure 6—figure supplement 1
Decreasing GAR-2(m2R) levels rescues NMJ defects in smn-1(lf) and mel-46(lf) animals.
(a) smn-1(ok355) animals had reduced pharyngeal pumping rates versus smn-1(+) control animals; defects were not rescued by loss of GAR-2. Mean ± SEM; Mann-Whitney U-test, two tailed. (b) Loss of GAR-2 ameliorated smn-1(rt248) aldicarb response. smn-1(+);gar-2(ok520) animals were hypersensitive to aldicarb. Time course for paralysis on 1 mM aldicarb in smn-1(+), smn-1(rt248), smn-1(rt248);gar-2(ok520), and smn-1(+);gar-2(ok520) early larval stage L4 animals. Log-rank test. (c) Loss of GAR-2 did not rescue smn-1(ok355) APT-4 (AP2 α-adaptin) defects. Loss of GAR-2 in the smn-1(+) background resulted in decreased APT-4 puncta width and intensity. Percent change from smn-1(+) control for APT-4 in the dorsal cord of smn-1(ok355), smn-1(ok355);gar-2(ok520), and smn-1(+);gar-2(ok520) animals for ‘punctaanalyzer’ parameters: average puncta width (μm), intensity (AU), and linear density (number/μm). Asterisks denote significance compared to smn-1(+) control. Mann-Whitney U-test, two-tailed. GAR-2 loss did not rescue APT-4 puncta width (smn-1(+) control versus smn-1(ok355);gar-2(ok520) p=0.12; smn-1(ok355) versus smn-1(ok355);gar-2(ok520) p=0.48), did not rescue APT-4 puncta intensity (smn-1(+) control versus smn-1(ok355);gar-2(ok520) p=0.08; smn-1(ok355) versus smn-1(ok355);gar-2(ok520) p=0.54) and did not rescue APT-4 puncta linear density (smn-1(+) control versus smn-1(ok355);gar-2(ok520) p=0.66; smn-1(ok355) versus smn-1(ok355);gar-2(ok520) p=0.07). (d) Loss of GAR-2 ameliorated smn-1(rt248) SNB-1 (synaptobrevin) defects. Percent change from smn-1(+) control for SNB-1 in the dorsal nerve cord of smn-1(rt248), and smn-1(rt248);gar-2(ok520) animals for all ‘punctaanalyzer’ parameters: average puncta width (μm), total intensity (AU), and linear density (number/μm). smn-1(+);gar-2(ok520) percent change was collected alongside this data and is shown in Figure 5B. Asterisks denote significance compared to smn-1(+) control; shading indicates significant difference from smn-1(rt248);gar-2(ok520). Mann-Whitney U-test, two-tailed. Loss of GAR-2 rescued SNB-1 puncta width (smn-1(+) control versus smn-1(rt248);gar-2(ok520) p=0.83; smn-1(rt248) versus smn-1(rt248);gar-2(ok520) p=0.004), restored SNB-1 total puncta intensity (smn-1(+) control versus smn-1(rt248);gar-2(ok520) p=0.91; smn-1(rt248) versus smn-1(rt248);gar-2(ok520) p=0.004) and rescued SNB-1 puncta linear density (smn-1(+) control versus smn-1(rt248);gar-2(ok520) p=0.97; smn-1(rt248) versus smn-1(rt248);gar-2(ok520) p=0.002). (Martinez et al.) Representative images of SNB-1::RFP expressed in the dorsal nerve cord of cholinergic DA motor neurons for smn-1(+), smn-1(rt248), smn-1(rt248);gar-2(ok520), and smn-1(+);gar-2(ok520). These images were taken as part of data collection. Scale bar, 5 μm. Figures E and H were taken from Figure 5 since this data was collected alongside both ok355 and rt248 SNB-1::RFP data.
-
Figure 6—figure Supplement 1—source data 1
Raw Data for Figure 6—figure supplement 1.
Raw data and statistical analysis that correspond to APT-4::GFP localization analysis, RFP::SNB-1 localization analysis, aldicarb resistance and pumping assays in Figure 6—figure supplement 1.
- https://doi.org/10.7554/eLife.20752.032
Figure 7 with 1 supplement
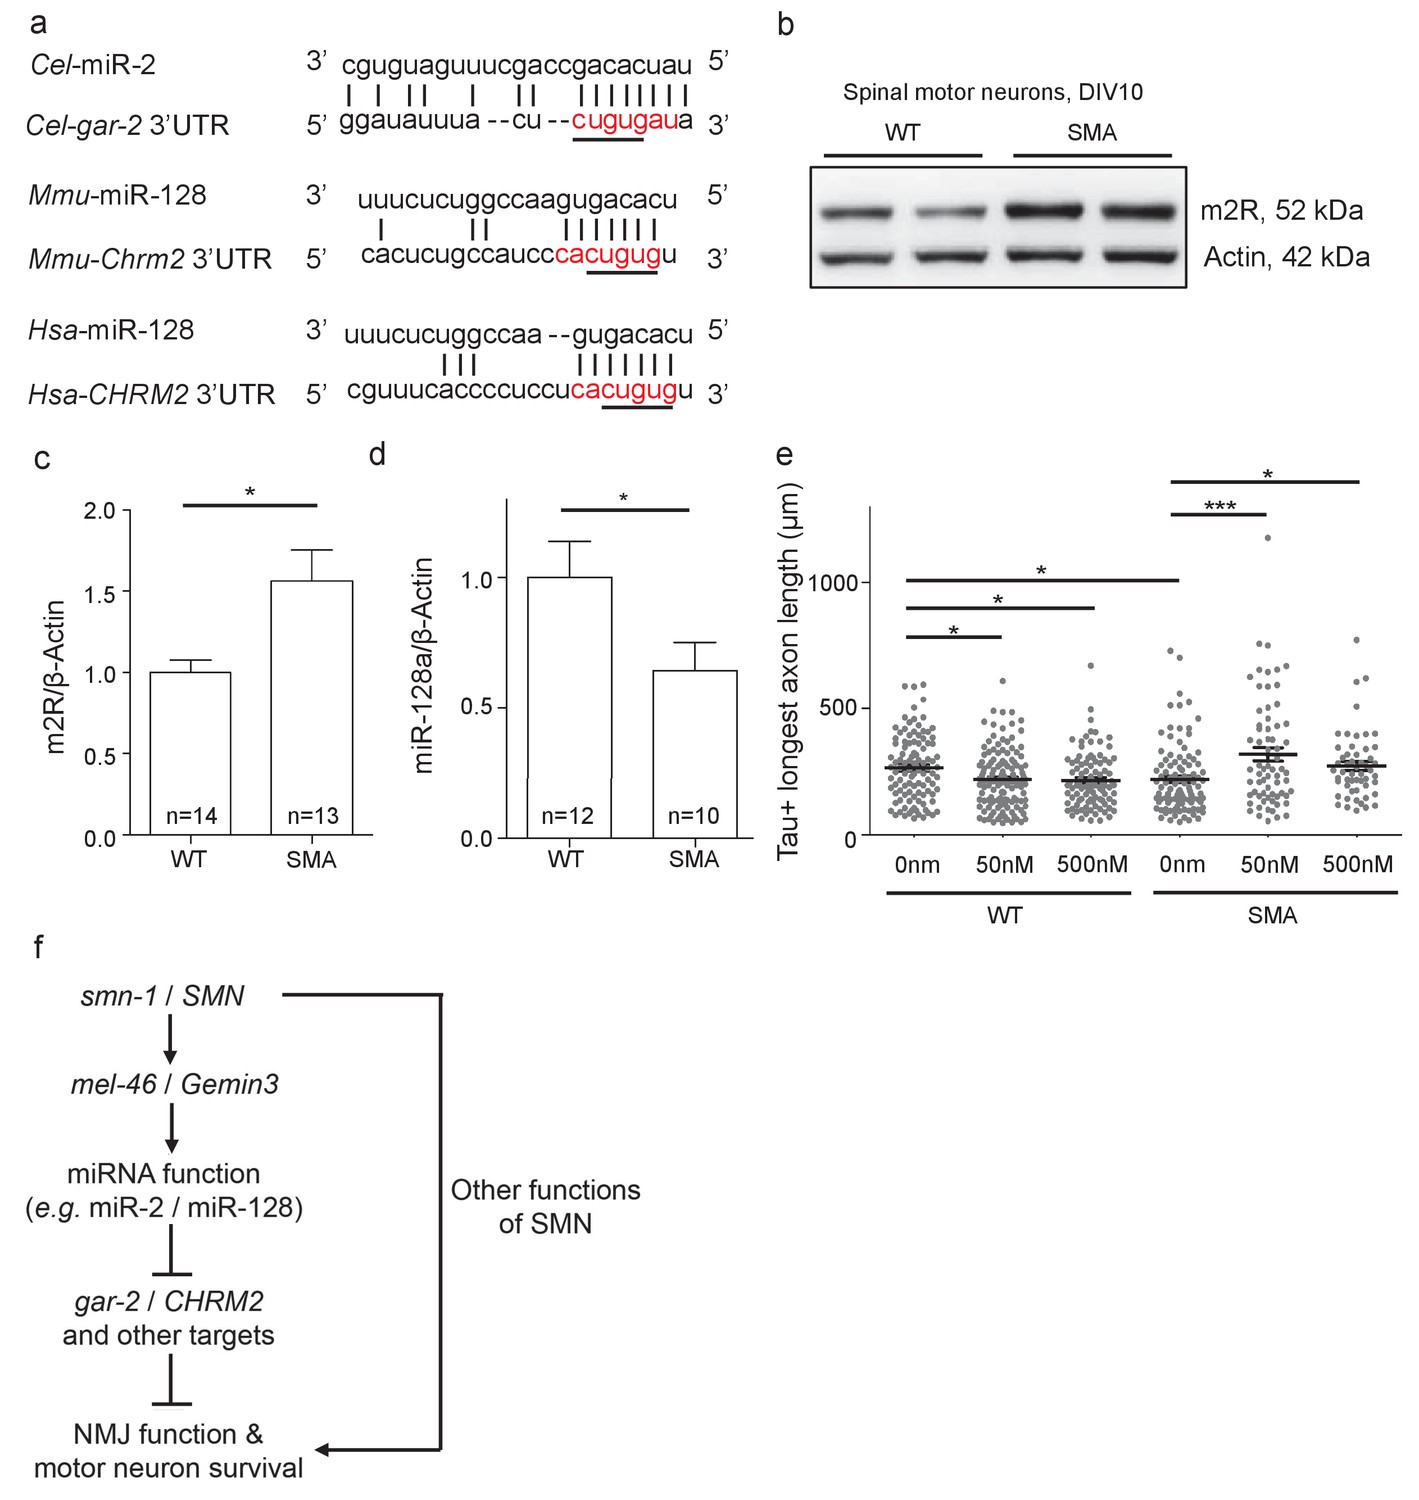
Increased m2R muscarinic receptor levels in SMA mouse model MNs contribute to axon outgrowth defects.
(a) Alignment of predicted miR-2 or miR-128 binding sites for C. elegans, mouse and human gar-2 or CHRM2 3’UTRs. CHRM2 encodes the mR2 muscarinic receptor (Paraskevopoulou et al., 2013; Reczko et al., 2012). Predicted nucleotide pairing shown by vertical lines. Red text indicates predicted miRNA seed region. A black line indicates potential seed region conservation. (b) Representative image for two E13.5 wild type and two Smn-/-;SMN2tg/0 DIV10 spinal MN immunoblots probed for m2R and control β-Actin. (c) Quantification of immunoblot, t-test, two-tailed, p=0.017 (n = 14 for WT and n = 13 for SMA). (d) Quantification of miR-128 levels in DIV10 spinal MNs from E13.5 wild type and Smn-/-;SMN2tg/0 animals. t-test, two-tailed (n = 24 from 12 mice for WT; n = 20 from 10 mice for SMA). (e) Longest axon length for E13.5 wild type and Smn-/-;SMN2tg/0 DIV5 spinal MNs treated with 0 nm, 50 nm, and 500 nm methoctramine. t-test, two-tailed. (n = 103 for WT 0 nM, n = 131 for WT 50 nM, n = 98 for WT 500 nM, n = 102 for SMA 0 nM, n = 67 for SMA 50 nM and n = 53 for SMA 500 nM) (f) Proposed model: SMN acts via MEL-46 to influence microRNAs that play important roles in NMJ function and MN survival. SMN loss affects other pathways as well. C. elegans genes shown on left side; human genes on right side.
Figure 7—figure supplement 1

m2R inhibition by methoctramine increases axon length in SMA mouse model MNs.
(a) Total axon length for E13.5 wild type and Smn-/-;SMN2tg/0 DIV5 spinal MNs treated with 0 nm, 50 nm, and 500 nm methoctramine. ‘Total axon length’ is a measurement of all axon branches. t-test, two-tailed. n = 103 for WT 0 nM, n = 131 for WT 50 nM, n = 98 for WT 500 nM, n = 102 for SMA 0 nM, n = 67 for SMA 50 nM and n = 53 for SMA 500 nM. Neurons are from at least three biological samples.
Additional files
-
Supplementary file 1
Summary of C. elegans experiments.
- https://doi.org/10.7554/eLife.20752.035
-
Supplementary file 2
C. elegans strains and other materials utilized.
(A) Strains used for this work; related to materials and methods. (B) Primers and ssODNs used for this work; related to materials and methods. (C) Arrays/integrated lines/alleles with abbreviation in text and figures.
- https://doi.org/10.7554/eLife.20752.036
Download links
A two-part list of links to download the article, or parts of the article, in various formats.
Downloads (link to download the article as PDF)
Open citations (links to open the citations from this article in various online reference manager services)
Cite this article (links to download the citations from this article in formats compatible with various reference manager tools)
Decreased microRNA levels lead to deleterious increases in neuronal M2 muscarinic receptors in Spinal Muscular Atrophy models
eLife 6:e20752.
https://doi.org/10.7554/eLife.20752


