Structure and dynamics underlying elementary ligand binding events in human pacemaking channels
- University of Wisconsin-Madison, United States
Figures
Figure 1 with 2 supplements
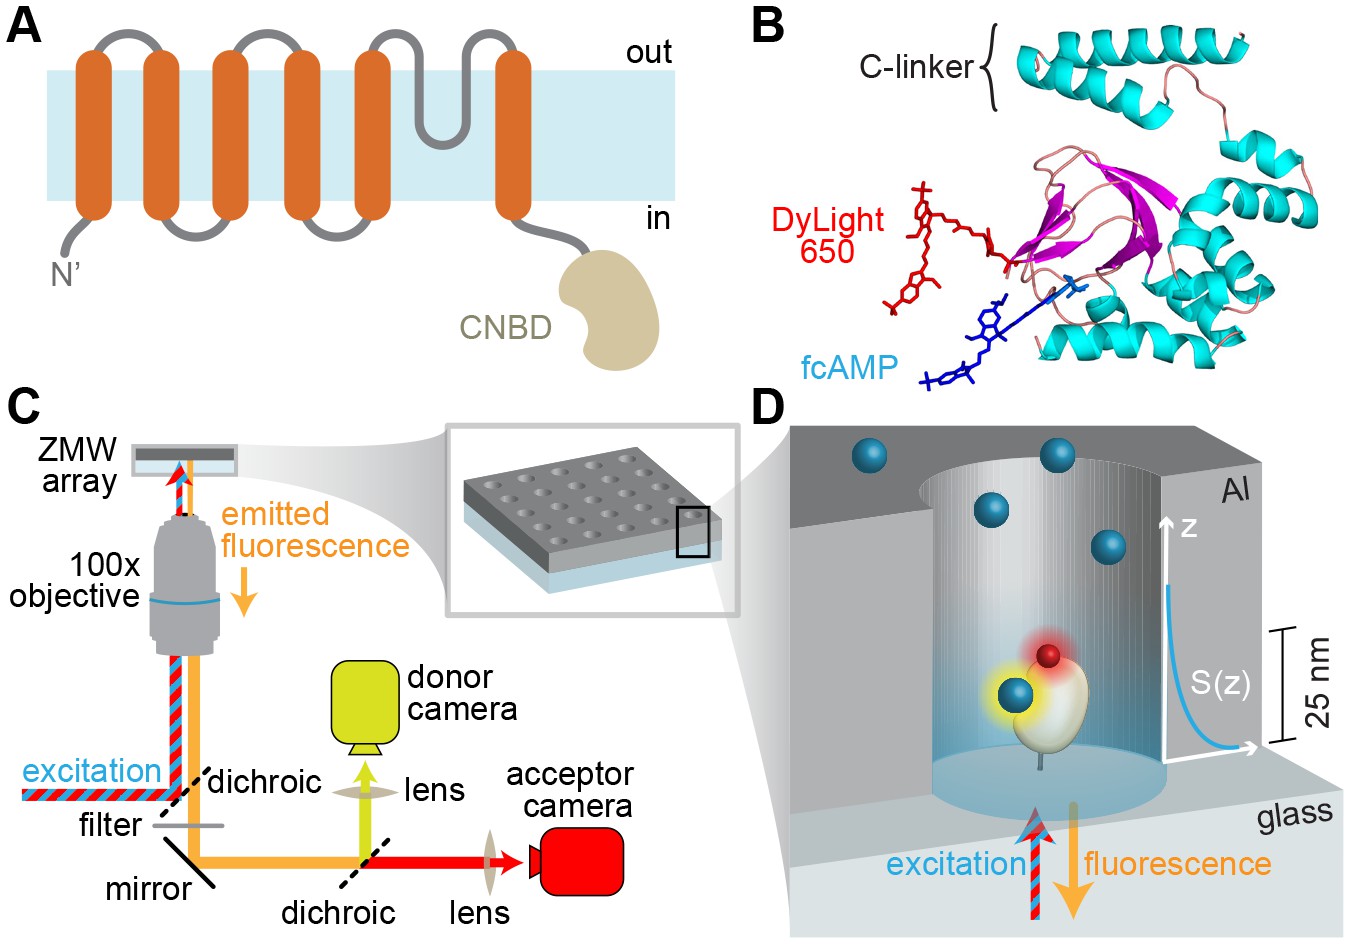
Imaging ligand binding to single molecules in ZMWs.
(A) HCN2 channel subunit transmembrane topology is homologous to canonical voltage-gated potassium channel subunits with the exception of a CNBD following the pore lining S6 helix. (B) Isolated CNBD colored by secondary structure with fluorescent acceptor DyLight 650 maleimide attached at position E571C and bound donor fcAMP (cAMP + DyLight 547) shown. (C) ZMW smFRET imaging setup (inset shows a rendering of an array of ZMWs) and (D) cartoon of an individual ZMW with a single fcAMP-bound acceptor-labeled CNBD tethered to the optical surface within the aluminum (Al) nanopore (drawing is not to scale). Bound fcAMP (blue sphere) near the bottom of the ZMW is directly excited and emission from the acceptor (red sphere) on the CNBD due to FRET is observed. In contrast, freely diffusing fcAMP molecules are shown near the top of the ZMW where they are outside of the effective near-field observation volume, and thus not observed. The scale bar to the right of the ZMW indicates a typical length constant for the exponentially decaying observation volume S(z), which was estimated by extrapolating reported values for various ZMW diameters (Levene et al., 2003).
Figure 1—figure supplement 1
Bulk solution fluorescence imaging of fcAMP binding.
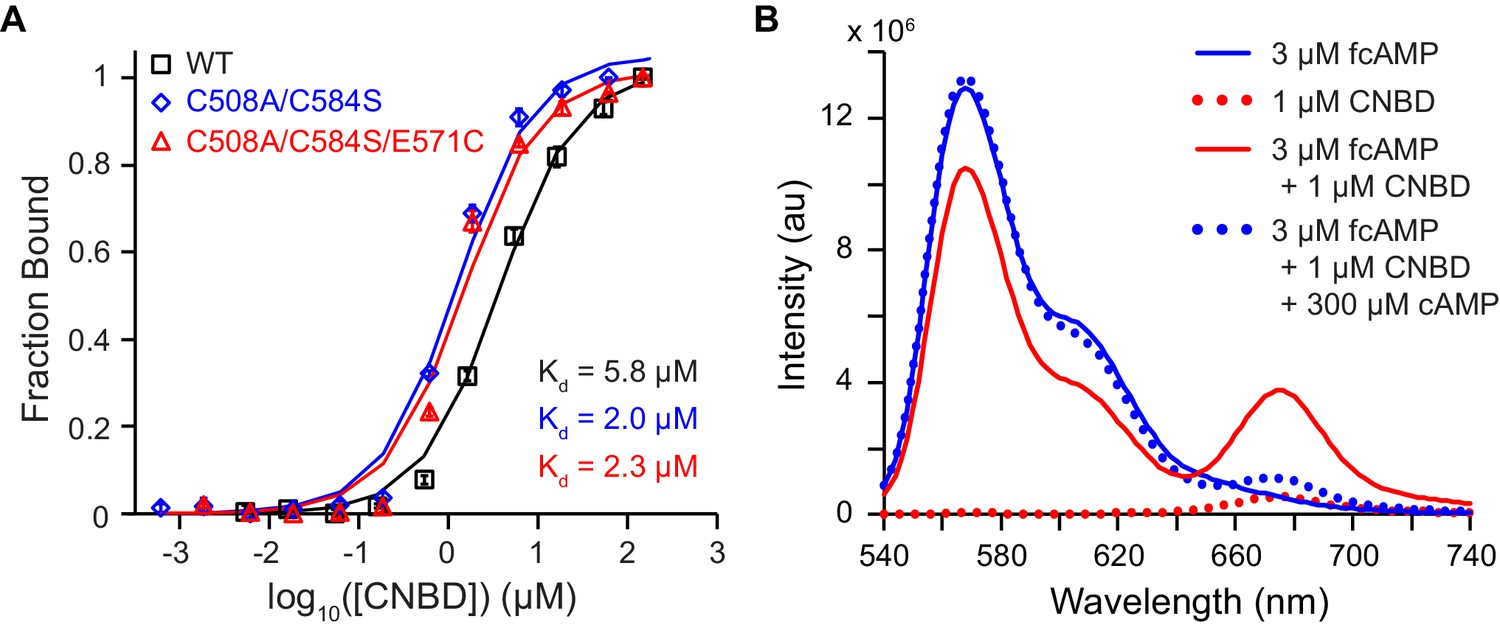
(A) Bound probability obtained by measuring fcAMP bulk solution anisotropy plotted as a function of CNBD concentration for wild type and mutant HCN2 CNBDs. (B) Solution FRET between bound fcAMP and acceptor-labeled CNBD. Sensitized emission spectra (excitation at 532 nm) under various conditions. The emission max of fcAMP is 566 nm and the acceptor on the CNBD is 675 nm. Under FRET conditions, fcAMP serves as a donor and the CNBD as an acceptor. To check specificity of binding, we used excess of non-fluorescent cAMP to displace bound fcAMP.
Figure 1—figure supplement 2
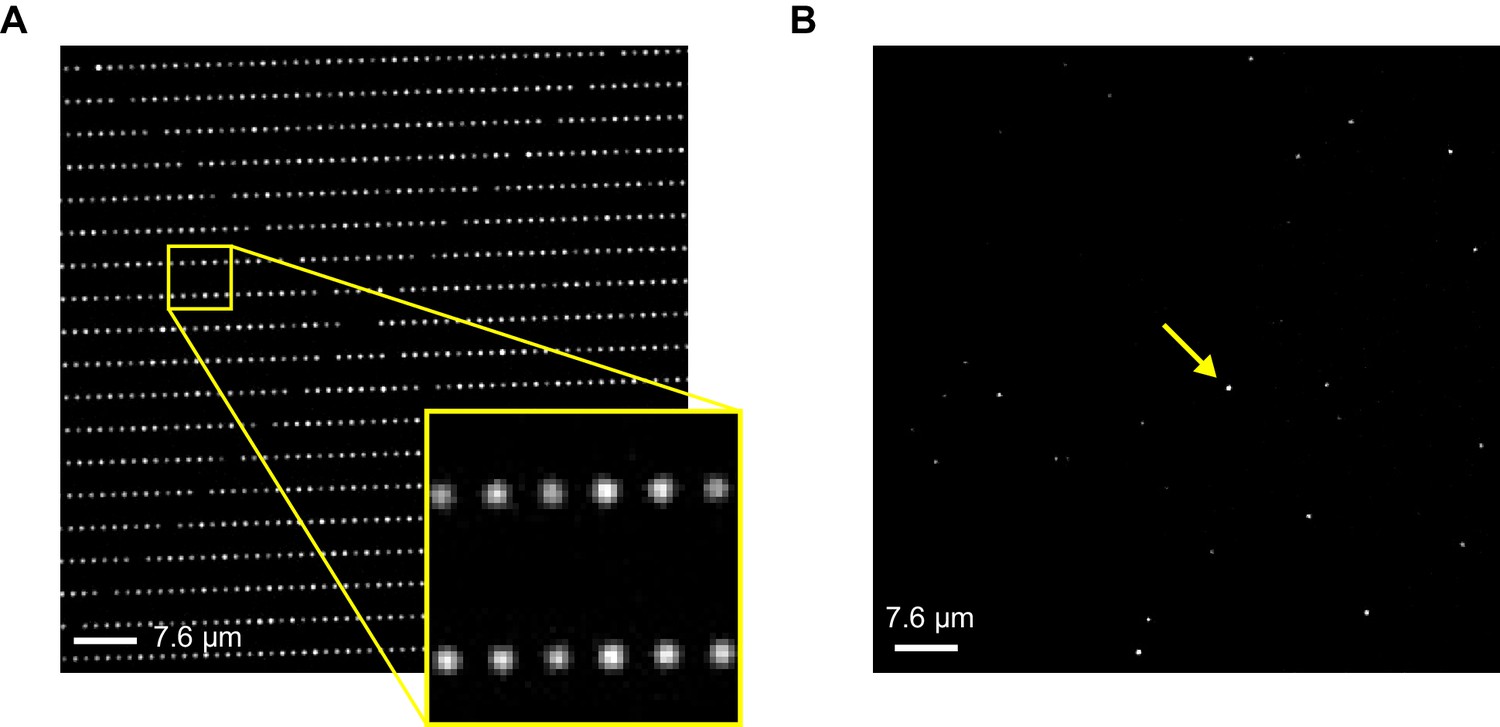
Imaging ZMW arrays.
Brightfield (A) and fluorescence (B) images of an array of ZMW nanoholes with diameters of approximately 200 nm. Bright spots in the fluorescence image reflect the subset of ZMWs that contain a fluorescently labeled CNBD molecule (one of these is indicated by an arrow).
Figure 2 with 1 supplement
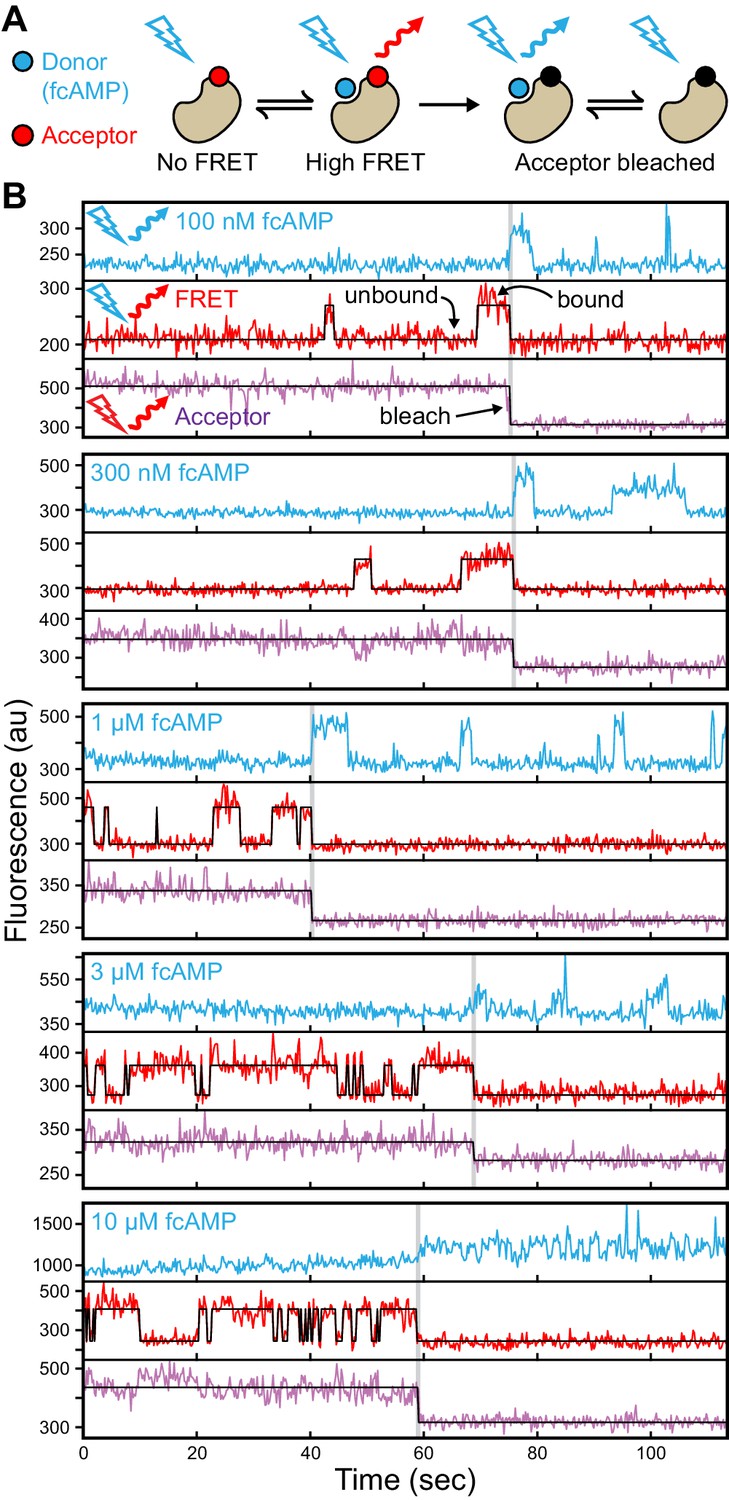
Singe-molecule FRET imaging of binding dynamics at micromolar concentrations.
(A) Cartoon depicting smFRET during fcAMP binding. Direct excitation of the donor fcAMP results in stimulated emission from the acceptor on the CNBD due to efficient FRET while the donor is bound up until the acceptor bleaches, after which only emission from the donor is observed. (B) Single-molecule fluorescence time series for fcAMP binding to individual acceptor-labeled CNBDs within ZMWs. Simultaneous emission from donor (blue) and acceptor (red) upon donor excitation at 532 nm was interleaved every other frame with emission from acceptor (magenta) upon direct excitation at 640 nm. Acceptor fluorescence for both excitation conditions is overlaid with the idealized time series (black). fcAMP concentration is indicated in the upper left of each donor fluorescence trace.
Figure 2—figure supplement 1
Specific fcAMP binding at single molecules.
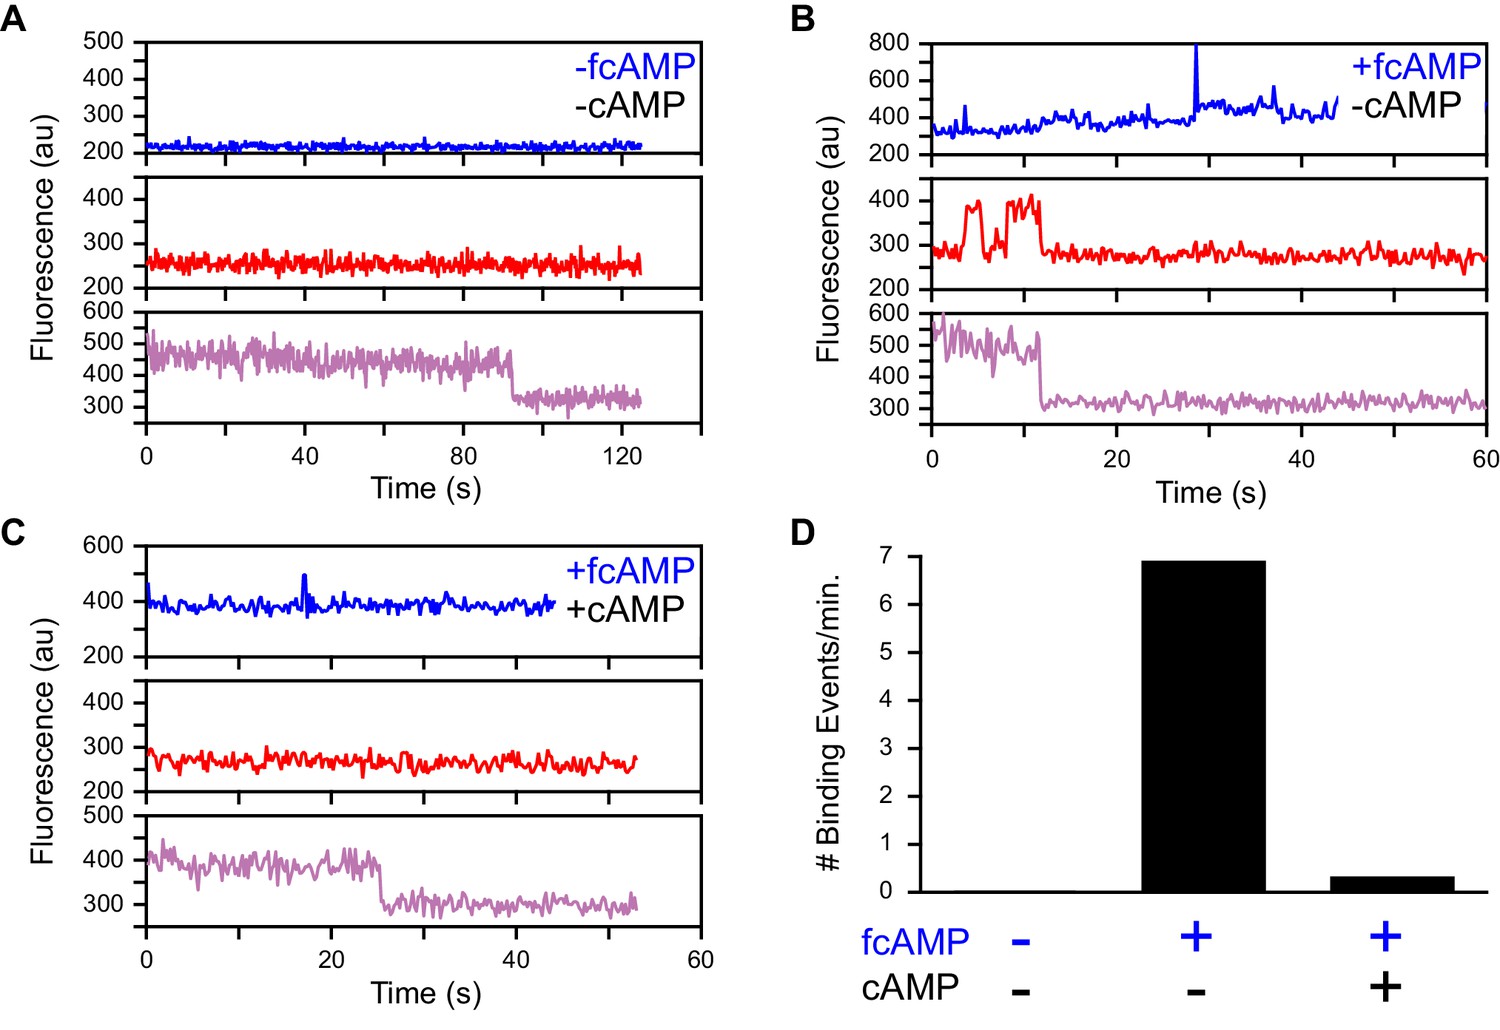
(A–C) Single-molecule fluorescence time series for individual acceptor-labeled CNBDs in the absence (A) and presence (B) of 3 µM fcAMP, and during competition between 3 µM fcAMP and 5 mM non-fluorescent cAMP (C). Simultaneous emission from donor (blue) and acceptor (red) upon donor excitation at 532 nm was interleaved every other frame with emission from acceptor (magenta) upon direct acceptor excitation at 640 nm. The lack of smFRET events during competition with cAMP indicate a lack of non-specific binding. (D) Summary of the binding event rate from smFRET traces across molecules for the same conditions described above.
Figure 3 with 4 supplements
Single-molecule cyclic nucleotide binding dynamics at HCN2 CNBDs.
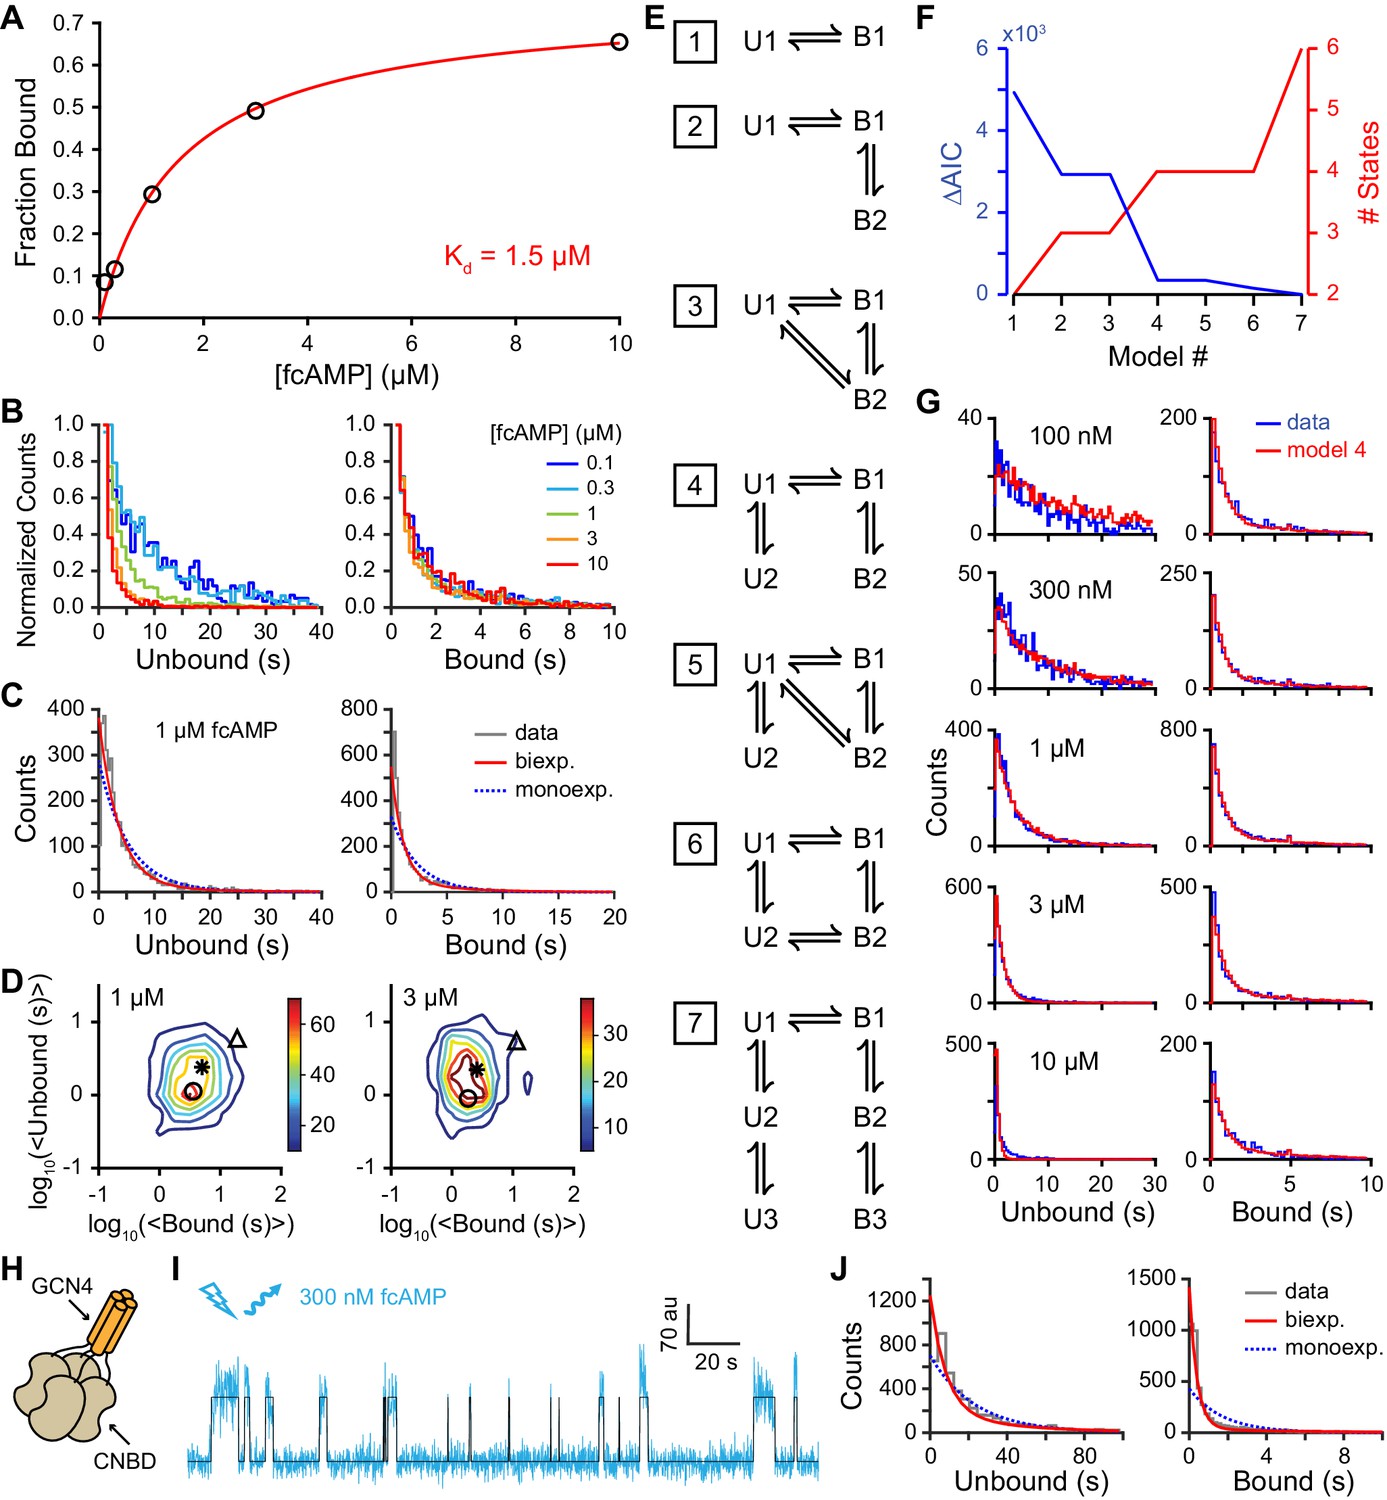
(A) Bound probability from the total fraction of time spent bound for all single molecules as a function of fcAMP concentration fit with the equation Bmax/(1+Kd/[fcAMP]), where Bmax = 0.75 is the maximal bound probability and Kd = 1.5 µM is the apparent dissociation constant. (B, C) Histograms of unbound and bound single-molecule dwell time distributions for events from all molecules combined for (B) various concentrations of fcAMP and (C) distributions for 1 µM fcAMP overlaid with maximum likelihood estimates for monoexponential (blue dashed) and biexponential (red) distributions. Exponential fits with estimated parameters and confidence intervals for all tested fcAMP concentrations are shown in Figure 3—figure supplement 1. (D) Contour plots of two dimensional histograms for the average bound time versus average unbound time per molecule at several fcAMP concentrations. Color bar denotes number of molecules. Symbols denote time constants from maximum likelihood biexponential fits (open circle and triangle) and their amplitude-weighted average (asterisk). Similar contours for all tested fcAMP concentrations are shown in Figure 3—figure supplement 2. (E) Kinetic models between unbound (U*) and bound (B*) states. The model ID number is indicated to the left of each model. Optimized rate constants are given in Table 1. (F) Differences in the Akaike Information Criteria (AIC) for optimized models shown in (E). (G) Comparison of observed dwell time histograms with simulated data from model 4. Histogram abscissas for (B), (C) and (G) were truncated to facilitate visualization of the faster components. (H) Cartoon illustrating a tetrameric CNBD complex formed by appending tetramerizing GCN4 coiled-coil to the N-terminus. (I) Example fluorescence time series (blue) for fcAMP binding events at a single tetramer in a ZMW overlaid with the idealized trace (black). At 300 nM fcAMP, the probability that more than one CNBD is bound at any given time is low. (J) Dwell time distributions for the first binding step in CNBD tetramers. Bound lifetimes are biexponentially distributed as for monomeric CNBDs.
Figure 3—figure supplement 1
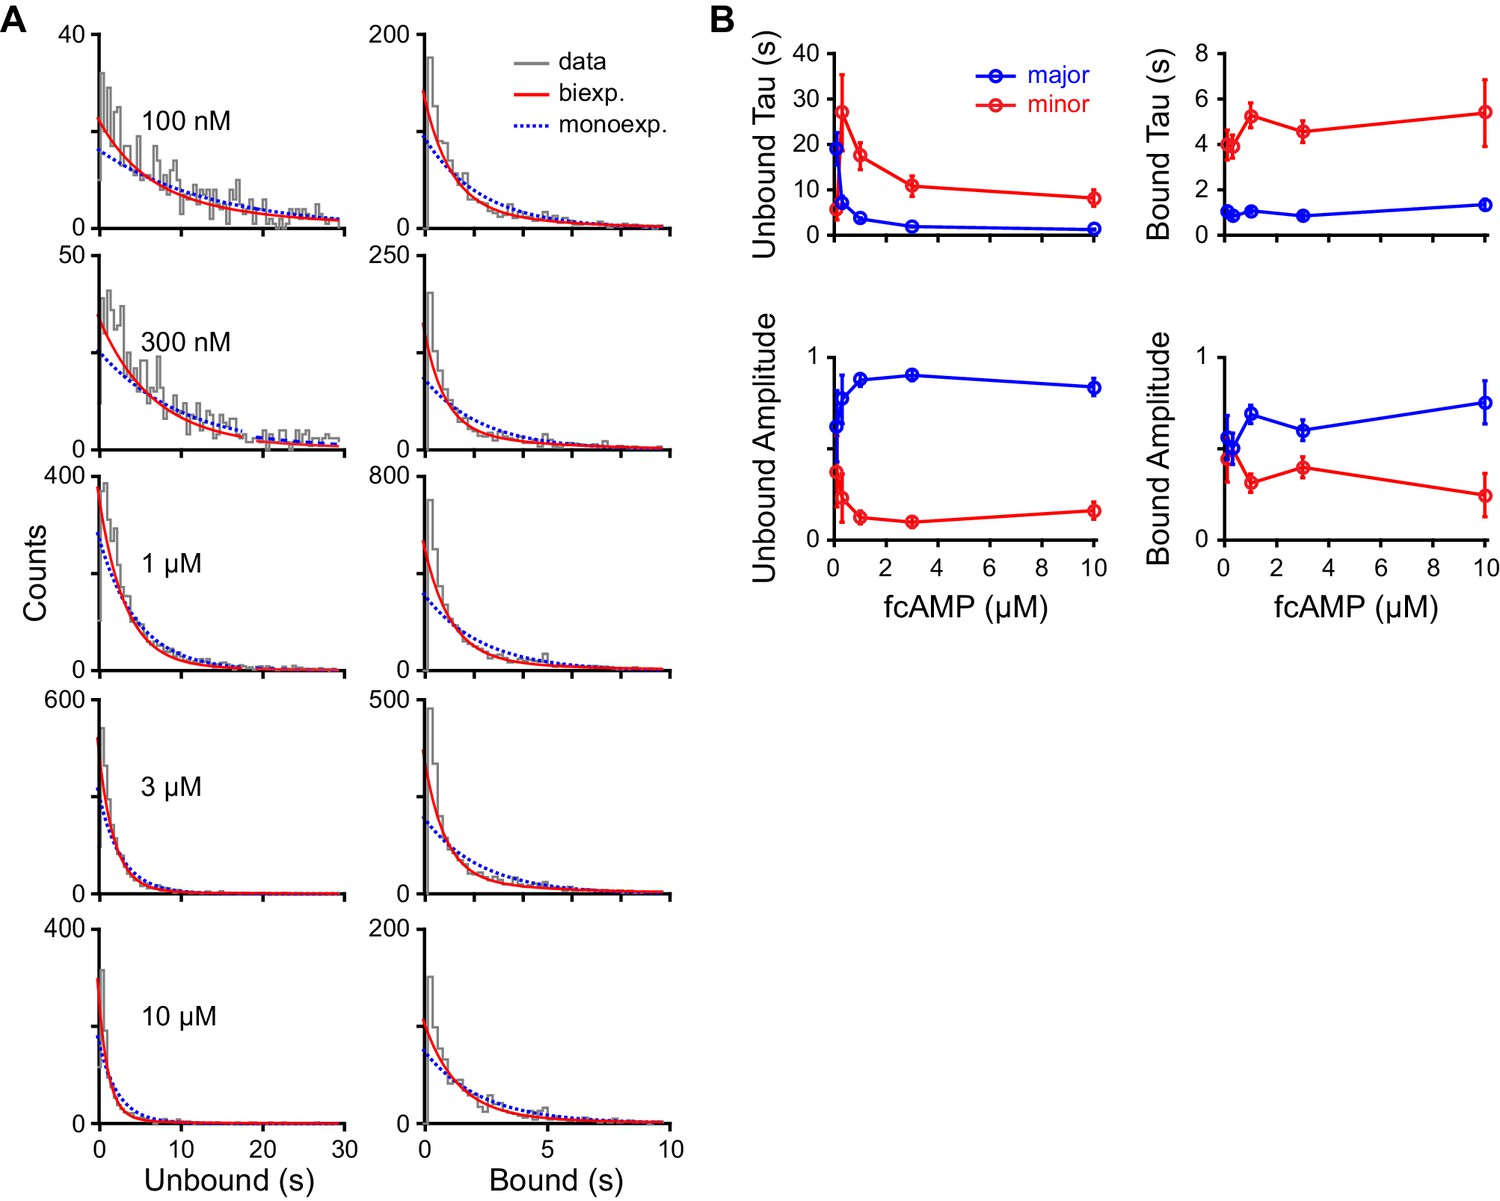
Maximum likelihood estimates of biexponential parameters for single-molecule dwell time distributions.
(A) Histograms of unbound and bound single-molecule dwell time distributions (gray) overlaid with maximum likelihood estimates for monoexponential (blue dashed) and biexponential (red) distributions. Histogram abscissas were truncated to facilitate visualization of the faster components. (B) Time constants and their relative amplitudes from biexponential maximum likelihood estimates of unbound and bound dwell time distributions shown in (A) as a function of fcAMP concentration. Error bars are 95% confidence intervals.
Figure 3—figure supplement 2
Dwell time correlations within single molecules.
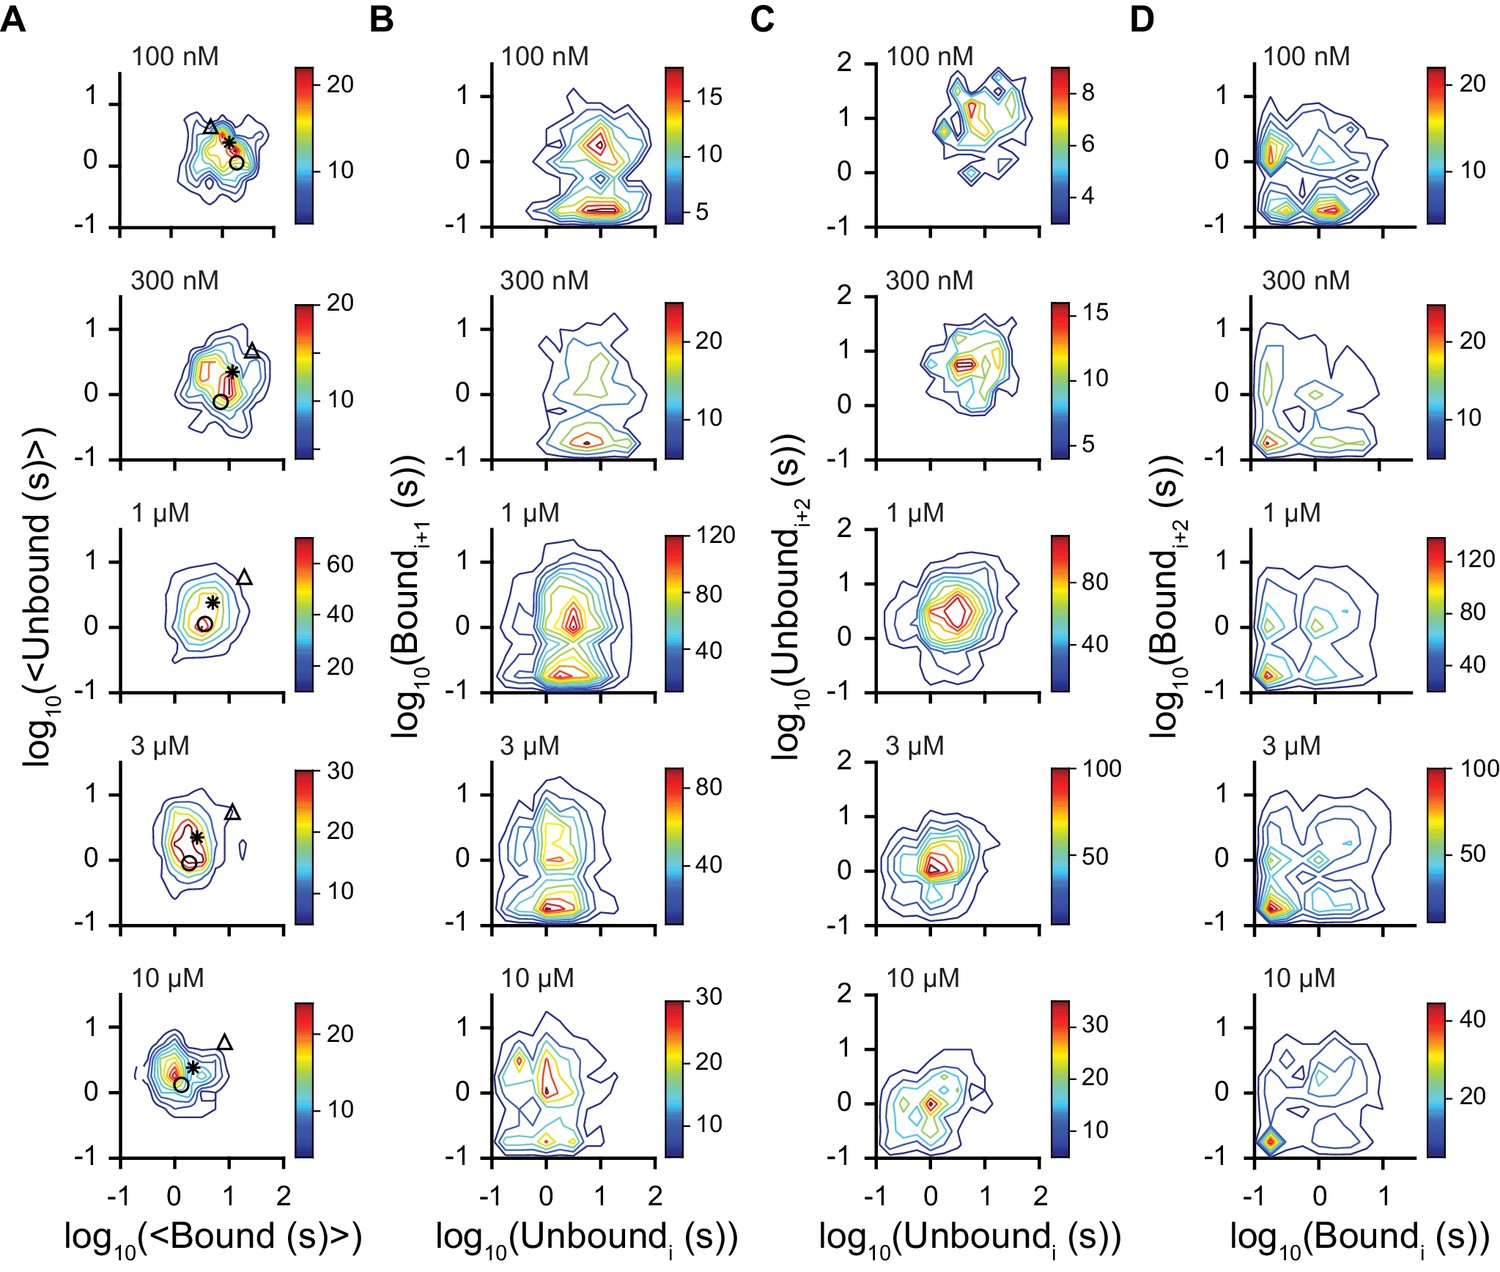
Contour plots of two dimensional histograms for (A) the average bound time versus average unbound time per molecule, (B) first order correlation between the dwell times of sequential unbound (event i) and bound (event i + 1) events, (C) second order correlation between successive unbound events i and i + 2 (separated by a bound event), and (D) successive bound events (separated by an unbound event). Color bar denotes number of molecules and fcAMP concentrations are indicated in the upper left of each plot. Symbols in (A) denote time constants from maximum likelihood biexponential fits (open circle and triangle) and their amplitude-weighted average (asterisk) (see Figure 3—figure supplement 1). The lack of clear correlations between events in (B-D) is consistent with a model where each binding event gives rise to the same equilibria between bound states.
Figure 3—figure supplement 3
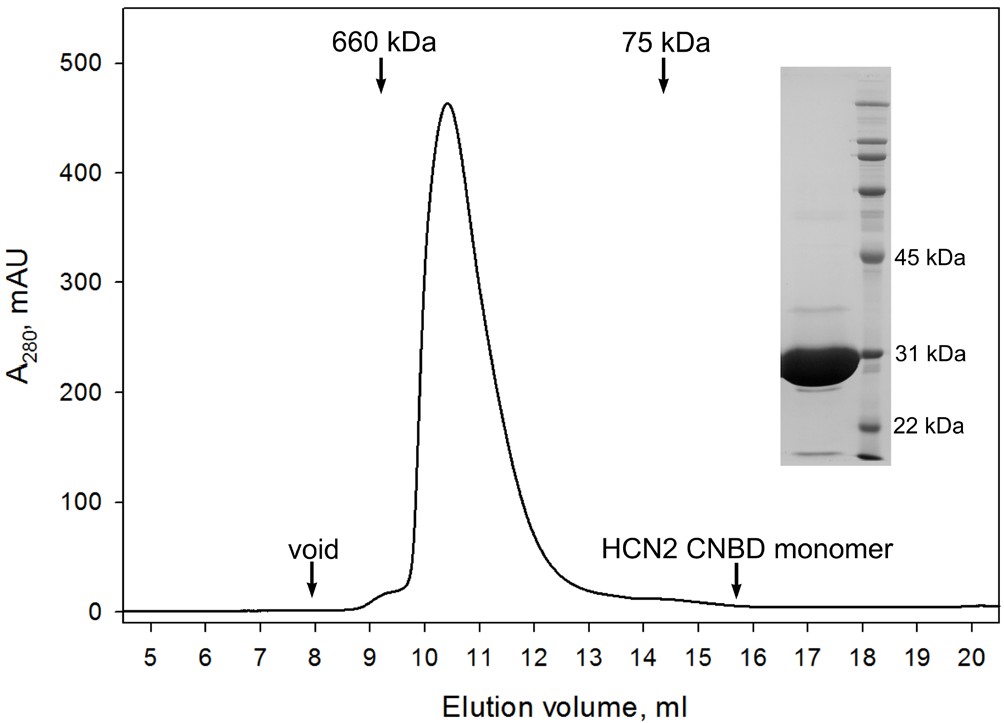
CNBD tetramer.
Size exclusion chromatography confirms that the GCN4pLI-HCN2(CNBD) tetramer is stable in solution and exhibits no detectable dissociation into monomers. (Inset) SDS-PAGE overloaded with respect to GCN4pLI-HCN2 to access its purity. Under these conditions, GCN4pLI-HCN2 is a monomer.
Figure 3—figure supplement 4
Binding with and without smFRET.
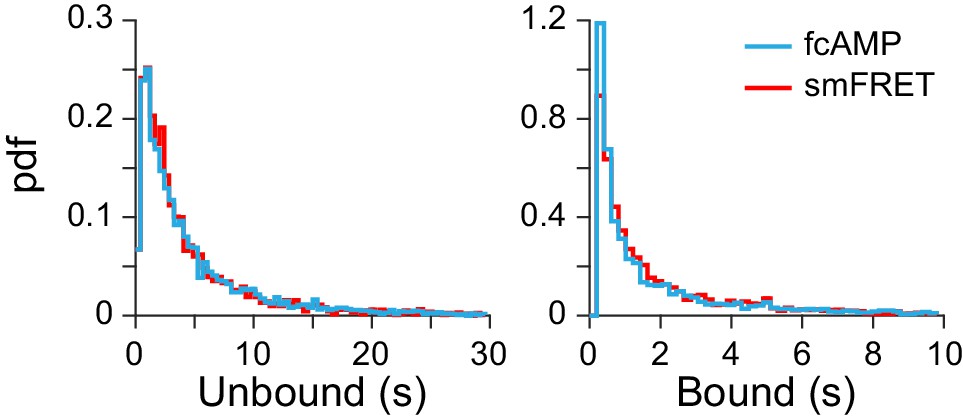
Comparison of dwell time distributions from monomeric CNBDs either before acceptor bleaching (i.e. from smFRET trace) or after acceptor bleaching (i.e. fcAMP fluorescence alone). See Figure 2B for example traces. The nearly identical distributions suggest that analysis of fcAMP fluorescence alone is a valid binding reporter at lower concentrations where such events can be directly resolved.
Figure 4 with 3 supplements
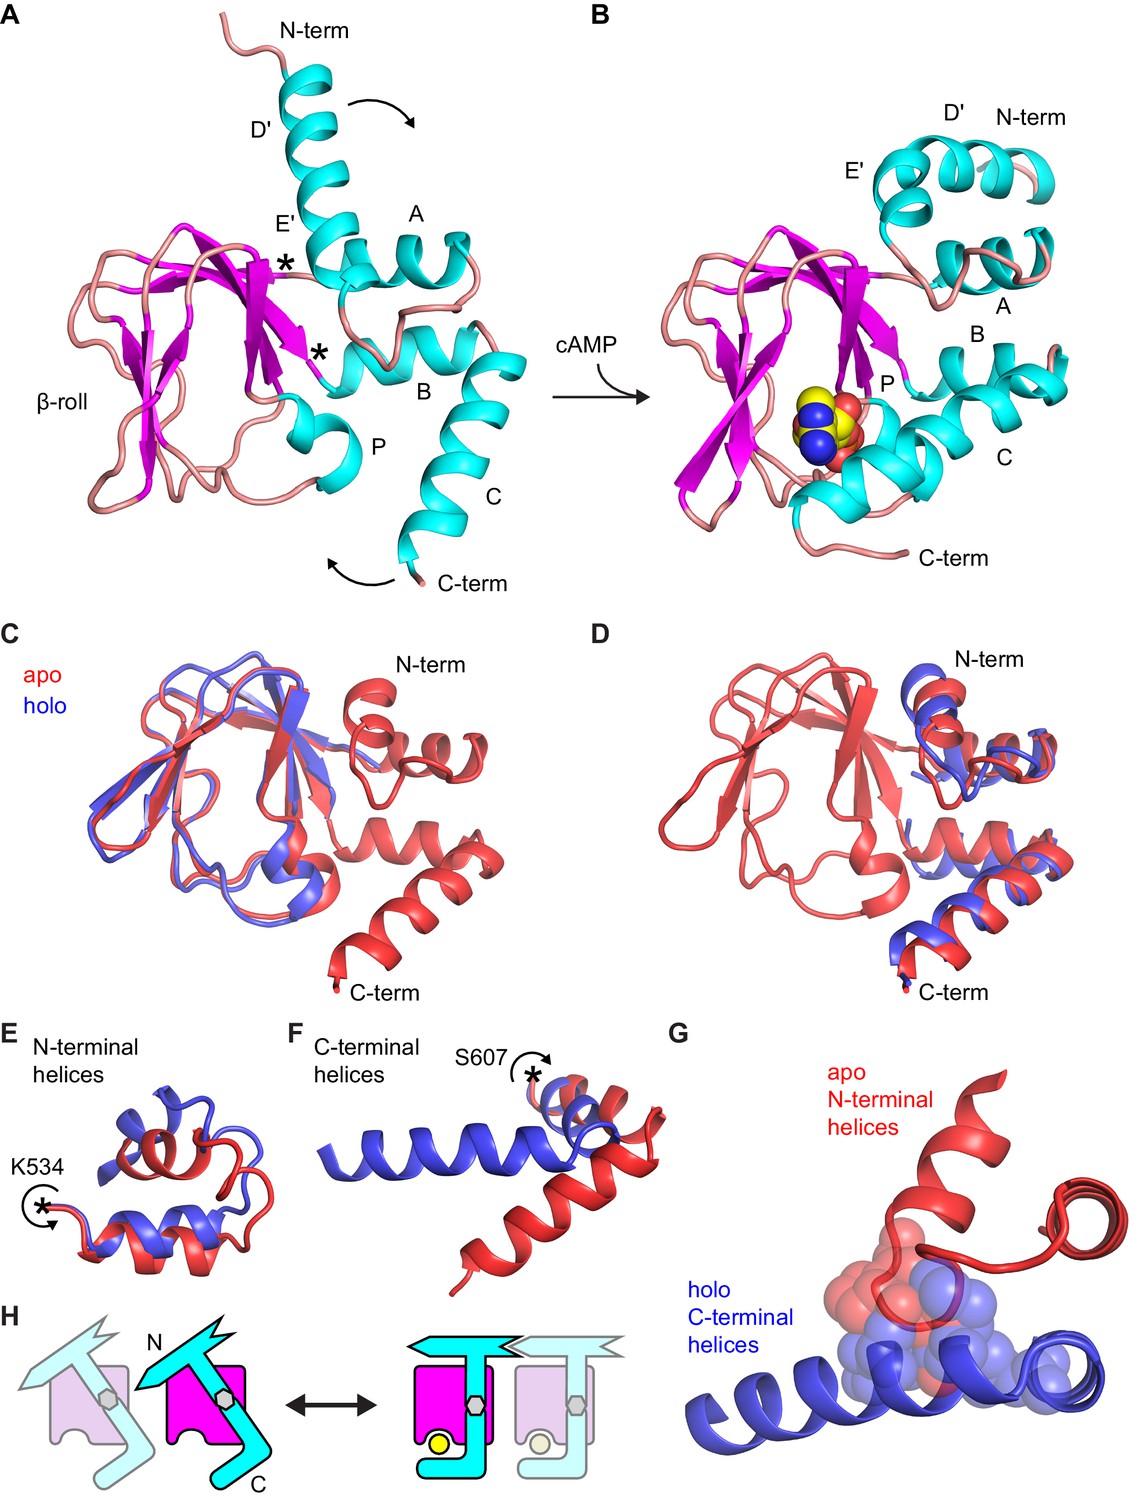
Comparison of apo and holo forms of the HCN2 CNBD.
(A) X-ray crystal structures of apo (this work) and (B) holo (PDB 3U10) conformations of the HCN2 CNBD colored according to protein secondary structure. Bound cAMP in the holo structure is shown as spheres. Helical domains are labeled D', E', A, B, C and P as was previously done for the holo structure (Zagotta et al., 2003). (C–D) Apo structure (red) overlaid with either the β-roll domain (C) or the α-helical termini (treated as a single domain) (D) of the holo structure (blue). The apo and holo structures superimpose with an RMSD of 0.49 Å over their β-roll domains, or 2.04 Å over their α-helical terminal domains (N-terminal helix excludes the initial D' segment). Hinge-like rotations that account for bulk of conformational changes between apo and holo structures: (E) N-terminal helical fragment (residues 508–534), (F) C-terminal helical fragment (residues 607–634). (G) Steric clashes between holo conformation of the C-terminus (blue) and apo conformation of the N-terminus (red). Residues that would clash are illustrated as spheres (M515, P516, L517 and L615, M621, A624, F625). (H) Cartoon illustrating the cAMP-induced rotation of the α-helical domains (cyan) about the rigid β-roll cage (magenta) that both caps the bound ligand (yellow) and places the N-terminal region in a favorable state for coordinating intersubunit interactions with neighboring CNBDs (indicated by a faded CNBD).
Figure 4—figure supplement 1
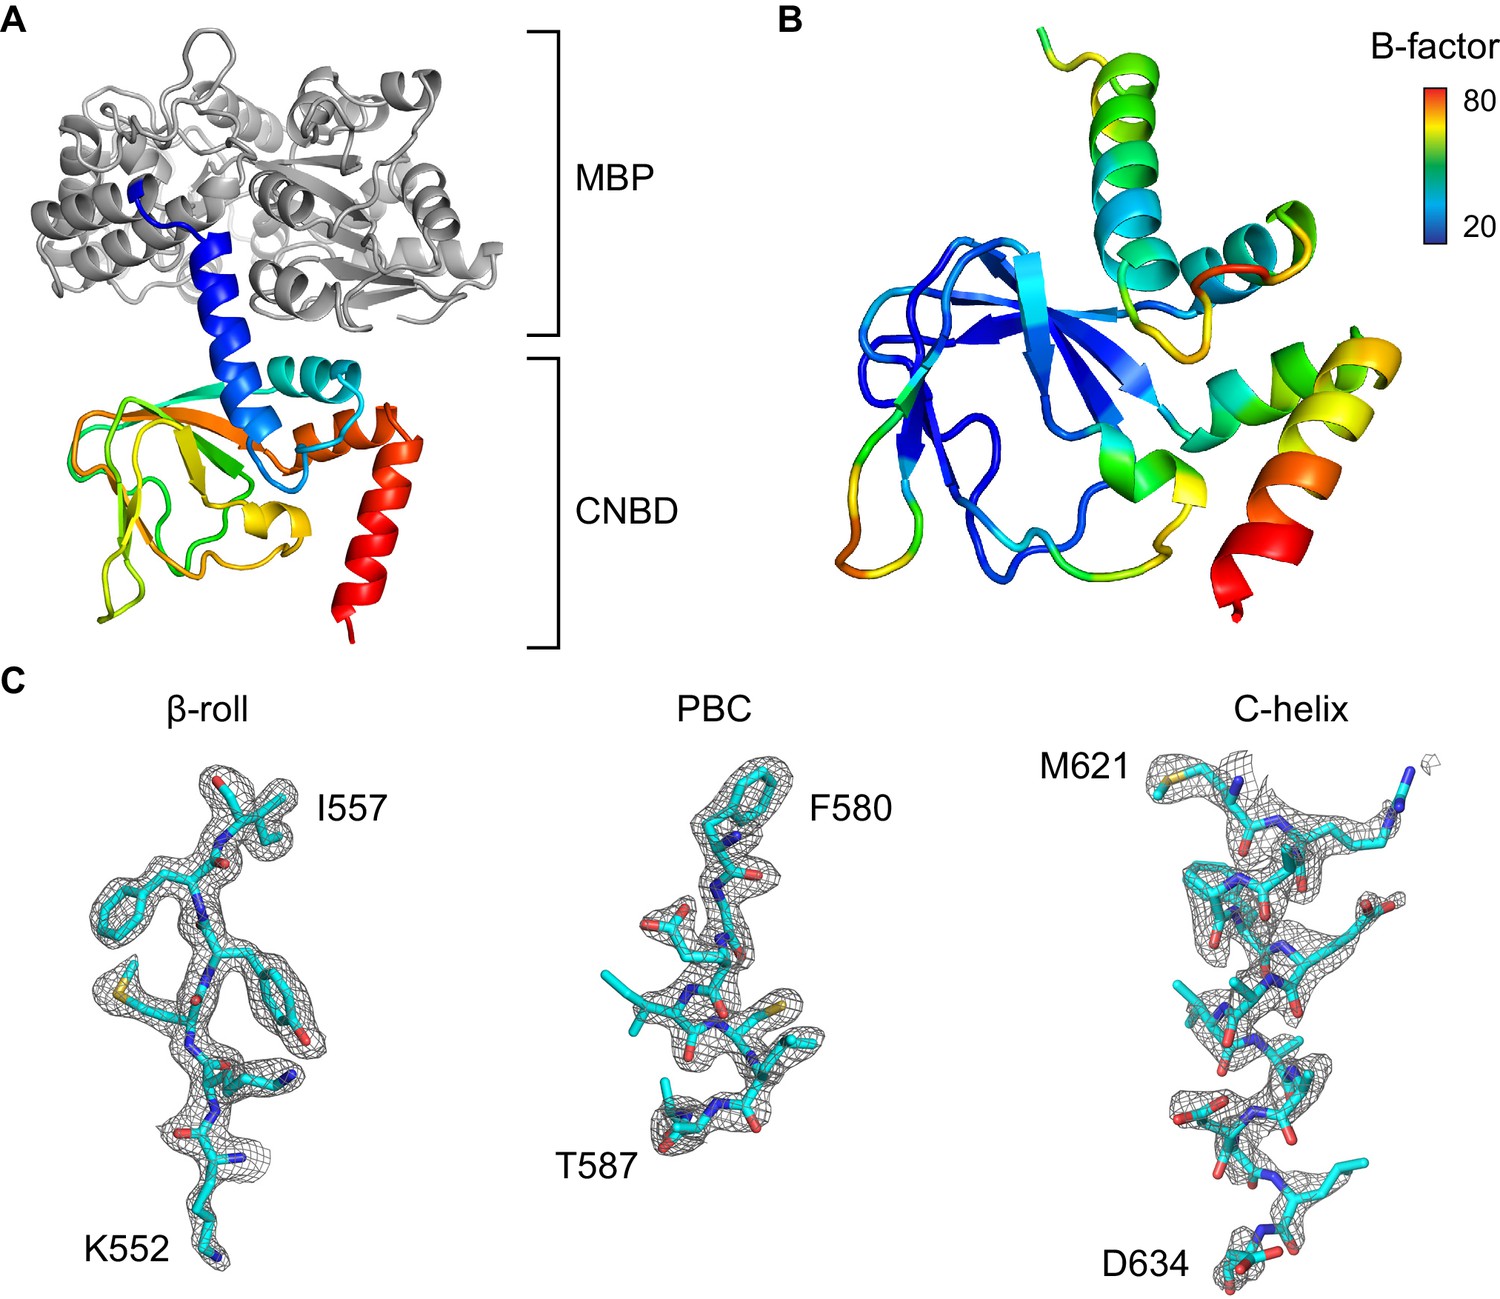
Overview of the X-ray structure.
(A) X-ray crystal structure of the HCN2 CNBD in the absence of ligand as a fusion protein with MBP. CNBD segments rainbow colored from N- (blue) to C-terminus (red). MBP shown in gray. (B) CNBD colored by B-factor. (C) Fragments of the composite omit electron density map contoured at 1s level that are representative of the HCN2 CNBD regions with different intrinsic flexibility. Note that the quality of the electron density is uniformly high in the β-roll, whereas the density becomes progressively weaker along the C-helix, indicating its high degree of conformational flexibility in the absence of the ligand.
Figure 4—figure supplement 2
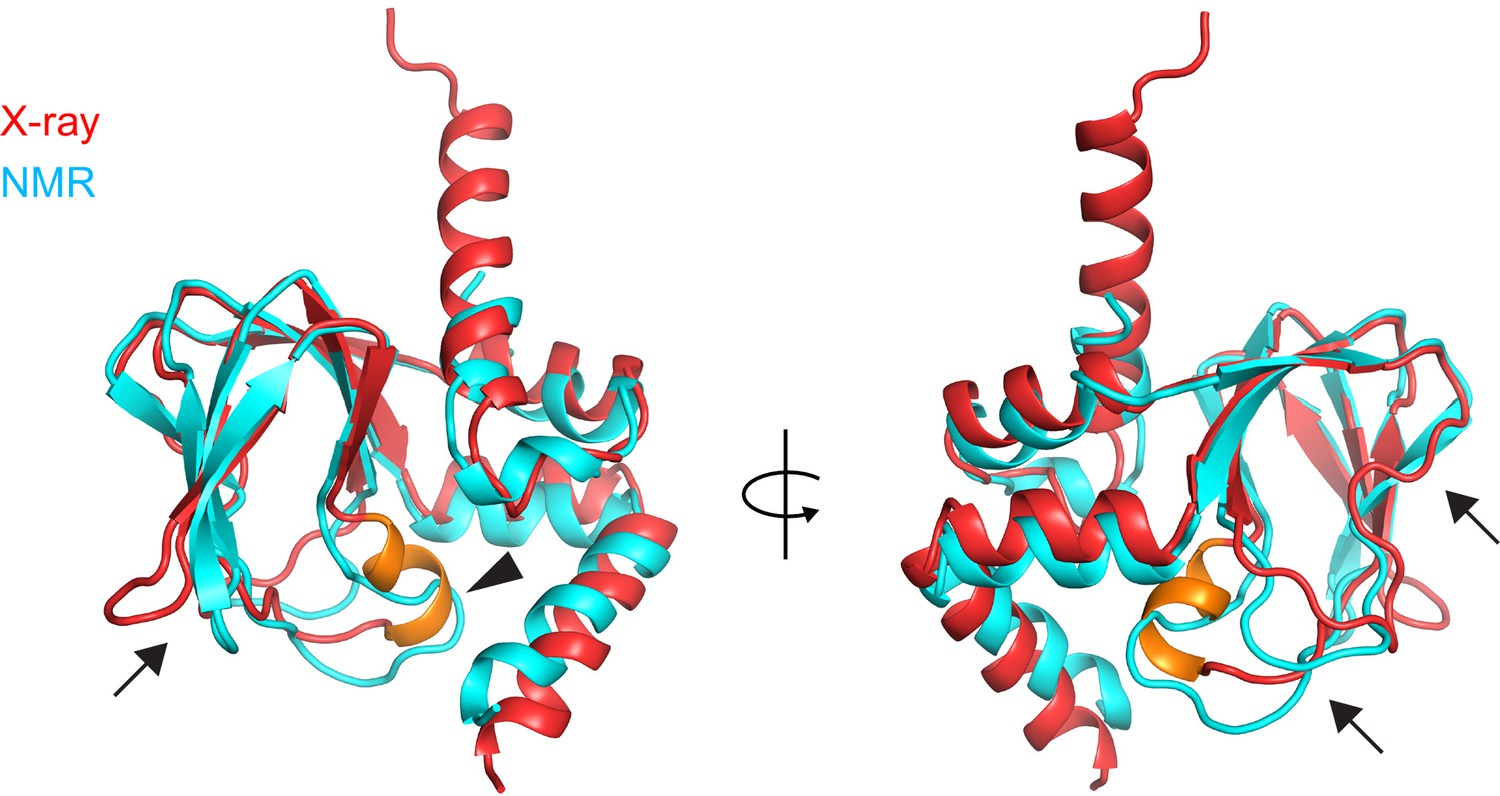
Comparison of the X-ray and NMR structures of the apo CNBD.
X-ray (red) and NMR (cyan) structures of the apo CNBD superposed over all Cα atoms. The P-helix in the X-ray structure is highlighted in gold. Although the α-helical termini are similar in both X-ray and NMR structures, significant differences are observed in the β-roll domain in stark contrast to the apo versus holo crystal structures (Figure 4). These differences include the PBC (arrowhead) and all of the loops that comprise the nucleotide binding site (arrows).
Figure 4—figure supplement 3
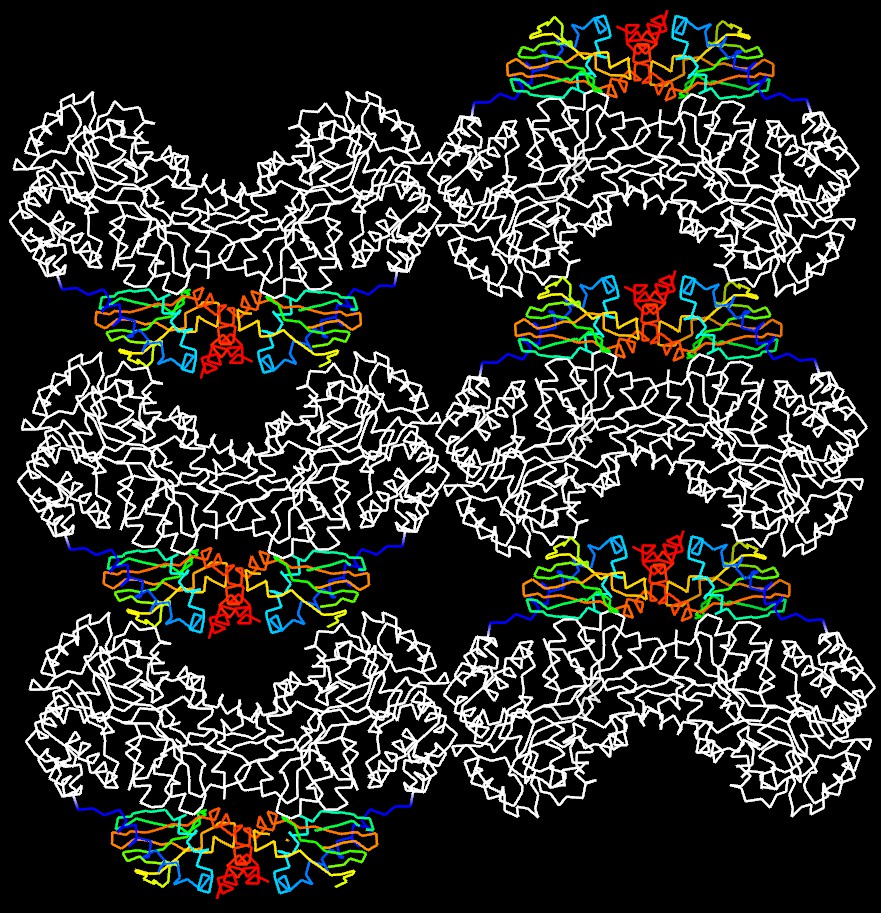
Molecular packing in the crystal of apo MBP-HCN2.
Shown are six asymmetric unit cells viewed down the b axis. MBP is shown in white and HCN2 in rainbow representation. HCN2 moieties are arranged in a loosely packed layer that connects MBP layers that contribute most of the crystal contact areas.
Figure 5
Global and local structural features stabilized by cAMP.
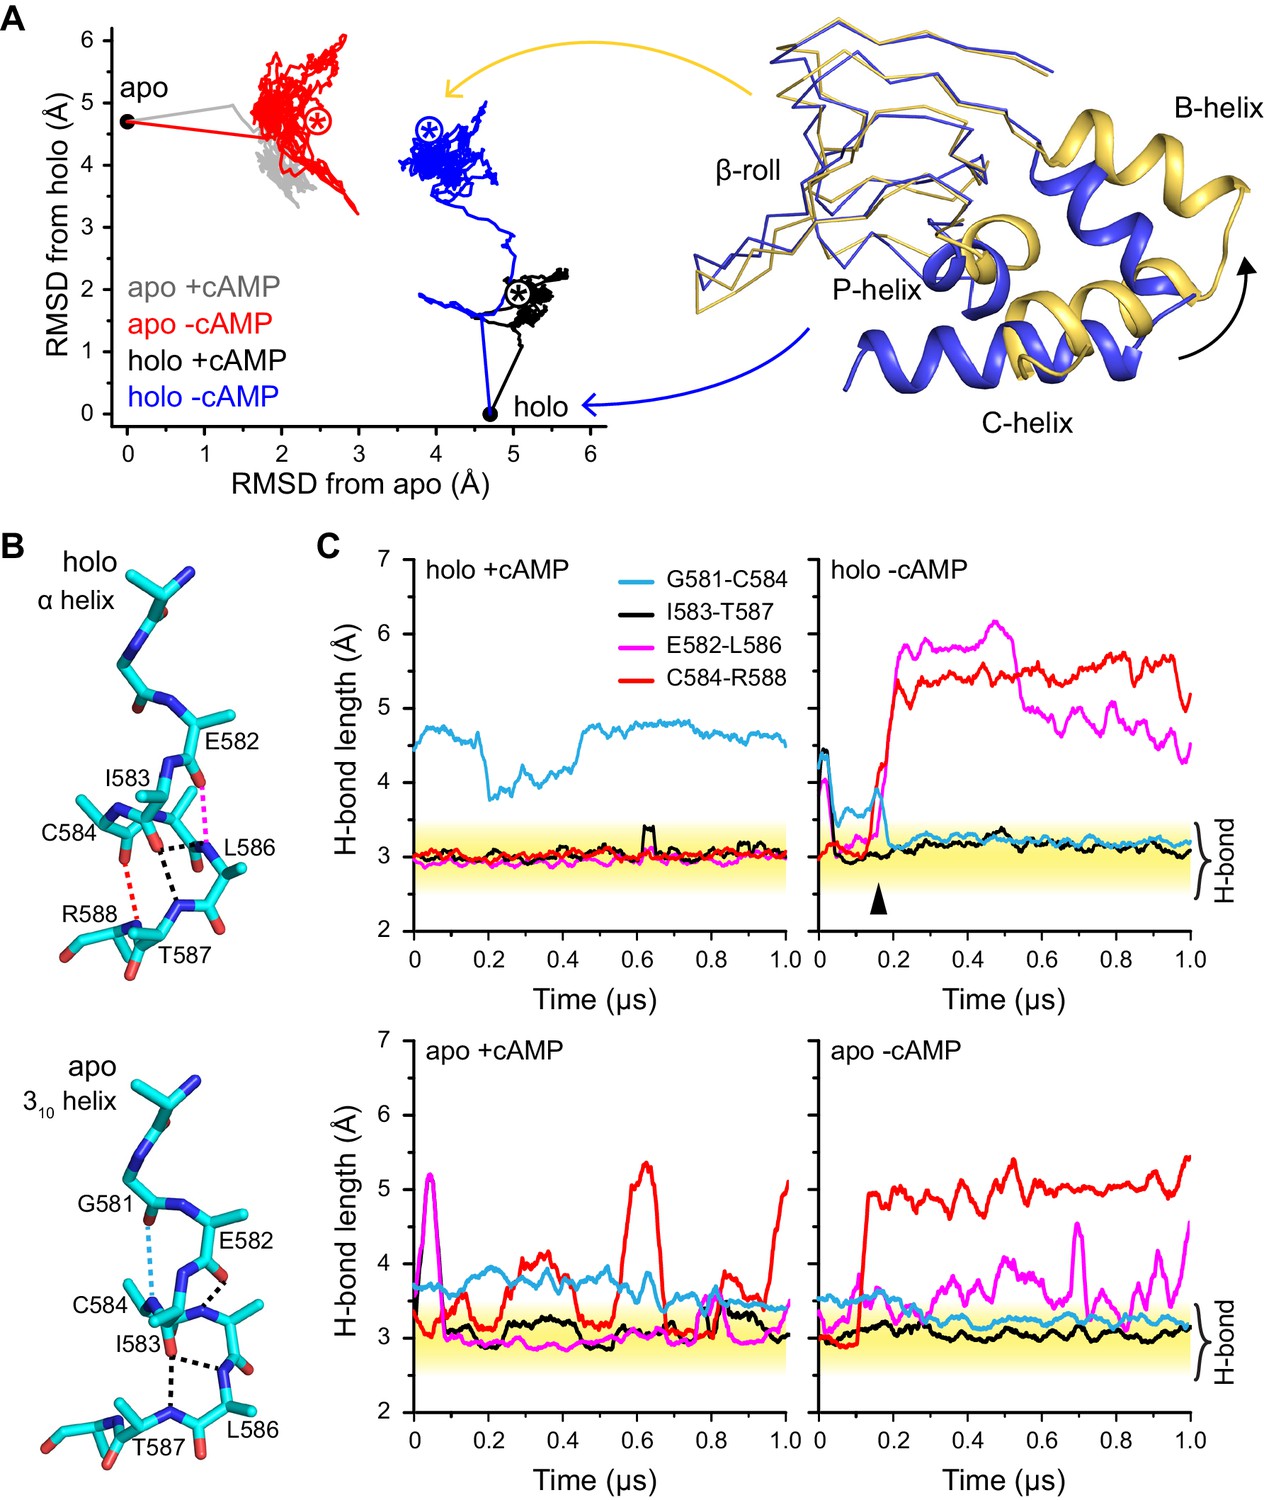
(A) RMSDs from apo (this work) and holo (PDB 3U10) crystal structures for the HCN2CNBD (residues 515–632) during 1 µs simulations starting in either the apo or holo structure both with and without cAMP in the binding site. Structures corresponding to the first (blue) and last (yellow) frames of the simulation for the holo structure with cAMP removed are shown (N-terminal helices omitted for clarity) aligned to the β-roll domain. Removal of cAMP from the holo structure resulted in the B, C and P helices swinging outwards towards their apo positions. (B) The P-helix adopts a mostly α-helix or mostly 310-helix in the holo and apo crystal structures, respectively. Hydrogen bonds are indicated by dashed lines. (C) Carbonyl to amide hydrogen bond distances for select P-helix residues over the course of MD simulations starting in the holo (upper) and apo (lower) form either with (left) or without (right) cAMP. The stable α-helical form in the presence of cAMP transitions to a stable mostly 310-helix upon removal of cAMP from the holo structure. Upon addition of cAMP to the apo form, the i/i + 4 interactions associated with the α-helical form become more stable while the i/i + 3 interaction associated with the 310 form is weakened.
Figure 6
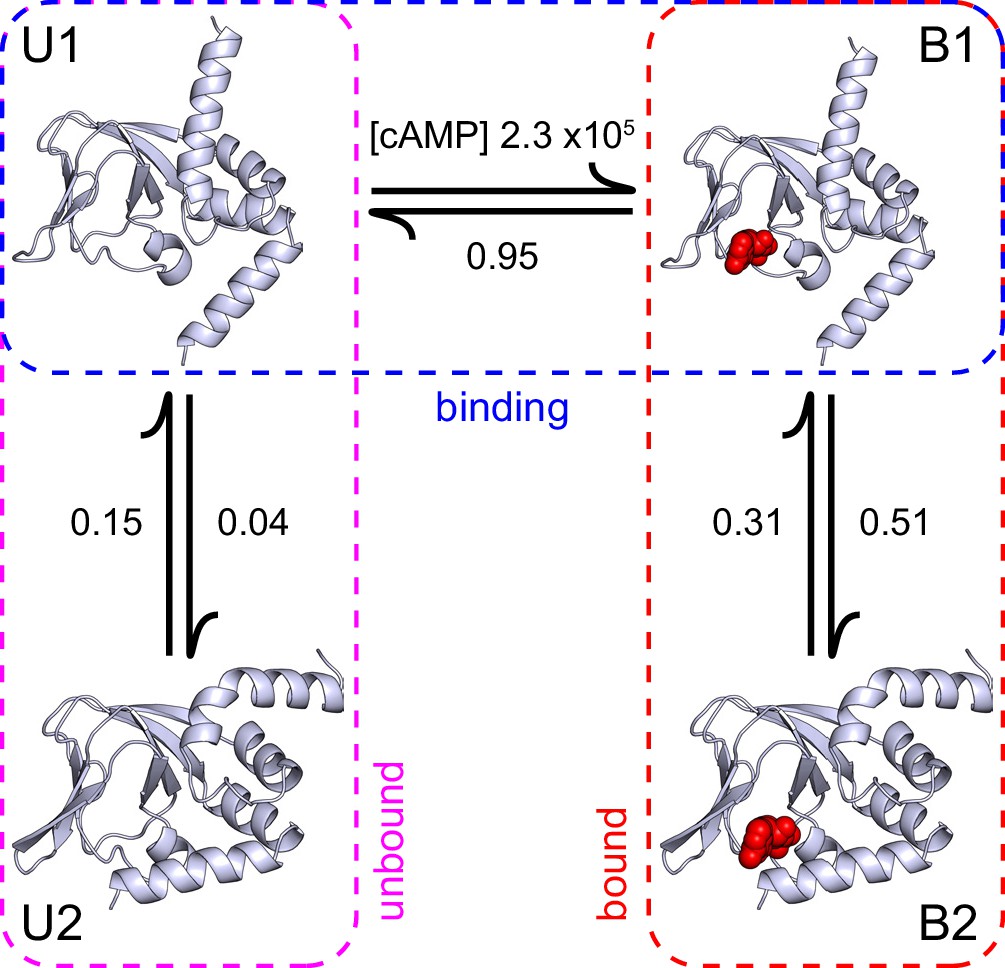
A structural model of HCN2 CNBD binding dynamics.
A structural model of cAMP (red spheres) binding dynamics at monomeric CNBDs from HCN2 channels. Rate constants (s-1 or M-1s-1) were optimized using HMM modeling of idealized single-molecule fcAMP binding time series as discussed in the text. Model depicts selective binding of cAMP (horizontal transition) to the apo form of the CNBD (U1) and a subsequent isomerization (vertical transitions) of the ligand-bound CNBD (B1) to its holo form (B2). Isomerization of the unliganded CNBD (U2) prevents cAMP binding due to occlusion of the binding site by the C-helix.
Tables
Table 1
Kinetic model rate constants. Optimized rate constants (s-1 or M-1s-1) for models shown in Figure 3E. U* and B* denote unbound and bound states, respectively.
Model | U1→ B1 | B1→ U1 | B1→B2 | B2→B1 | U1→U2 | U2→U1 | U1→B2 | B2→U1 |
|---|---|---|---|---|---|---|---|---|
1 | 1.3 × 10⁵ | 0.34 | - | - | - | - | - | - |
2 | 1.4 × 10⁵ | 0.91 | 0.52 | 0.31 | - | - | - | - |
3 | 1.3 × 10⁵ | 0.98 | 0.49 | 0.23 | - | - | 0.10 × 10⁵ | 0.04 |
4 | 2.3 × 10⁵ | 0.95 | 0.51 | 0.31 | 0.04 | 0.15 | - | - |
5 | 2.2 × 10⁵ | 1.00 | 0.49 | 0.25 | 0.04 | 0.15 | 0.14 × 10⁵ | 0.03 |
6 | 2.4 × 10⁵ | 1.00 | 0.48 | 0.27 | 0.01 | 0.04 | - | - |
7 | 2.8 × 10⁵ | 1.11 | 0.85 | 0.56 | 0.17 | 0.55 | - | - |
Model | U2→B2 | B2→U2 | U2→U3 | U3→U2 | B2→B3 | B3→B2 |
|---|---|---|---|---|---|---|
6 | 0.24 × 10⁵ | 0.02 | - | - | - | - |
7 | - | - | 0.02 | 0.07 | 0.03 | 0.08 |
Table 2
Crystallographic statistics.
Data collection | |
|---|---|
Space group | P21 |
Unit cell dimensions | |
a, b, c (Å) | 61.5, 42.0, 198.4 |
α, β, γ (°) | 90, 90.9, 90 |
Resolution (Å) | 24.82–2.07 (2.11–2.07) |
Unique reflections | 62519 |
Redundancy* | 3.4 (3.4) |
Average [I/s] * | 7.6 (2.2) |
Completeness (%)* | 99.9 (100) |
Rmerge (%)* | 11.5 (66.7) |
Refinement | |
Number of atoms | |
protein | 7913 |
maltose | 46 |
solvent | 381 |
Rwork (%)* | 18.0 (21.6) |
Rfree (%)* | 22.1 (26.0) |
Twin fraction | 0.122 |
Average B-factors, (Å2) | |
protein (MBP), protein (HCN2) | 22.9, 43.2 |
solvent | 28.9 |
R.M.S. deviations, bond angles (°) | 1.322 |
R.M.S. deviations, bond lengths, (Å) | 0.009 |
Ramachandran plot (%) | |
favored | 98 |
allowed | 2 |
| * Values in parentheses are for the outer resolution shell. | |
Table 3
cAMP-dependent change in H-bonding within PBC.
Apo (this work) | Holo (PDB 3U10) | ||||||
|---|---|---|---|---|---|---|---|
carbonyl | amide | d, Å | pattern | carbonyl | amide | d, Å | pattern |
G581 | C584 | 3.42 | i + 3 | G581 | — | — | — |
E582 | L585 | 3.02 | i + 3 | E582 | L586 | 3.07 | i + 4 |
I583 | L586 | 3.10 | i + 3 | I583 | L586 | 3.10 | i + 3 |
I583 | T587 | 2.71 | i + 4 | I583 | T587 | 2.71 | i + 4 |
C584 | — | — | — | C584 | R588 | 2.91 | i + 4 |
Download links
A two-part list of links to download the article, or parts of the article, in various formats.
Downloads (link to download the article as PDF)
Open citations (links to open the citations from this article in various online reference manager services)
Cite this article (links to download the citations from this article in formats compatible with various reference manager tools)
Structure and dynamics underlying elementary ligand binding events in human pacemaking channels
eLife 5:e20797.
https://doi.org/10.7554/eLife.20797


