Acetylated tubulin is essential for touch sensation in mice
- EMBL Mouse Biology Unit, Italy
- Molecular Medicine Partnership Unit (MMPU), Germany
- Centre for Integrative Neuroscience, Germany
- Istituto Officina dei Materiali-CNR, Italy
- Max Planck Institute of Molecular Cell Biology and Genetics, Germany
- European Molecular Biology Laboratory, Germany
- Ecole Polytechnique Federale de Lausanne, Switzerland
- Consiglio Nazionale delle Ricerche, Italy
Figures
Figure 1 with 1 supplement
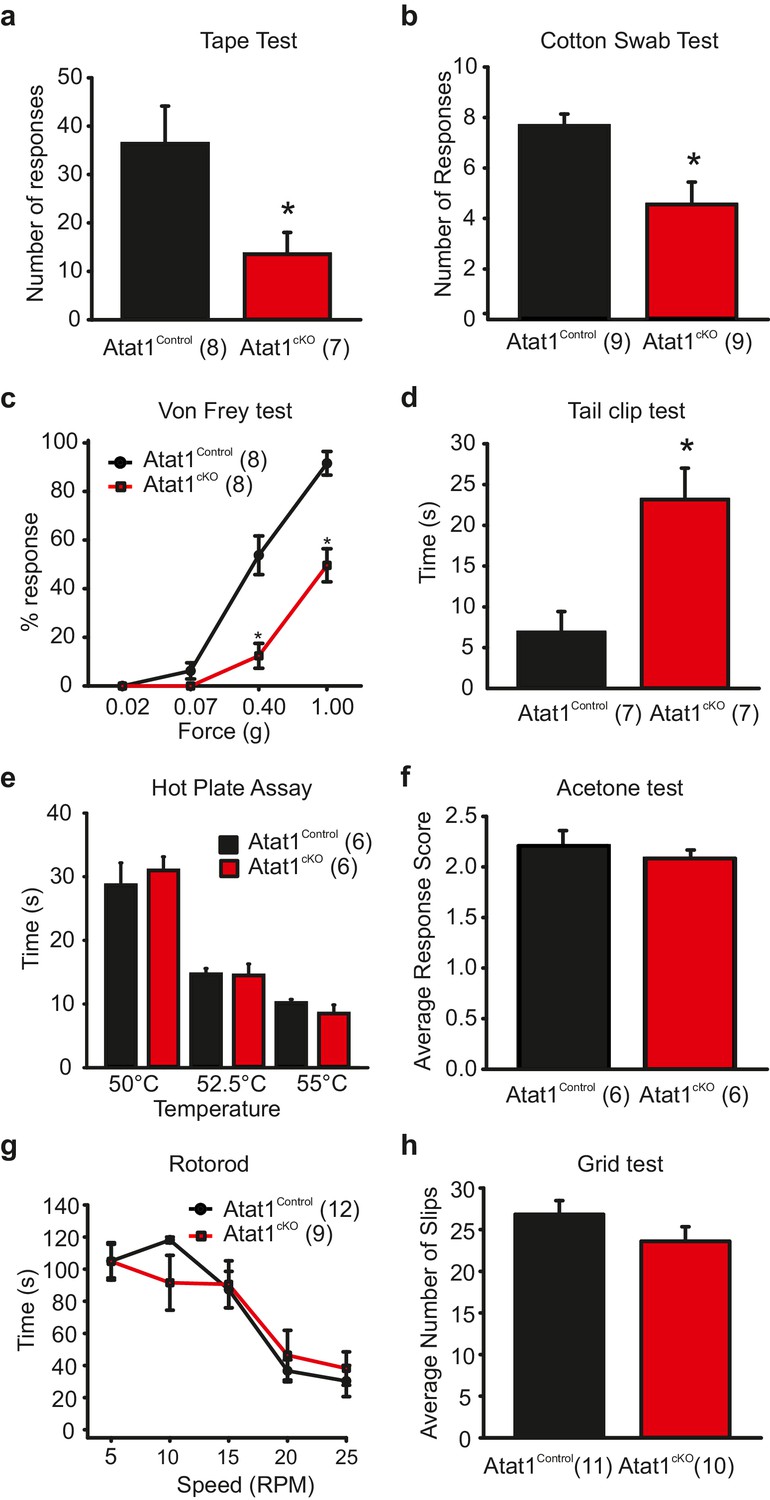
Behavioural analysis of Atat1cKOmice.
(a) Bar-chart summarising the results of a tape test to assay low threshold mechanosensation. Atat1cKO mice demonstrated significantly less response events over the 5 min counting period (t-Test, p<0.05). (b) Results from the cotton swab analysis assaying low threshold mechanosensation. Atat1cKO mice demonstrated significantly less response events then Atat1Control counterparts (t-Test, p<0.01). (c) Graph of von Frey thresholds showing the significantly lower response frequency in Atat1cKO animals (Two-way RM ANOVA, Holm-Sidak method, p<0.001). (d) Bar-chart showing latency to a clip attached to the base of the tail. Atat1cKO animals take significantly longer to respond to the stimulus (t-Test, p<0.01). (e) No significant differences in the responses recorded to noxious heat between Atat1cKO and Atat1Control animals (t-Test, p>0.05). (f) No significant difference in cold response was observed using the acetone drop assay (t-Test, p>0.05) (g), No significant difference in motor performance as assayed using the Rotarod test (Two-Way RM ANOVA, Holm-Sidak method, p>0.05) and (h), No significant difference was observed in the average number of slips between the genotypes during the grid test (t-Test, p>0.05). Error bars indicate s.e.m.
Figure 1—figure supplement 1
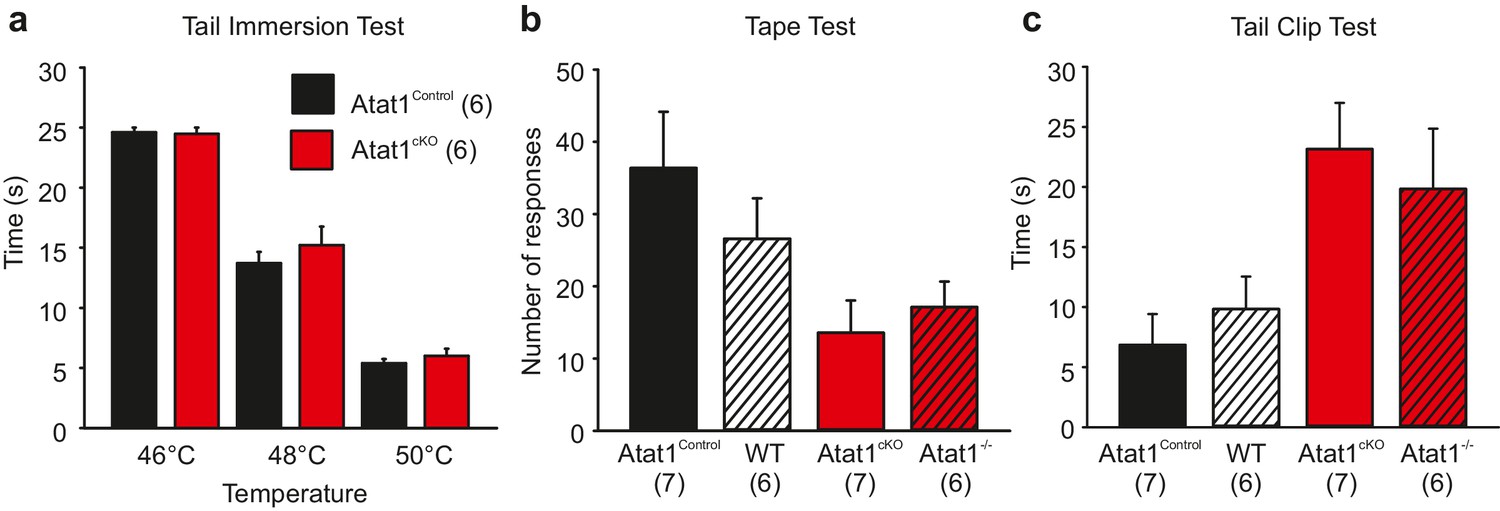
Behavioral analysis of Atat1cKO mice.
(a) Bar-chart showing the latency of response from Atat1Control and Atat1cKO mice to immersion in a water bath at 46, 48 and 50°C respectively (unpaired t test, p>0.05 for all temperatures tested). (b) Bar-chart showing responses of Atat1Control, Wildtype, Atat1cKO, and Atat1-/- mice to adhesive tape applied to the back hairy skin. (unpaired t test p>0.05 between Atat1Control and WT, and Atat1cKO and Atat1-/-). (c) Bar-chart showing latency of response of Atat1Control, Wildtype, Atat1cKO, and Atat1-/- mice to a clip applied to the tail (unpaired t test p>0.05 between Atat1Control and WT, and Atat1cKO and Atat1-/-).
Figure 2 with 3 supplements
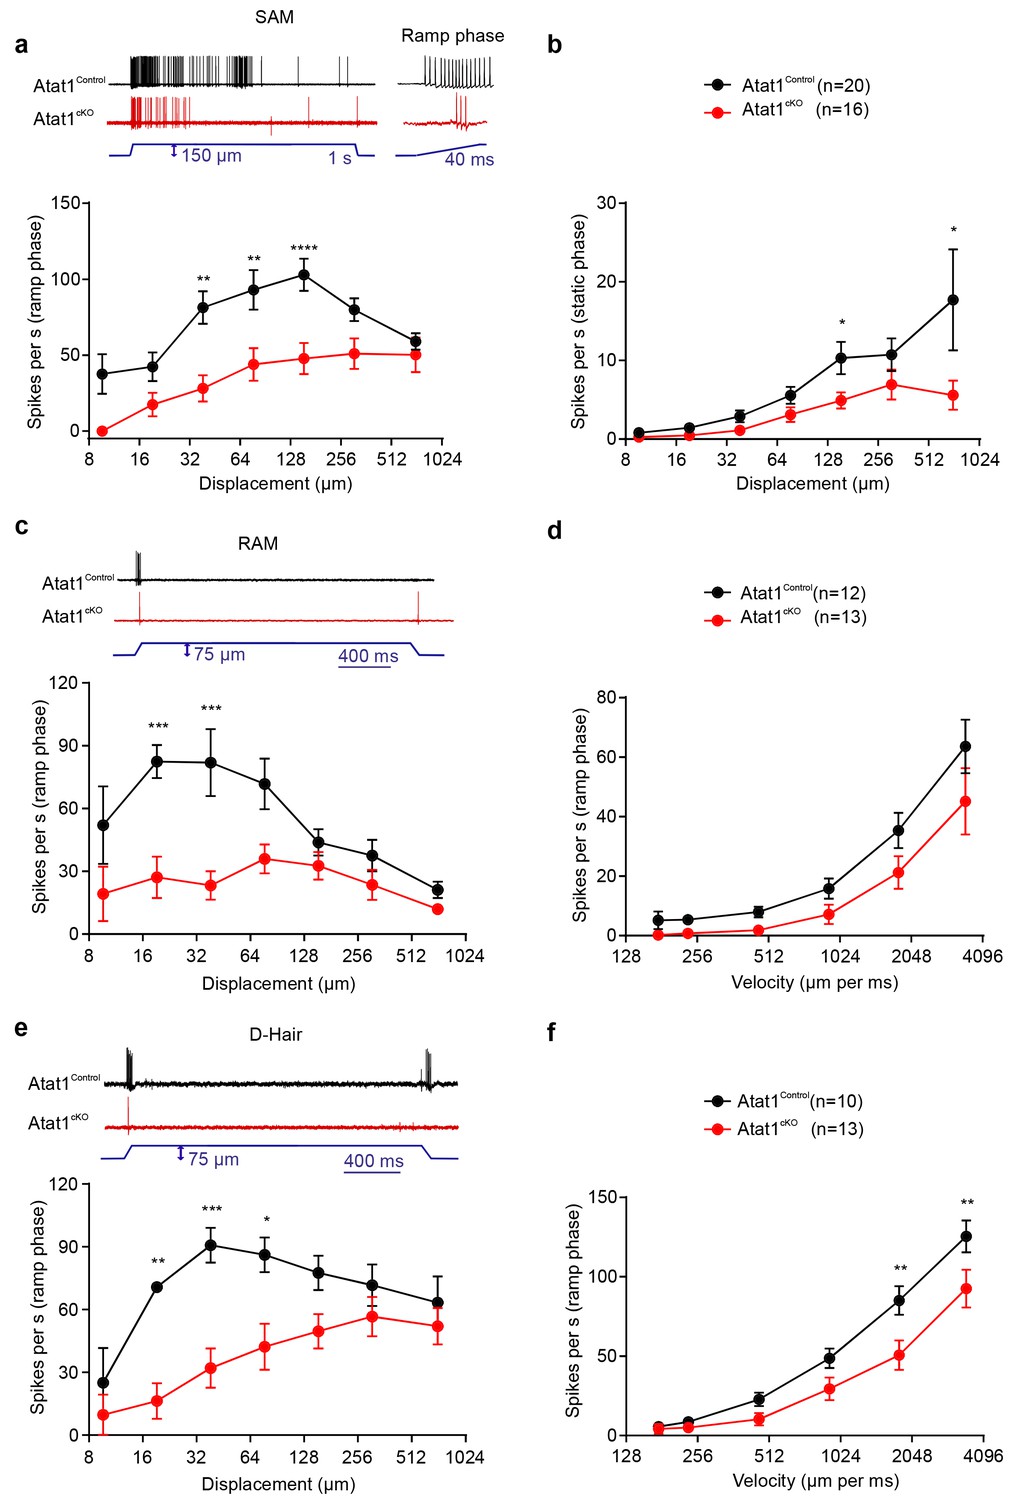
αTAT1 is required for mechanosensitivity of low threshold mechanoreceptors.
Slowly adapting mechanoreceptor fibers (SAM): Typical responses (top) and stimulus-response functions (bottom) to increasing displacement for the ramp (a) and static (b) phase (two-way ANOVA with post-hoc Bonferroni’s test, ramp phase: p<0.0001; static phase: p<0.001). Rapidly adapting mechanoreceptor fibers (RAM): Typical responses (top) and stimulus-response functions (bottom) to increasing displacement (c) and velocity (d) (two-way ANOVA with post-hoc Bonferroni’s test, displacement: p<0.0001; velocity: p<0.001). D-hair afferents: Typical responses (top) and stimulus-response functions (bottom) to increasing displacement (e) and velocity (f) (two-way ANOVA with post-hoc Bonferroni’s test, displacement: p<0.0001; velocity: p<0.0001). The number of fibres recorded is indicated in parentheses in each panel. *p<0.05; **p<0.01; ***p<0.001; ****p<0.0001. Error bars indicate s.e.m.
Figure 2—figure supplement 1
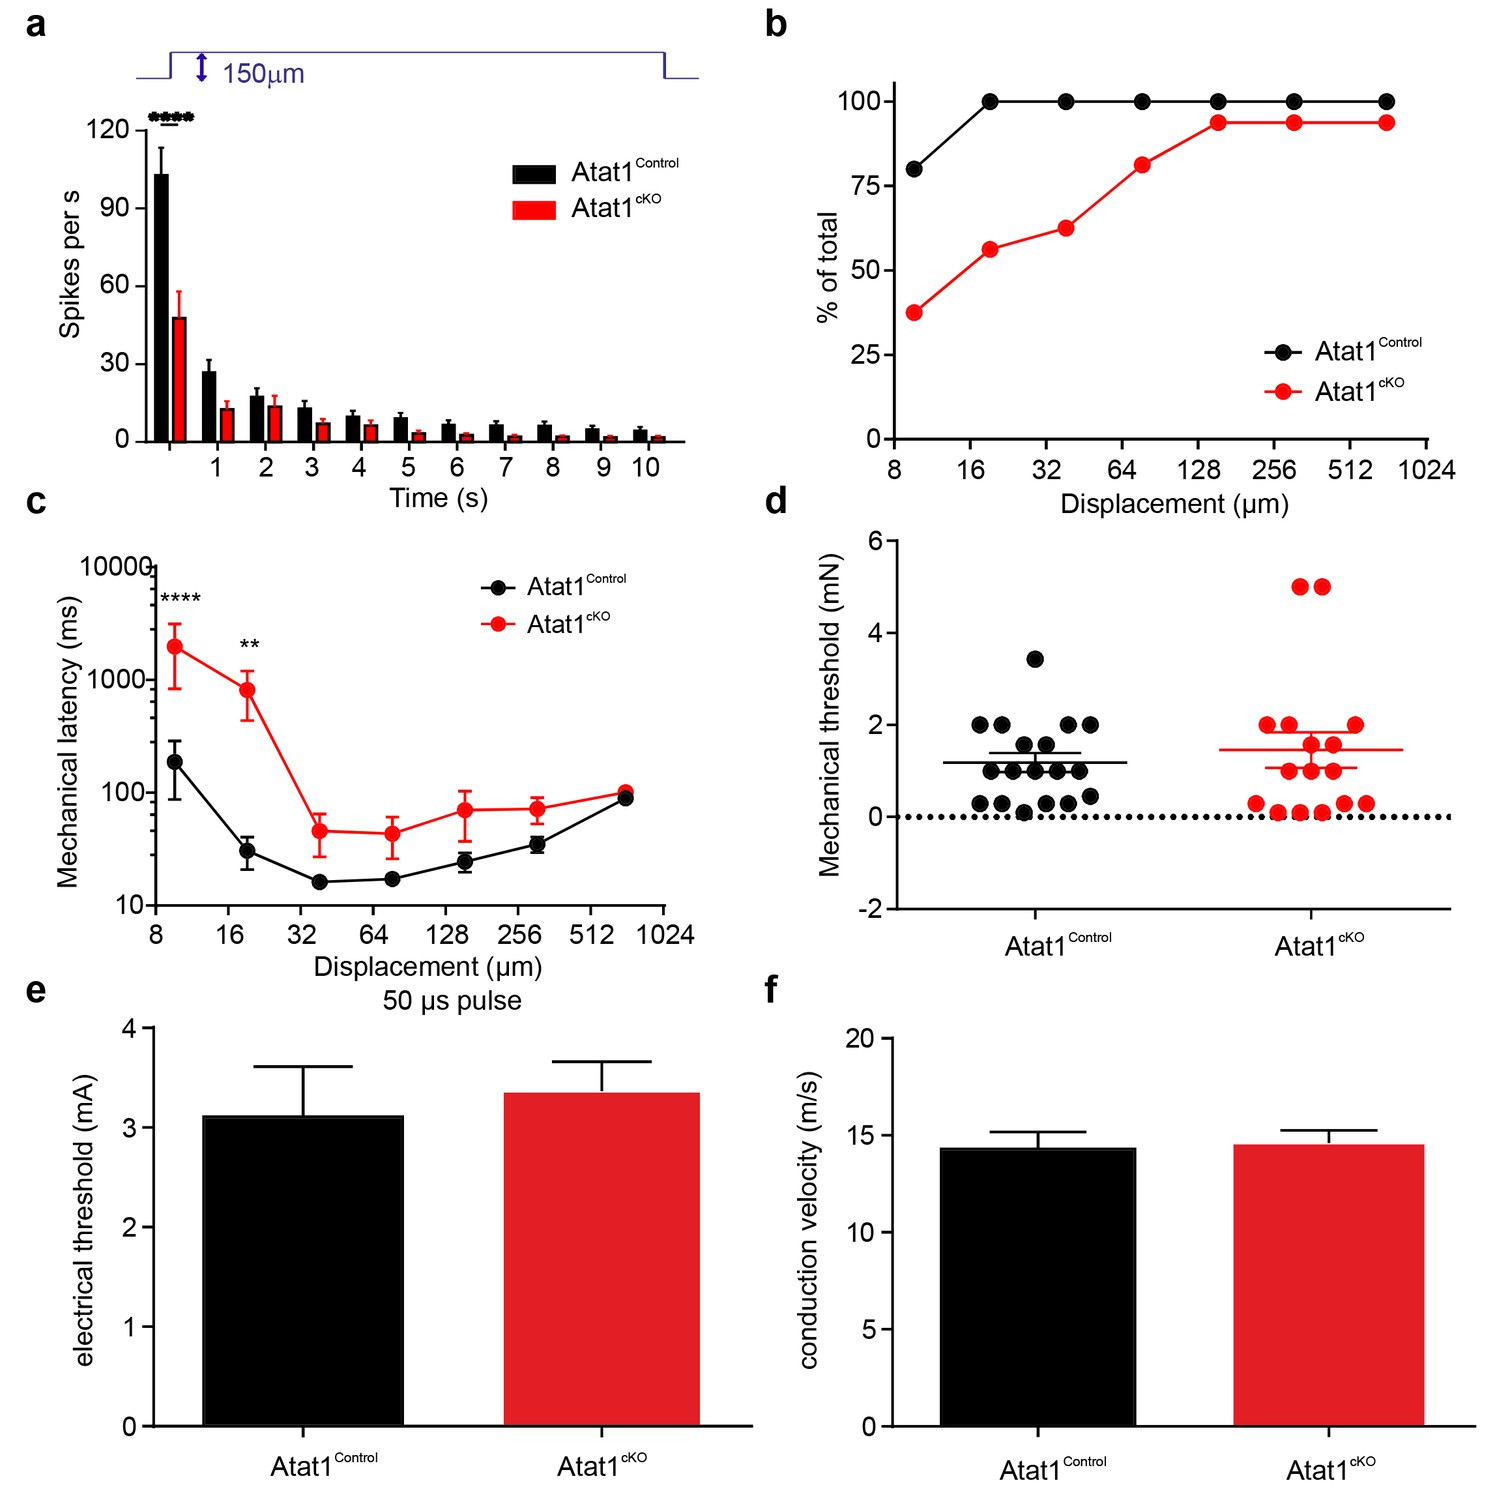
Electrical excitability and stimulus response properties of SAM fibres in Atat1Control and Atat1cKO mice.
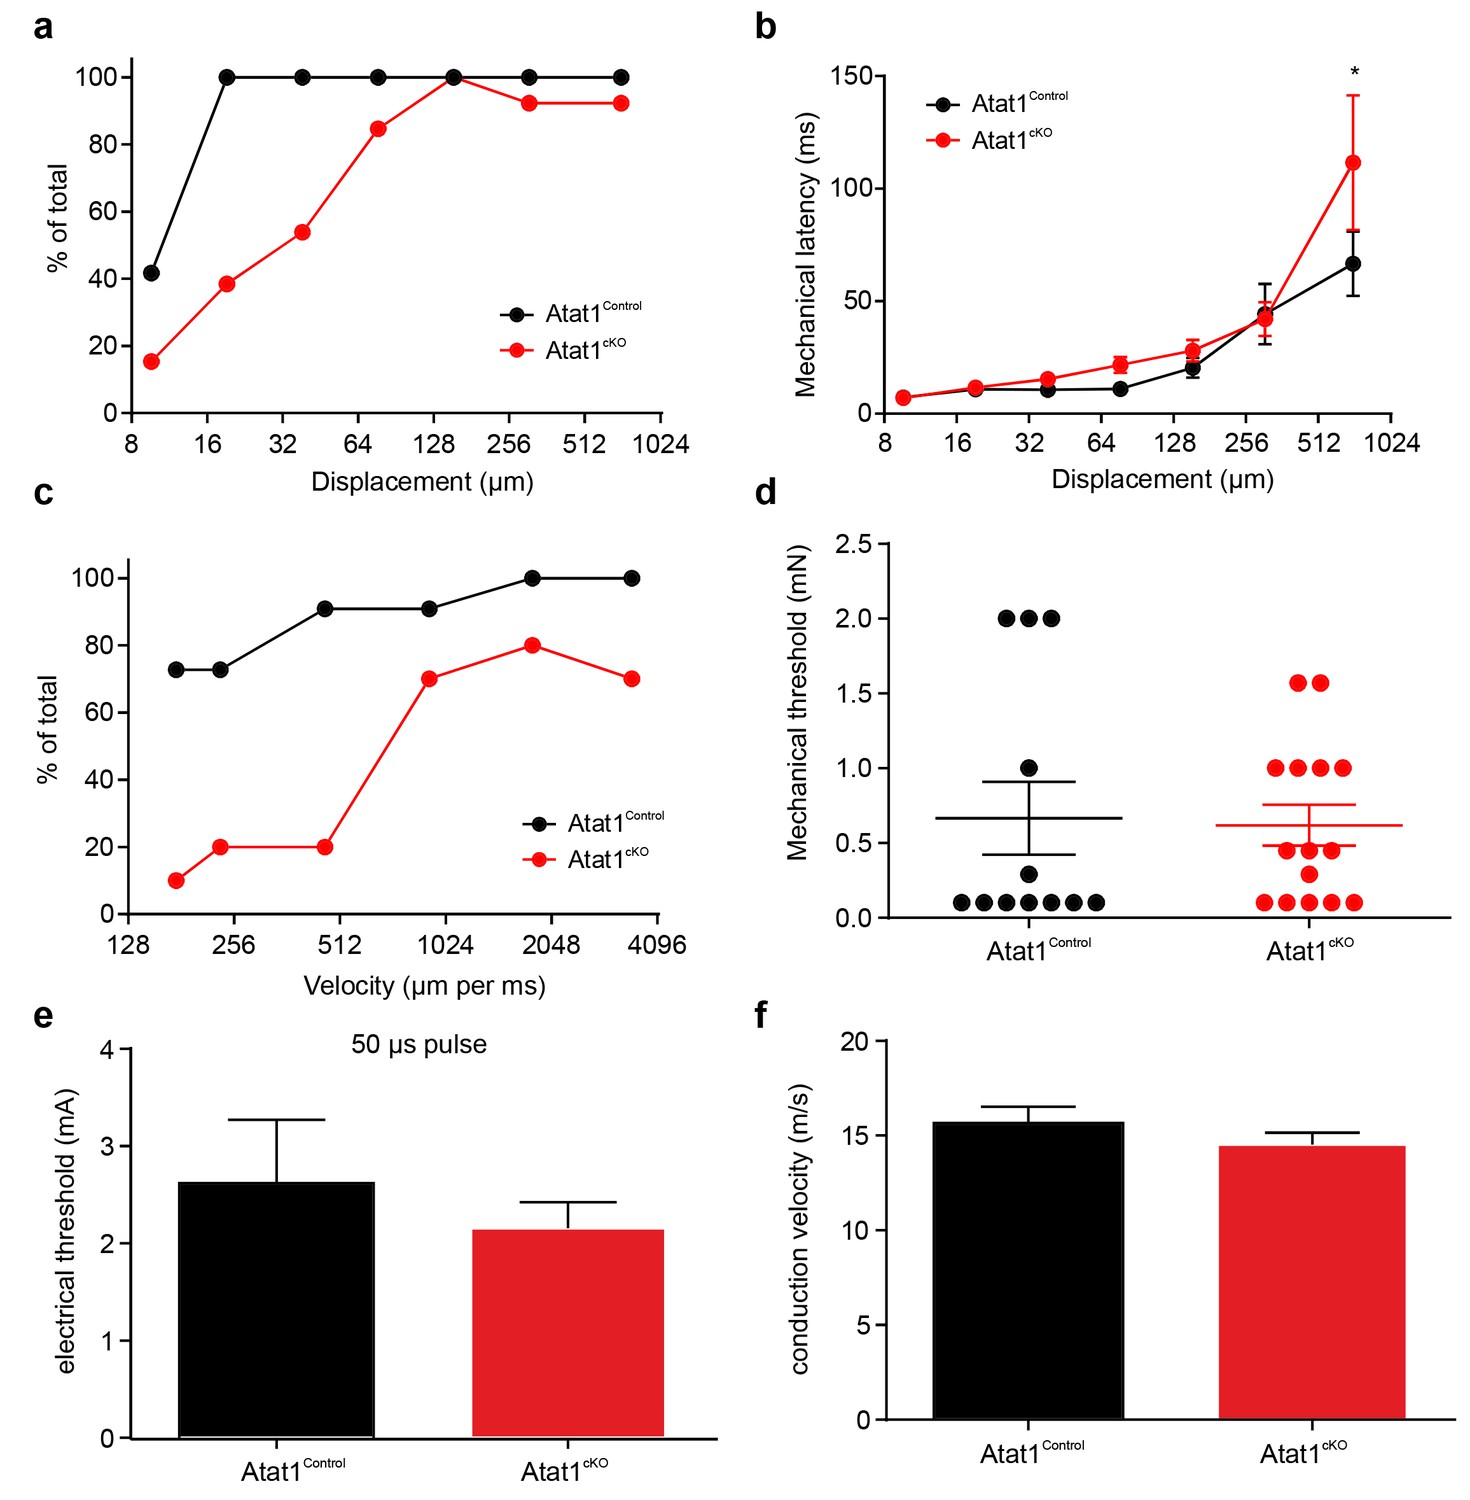
(a) Mean discharge rates (1 s bins) during the course of ramp and static stimuli. Note the significant reduction of dynamic ramp discharge recorded from Atat1cKO mice. (b) A cumulative sum plot of displacement stimulus threshold. (c) Mechanical latency as a function of displacement (two-way ANOVA with post-hoc Bonferroni’s test, p<0.0001). Mean von Frey thresholds (Mann-Whitney test, p>0.05) (d), electrical threshold to evoke a spike (unpaired t test, p>0.05) (e) and conduction velocity (unpaired t test, p>0.05) (f) are shown. *p<0.05; **p<0.01; ****p<0.0001. Error bars indicate s.e.m.
Figure 2—figure supplement 2
Electrical excitability and stimulus response properties of RAM fibres in Atat1Control and Atat1cKO mice.
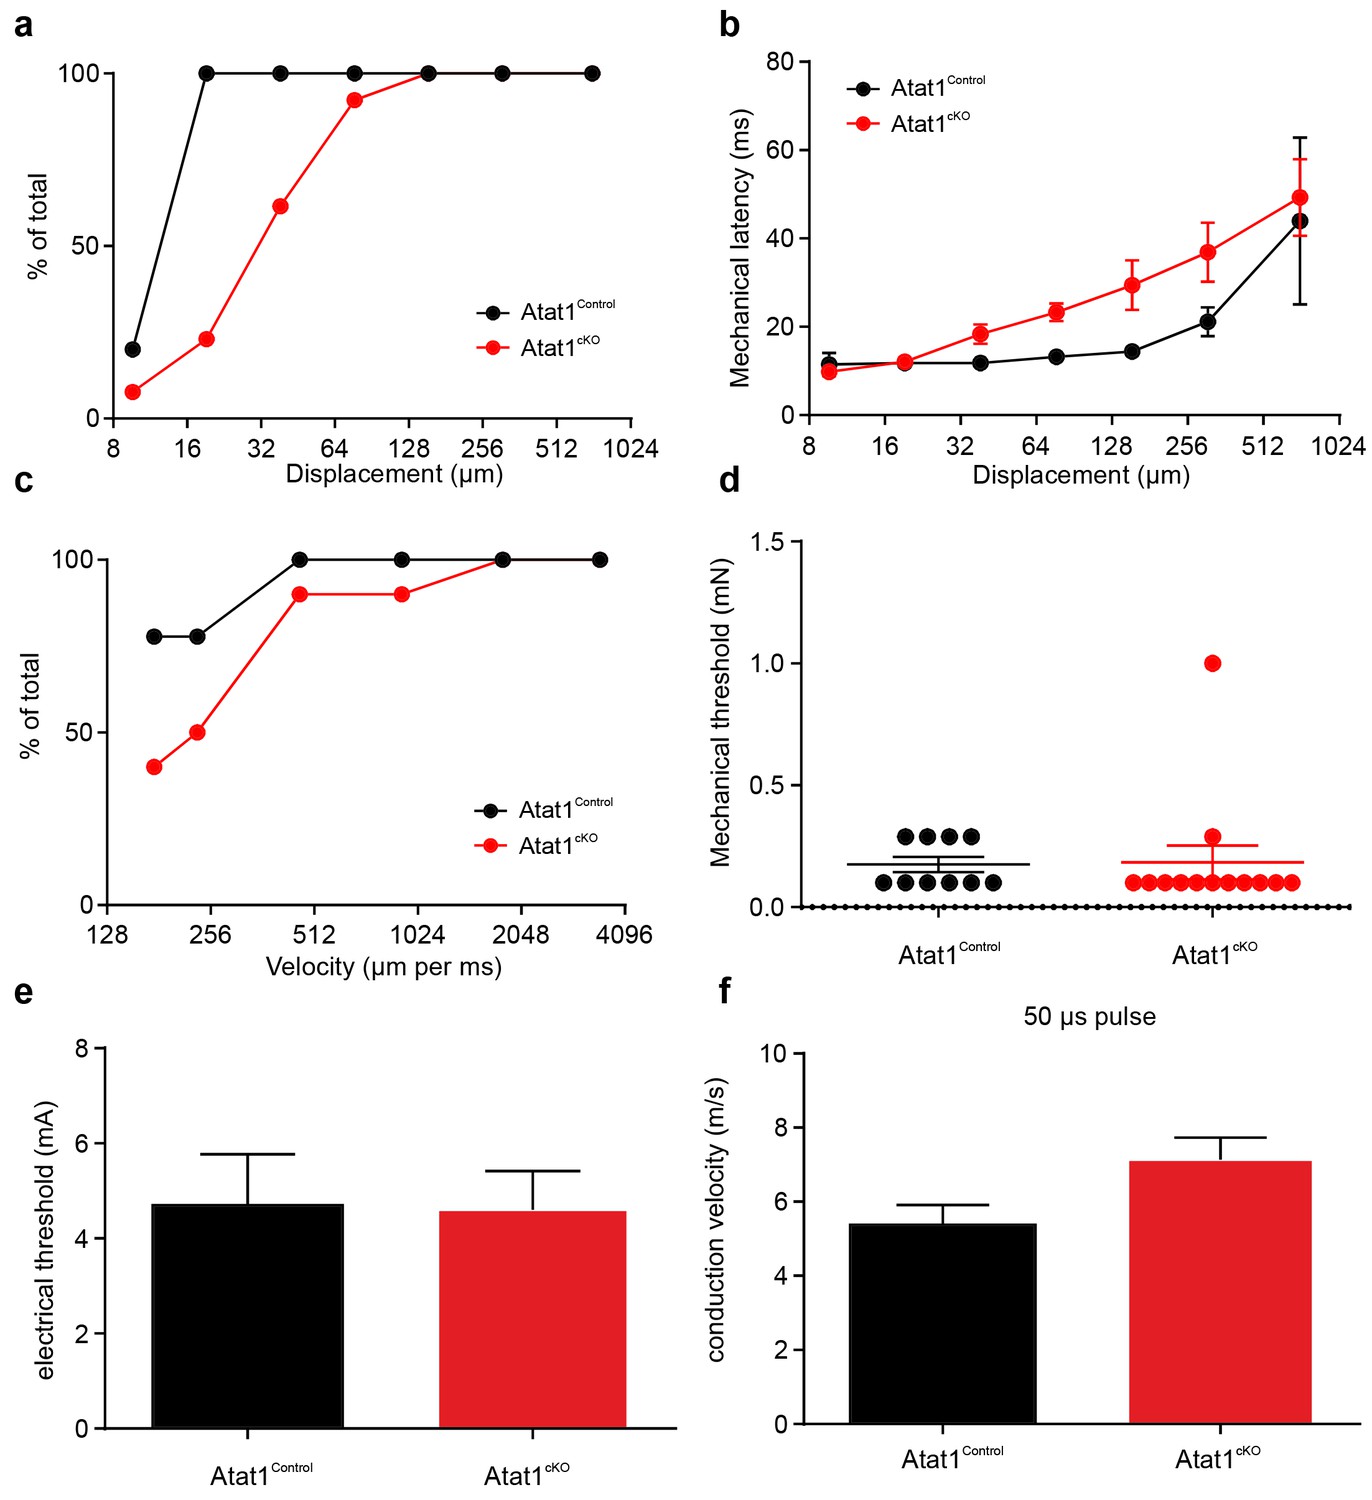
(a) A cumulative sum plot of displacement stimulus threshold. (b) Mechanical latency as a function of displacement (two-way ANOVA with post-hoc Bonferroni’s test, p>0.05). (c) A cumulative sum plot of velocity threshold. Mean von Frey thresholds (Mann-Whitney test, p>0.05) (d), electrical threshold to evoke a spike (unpaired t test, p>0.05) (e) and conduction velocity (unpaired t test, p>0.05) (f) are shown. *p<0.05. Error bars indicate s.e.m.
Figure 2—figure supplement 3
Electrical excitability and stimulus response properties of D-hair fibres in Atat1Control and Atat1cKO mice.
(a) A cumulative sum plot of displacement stimulus threshold. (b) Mechanical latency as a function of displacement (two-way ANOVA with post-hoc Bonferroni’s test, p>0.05). (c) A cumulative sum plot of velocity threshold. Mean von Frey thresholds (Mann-Whitney test, p>0.05) (d), electrical threshold to evoke a spike (unpaired t test, p>0.05) (e) and conduction velocity (unpaired t test, p>0.05) (f) are shown. **p<0.01. Error bars indicate s.e.m.
Figure 3 with 3 supplements
αTAT1 is required for mechanosensitivity of nociceptors.
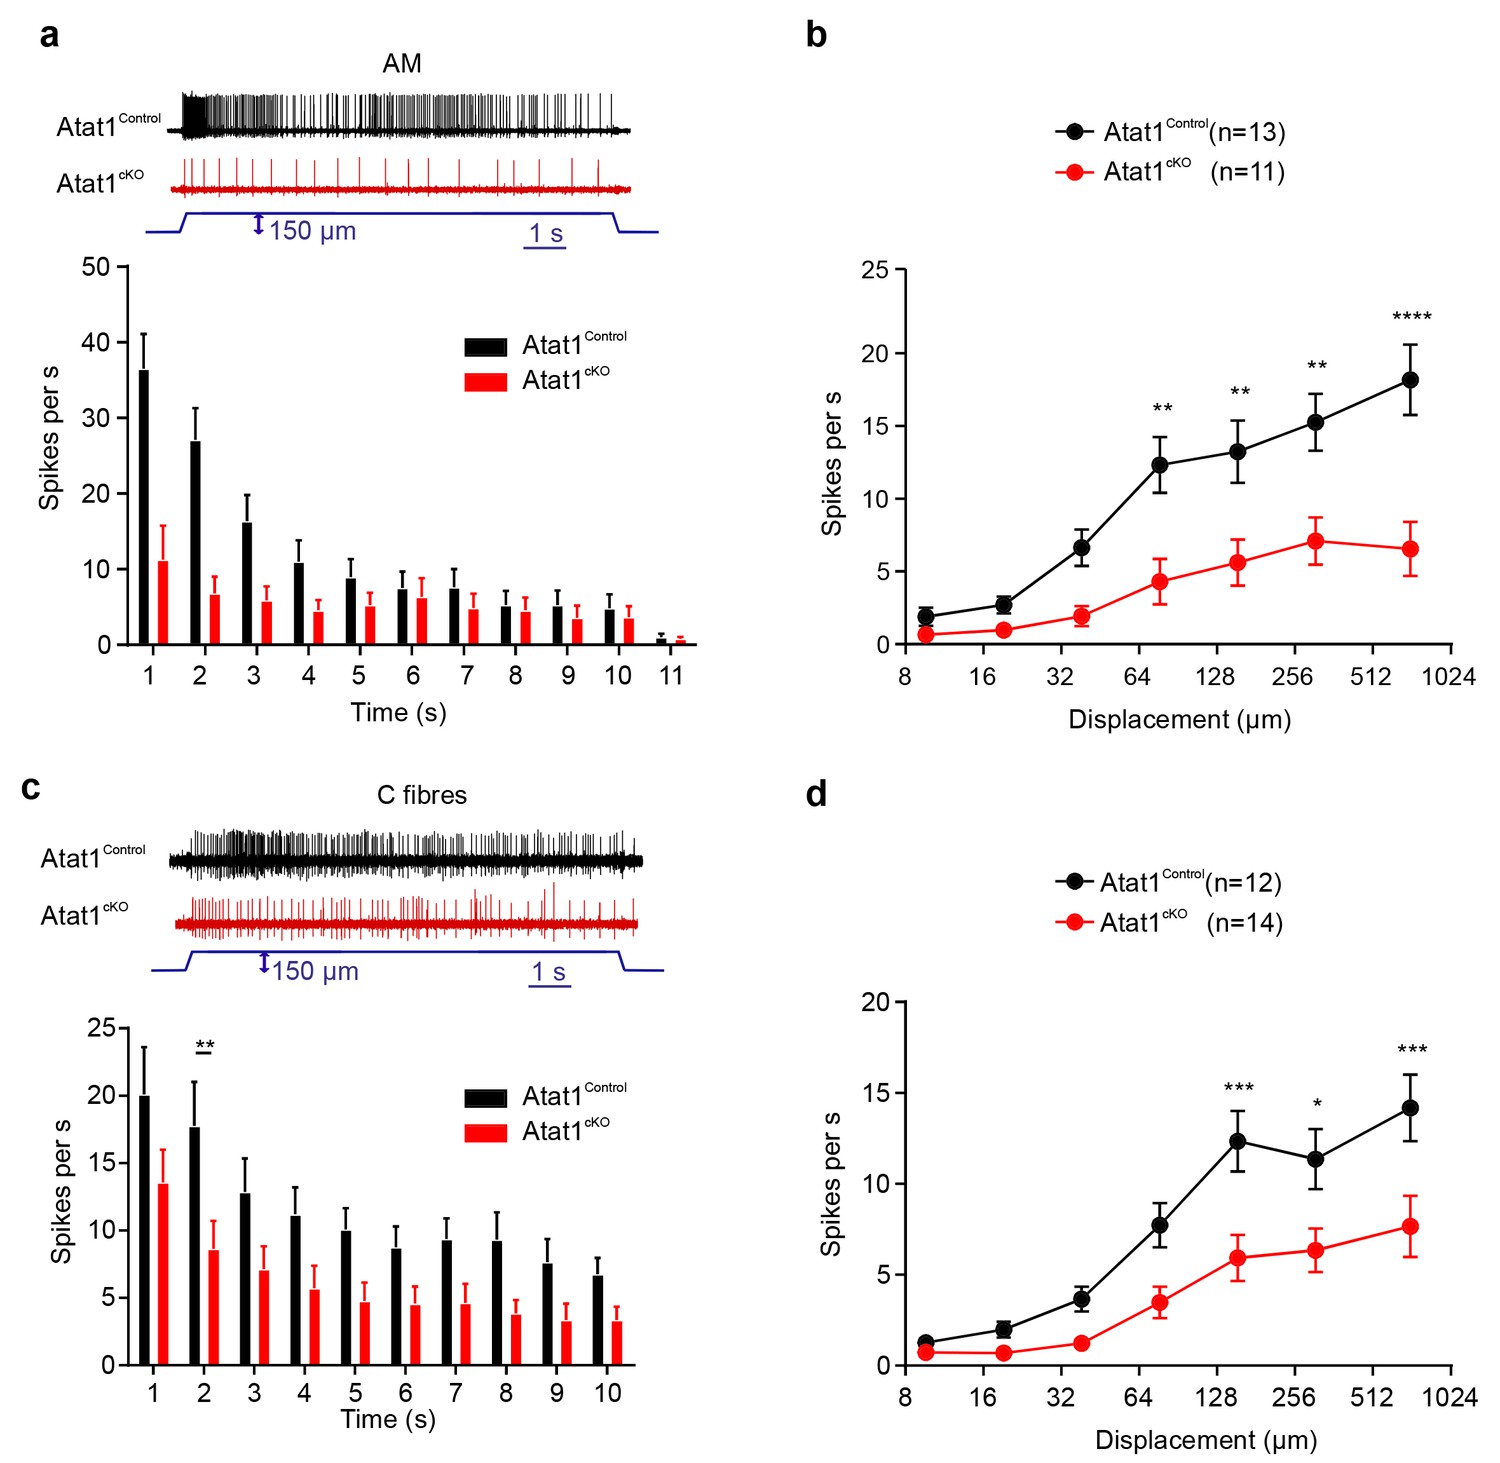
Typical responses (top) and mean discharge rates (1 s bins) during 10 s 150 µm stimulus of Aδ-mechanonociceptors (AM) (a) and C-fibre nociceptors (c) from αTAT1control and αTAT1cko mice (two-way ANOVA with post-hoc Bonferroni’s test, AM: p<0.05; C-fibre: p<0.0001). (b) Stimulus-response functions (bottom) to increasing displacement for AM (b) and C-fibre nociceptors (d) (two-way ANOVA with post-hoc Bonferroni’s test, AM: p<0.0001; C-fibre: p<0.0001). The number of fibres recorded is indicated in parentheses in each panel. *p<0.05; **p<0.01; ***p<0.001; ****p<0.0001. Error bars indicate s.e.m.
Figure 3—figure supplement 1
Electrical excitability and stimulus response properties of AM fibres in Atat1Control and Atat1cKO mice.
(a) A cumulative sum plot of displacement stimulus threshold. (b) Mechanical latency as a function of displacement (two-way ANOVA with post-hoc Bonferroni’s test, p<0.05). (c) Mean von Frey thresholds (Mann-Whitney test, p>0.05), (d) electrical threshold to evoke a spike (unpaired t test, p>0.05), and (e) conduction velocity (unpaired t test, p>0.05) are shown. Error bars indicate s.e.m.
Figure 3—figure supplement 2
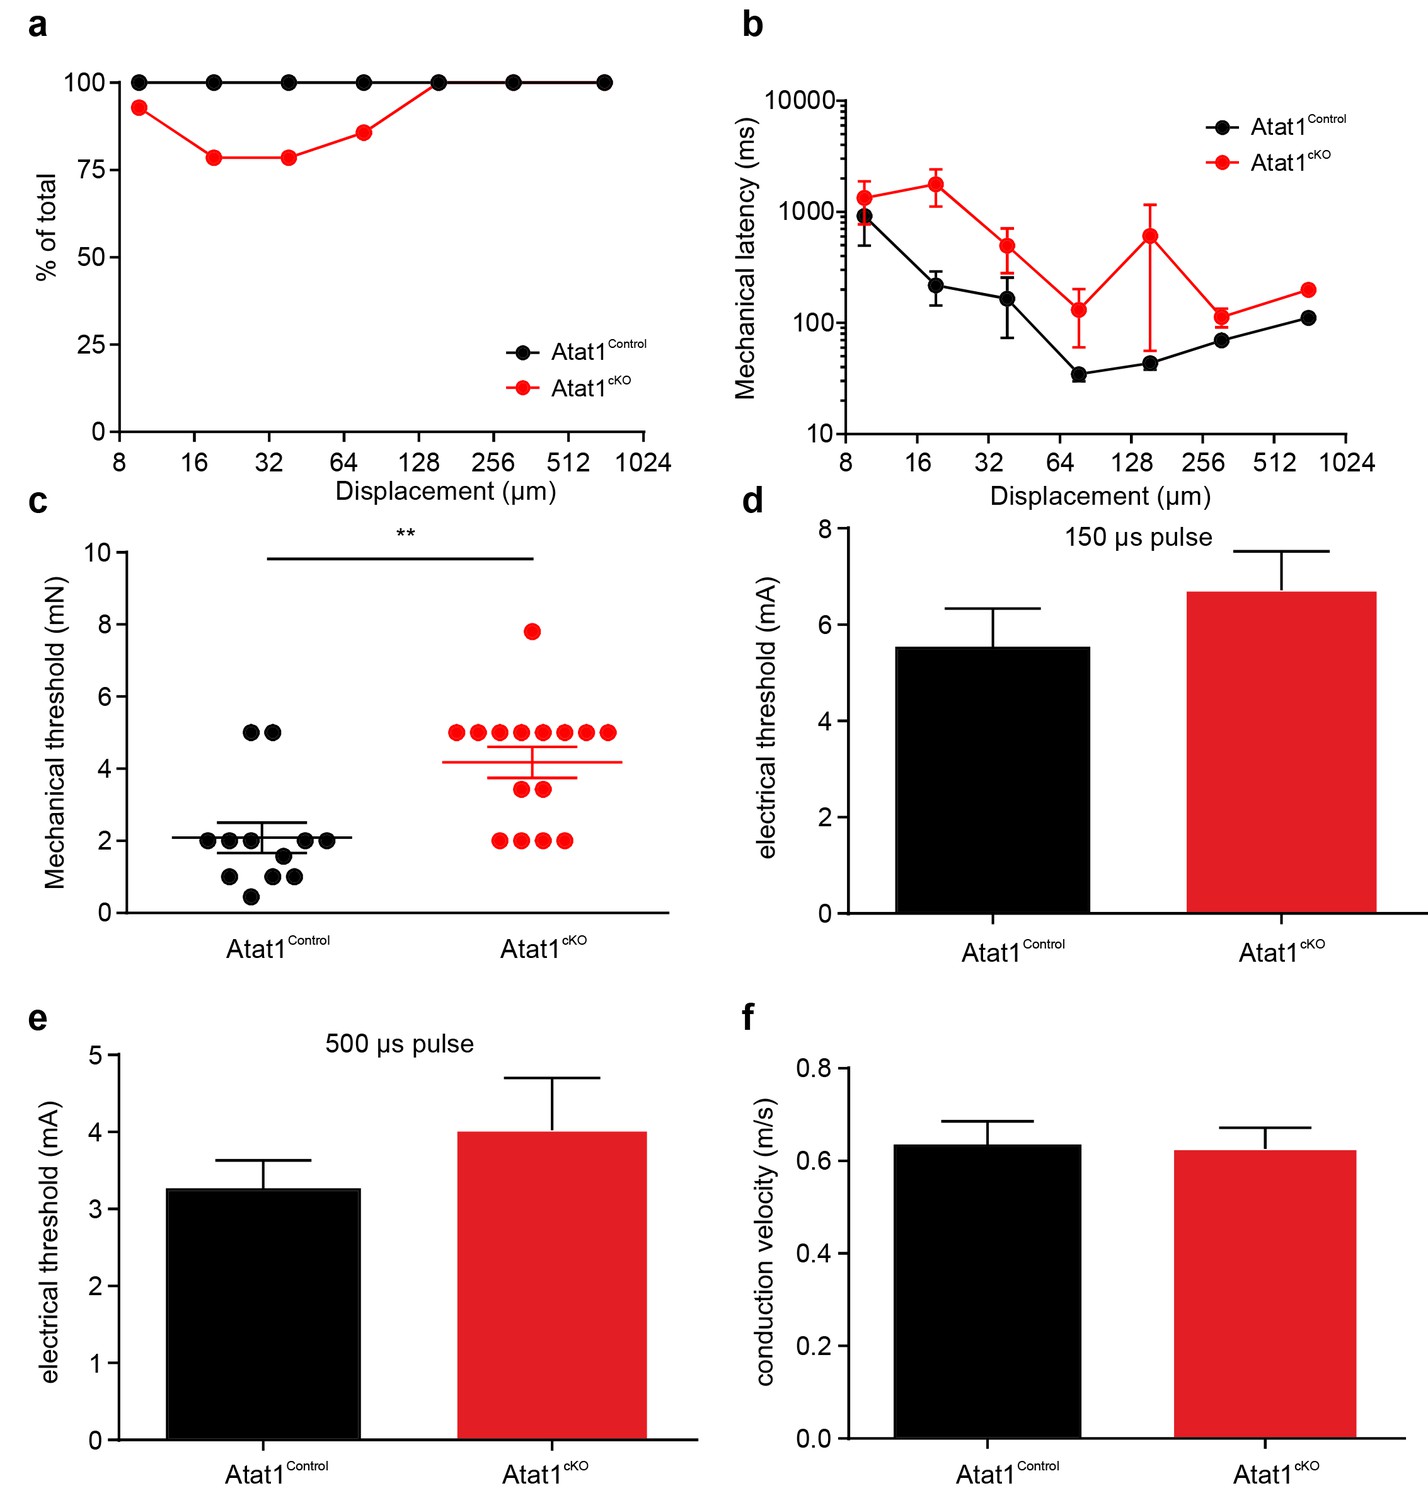
Electrical excitability and stimulus response properties of C fibres in Atat1Control and Atat1cKO mice.
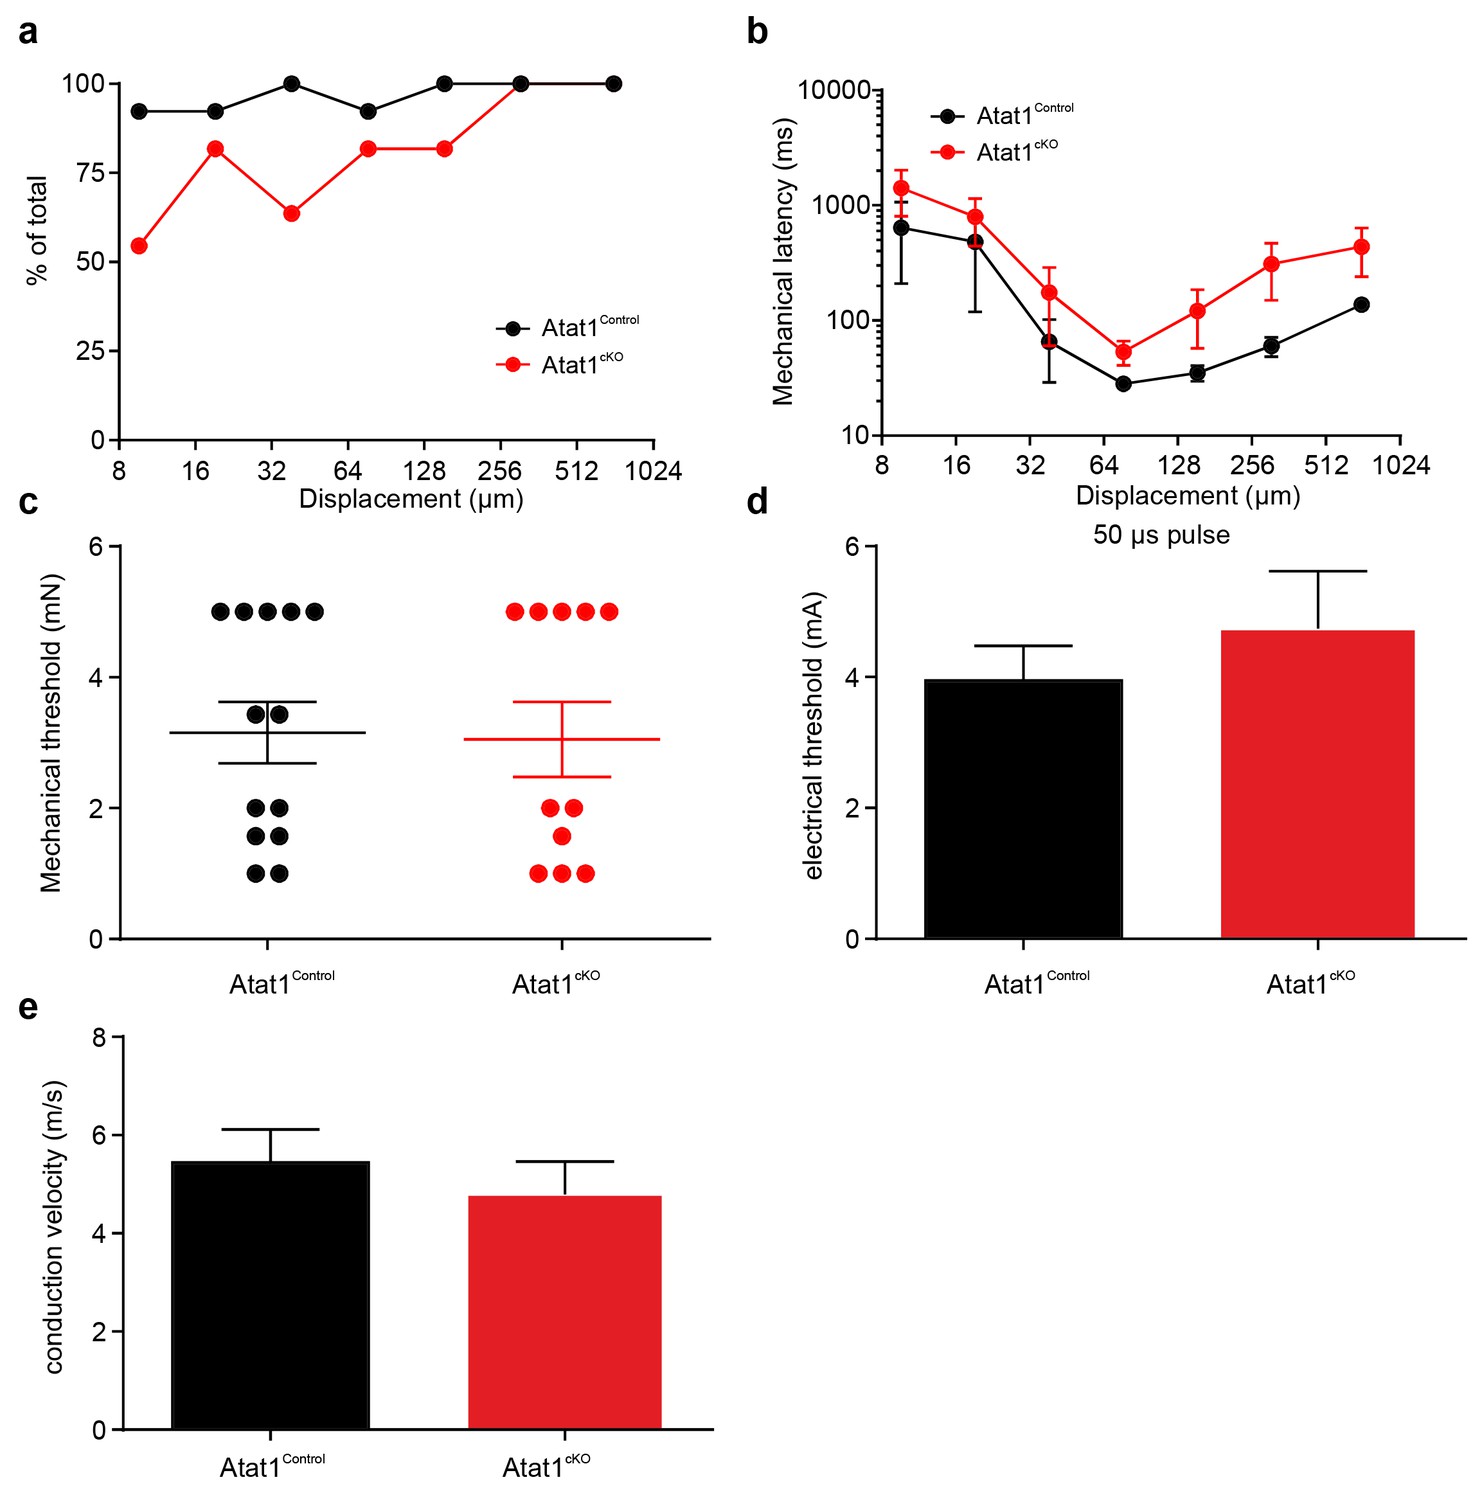
(a) A cumulative sum plot of displacement stimulus threshold. (b) Mechanical latency as a function of displacement (two-way ANOVA with post-hoc Bonferroni’s test, p<0.01). (c) Mean von Frey thresholds for C fibre discharge (Mann-Whitney test, p<0.01). Electrical threshold with 150 μs (d) or 500 μs (e) pulse to evoke a spike (unpaired t test, 150 μs: p>0.05; 500 μs: p>0.05). (f) Conduction velocity (unpaired t test, p>0.05). **p<0.01. Error bars indicate s.e.m.
Figure 3—figure supplement 3
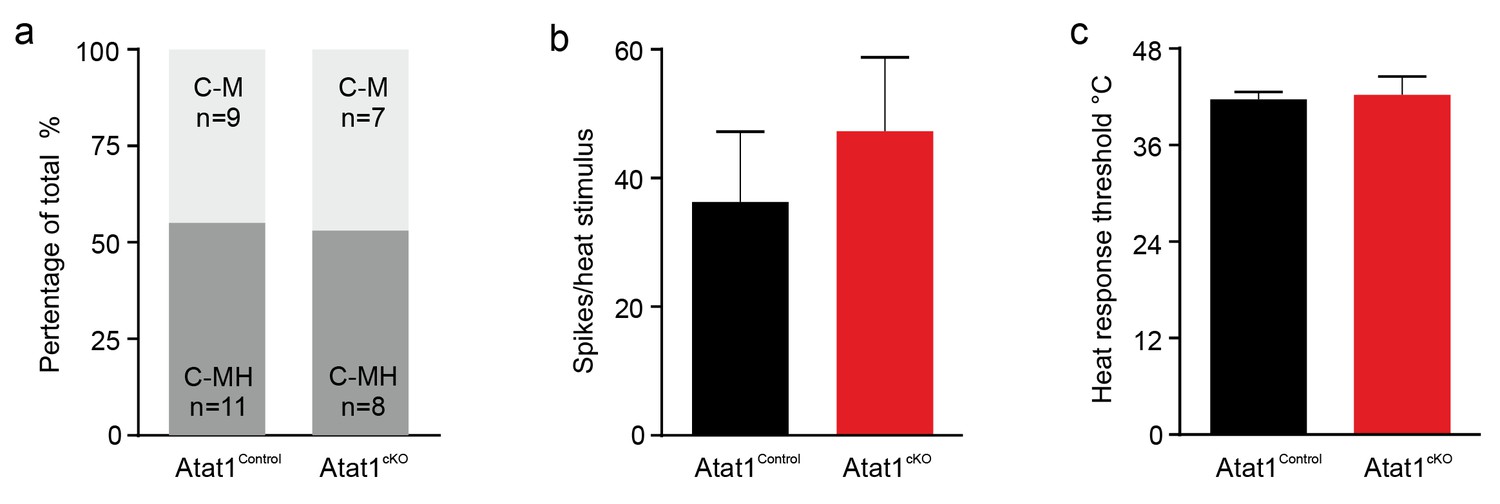
Heat response of C fibers in Atat1Control and Atat1cKO mice.
(a) Proportions of C fibers responding to noxious heat. C-M, C mechanonociceptor; C-MH, C mechano/heat receptor, responding both to noxious heat and mechanical stimuli. No significant difference was observed between Atat1Control and Atat1cKO mice (Fisher’s exact test, p>0.05). (b) Firing rates and (c) heat thresholds to heat ramps did not differ between C-MH fibres recorded from Atat1Control and Atat1cKO mice (unpaired t test, p>0.05). Error bars indicate s.e.m.
Figure 4 with 2 supplements
Morphological analysis of the peripheral nervous system in Atat1cKO mice.
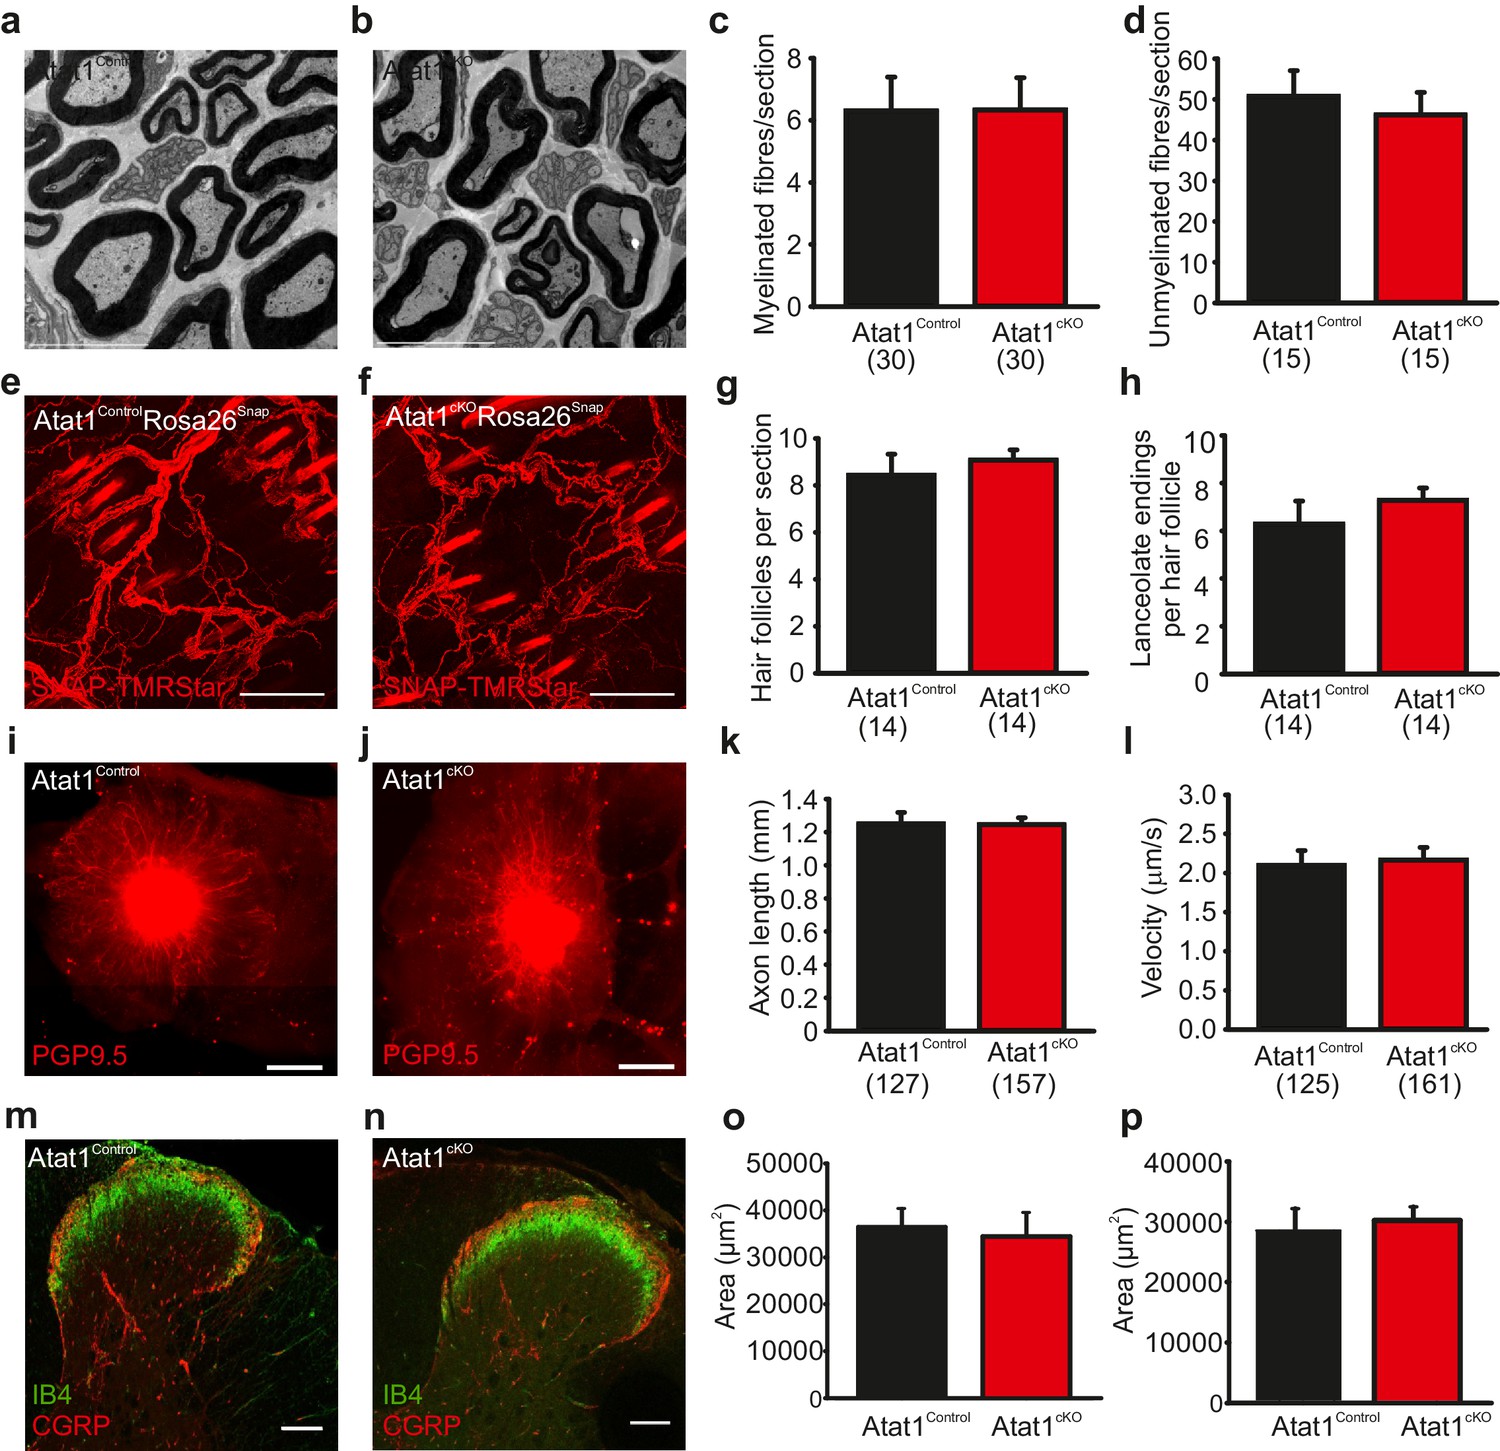
(a and b) Electron micrographs of a sectioned saphenous nerve from an Atat1Control (a) and Atat1cKO (b) mouse (Scale bar 5 μm). (c and d) Graph summarizing the number of myelinated fibres (c) and unmyelinated fibres (d) from saphenous nerve sections. No significant difference was noted between the samples (t-Test, p>0.05). (e and f) Fluorescent image of skin taken from the finger of an Atat1Control::Rosa26Snap mouse (e) and Atat1cKO::Rosa26Snap mouse (f) labelled with SNAP-TMR Star (Scale bar 100 μm). (g and h) Bar-chart showing the number of innervated hair follicles (g) and lanceolate endings per hair follicle (h) in skin taken from the digits of Atat1Control::Rosa26Snap and Atat1cKO::Rosa26Snap animals. No significant difference was observed between the genotypes (t-Test, p>0.05). (i and j) Mosaic image of PGP9.5 stained whole mount DRG after seven days in culture from Atat1Control (i) and Atat1cKO (j) mice (Scale bar 500 μm). (k) Bar-chart showing the length of axonal outgrowths after 7 days of culture. No significant difference was observed in Atat1Control and Atat1cKO DRG (t-Test, p>0.05). (l) Single molecule tracking of NGF molecules in neurites from Atat1Control and Atat1cKO DRG grown in microfluidic devices. Graph showing the average instantaneous velocity for NGF coupled quantum dots. No significant difference in NGF transport was observed between the genotypes (t-Test, p>0.05). (m and n) Confocal images of sectioned spinal cord dorsal horn from Atat1Control (m) and Atat1cKO (n) stained with IB4 (green) and CGRP (red) antibody respectively (Scale bar 100 μm). (o) Bar-chart showing the size of the area stained with IB4. No significant difference was observed in the size of the area between Atat1Control and Atat1cKO spinal cord (t-Test, p>0.05). (p) Bar-chart showing the size of the area stained with a CGRP antibody. No significant difference was observed in the size of the area between Atat1Control and Atat1cKO spinal cord (t-Test, p>0.05). Error bars indicate s.e.m.
Figure 4—figure supplement 1
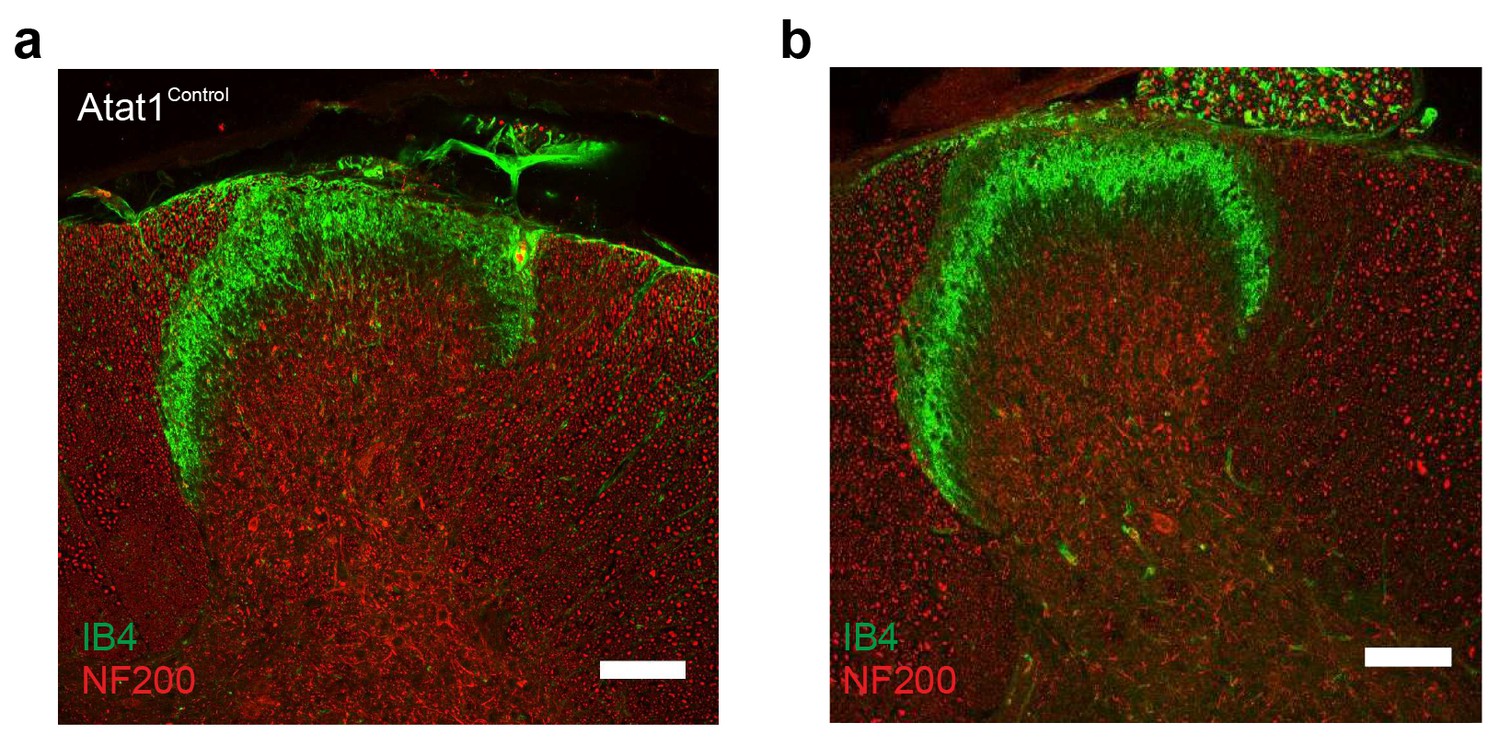
Spinal cord staining in Atat1Control and Atat1cKO mice.
(a) Representative fluorescent image of a 100 μM section of spinal cord taken from an Atat1Control mouse stained with IB4 (green) and NF200 (red) (Scale bar 100 μM). (b) Representative fluorescent image of a 100 μM section of spinal cord from an Atat1cKO mouse stained with IB4 (green) and NF200 (red) (Scale bar 100 μM).
Figure 4—figure supplement 2
Axonal transport in DRG neurons from Atat1cKO mice.
(a) Single molecule tracking of NGF molecules linked to Quantum dots in neurites from Atat1Control and Atat1cKO (b) DRG grown in microfluidic devices. (c) Average response. Error bars indicate SEM.
Figure 5 with 4 supplements
Atat1-mediated acetylated microtubules regulate mechanosensitivity in sensory neurons.
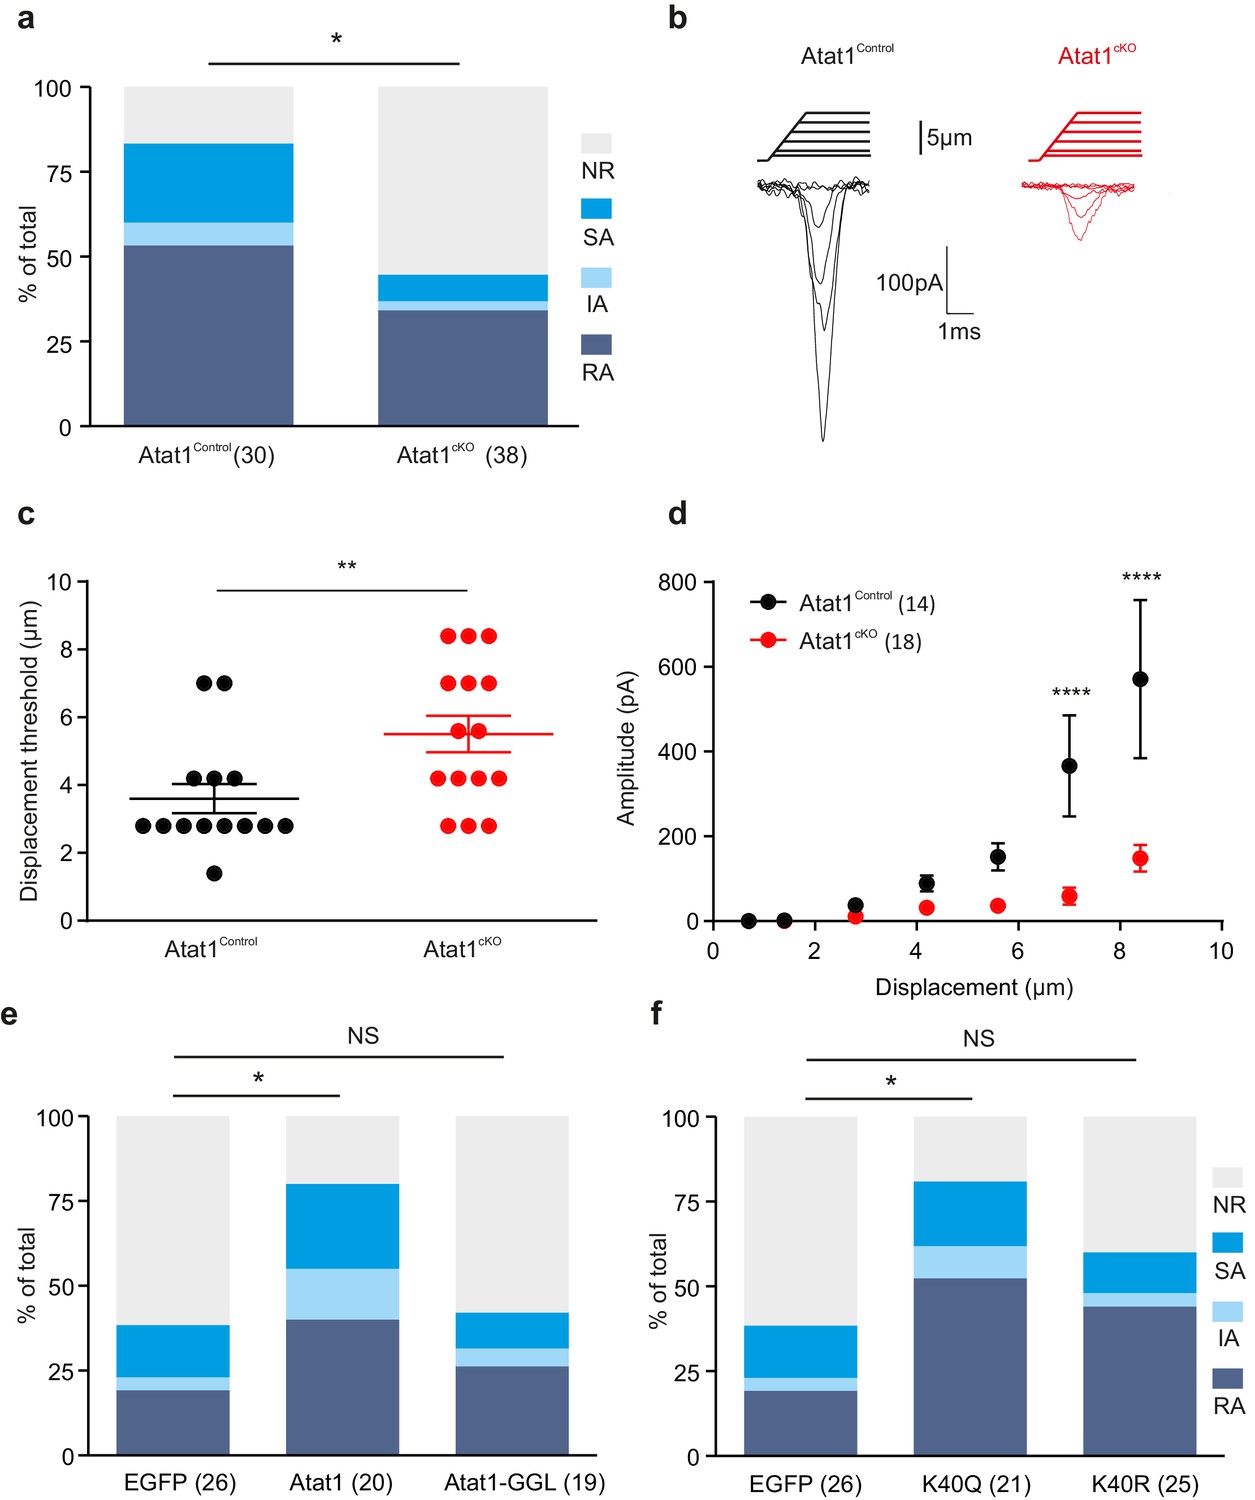
(a) Stacked histograms showing the proportion of different mechano-gated currents activated by neurite indentation in sensory neurons from control Atat1Control and Atat1cKO mice (χ2 test, p<0.05). NR, non-responsive to given displacement 512 nm. (b) Representative traces of RA currents elicited by increasing probe displacement on soma of Atat1Control and Atat1cKO sensory neurons. (c) Threshold of activation of RA currents was determined as mechanical stimulus that elicited a current ≥ 20 pA. Closed circles indicate individual recorded cells. Note the marked increase in the displacement threshold in Atat1cKO sensory neurons (Mann-Whitney test, p<0.01). (d) Stimulus-response curve of RA currents evoked by increasing probe displacement. Genetic depletion of aTAT1 in sensory neuron significantly reduced RA-currents amplitude (two-way ANOVA with post-hoc Bonferroni’s test, p<0.0001). (e) Stacked histograms showing the proportions of different mechano-gated currents from stimulation of the neurites observed in Atat1cKO sensory neurons transfected with EGFP, Atat1-YFP or Atat1-GGL-YFP cDNA. Transfection of wild-type Atat1 rescued the loss of mechanosensitivity, while transfection of catalytically inactive Atat1 (Atat1-GGL-YFP) failed to restore it in Atat1cKO sensory neurons (χ2 test, EGFP versus Atat1-YFP, p<0.05; EGFP versus Atat1-GGL-YFP, p>0.05). (f) Stacked histograms showing the proportions of different mechano-gated currents from stimulation of the neurites observed in Atat1cKO sensory neurons transfected with EGFP, α-tubulinK40R-IRES-YFP (K40R) or α-tubulinK40Q-IRES-YFP (K40Q) cDNA. Transfection of acetylated α-tubulin mimics (K40Q) but not non-acetylatable α-tubulin mutant (K40R) restored mechanosensitivity in Atat1cKO sensory neurons (χ2 test, EGFP versus K40Q, p<0.05; EGFP versus K40R, p>0.05). The number of neurons recorded is indicated in parentheses in each panel. **p<0.01; ****p<0.0001; Error bars indicate s.e.m.
Figure 5—figure supplement 1
Absence of Atat1 in sensory neurons does not alter kinetic properties of RA currents.
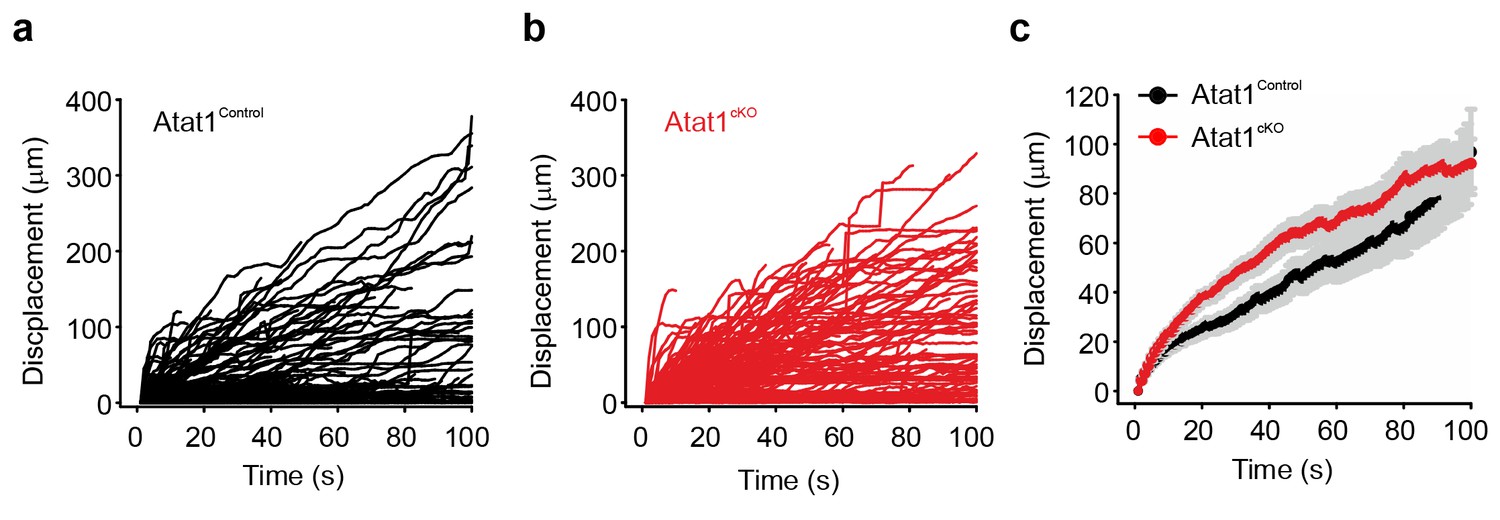
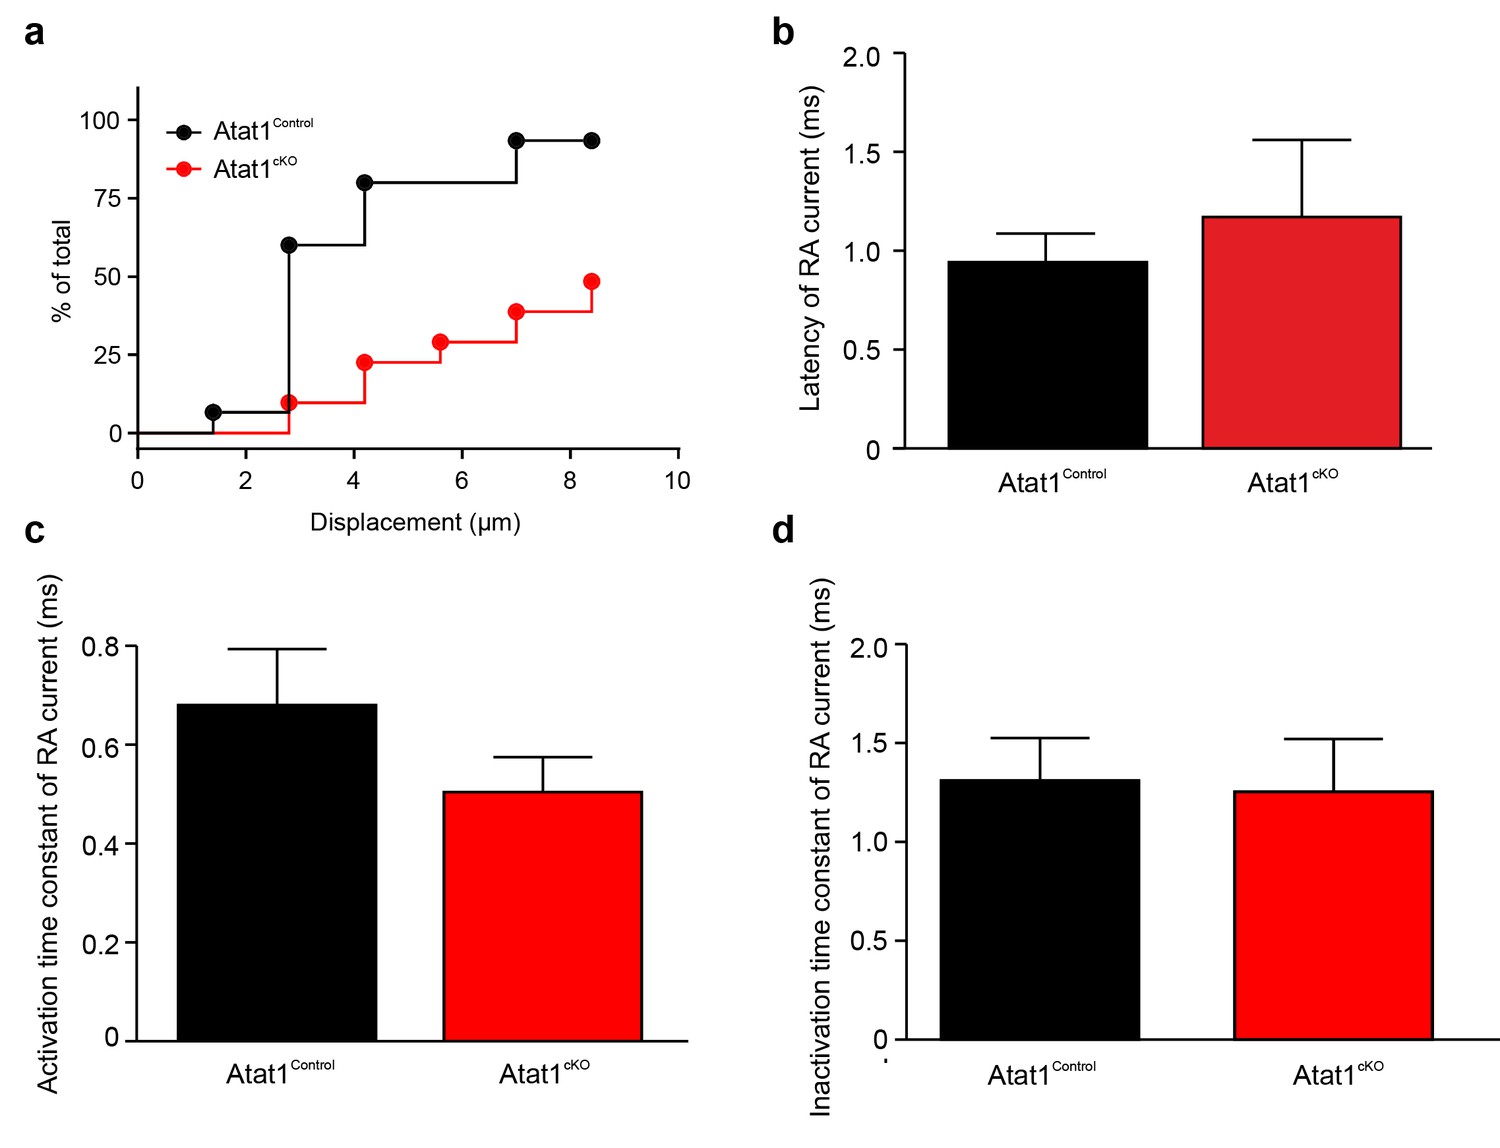
(a) The proportion of neurons that display a mechano-gated response as function of displacement was plotted for Atat1Control (n = 15) and Atat1cKO (n = 31) sensory neurons. Quantitative comparison of latency. (b) activation time constant (b) and inactivation time constant (c) of RA currents for Atat1Control and Atat1cKO sensory neurons (n = 13–16, unpaired t-test, p>0.05). Error bars indicate s.e.m.
Figure 5—figure supplement 2
Absence of Atat1 in sensory neurons does not alter membrane electrophysiological properties and proton activated currents.
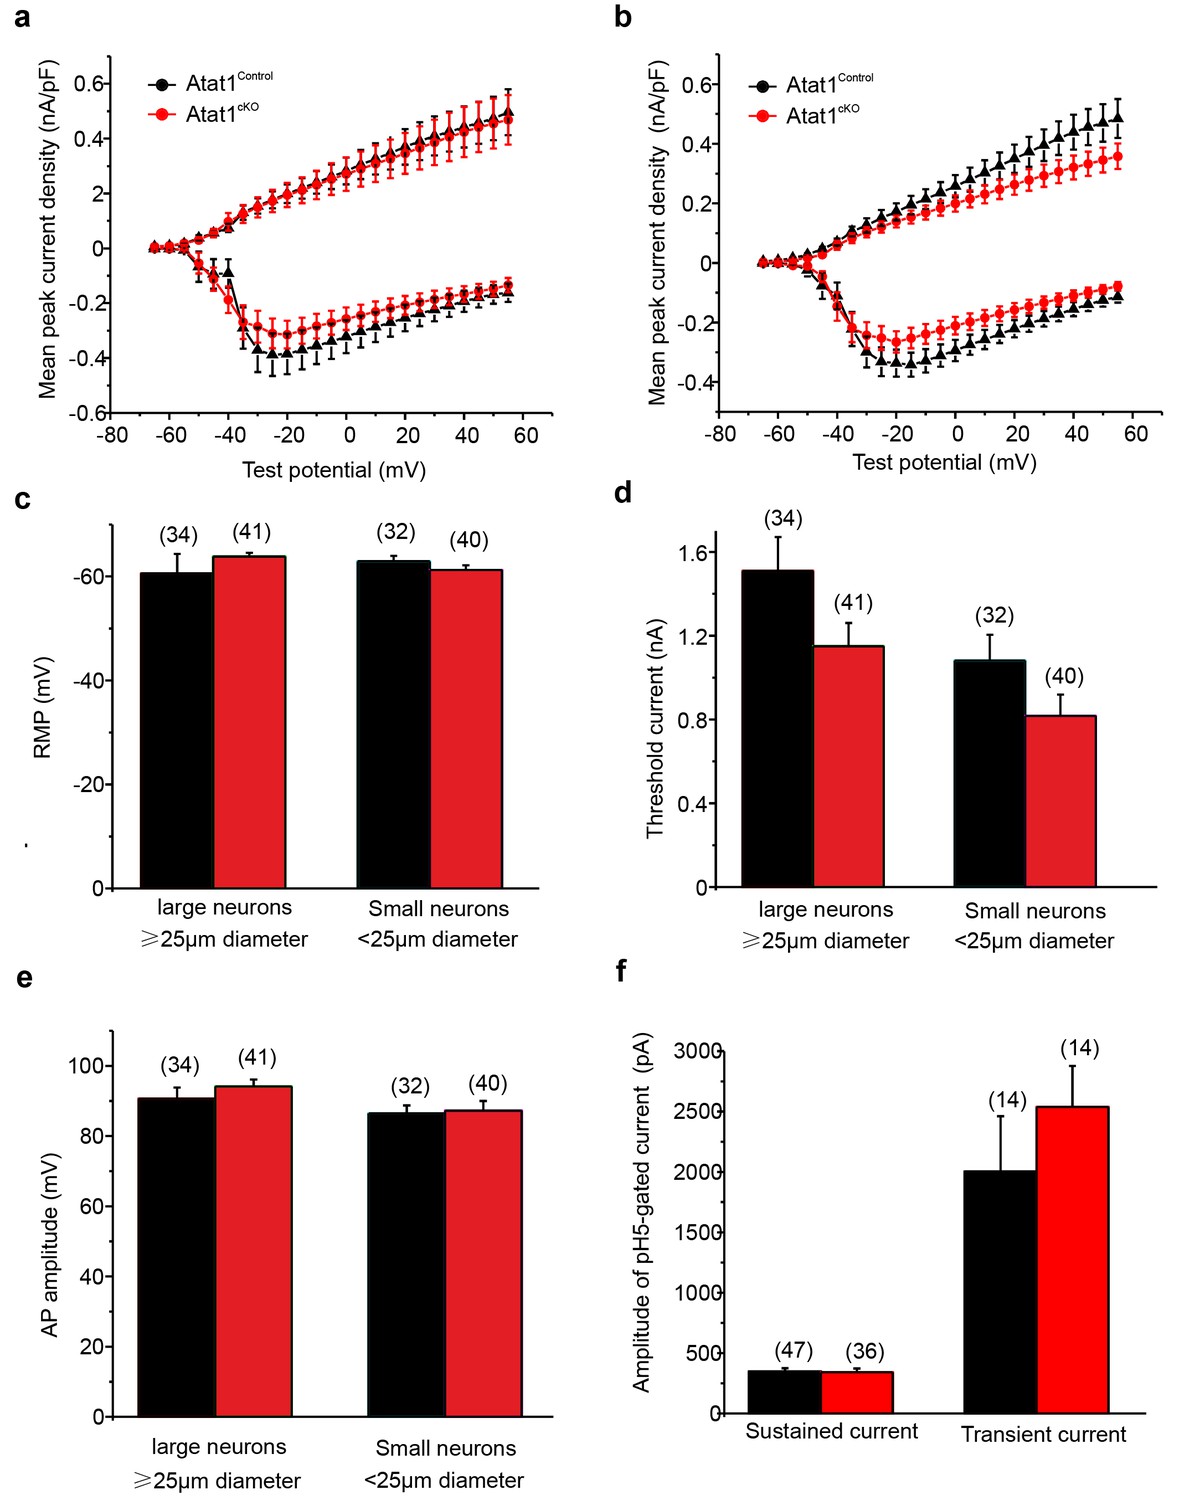
(a, b) Absence of Atat1 in sensory neurons does not alter voltage gated currents. Mean whole-cell inward and outward currents are measured at different test potentials for Atat1Control and Atat1cKO sensory neurons. Cells are grouped into large ( = 25 μm diameter; Atat1Control: n = 26; Atat1cKO: n = 25) (a) and small ( < 25 μm diameter; Atat1Control: n = 26; Atat1cKO: n = 30) (b) cells based on soma size. No significant change was observed in the peak amplitude of voltage gated inward and outward currents between Atat1Control and Atat1cKO sensory neurons for large and small cells (two-way ANOVA with post-hoc Bonferroni’s test, p>0.05). Summary of (c) resting membrane potential (RMP), (d) threshold current for action potential initiation and (e) action potential amplitude in Atat1Control and Atat1cKO sensory neurons (unpaired t-test p>0.05). (f) Deletion of αTAT1 in sensory neuron does not alter proton activated currents. The amplitudes of sustained and transient currents evoked by pH5 in Atat1cKO sensory neurons were not significantly different from those in control sensory neurons (unpaired t-test, sustained current: p>0.05; transient current: p>0.05). The number of neurons recorded is indicated in parentheses in each panel. Error bars indicate s.e.m.
Figure 5—figure supplement 3
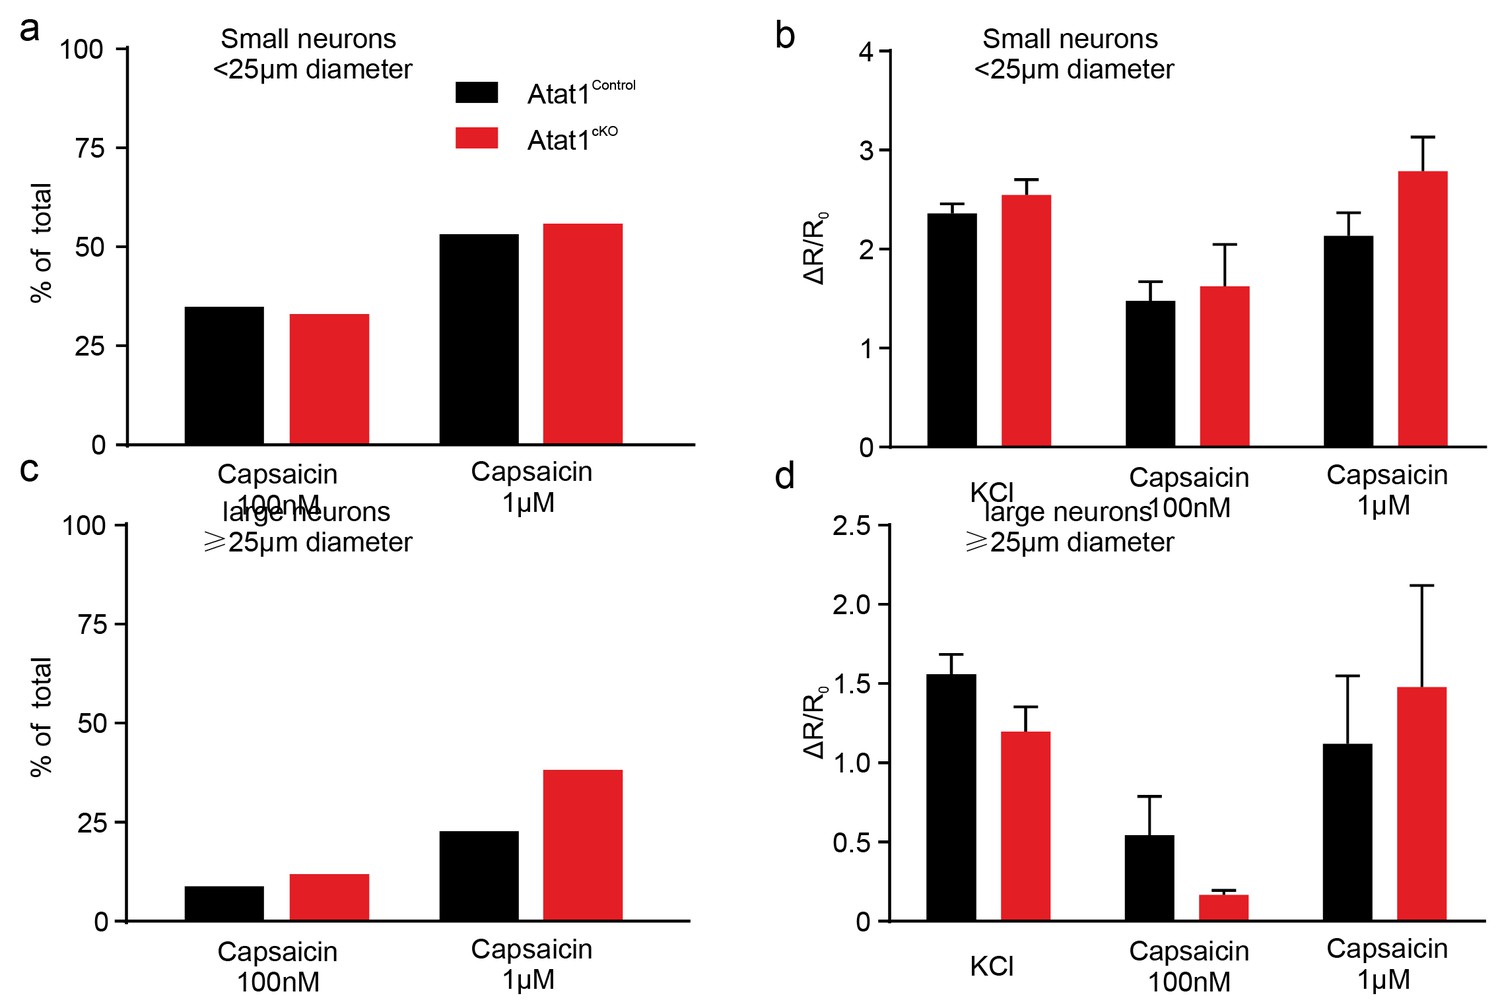
Capsaicin response of DRG neurons in Atat1Control and Atat1cKO mice.
(a) The proportion of small neurons (diameter < 25 μm) displaying capsaicin evoked calcium transients was not different between Atat1Control and Atat1cKO mice (100 nM capsaicin: Atat1Control, n = 169; Atat1cKO, n = 100; Fisher’s exact test: p>0.05. 1 μM capsaicin: Atat1Control, n = 156; Atat1cKO, n = 111; Fisher’s exact test: p>0.05). (b) The normalized peak ratio (ΔR/R0) of small neurons’ responses to high KCl, 100 nM and 1 μM capsaicin was not different between Atat1control and Atat1cKO mice (unpaired t test: high KCl, Atat1Control, n = 169; Atat1cKO, n = 118, p>0.05; 100 nM capsaicin, Atat1Control, n = 59; Atat1cKO, n = 33, p>0.05; 1 μM capsaicin, Atat1Control, n = 83; Atat1cKO, n = 62, p>0.05). (c) The proportion of large neurons (diameter = 25 μm) displaying capsaicin evoked calcium transients was not different between Atat1Control and Atat1cKO mice (100 nM capsaicin: Atat1Control, n = 45; Atat1cKO, n = 25; Fisher’s exact test: p>0.05. 1 μM capsaicin: Atat1Control, n = 44; Atat1cKO, n = 34; Fisher’s exact test: p>0.05). (d) The normalized peak ratio (ΔR/R0) of large neurons’ responses to high KCl, 100 nM and 1 μM capsaicin was not different between Atat1Control and Atat1cKO mice (unpaired t test: high KCl, Atat1Control, n = 45; Atat1cKO, n = 34, p>0.05; 100 nM capsaicin, Atat1Control, n = 4; Atat1cKO, n = 3, p>0.05; 1 μM capsaicin, Atat1Control, n = 10; Atat1cKO, n = 13, p>0.05). Error bars s.e.m.
Figure 5—figure supplement 4
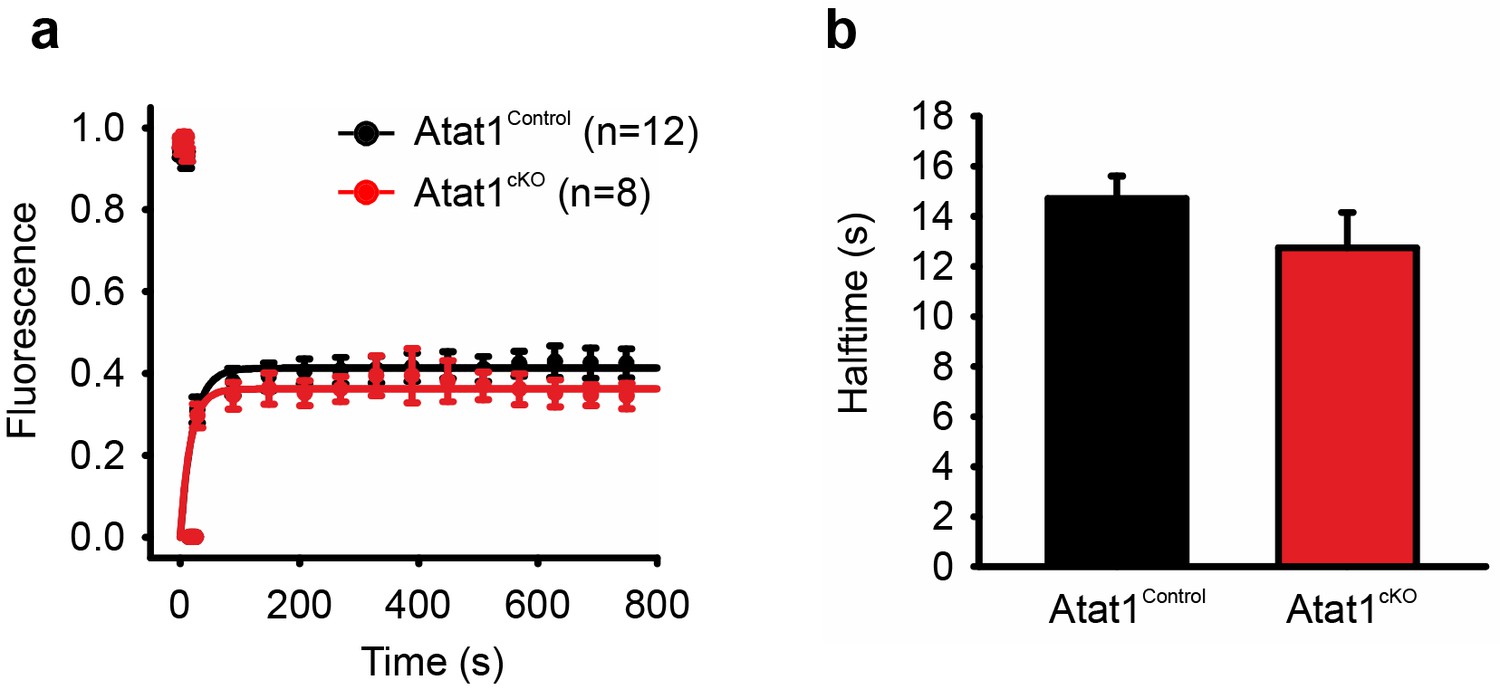
FRAP analysis of Piezo2 in transfected DRG from Atat1Control and Atat1cKO mice.
(a) Graph of recovery from photobleaching of Piezo2-GFP construct transfected into DRG neurons from Atat1Control and Atat1cKO mice. (b) Halftime of recovery in Atat1Control and Atat1cKO mice (p>0.05, t-test). Error bars indicate SEM.
Figure 6 with 1 supplement
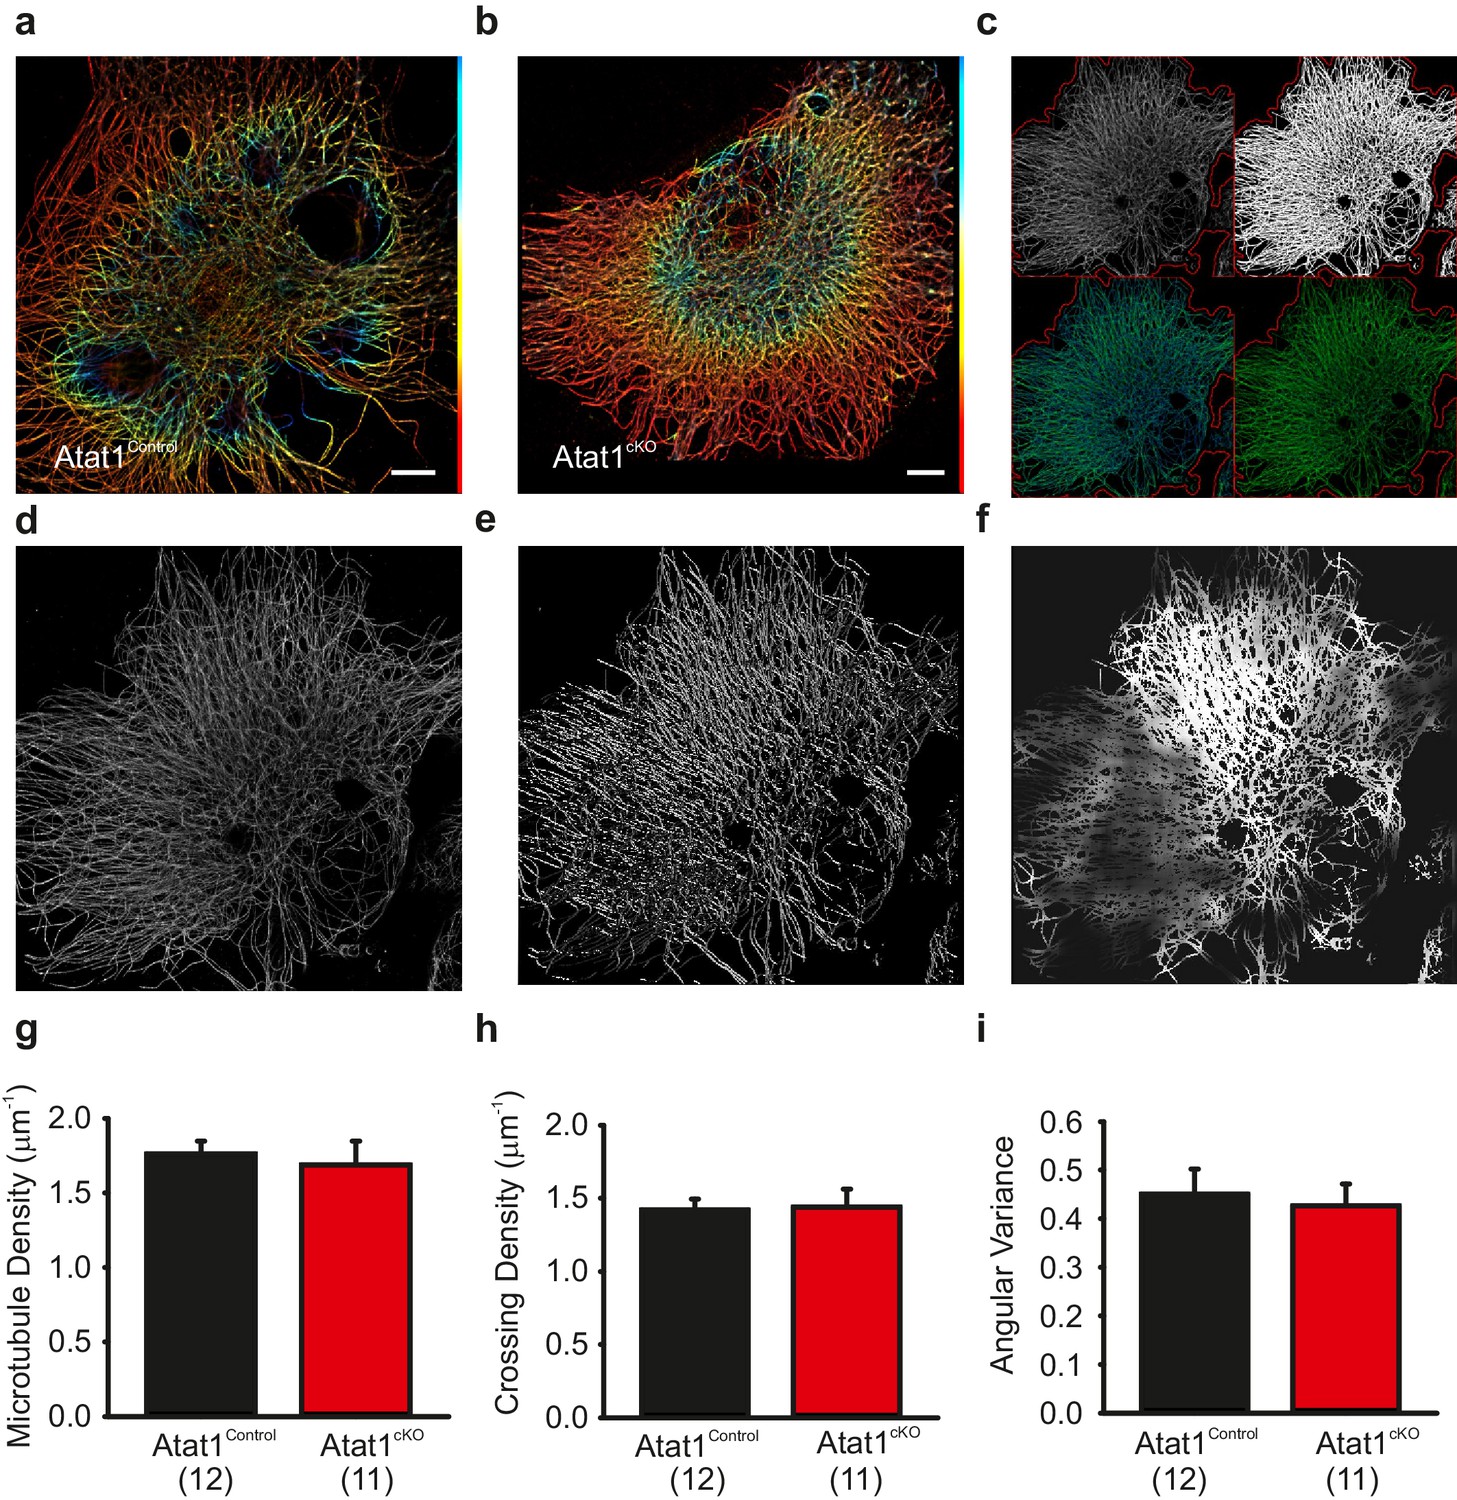
Superresolution imaging of microtubules in DRG from Atat1Control and Atat1cKO mice.
(a and b) Superresolution image of anti α-tubulin staining of Atat1Control (a) and Atat1cKO (b) DRG colour coded by depth (red close to objective, Scale bar 5 μm). (c) Graphical representation of automated analyses performed on superresolution images. The top left image shows the original image in grey and the automated selection of the imaged cell area as a red outline. The top right image shows the microtubule image after binarization. The bottom left image shows the detected microtubule skeleton (in blue) overlaid on the microtubule superresolution image (in green); the microtubule skeleton was used to measure network length. The bottom right image is an estimation of the number of branch points present in the microtubule network, with microtubules in green and the branch points marked in blue. (d–f) Graphical representation of the automated analysis of the microtubule network angular variance. (d) Shows the microtubule superresolution image, (e) the automatically determined orientation of the microtubules, (f) the local angular variance of the microtubule orientation, where bright pixels denote a high variance and vice versa. (g) Graph summarizing the microtubule density in DRG taken from Atat1Control and Atat1cKO mice. (h) Graph showing the density of microtubule crossings present in the microtubule networks in the two genotypes. (i) Graph summarizing the angular variance of the microtubule cytoskeleton in both Atat1Control and Atat1cKO cultured DRG.. No significant difference in any parameter was observed between the genotypes (t-Test, p>0.05).Error bars indicate s.e.m.
Figure 6—figure supplement 1
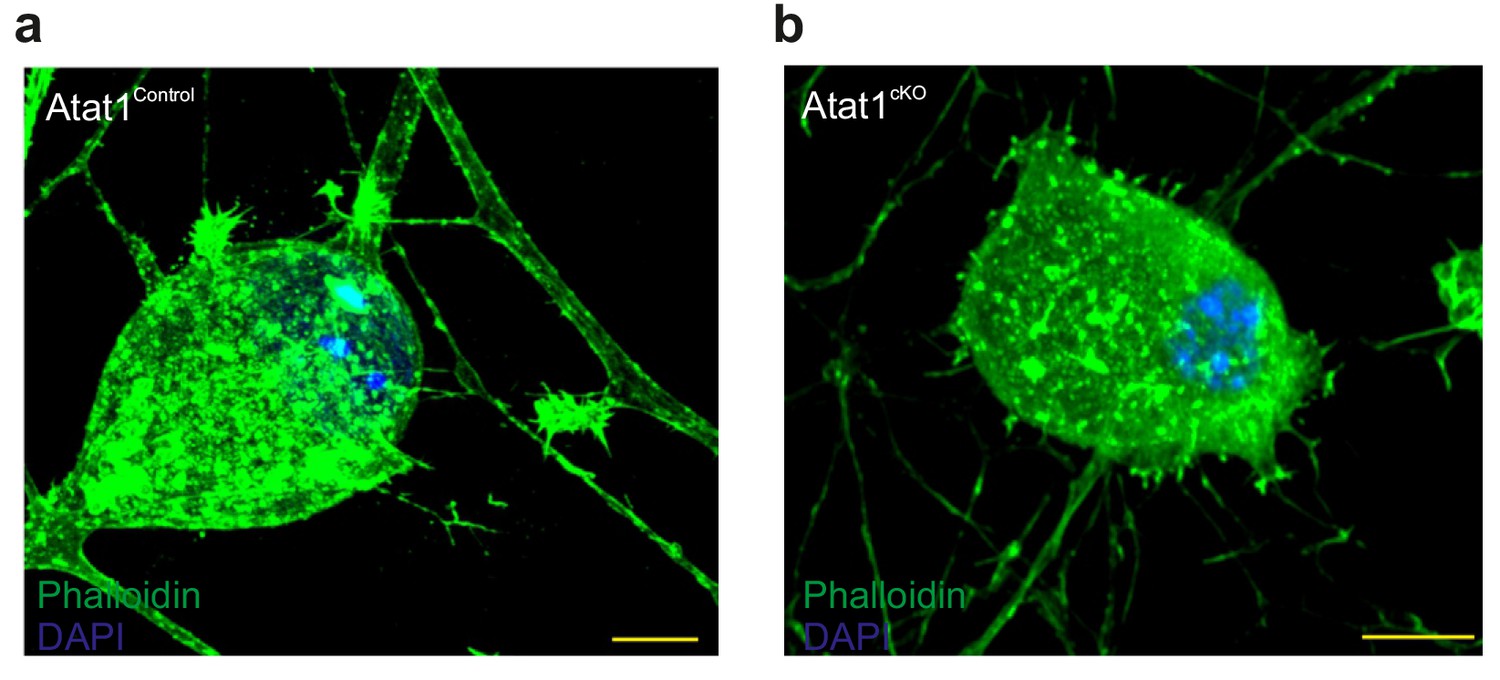
Actin cytoskeletal organization in DRG from Atat1cKO mice.
(a) Fluorescent image of a cultured Atat1Control DRG stained with phalloidin (green) and Hoechst (blue) (Scale bar 10 μm). (b) Fluorescent image of a cultured Atat1cKO DRG stained with phalloidin (green) and Hoechst (blue) (Scale bar 10 μm). Note the similar distribution of actin in both the genotypes.
Figure 7 with 2 supplements
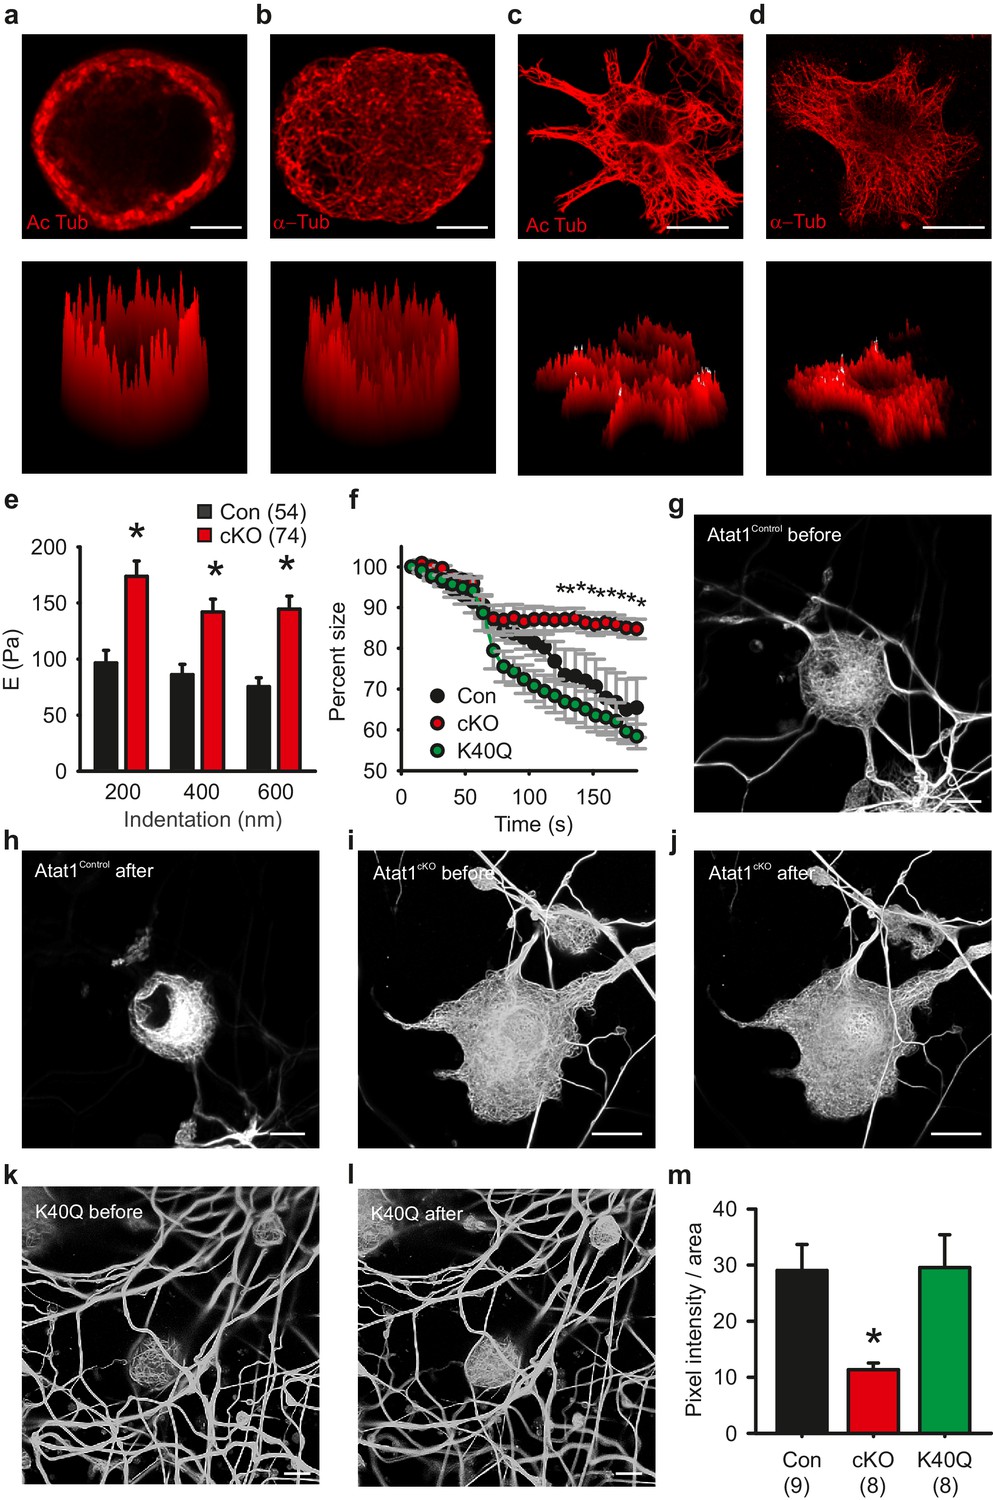
Microtubule organization in peripheral sensory neurons.
(a) Anti-acetylated-α-tubulin staining of Atat1Control cultured DRG cells (corresponding surface plot below). Note the prominent sub-membrane localisation of acetylated tubulin (Scale bar 5 μm). (b) Anti α-tubulin staining of Atat1Control cultured DRG cells (Scale bar 5 μm) (c) Anti-acetylated-α-tubulin staining of serum-starved Atat1Control MEFs (Scale bar 20 μm). Note the even distribution of acetylated tubulin in this cell type. (d) Anti α-tubulin staining of serum-starved Atat1Control MEFs (Scale bar 20 μm). (e) Quantitative comparison of Young’s modulus obtained by fitting force-indentation curves with the Hertz-Sneddon model at different indentations for cultured DRG taken from Atat1Control and Atat1cKO mice. A significantly higher pressure is required to indent the membranes of Atat1cKO neurons over Atat1Control cells (Mann-Whitney test, p<0.01). (f) Graph showing the relative shrinkage of axonal outgrowths from Atat1Control and Atat1cKO DRG loaded with calcein (2 μM) in response to a hyperosmotic shock over time. Deletion of Atat1 leads to a significant decrease in the percentage shrinking of Atat1cKO axons relative to control samples (ANOVA on ranks, multiple comparison Dunn’s Method, p<0.05). (g–l) Live imaging of microtubules labelled with SiR Tubulin two and subjected to hyperosmotic shock (scale bars 10 µm) (g, h) Atat1Control DRG before and after hyperosmotic shock. (I, j) Atat1cKO DRG before and hyperosmotic shock. (k, l) Atat1cKO DRG transfected with the tubulin K40Q amino acid mimic before and hyperosmotic shock. (m) Bar-chart summarising osmotically induced microtubule compression in DRG neurons from Atat1Control, Atat1cKO, and Atat1cKO neurons transfected with tubulin-K40Q. There is significantly less compression in Atat1cKO than Atat1Control neurons, which is rescued by transfection of tubulin-K40Q (ANOVA on ranks, multiple comparison Dunn’s Method, p<0.05). Error bars indicate s.e.m.
Figure 7—figure supplement 1
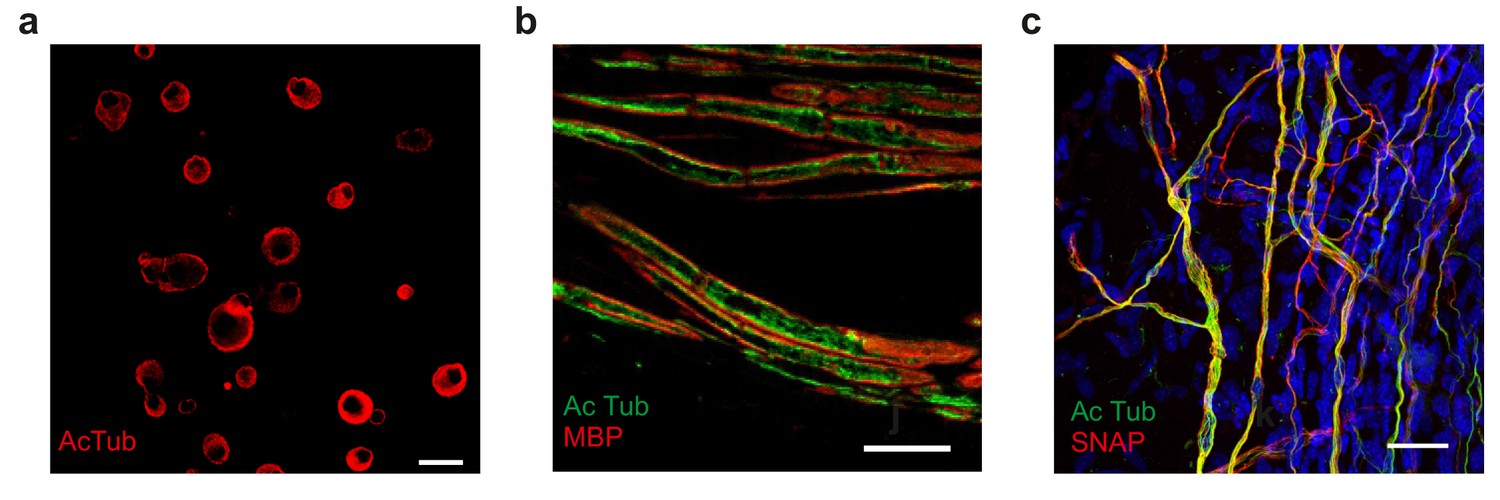
Acetylated microtubule distribution in sensory neurons from Atat1cKO mice.
(a) Low magnification image of anti-acetylated tubulin stained (red) cultured DRG. Note the prominent sub-membrane localization of the stain in many neuronal soma (Scale bar 30 μm). (b) Immunohistochemical staining of nerve fibres within the saphenous nerve taken from Atat1Control mice. Anti-acetylated-α-tubulin staining is in green) and myelin basic protein (MBP) to mark the edge of the axon is in red (Scale bar 10 μm). Note the sub-membrane localisation of the anti-acetylated tubulin signal. (c) Fluorescent image of free nerve endings in a whole mount cornea preparation from a Avil-Cre::SNAPCaaX mouse. Acetylated tubulin (green) and membrane bound SNAP staining is in red (Scale bar 30 μm). Note the strong co-localisation of signals.
Figure 7—figure supplement 2
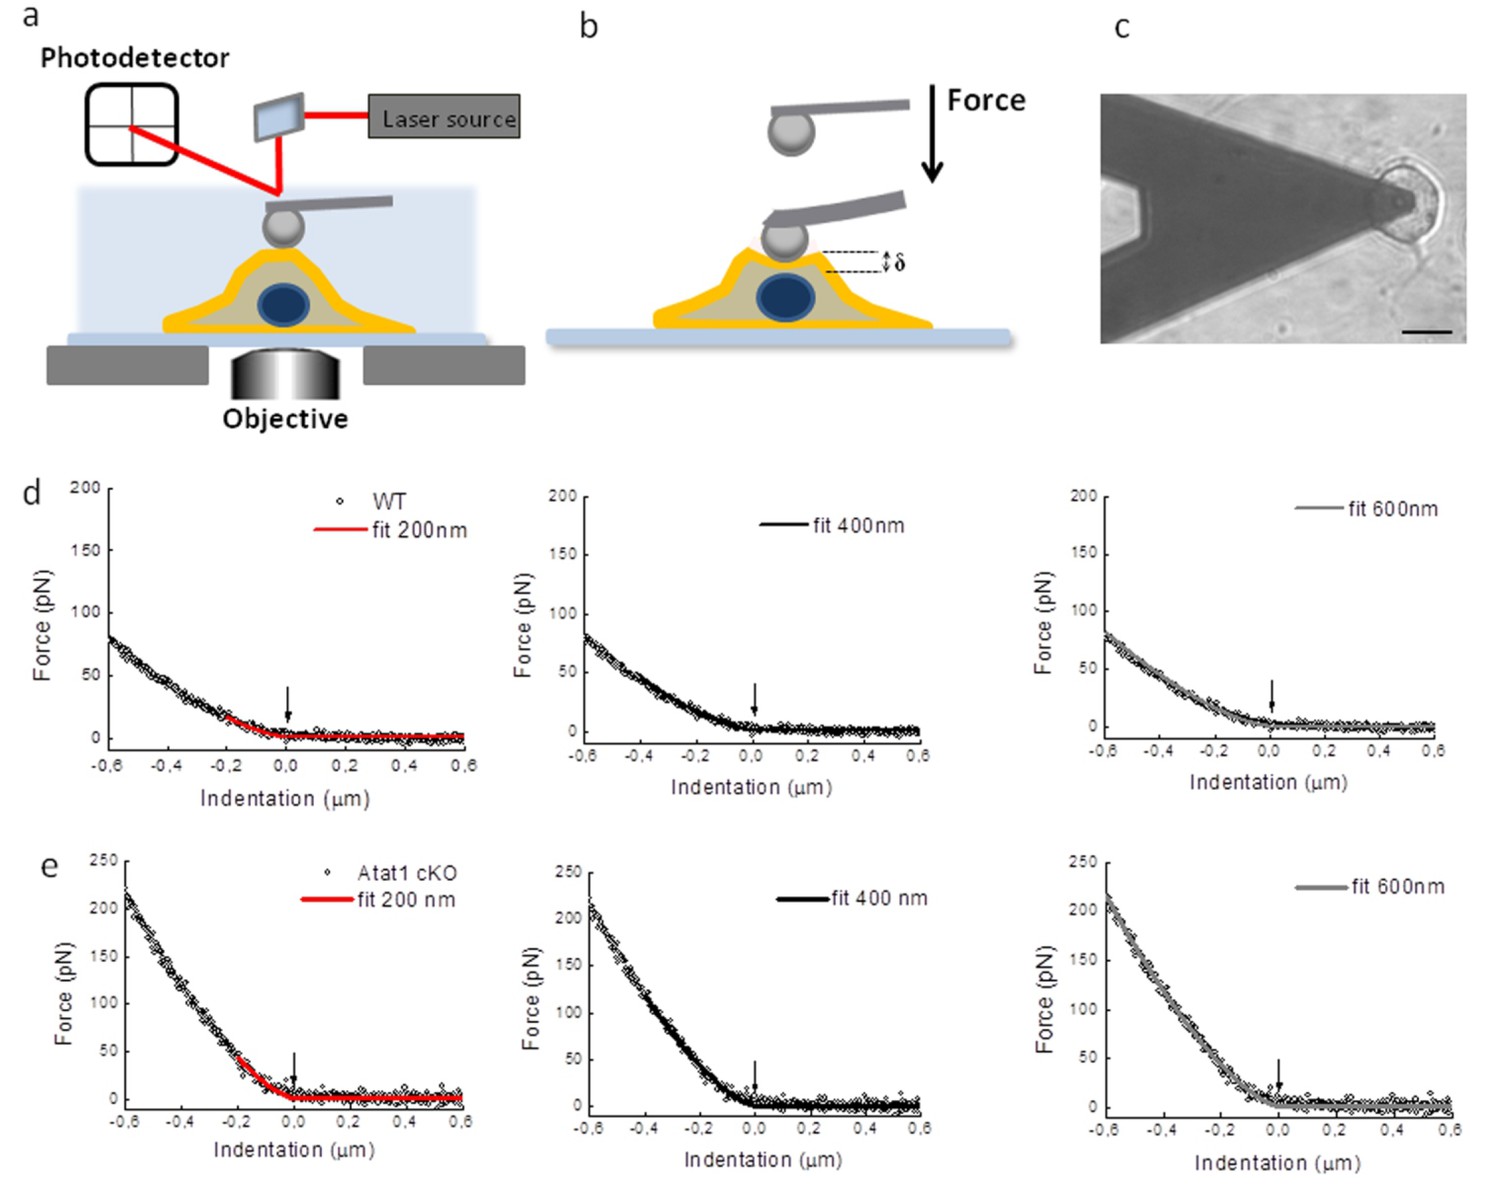
Atomic Force Microscopy of DRG from Atat1cKO mice.
(a) Sketch of AFM set-up used for indentation measurements including a bead 4.5 μm diameter glued at the end of a tipless cantilever. The cantilever is moved by a piezo-system: the bending of the cantilever is measured by a laser beam that is reflected on a photodetector, its electrical signal is linearly proportional with the force applied on the cell. (b) the modified AFM cantilever can be used to precisely apply compressive force apically to cells. (c) Differential interference contrast optical image of the bead-cantilever pushed onto a DRG neuron cultured on glass coverslips coated with a first layer of polylysine and a second layer of laminin (scale bar 20 μm). (d) Examples of force indentation curves obtained for Atat1Control and Atat1cKO DRG and the fitting curve according to the Hertz-Sneddon model for 200 nm (red curve) 400 nm (black curve) and 600 nm (gray curve) indentation. The arrow indicates the contact point as evaluated by the fitting procedure.
Videos
Video 1
Tape test assay.
Video recording of mice showing attempts to remove a piece of tape by Atat1Control (left) and Atat1cKO (right), over a 5 min period.
Video 2
Tail clip assay.
Video of Atat1Control (top) and Atat1cKO (bottom) mice to measure the time taken until the first response of the animals to the clip.
Video 3
Microfluidics.
Movement of NGF labelled quantum dots along the neurites of cultured DRG. Atat1Control (left) and Atat1cKO (right).
Video 4
Acetylated tubulin distribution in cornea.
3D rendering of a whole mount cornea preparation showing membrane bound SNAP labeling in red and acetylated tubulin in green.
Download links
A two-part list of links to download the article, or parts of the article, in various formats.
Downloads (link to download the article as PDF)
Open citations (links to open the citations from this article in various online reference manager services)
Cite this article (links to download the citations from this article in formats compatible with various reference manager tools)
Acetylated tubulin is essential for touch sensation in mice
eLife 5:e20813.
https://doi.org/10.7554/eLife.20813


