Functional evolution of a morphogenetic gradient
- University of Chicago, United States
Figures
Figure 1
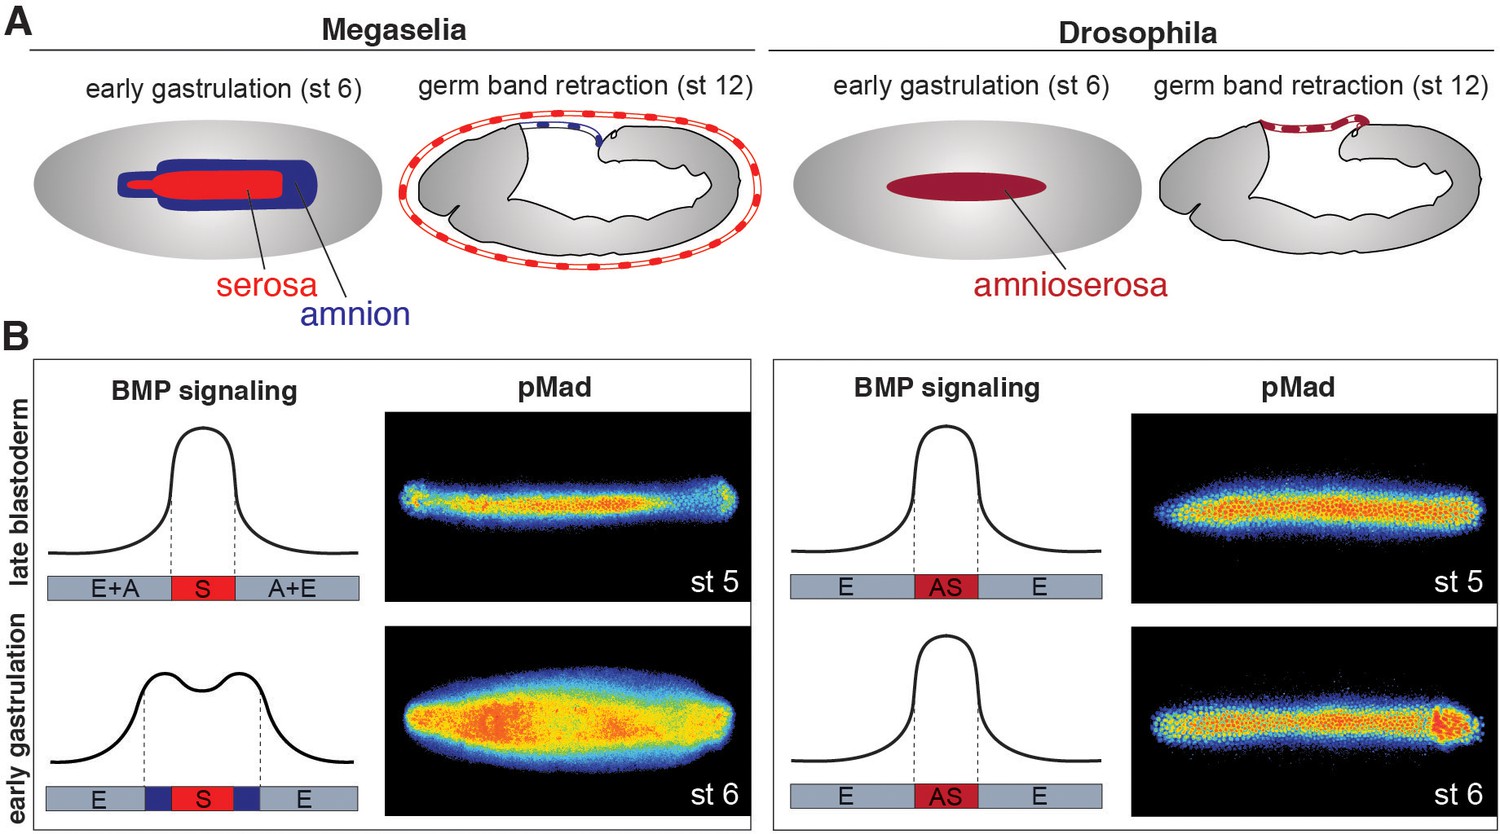
Extraembryonic tissue and BMP signaling differ between Megaselia and Drosophila.
(A) Schematics of Megaselia embryos with serosa and amnion and of Drosophila embryos with amnioserosa at the beginning of gastrulation (stage 6, left) and during early germ band retraction (stage 12, right), modified from Rafiqi et al. (2012). Here, as in all subsequent figures, blastoderm and gastrula stages are shown in dorsal view while later stages are shown in lateral view with the dorsal side up unless specified otherwise. Anterior is always left. (B) Schematic pMad intensity profiles at the dorsal midline relative to prospective serosa (S, red), amnion (A, blue), amnioserosa (AS, maroon), and embryonic tissues (E, grey) in Megaselia and Drosophila. Representative embryos stained for pMad on right.
Figure 2 with 4 supplements
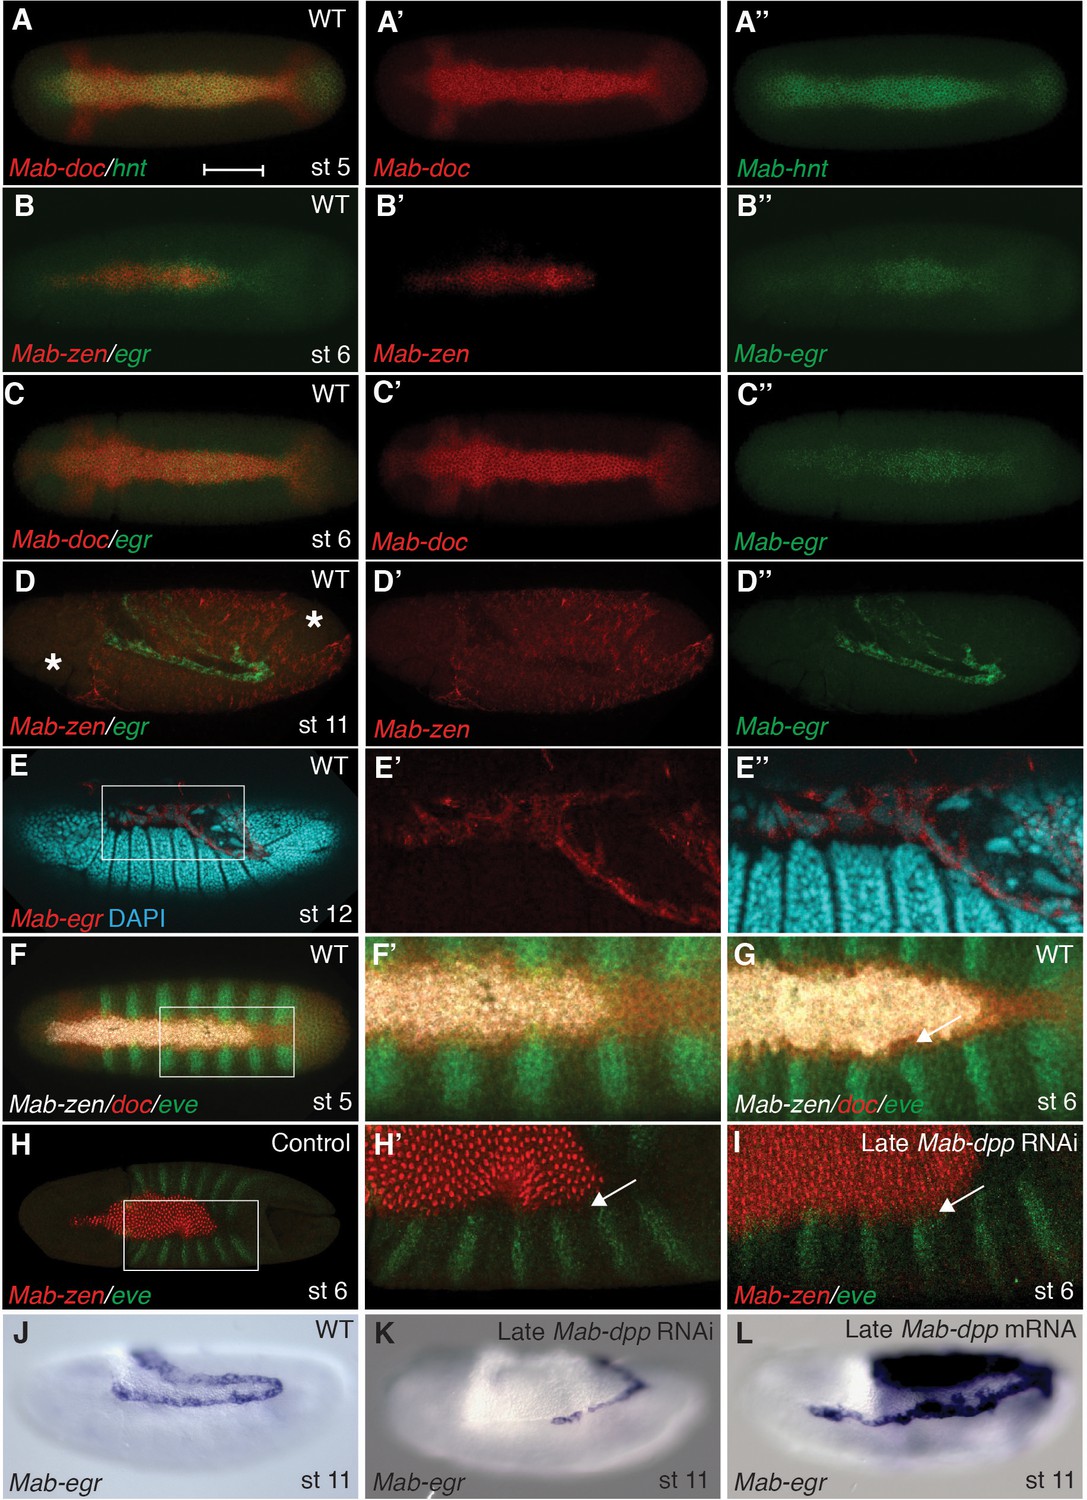
Specification of amnion by BMP signaling in Megaselia.
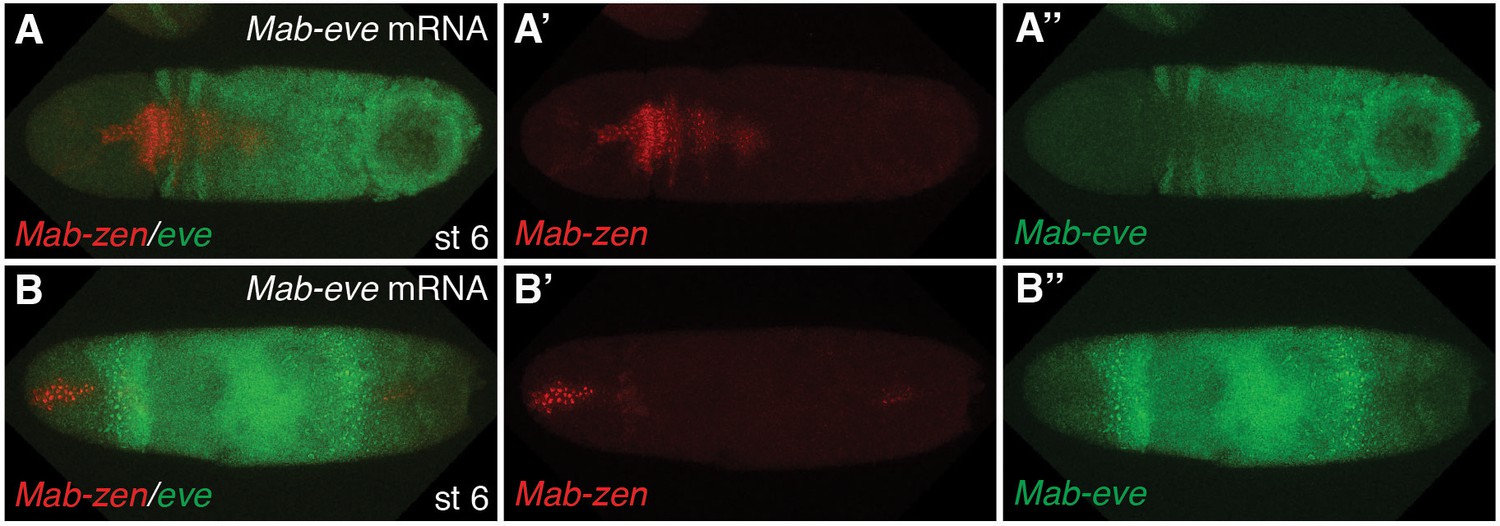
(A) Mab-hnt and Mab-doc expression at the late blastoderm stage. Scale bar = 100 µm. (B, C) Mab-egr and Mab-zen (B) and Mab-egr and Mab-doc (C) expression at early gastrulation. (D) Mab-egr and Mab-zen expression after germ band extension. Asterisks denote tears in the serosa during sample preparation. (E) Mab-egr expression during germ band retraction. The serosa has been removed and nuclei have been labeled with DAPI. Boxed region enlarged (E’–E’’). (F, G) Mab-doc, Mab-zen and Mab-eve expression at late blastoderm stage (stage 5) (F, enlargement F’) and early gastrulation (stage 6) (G) with arrow pointing to abutting Mab-eve and Mab-doc expression domains. (H, I) Mab-zen and Mab-eve expression in early gastrula control embryo (H, enlargement H’) and following Mab-dpp knockdown after 50% blastoderm cellularization (I). Arrows, gap between the Mab-eve and Mab-zen domains (H’) that is suppressed in the knockdown embryo (I). (J–L) Mab-egr expression at germ band extension in wild-type embryo (J), and after Mab-dpp knockdown (K) or Mab-dpp overexpression (L) after 50% blastoderm cellularization.
Figure 2—figure supplement 1
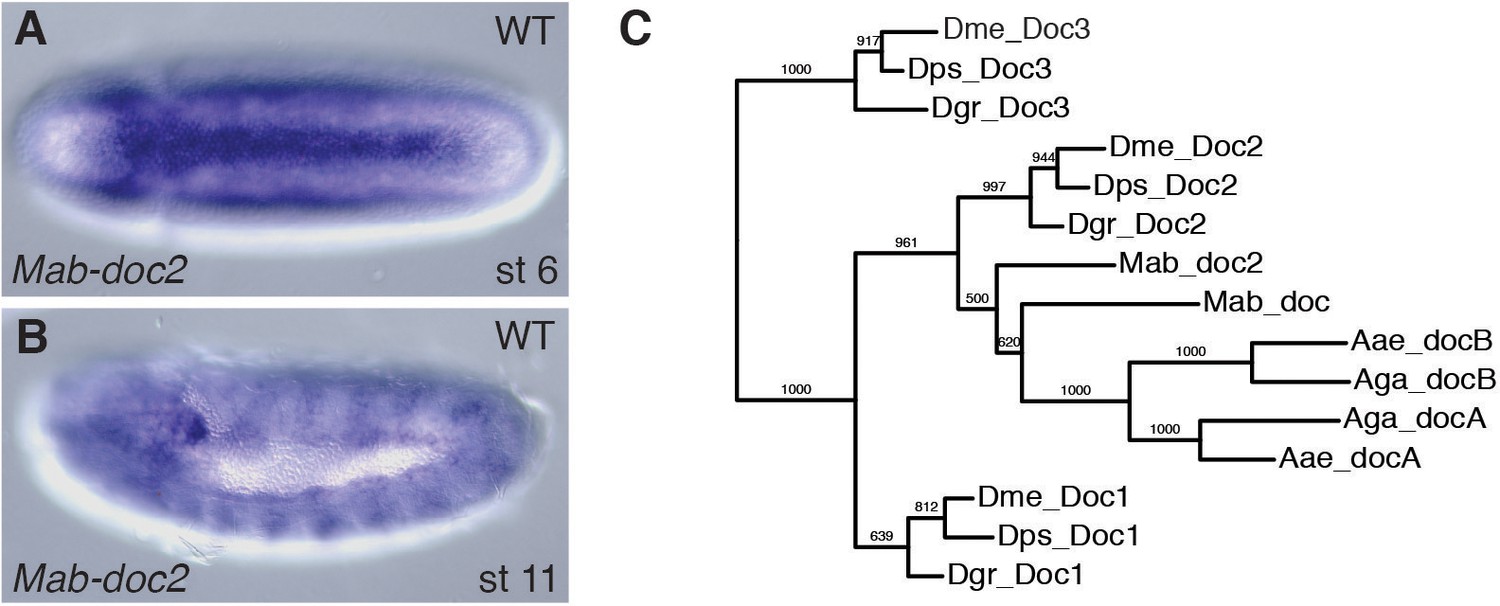
Expression of Mab-doc2.
(A, B) Mab-doc2 expression at early gastrulation (A) and the extended germ band stage (B). (C) Maximum likelihood gene tree based on full-length Doc protein homologues. Aae (Aedes aegypti), Aga (Anopheles gambiae), Mab (Megaselia abdita), Dme (Drosophila melanogaster), Dps (Drosophila pseudoobscura), Dgr (Drosophila grimshawi). Bootstrap values, based on 1000 replicas, are shown. (A) Dorsal views with anterior left. (B) Lateral views with dorsal up and anterior left.
Figure 2—figure supplement 2
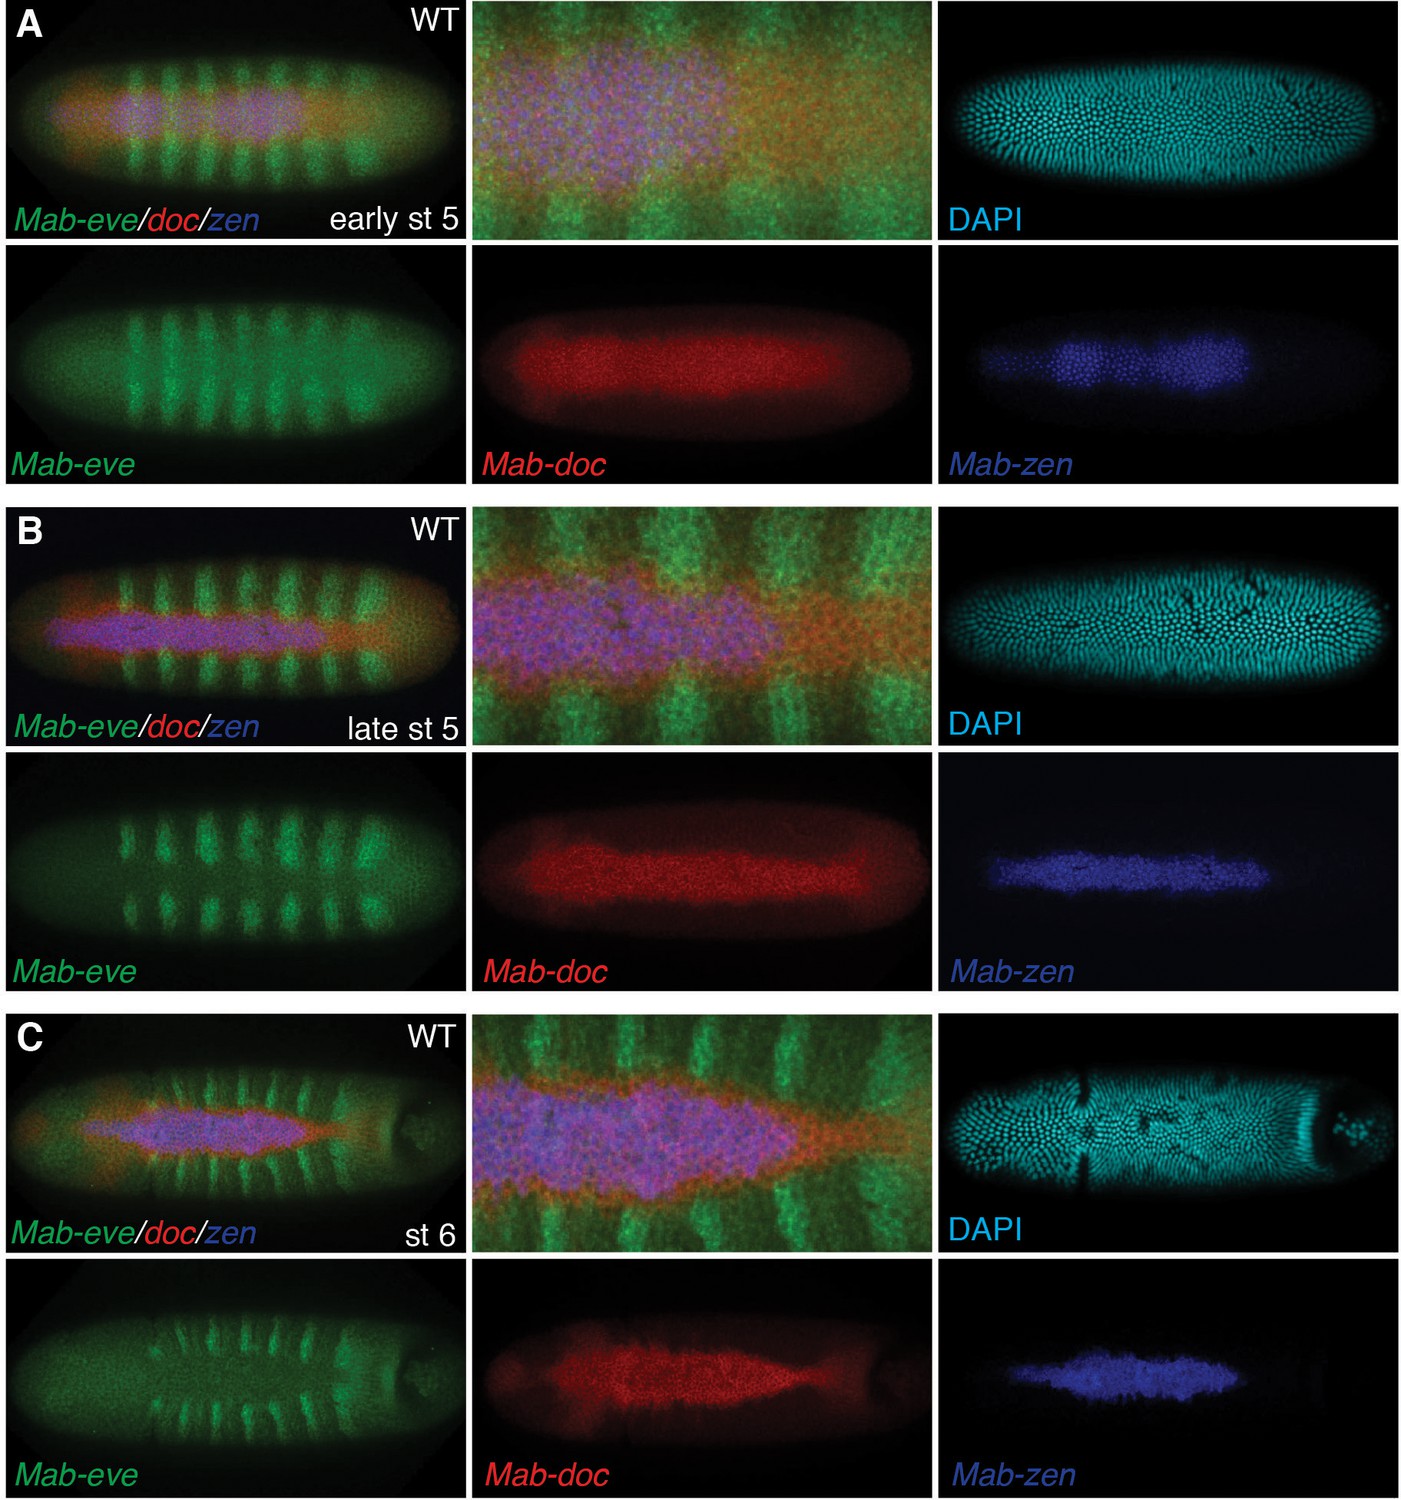
Time course of Mab-zen, Mab-doc and Mab-eve expression.
(A–C) Mab-zen, Mab-doc and Mab-eve expression in Megaselia embryos with the second panel showing enlarged view near the posterior Mab-eve strips, followed by single channel images of DAPI, Mab-eve, Mab-doc, and Mab-zen in successive panels at early blastoderm (A), late blastoderm (B) and early gastrulation (C) stages, indicating amnion specification occurs at early gastrulation. Dorsal views with anterior left.
Figure 2—figure supplement 3
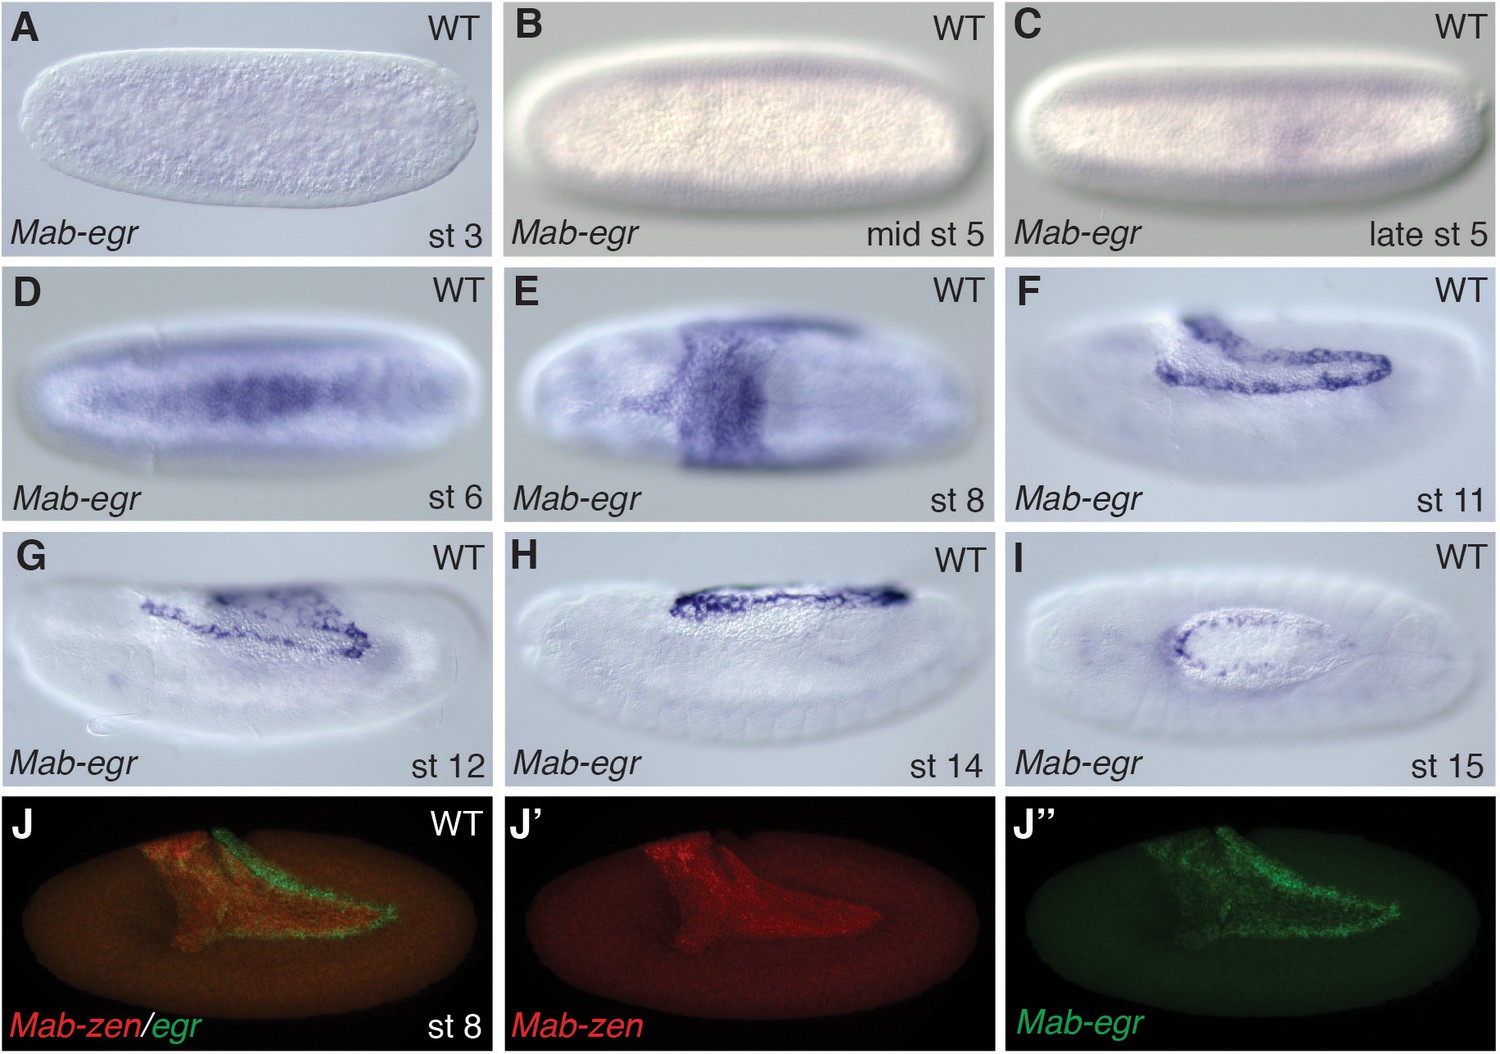
.Expression of Mab-egr.
(A–I) Mab-egr expression in Megaselia embryos before blastoderm formation (A), during blastoderm cellularization (B), and at cellular blastoderm (C), early gastrulation (D), early and late germ band extension (E, F), germ band retraction (G) and dorsal closure stages (H, I). (J) Mab-egr and Mab-zen expression in embryos during germ band extension. (A–E, I) Dorsal views with anterior left. (F–H, J) Lateral views with dorsal up and anterior left.
Figure 2—figure supplement 4
Overexpression of Mab-eve represses Mab-zen expression.
(A, B) Two examples of Mab-zen and Mab-eve expression at early gastrulation after Mab-eve overexpression. Dorsal views with anterior left.
Figure 3 with 1 supplement

Mab-doc and Mab-hnt elevate BMP signaling to specify amnion in Megaselia.
(A–C) Mab-zen and Mab-eve expression in early gastrula control embryo (A) and after Mab-doc/doc2 knockdown (B) or Mab-hnt knockdown (C). Arrows, gap between the Mab-eve and Mab-zen domains (A) that is suppressed in the knockdown embryos (B, C). (D–F) Bar chart (D) quantifying the reduction of Mab-egr expression at stage 11/12 after Mab-hnt and/or Mab-doc/doc2 knockdown, and representative embryos of moderately reduced (yellow, E), or severely reduced (red, F) phenotypes. (G–I) Mab-egr expression at germ band extension following Mab-doc overexpression (G), Mab-doc overexpression and Mab-dpp knockdown (H), and Mab-dpp overexpression and Mab-doc/doc2 knockdown (I). (J–L) Mean and shaded standard deviation of pMad intensities in control injected embryos (blue) and in Mab-doc/doc2 knockdown embryos (red) at the cellular blastoderm stage (n = 10, control n = 10) (J), at early gastrulation (n = 11, control n = 11) (K), and in Mab-zen knockdown embryos (red) at early gastrulation (n = 10, control n = 17) (L) with representative embryos stained for pMad underneath each plot.
Figure 3—figure supplement 1
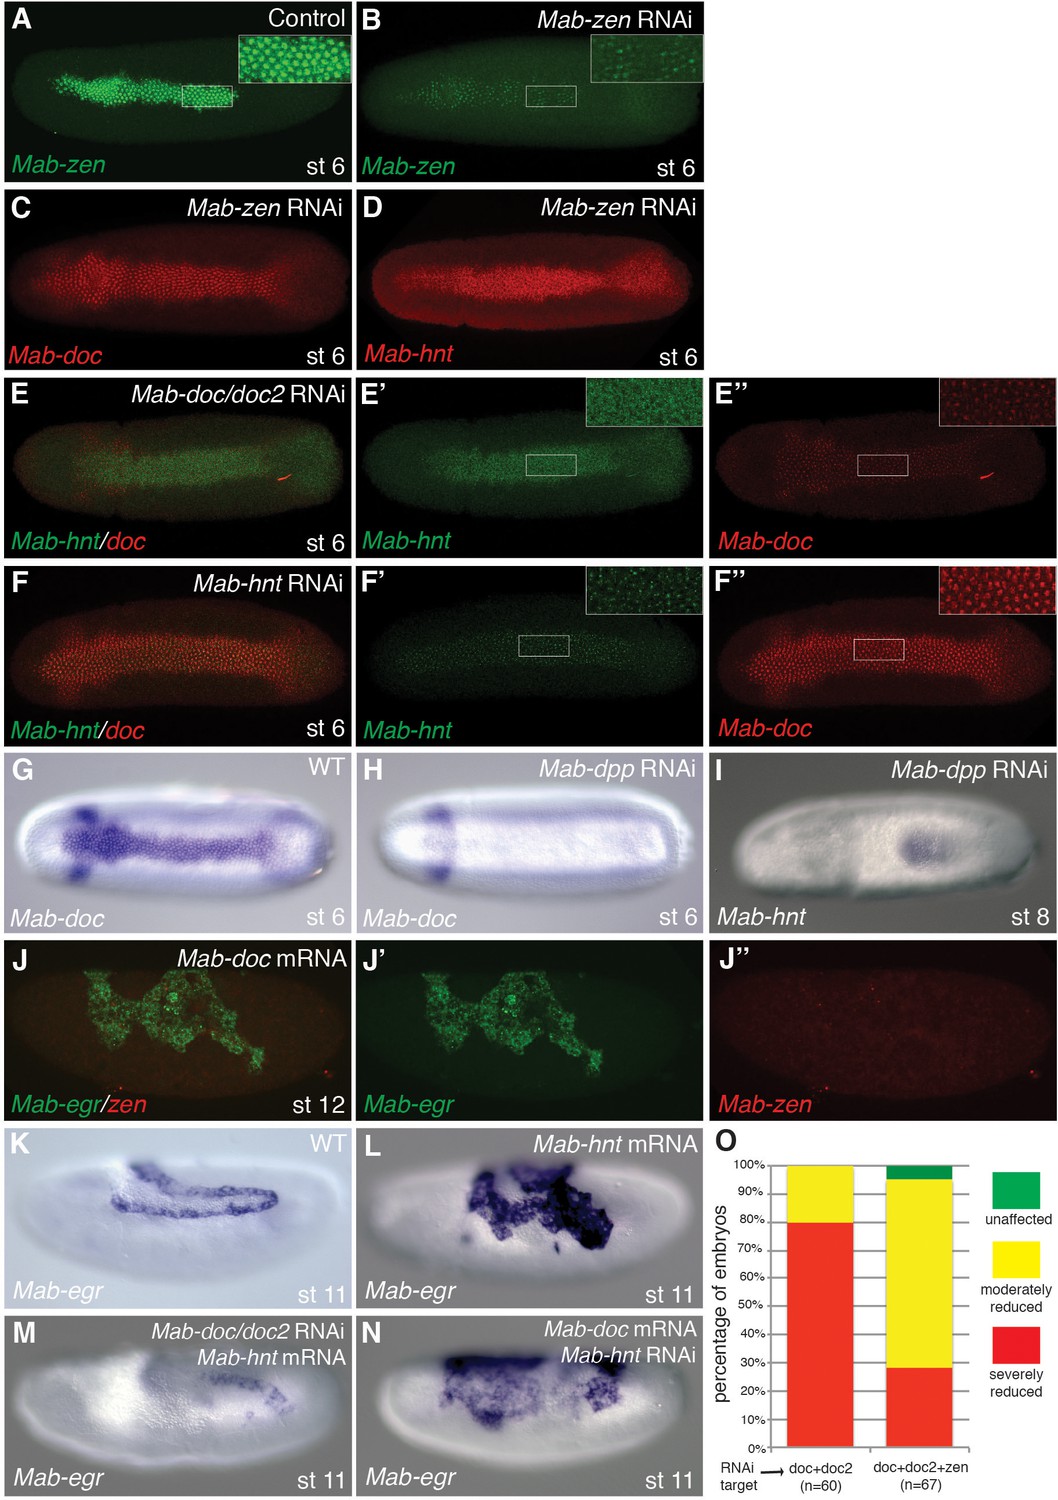
Function and regulation of Mab-doc and Mab-hnt.
(A–D) Mab-zen expression in control embryo (A), and Mab-zen (B), Mab-doc (C) and Mab-hnt (D) expression at early gastrulation following Mab-zen knockdown. (E, F) Mab-hnt and Mab-doc expression at early gastrulation following Mab-doc/doc2 knockdown (E) or Mab-hnt knockdown (F). (G, H) Mab-doc expression at early gastrulation in wild type (G) and after Mab-dpp knockdown (H). (I) Mab-hnt expression at early gastrulation following Mab-dpp knockdown (image from M. Rafiqi). (J) Mab-egr and Mab-zen expression at stage 11/12 following Mab-doc overexpression. (K–N) Mab-egr expression at stage 11/12 in wild type (K), following Mab-hnt overexpression (L), following Mab-hnt overexpression and Mab-doc/doc2 knockdown (M) or Mab-doc overexpression and Mab-hnt knockdown (N). (O) Bar chart showing the percentages of embryos with normal (green), moderately (yellow) or severely reduced (red) Mab-egr expression at stage 11/12 following Mab-doc/doc2 knockdown or Mab-doc/doc2/zen knockdown. (A–I) Dorsal views with anterior left. (J–N) Lateral views with dorsal up and anterior left.
Figure 4 with 5 supplements

Mab-egr is downstream of Mab-doc and promotes BMP signaling.
(A, B) pMad staining following Mab-doc overexpression (A) or Mab-doc overexpression and Mab-egr knockdown (B). The asterisk marks site of endogenous pMad depletion. (C) Mean intensity and standard deviation of pMad staining in control injected embryos (blue, n = 10) and Mab-egr knockdown embryos (red, n = 9) at early gastrulation with representative embryos stained for pMad underneath the plot. (D) Mab-zen and Mab-eve expression at early gastrulation after Mab-egr knockdown with arrow indicating suppressed gap between the Mab-eve and Mab-zen domains. (E–H) Mab-egr expression in wild type (E), Mab-dpp knockdown (F), Mab-doc/doc2 knockdown (G), and Mab-zen knockdown (H) embryos at early gastrulation. (I) Mab-egr expression in a Mab-zen knockdown embryo after germ band extension. (J) BMP gene regulatory networks in Megaselia abdita and Drosophila melanogaster.
Figure 4—figure supplement 1
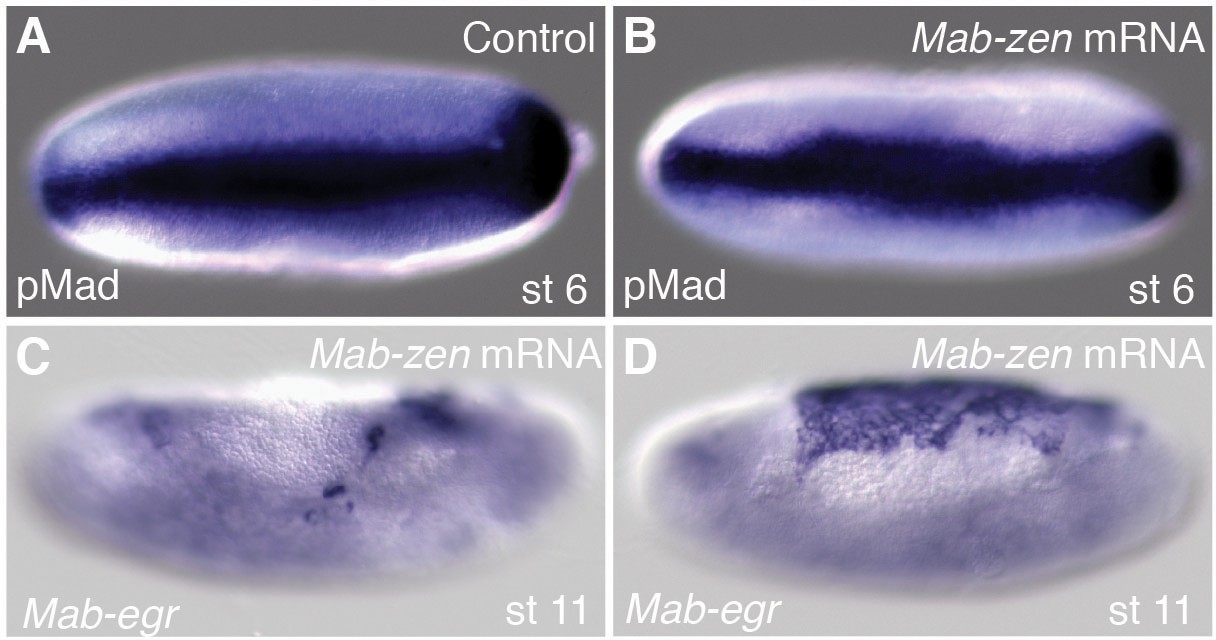
Effect of Mab-zen overexpression on BMP signaling.
(A, B) pMad staining at early gastrulation in control (A) and after Mab-zen overexpression (B). (C, D) Mab-egr expression at late germband extension after Mab-zen overexpression. The majority of embryos showed reduced Mab-egr expression (37/51) (C) while a minority of embryos showed either expanded Mab-egr expression (7/51) (D), possibly as a consequence of premature serosa-amnion disruption, or were indistinguishable from wild type (7/51) (not shown). (A, B) Dorsal views with anterior left. (C, D) Lateral views with dorsal up and anterior left.
Figure 4—figure supplement 2
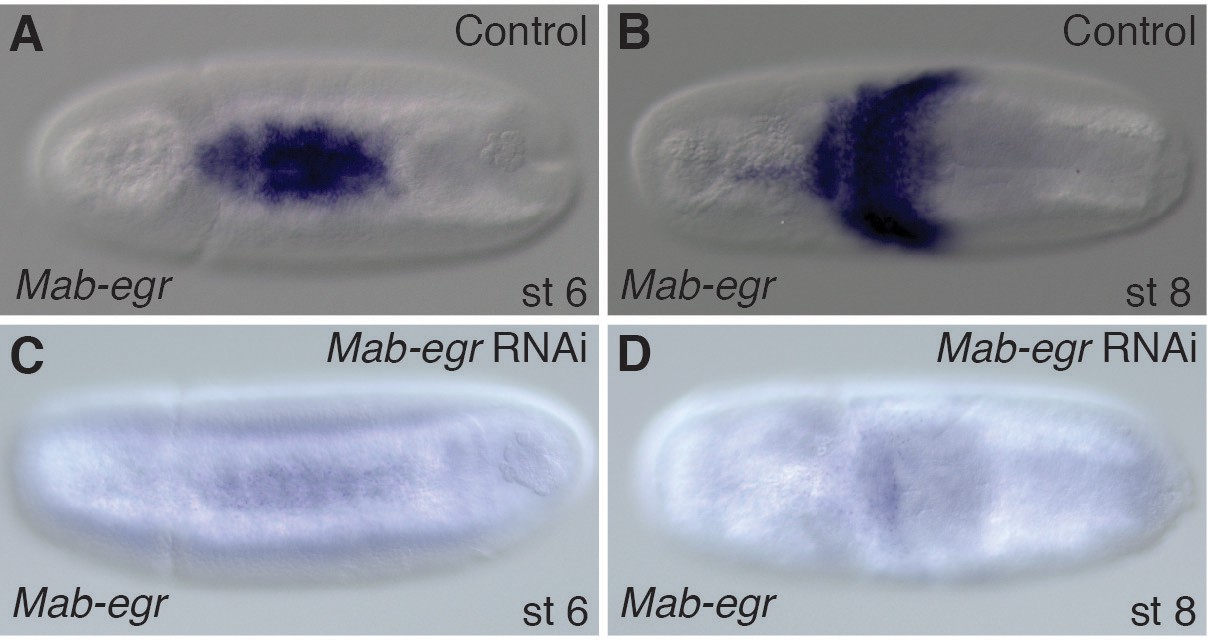
Efficiency of Mab-egr RNAi.
(A–D) Mab-egr expression in control (A, B) and Mab-egr knockdown embryos (C, D) at early gastrulation (A, C) and during germ band extension (B, D). Dorsal views with anterior left.
Figure 4—figure supplement 3
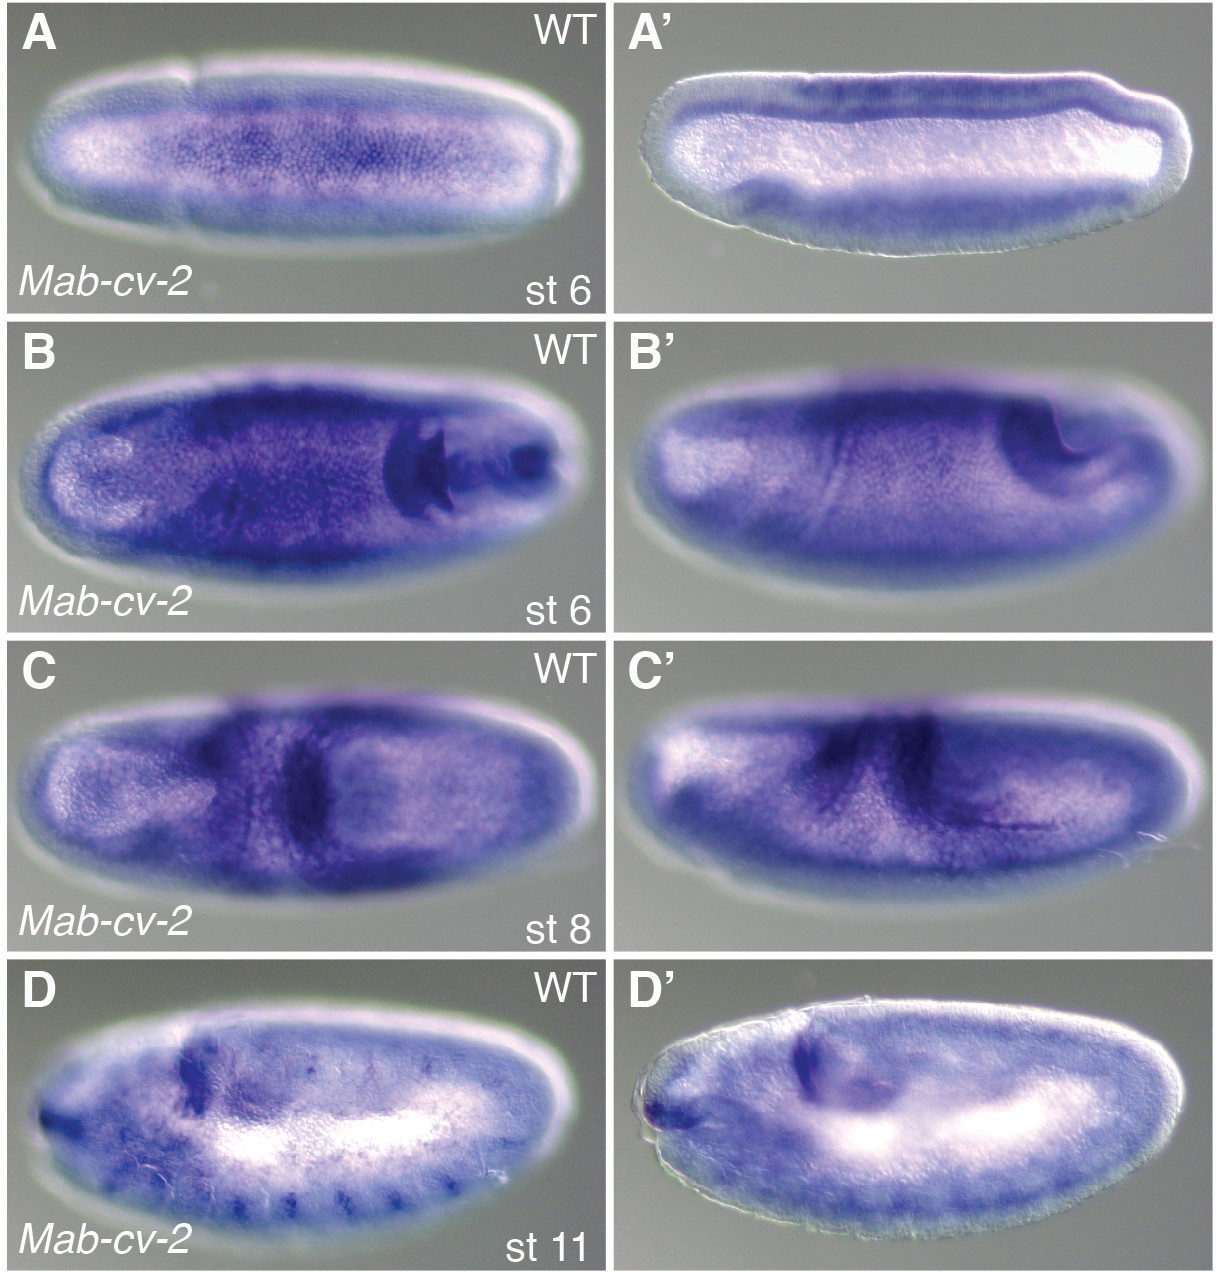
Expression profile of Mab-cv-2.
(A–D) Mab-cv-2 expression in Megaselia embryos at early gastrulation (A), late gastrulation (B), during germ band retraction (C), and at the end of germ band retraction (D). (A, B, C) Dorsal views with anterior left. (A’, B’, C’, D, D’) Lateral views with dorsal up and anterior left.
Figure 4—figure supplement 4
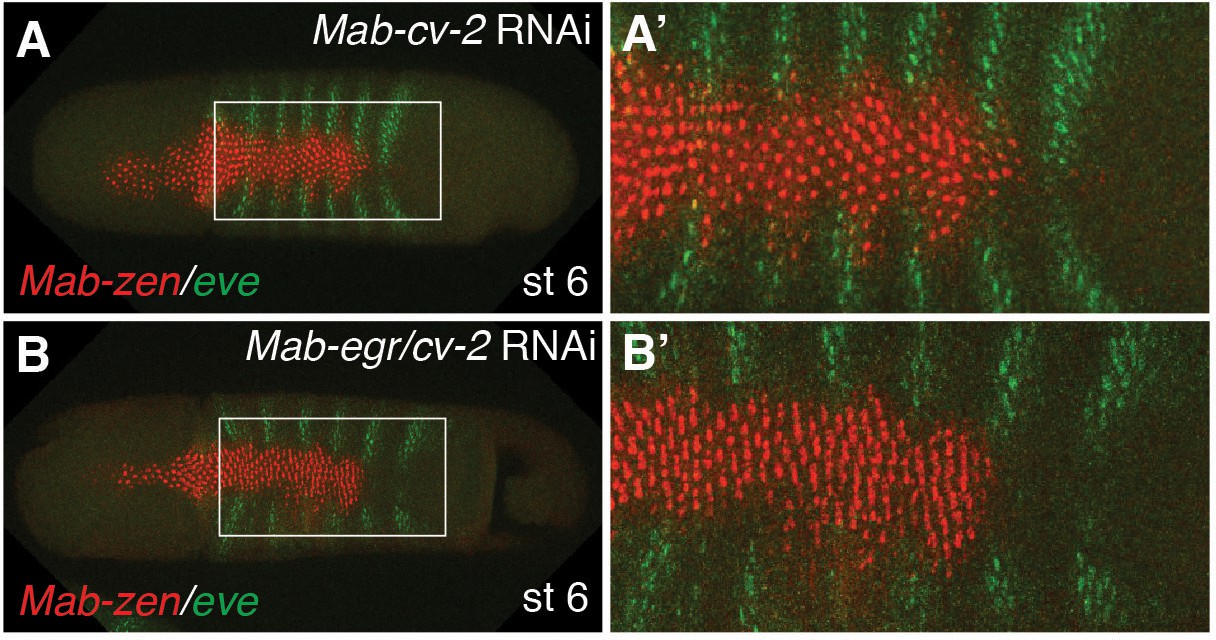
Mab-cv-2 promotes amnion specification.
(A, B) Mab-zen and Mab-eve expression at early gastrulation with some embryos showing reduced amnion after Mab-cv-2 knockdown (3/9) (A), and after Mab-egr/cv-2 knockdown (2/9) (B). Dorsal views with anterior left.
Figure 4—figure supplement 5

Regulation of Mab-cv-2 is largely independent of Mab-doc/doc2.
(A, B) Mab-cv-2 expression at early gastrulation in control (A) and after Mab-doc/doc2 knockdown (B). Dorsal views with anterior left.
Download links
A two-part list of links to download the article, or parts of the article, in various formats.
Downloads (link to download the article as PDF)
Open citations (links to open the citations from this article in various online reference manager services)
Cite this article (links to download the citations from this article in formats compatible with various reference manager tools)
Functional evolution of a morphogenetic gradient
eLife 5:e20894.
https://doi.org/10.7554/eLife.20894


