Rules and mechanisms for efficient two-stage learning in neural circuits
- CUNY Graduate Center, United States
- David Rittenhouse Laboratories, University of Pennsylvania, United States
- Harvard University, United States
- Vrije Universiteit Brussel & International Solvay Institutes, Belgium
Figures
Figure 1
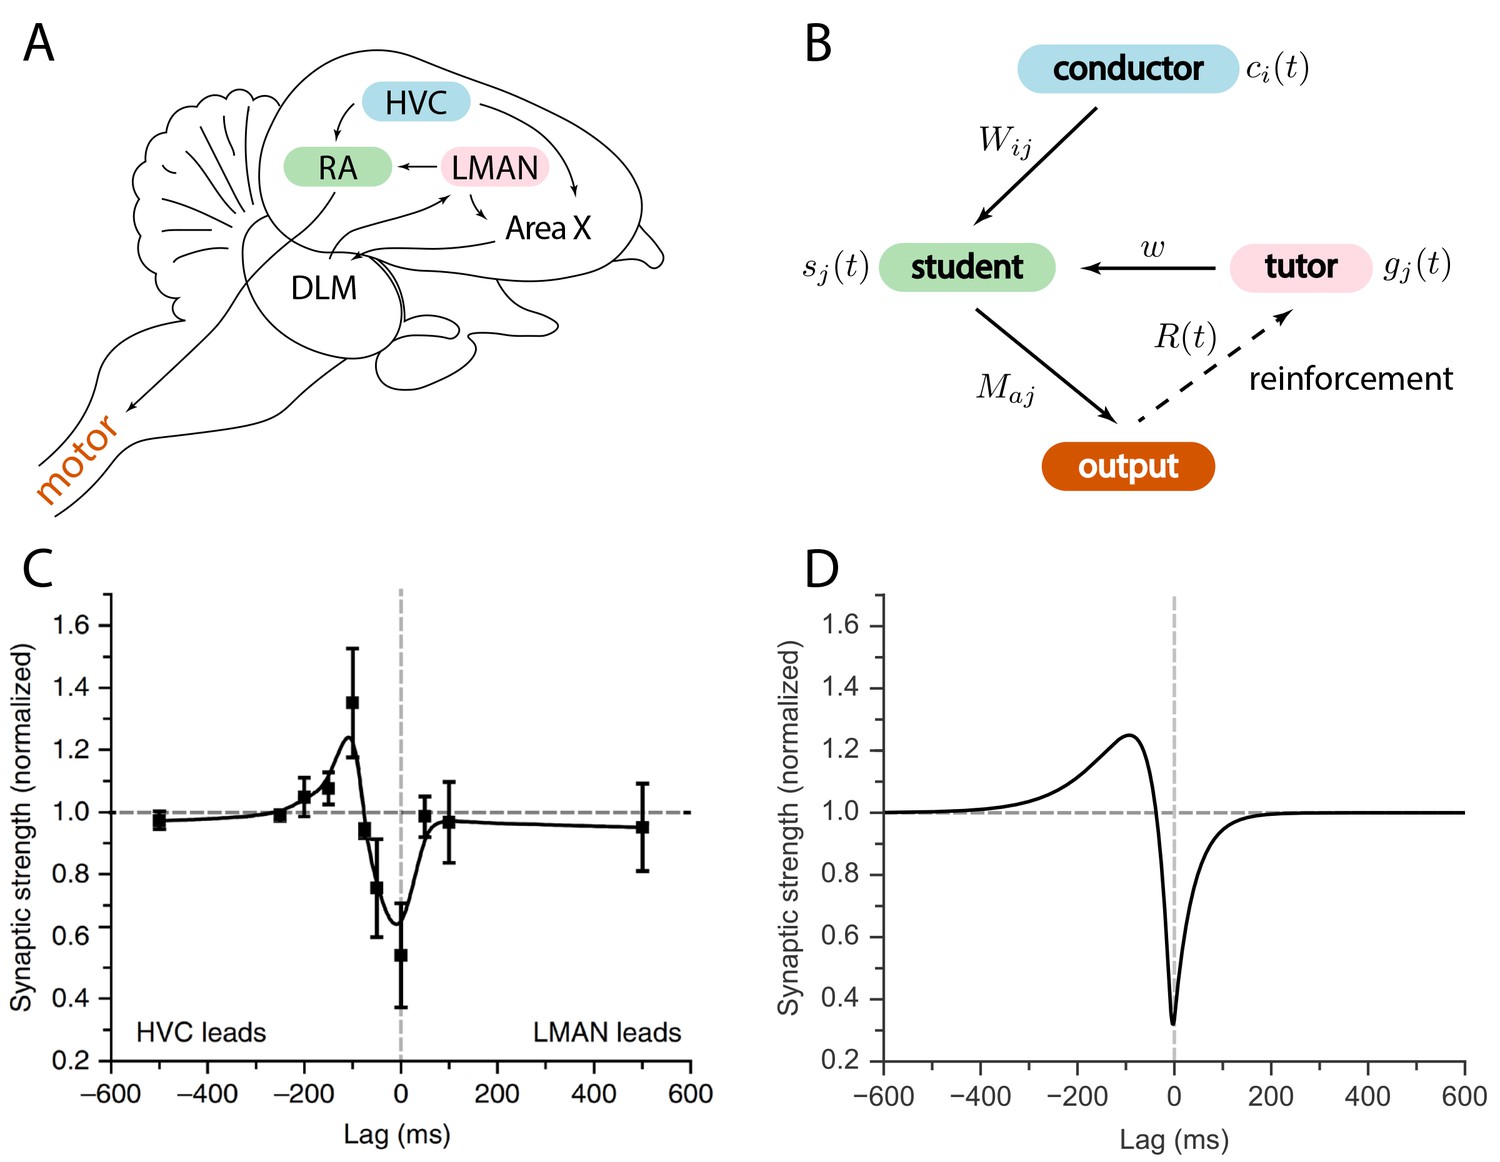
Relation between the song system in zebra finches and our model.
(A) Diagram of the major brain regions involved in birdsong. (B) Conceptual model inspired by the birdsong system. The line from output to tutor is dashed because the reinforcement signal can reach the tutor either directly or, as in songbirds, indirectly. (C) Plasticity rule measured in bird RA (measurement done in slice). When an HVC burst leads an LMAN burst by about , the HVC–RA synapse is strengthened, while coincident firing leads to suppression. Figure adapted from Mehaffey and Doupe (2015). (D) Plasticity rule in our model that mimics the Mehaffey and Doupe (2015) rule.
Figure 2

Schematic representation of our rate-based model.
(A) Conductor neurons fire precisely-timed bursts, similar to HVC neurons in songbirds. Conductor and tutor activities, and , provide excitation to student neurons, which integrate these inputs and respond linearly, with activity . Student neurons also receive a constant inhibitory input, . The output neurons linearly combine the activities from groups of student neurons using weights . The linearity assumptions were made for mathematical convenience but are not essential for our qualitative results (see Appendix). (B). The conductor–student synaptic weights are updated based on a plasticity rule that depends on two parameters, and , and two timescales, and (see Equation (1) and Materials and methods). The tutor signal enters this rule as a deviation from a constant threshold . The figure shows how synaptic weights change () for a student neuron that receives a tutor burst and a conductor burst separated by a short lag. Two different choices of plasticity parameters are illustrated in the case when the threshold . (C) The amount of mismatch between the system’s output and the target output is quantified using a loss (error) function. The figure sketches the loss landscape obtained by varying the synaptic weights and calculating the loss function in each case (only two of the weight axes are shown). The blue dot shows the lowest value of the loss function, corresponding to the best match between the motor output and the target, while the orange dot shows the starting point. The dashed line shows how learning would proceed in a gradient descent approach, where the weights change in the direction of steepest descent in the loss landscape.
Figure 3
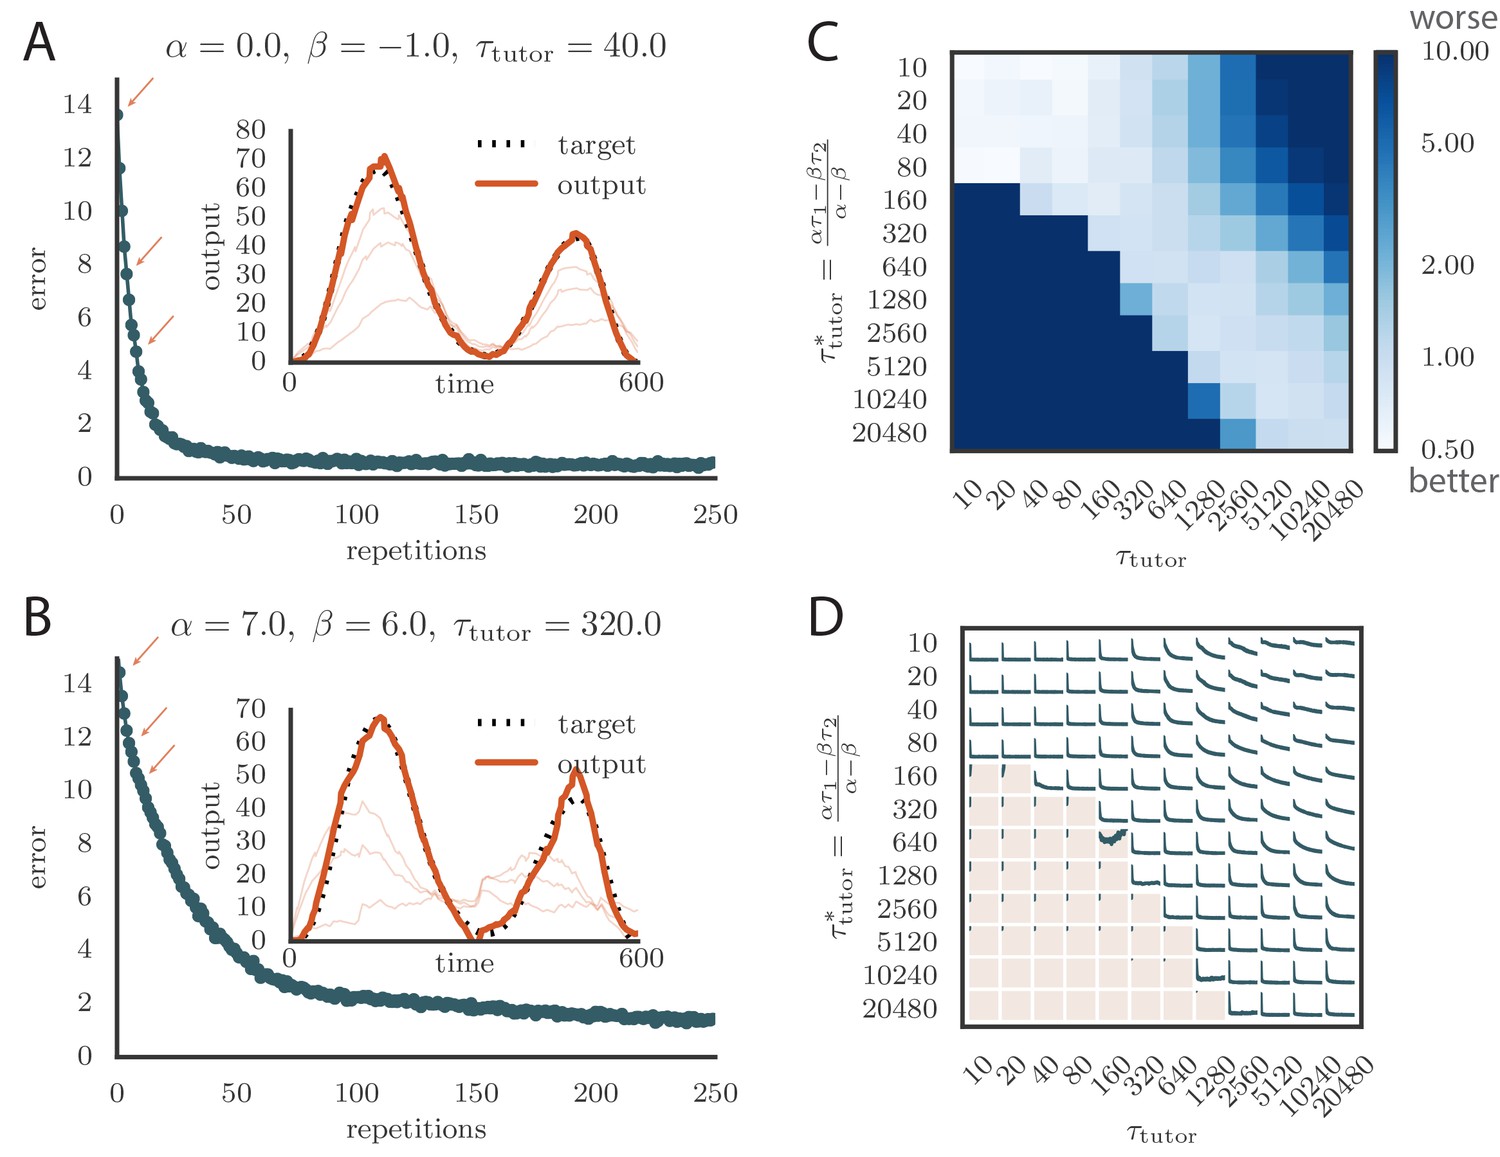
Learning with matched or mismatched tutors in rate-based simulations.
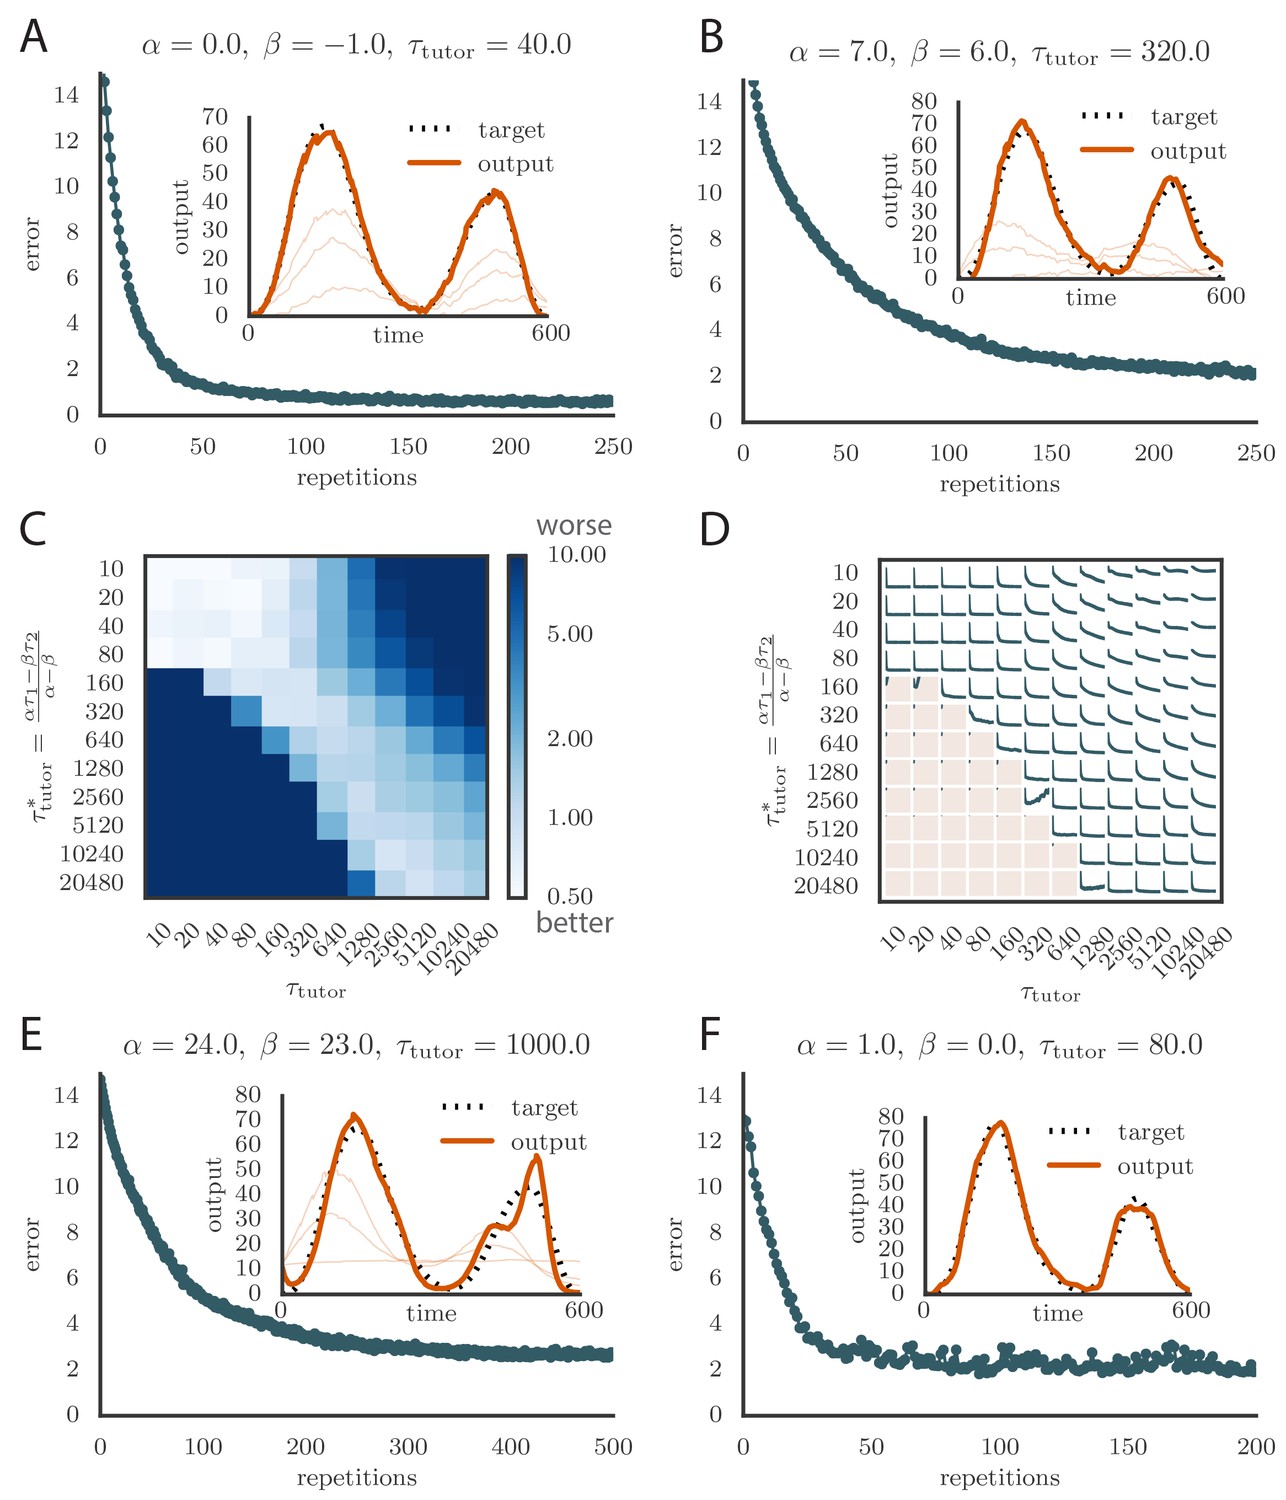
(A) Error trace showing how the average motor error evolved with the number of repetitions of the motor program for a rate-based () plasticity rule paired with a matching tutor. (See online Video 1). (B) The error trace and final motor output shown for a timing-based learning rule matched by a tutor with a long integration timescale. (See online Video 2.) In both A and B the inset shows the final motor output for one of the two output channels (thick orange line) compared to the target output for that channel (dotted black line). The output on the first rendition and at two other stages of learning indicated by orange arrows on the error trace are also shown as thin orange lines. (C) Effects of mismatch between student and tutor on reproduction accuracy. The heatmap shows the final reproduction error of the motor output after 1000 learning cycles in a rate-based simulation where a student with parameters , , , and was paired with a tutor with memory timescale . On the axis, and were kept fixed at and , respectively, while and were varied (subject to the constraint ; see text). Different choices of and lead to different optimal timescales according to Equation (4). The diagonal elements correspond to matched tutor and student, . Note that the color scale is logarithmic. (D) Error evolution curves as a function of the mismatch between student and tutor. Each plot shows how the error in the motor program changed during 1000 learning cycles for the same conditions as those shown in the heatmap. The region shaded in light pink shows simulations where the mismatch between student and tutor led to a deteriorating instead of improving performance during learning.
Figure 4
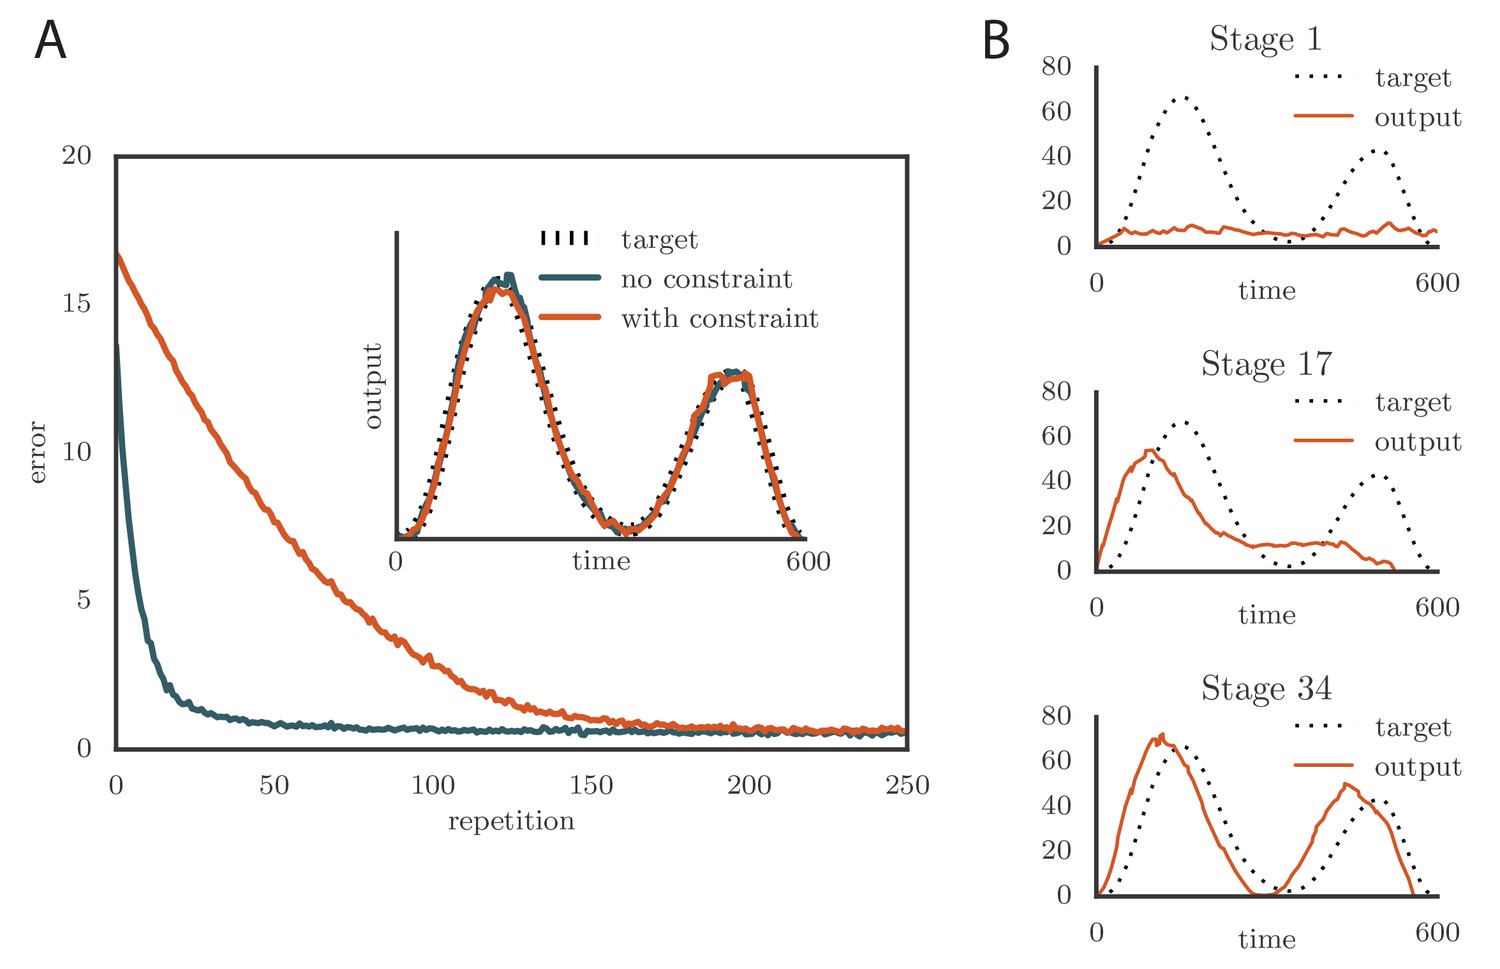
Effects of adding a constraint on the tutor firing rate to the simulations.
(A) Learning was slowed down by the firing rate constraint, but the accuracy of the final rendition stayed the same (inset, shown here for one of two simulated output channels). Here , , and . (See online Video 3.) (B) Sequential learning occurred when the firing rate constraint was imposed on a matched tutor with a long memory scale. The plots show the evolution of the motor output for one of the two channels that were used in the simulation. Here , , and . (See online Video 4.).
Figure 5
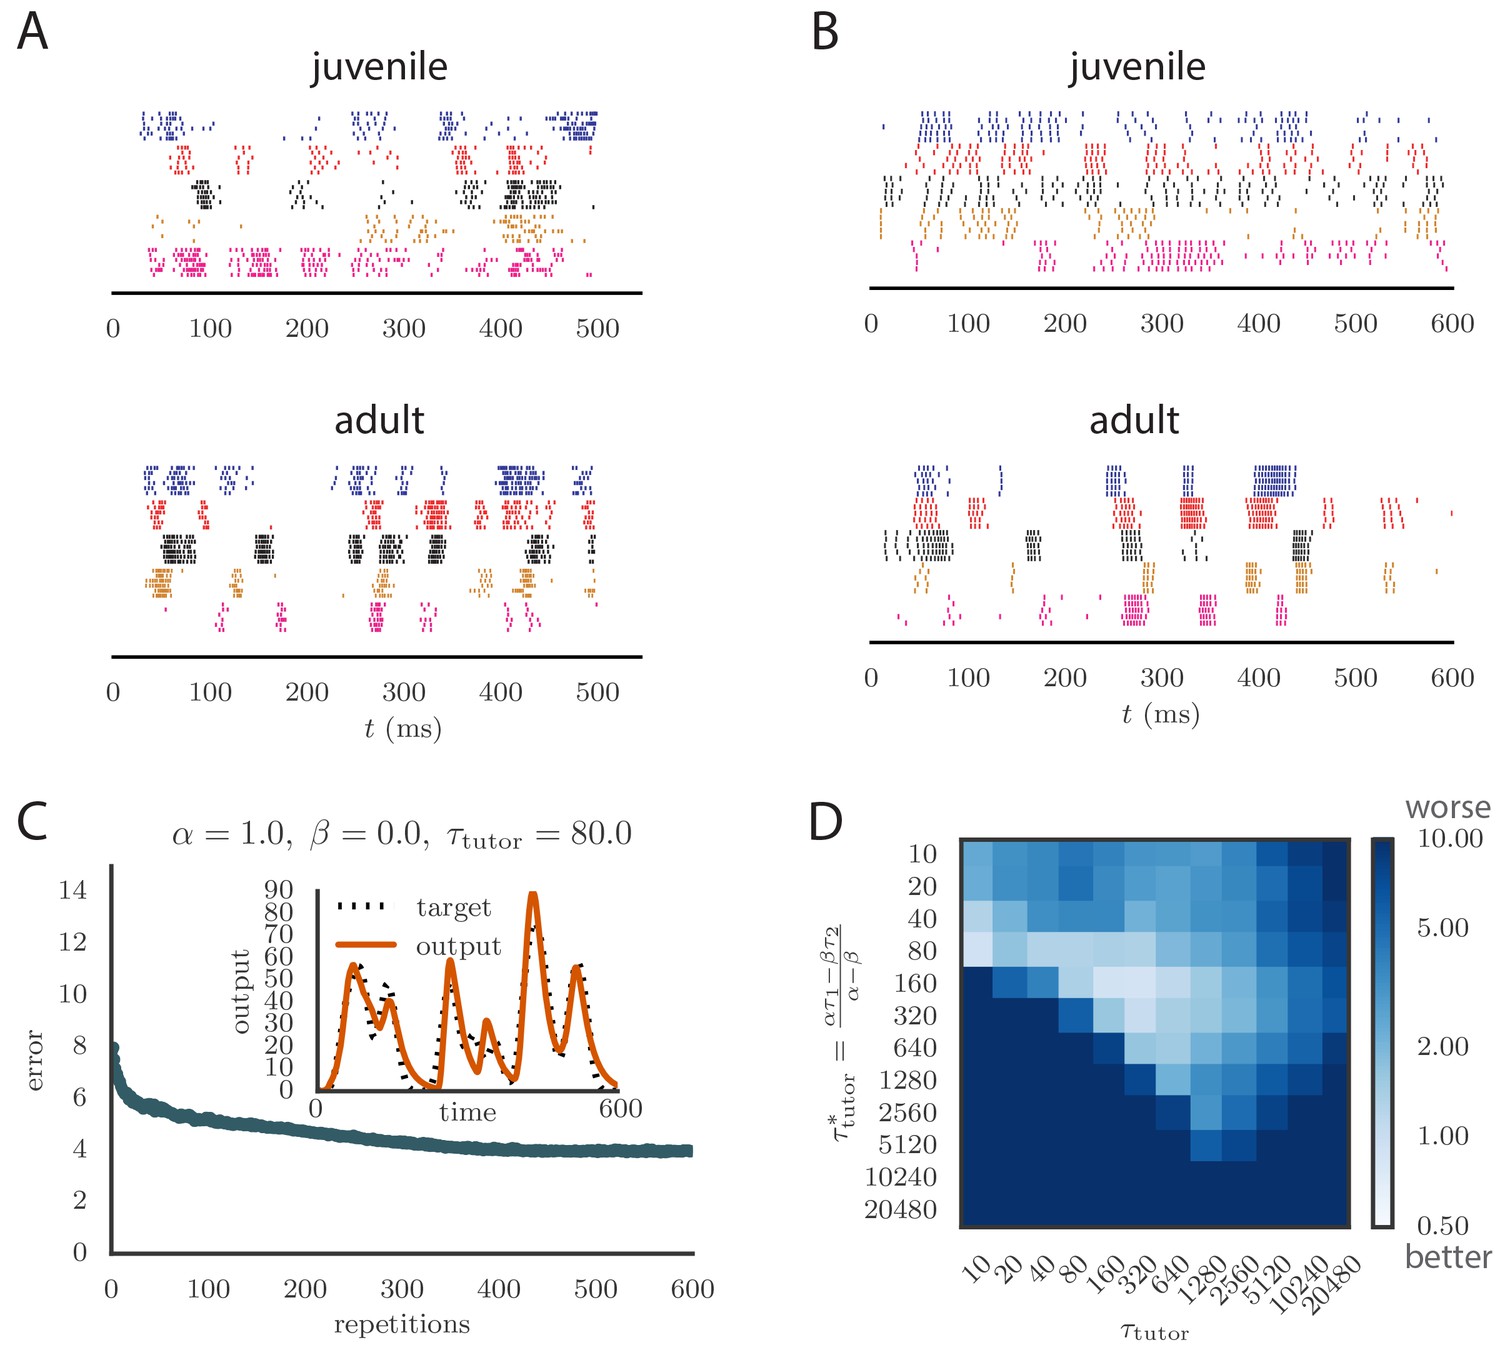
Results from simulations in spiking neural networks.
(A) Spike patterns recorded from zebra finch RA during song production, for a juvenile (top) and an adult (bottom). Each color corresponds to a single neuron, and the song-aligned spikes for six renditions of the song are shown. Adapted from Ölveczky et al. (2011). (B) Spike patterns from model student neurons in our simulations, for the untrained (top) and trained (bottom) models. The training used , , and , and ran for 600 iterations of the song. Each model neuron corresponds to a different output channel of the simulation. In this case, the targets for each channel were chosen to roughly approximate the time course observed in the neural recordings. (C) Progression of reproduction error in the spiking simulation as a function of the number of repetitions for the same conditions as in panel B. The inset shows the accuracy of reproduction in the trained model for one of the output channels. (See online Video 5.) (D) Effects of mismatch between student and tutor on reproduction accuracy in the spiking model. The heatmap shows the final reproduction error of the motor output after 1000 learning cycles in a spiking simulation where a student with parameters , , , and was paired with a tutor with memory timescale . On the axis, and were kept fixed at and , respectively, while and were varied (subject to the constraint ; see section "Learning in a rate-based model"). Different choices of and lead to different optimal timescales according to Equation (4). The diagonal elements correspond to matched tutor and student, . Note that the color scale is logarithmic.
Figure 6
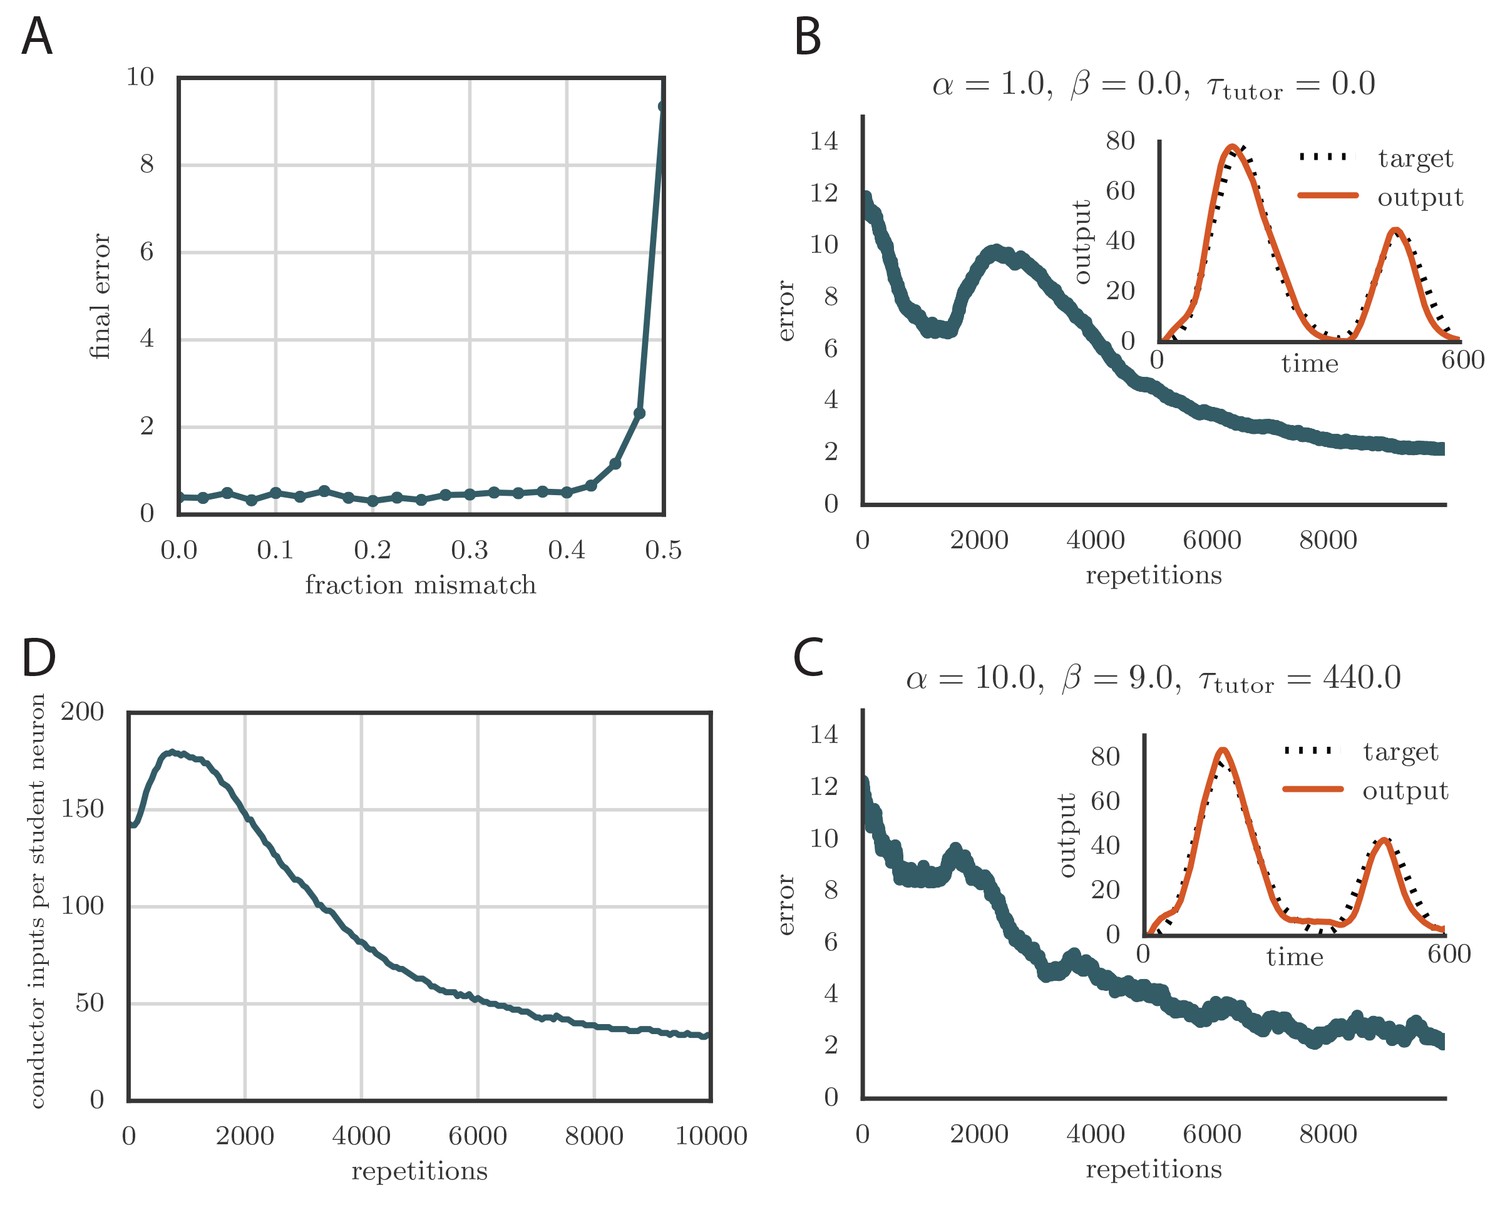
Credit assignment and reinforcement learning.
(A) Effects of credit mis-assignment on learning in a rate-based simulation. Here, the system learned output sequences for two independent channels. The student–output weights were chosen so that the tutor wrongly assigned a fraction of student neurons to an output channel different from the one it actually mapped to. The graph shows how the accuracy of the motor output after 1000 learning steps depended on the fraction of mis-assigned credit. (B) Learning curve and trained motor output (inset) for one of the channels showing two-stage reinforcement-based learning for the memory-less tutor (). The accuracy of the trained model is as good as in the case where the tutor was assumed to have a perfect model of the student–output relation. However, the speed of learning is reduced. (See online Video 6.) (C) Learning curve and trained motor output (inset) for one of the output channels showing two-stage reinforcement-based learning when the tutor circuit needs to integrate information about the motor error on a certain timescale. Again, learning was slow, but the accuracy of the trained state was unchanged. (See online Video 7.) (D) Evolution of the average number of HVC inputs per RA neuron with learning in a reinforcement example. Synapses were considered pruned if they admitted a current smaller than 1 nA after a pre-synaptic spike in our simulations.
Appendix 1—figure 1
Robustness of learning.
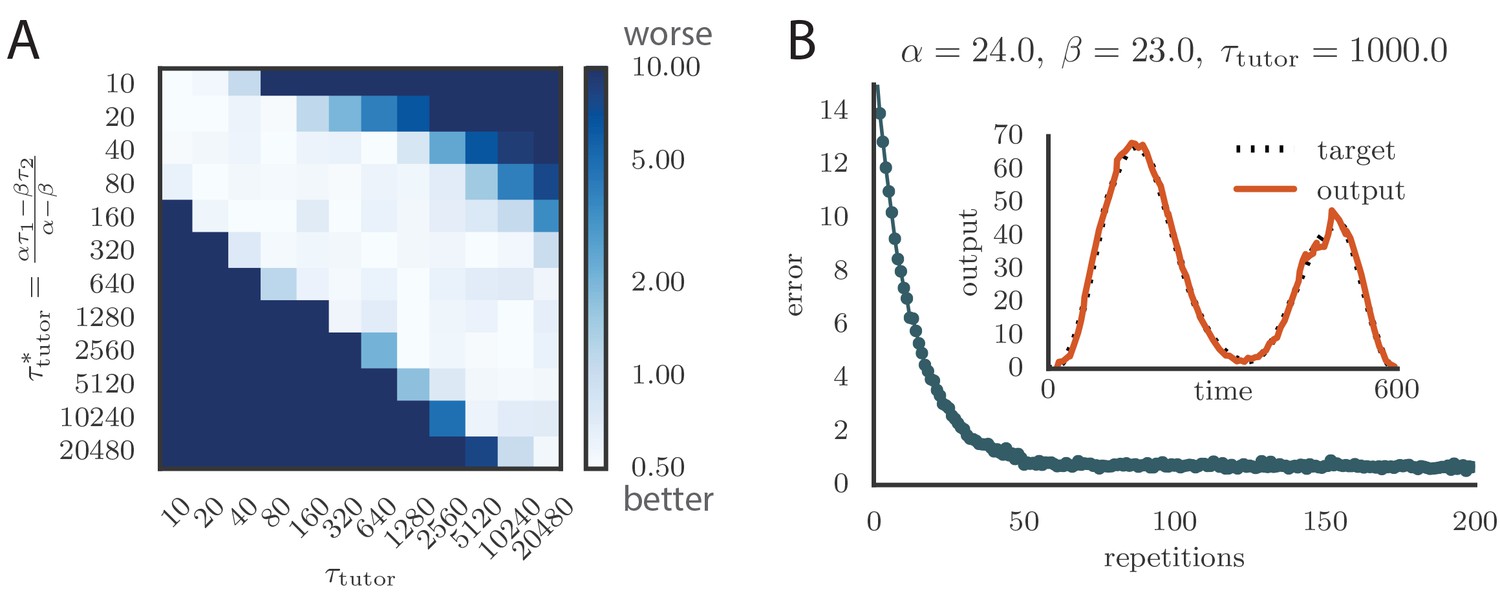
(A) Error trace showing how average motor error evolves with repetitions of the motor program for rate-based plasticity paired with a matching tutor, when the student–output mapping has a push-pull architecture. The inset shows the final motor output (thick red line) compared to the target output (dotted black line). The output on the first rendition and at two other stages of learning are also shown. (B) The error trace and final motor output shown for timing-based plasticity matched by a tutor with a long integration timescale. (C) Effects of mismatch between student and tutor on reproduction accuracy when using a push-pull architecture for the student–output mapping. The heatmap shows the final reproduction error of the motor output after 1000 learning cycles when a student with plasticity parameters and is paired with a tutor with memory timescale . Here and . (D) Error evolution curves as a function of the mismatch between student and tutor. Each plot shows how the error in the motor program changes during 1000 learning cycles for the same conditions as those shown in the heatmap. The region shaded in light pink shows simulations where the mismatch between student and tutor leads to a deteriorating instead of improving performance during learning. (E) Convergence in the rate-based model with a linear-nonlinear controller that uses a sigmoidal nonlinearity. (F) Convergence in the spiking model when inhibition is constant instead of activity-dependent ().
Appendix 1—figure 2
Effect of changing conductor smoothing kernels in the plasticity rule.
(A) Matrix showing learning accuracy when using different timescales for the student plasticity rule. Each entry in the heatmap shows the average rendition error after 1000 learning steps when pairing a tutor with timescale with a non-matched student. Here the kernels are exponential, with timescales , . (B) Evolution of motor error with learning using kernels and , instead of the two exponentials used in the main text. The tutor signal is as before, Equation (3). The inset shows the final output for the trained model, for one of the two output channels. Learning is as effective and fast as before.
Appendix 1—figure 3
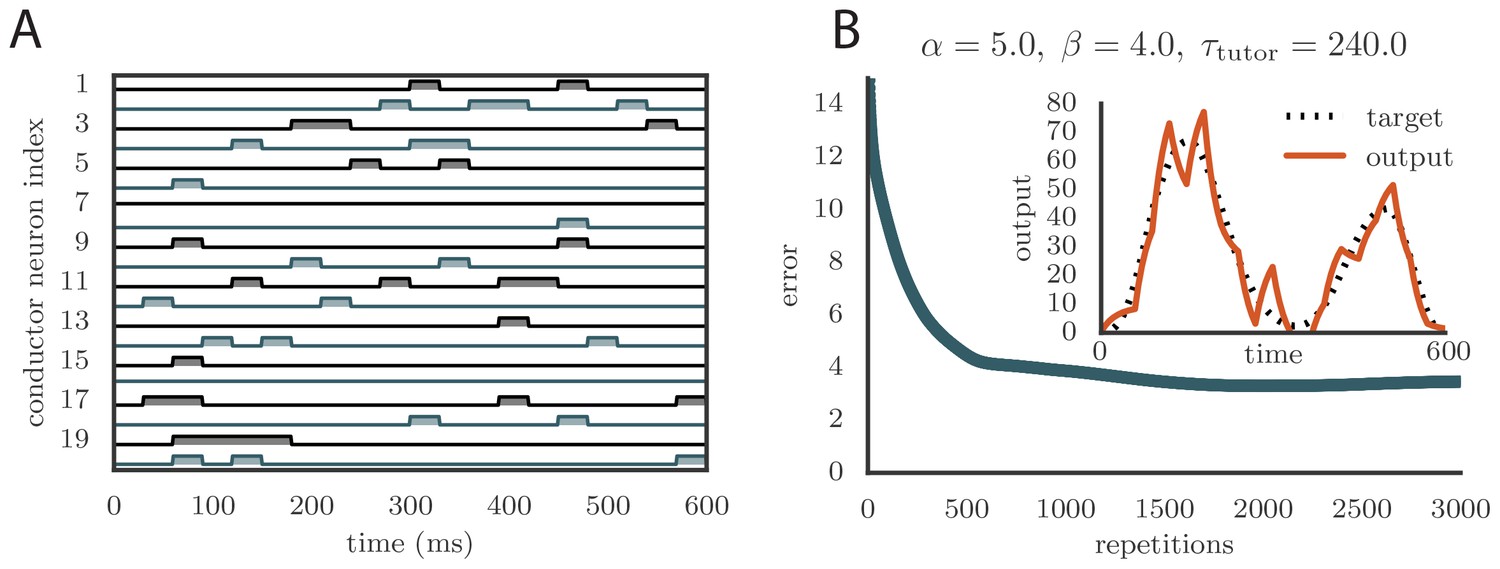
Learning with arbitrary conductor activity.
(A). Typical activity of conductor neurons. 20 of the 100 neurons included in the simulation are shown. The activity pattern is chosen so that about 10% of the neurons are active at any given time. The pattern is chosen randomly but is fixed during learning. Each conductor burst lasts . (B) Convergence curve and final rendition of the motor program (in inset). Learning included two output channels but the final output is shown for only one of them.
Appendix 1—figure 4
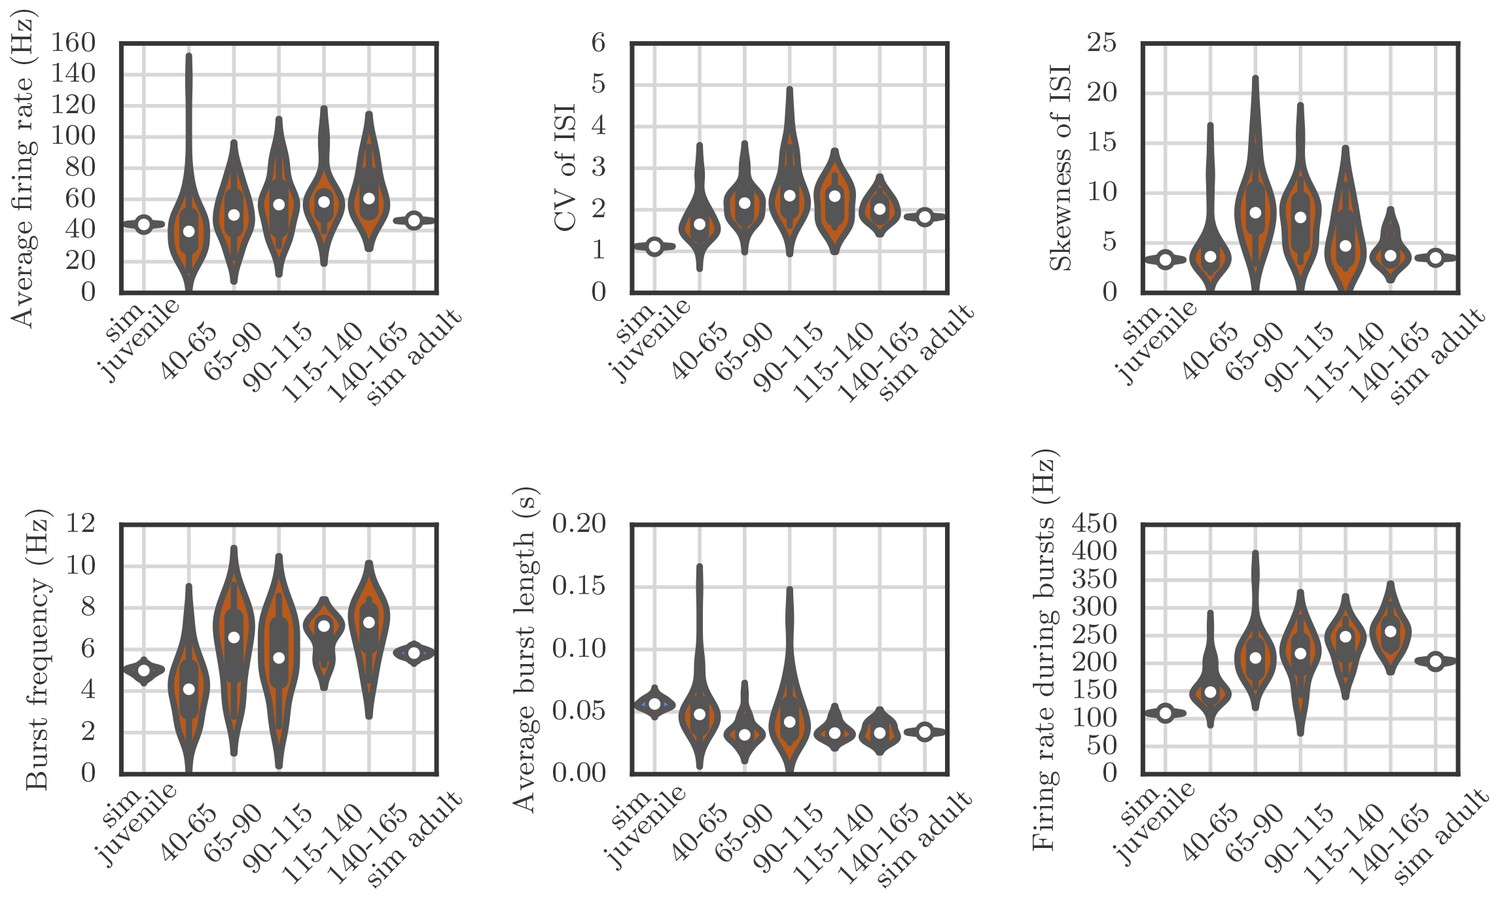
Violin plots showing how the spiking statistics from our simulation compared to the statistics obtained from neural recordings.
Each violin shows a kernel-density estimate of the distribution that a particular summary statistic had in either several runs of a simulation, or in several recordings from behaving birds. The circle and the box within each violin show the median and the interquartile range.
Videos
Video 1
Evolution of motor output during learning in a rate-based simulation using a rate-based () plasticity rule paired with a matching tutor.
This video relates to Figure 3A.
Video 2
Evolution of motor output during learning in a rate-based simulation using a timing-based () plasticity rule paired with a matching tutor.
This video relates to Figure 3B.
Video 3
Effects of adding a constraint on tutor firing rates on the evolution of motor output during learning in a rate-based simulation.
The plasticity rule here was rate-based (). This video relates to Figure 4A.
Video 4
Evolution of motor output showing sequential learning in a rate-based simulation when the firing rate constraint is imposed on a tutor with a long memory timescale.
This video relates to Figure 4B.
Video 5
Evolution of motor output during learning in a spiking simulation.
The plasticity rule parameters were , , and the tutor had a matching timescale . This video relates to Figure 5C.
Video 6
Evolution of motor output during learning in a spiking simulation with a reinforcement-based tutor.
Here the tutor was memory-less (). This video relates to Figure 6B.
Video 7
Evolution of motor output during learning in a spiking simulation with a reinforcement-based tutor.
Here the tutor needed to integrate information about the motor error on a timescale . This video relates to Figure 6C.
Tables
Table 1
Values for parameters used in the spiking simulations.
| Parameter | Symbol | Value | Parameter | Symbol | Value |
|---|---|---|---|---|---|
| No. of conductor neurons | No. of student neurons | ||||
| Reset potential | Input resistance | ||||
| Threshold potential | Strength of inhibition | ||||
| Membrane time constant | Fraction NMDA receptors | ||||
| Refractory period | Strength of synapses from tutor | ||||
| AMPA time constant | No. of conductor synapses per student neuron | ||||
| NMDA time constant | Mean strength of synapses from conductor | ||||
| Time constant for global inhibition | Standard deviation of conductor–student weights | ||||
| Conductor firing rate during bursts |
Download links
A two-part list of links to download the article, or parts of the article, in various formats.
Downloads (link to download the article as PDF)
Open citations (links to open the citations from this article in various online reference manager services)
Cite this article (links to download the citations from this article in formats compatible with various reference manager tools)
Rules and mechanisms for efficient two-stage learning in neural circuits
eLife 6:e20944.
https://doi.org/10.7554/eLife.20944


