Nkx2.5 marks angioblasts that contribute to hemogenic endothelium of the endocardium and dorsal aorta
- Weizmann Institute of Science, Israel
- Victor Chang Cardiac Research Institute, Australia
- Technion-Israel Institute of Technology, Israel
- Shanghai Institutes for Biological Sciences, Chinese Academy of Sciences, China
- Institute for Stem Cell and Regenerative Medicine, The University of Washington, United States
- Institute for Molecular Bioscience, The University of Queensland, Australia
- The University of Sydney, Australia
- Children’s Medical Research Institute, Australia
- University of New South Wales, Australia
Figures
Figure 1 with 1 supplement
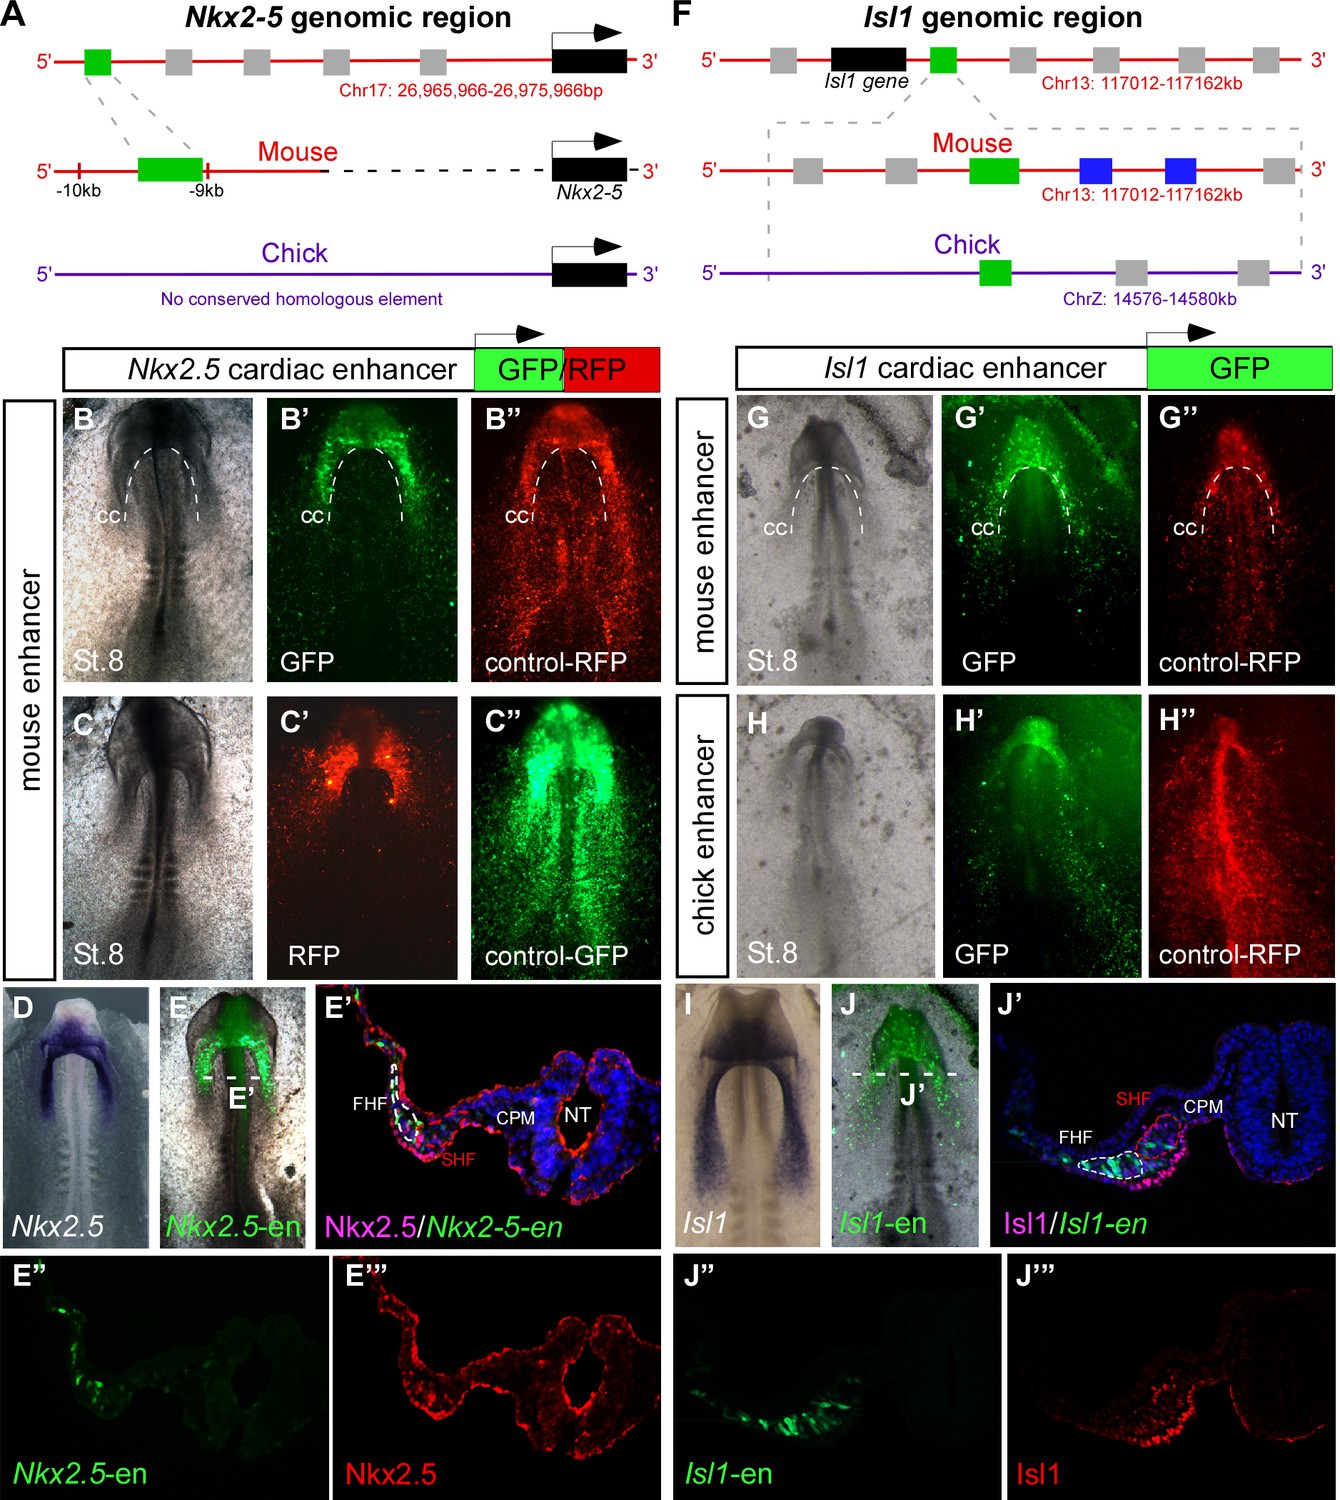
Identification of novel Nkx2-5 and Isl1 cardiac enhancers.
(A) Location of the Nkx2-5 enhancer in the mouse genome. (B–C) Expression patterns of the enhancer-driven GFP/RFP formed in the cardiac crescent at St. 8, compared to corresponding control vectors. (D) In situ hybridization of endogenous Nkx2.5 compared to (E) the mouse Nkx2-5 enhancer. (E'–E’’’) Cross-section of the electroporated embryo after immunostaining for Nkx2.5 (magenta), GFP (green), and DAPI (blue). Separated channels for the Nkx2-5-en (E”) and Nkx2.5 protein (E’’’). (F). Location of the Isl1 enhancer in chick and mouse genomes. (G–H) Expression patterns of the enhancer-driven GFP formed in the cardiac crescent at St. eight for both chick and mouse elements. The control RFP vector is expressed in all cells. (I) In situ hybridization of endogenous Isl1, compared to (J) stage-matched mouse enhancer-electroporated embryo. (J'–J’’’) Cross-section of the electroporated embryo after immunostaining for Isl1 (magenta), GFP (green), and DAPI (blue). Separated channels for the mouse Isl1-en (J”) and the Isl1 protein (J’’’). B-E, n = 30; F-J, n = 30. FHF: first heart field; SHF: second heart field; CPM: cranial paraxial mesoderm; NT: neural tube; CC: cardiac crescent. See also Figure 1—figure supplement 1, Video 1.
Figure 1—figure supplement 1
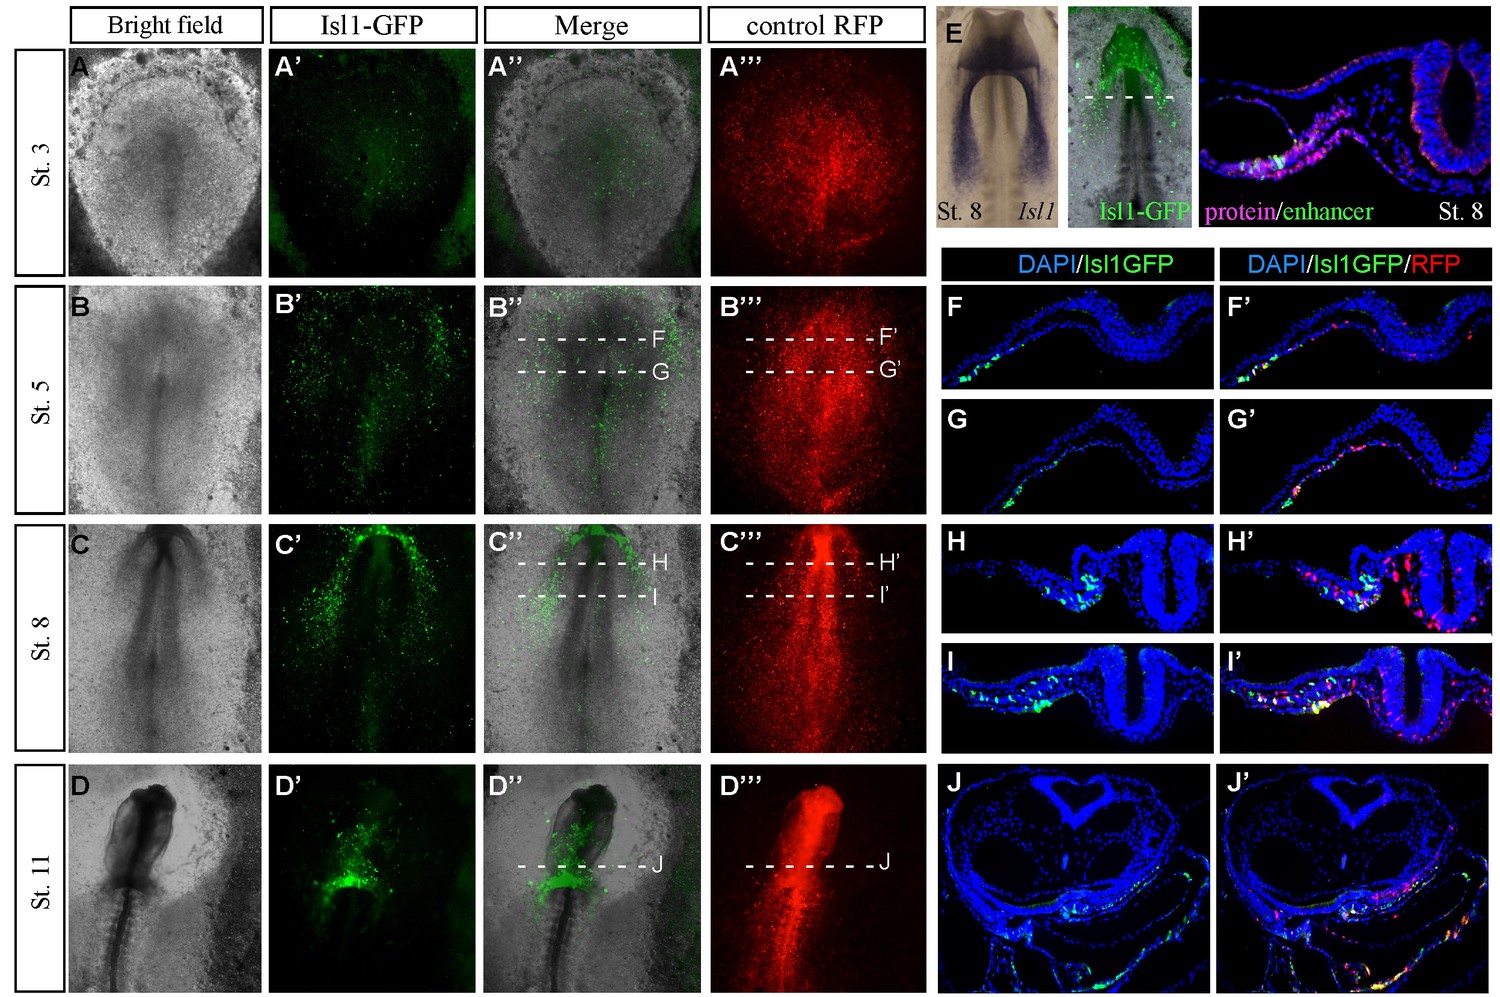
Characterization of the novel cardiac Isl1 enhancer.
(A–D) Expression pattern of the Isl1-en at different developmental stages. (E) The GFP pattern formed in the cardiac crescent at St. eight overlapped with the Isl1 mRNA expression pattern and its protein expression by staining for Isl1 (red) GFP (green) and Dapi (blue). (F–J) Cross sections through different stages of embryonic development corresponding to the embryos shown in A-D. The mouse Isl1-en (green, GFP) and control pCAAG-RFP (red).
Figure 2 with 1 supplement

Nkx2-5 and Isl1 enhancers mark distinct cardiac progenitor populations.
(A) Experimental design of the ex ovo electroporation technique. An electric field is used to introduce different plasmids into the embryo at gastrulation (St. 3), followed by EC culture and imaging. (B–E) Images taken from a 24 hr time-lapse video of an embryo co-electroporated with the Nkx2-5 (GFP) and Isl1 (RFP) enhancers from St. 7 to St. 11. Higher magnification panels (B’’’–E’’’) of the dotted square boxes highlight the differential Nkx2-5/Isl1 enhancers expression. Green arrow: Nkx2-5-en+ cells; Red arrow: Isl1-en+ cells; Yellow arrow: Nkx2-5-en+/Isl1-en+ cells. CC: cardiac crescent; LPM: lateral plate mesoderm; HT: heart tube; smt: somites. Scale bar: 100 µm. See also Video 2.
Figure 2—figure supplement 1

Migration of Nkx2-5-en+ cells from outside the cardiac crescent towards the heart tube.
(A–H) Time lapse analysis of a live chick embryo expressing GFP under the control of Nkx2-5-en analyzed at different time points. A single cell (white arrow and circle) migrating from the border of the extraembryonic/LPM and the cardiac heart field into the developing heart. Higher magnification images of the red boxes are included in the upper left corner of each panel and bring to view the traced cell. The GFP (Nkx2-5-en+ cells) and BF channels are separated.
Figure 3 with 1 supplement
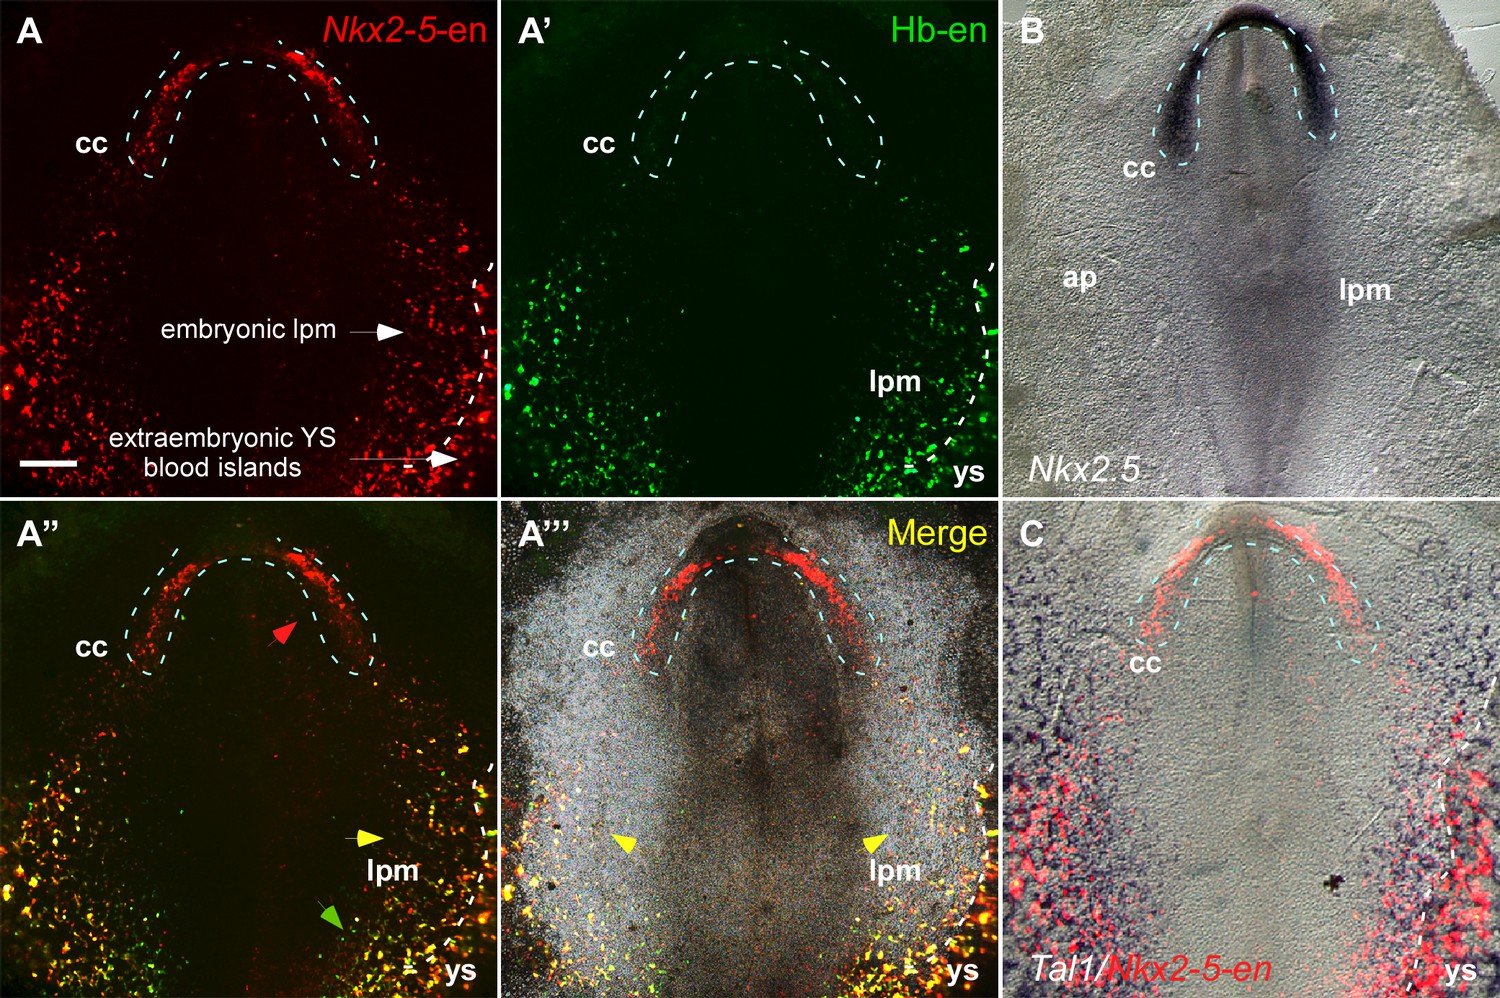
The Nkx2-5 enhancer is expressed in a hemangiogenic cell population.
(A–A''') A St. 7 embryo co-electroporated with the Nkx2-5-en (RFP) and Hb-en (GFP). The dashed line marks the boundaries of the cardiac crescent. Red arrows represent Nkx2-5-en+ cells in the cardiac crescent; yellow arrows represent Nkx2-5-en+/Hb-en+ cells; green arrows represent Hb-en+ cells (B) In situ hybridization for the endogenous Nkx2.5 mRNA of a St. 7 embryo. (C) In situ hybridization for the endogenous Tal1 mRNA of a St. 7 embryo. Tal1 expression pattern is compared to a representative Nkx2-5-en expression pattern from different embryo. CC: cardiac crescent; AP: area pellucida; LPM: lateral plate mesoderm; YS: yolk sac. Scale bar: 100 µm. n = 17/20. See also Figure 3—figure supplement 1.
Figure 3—figure supplement 1
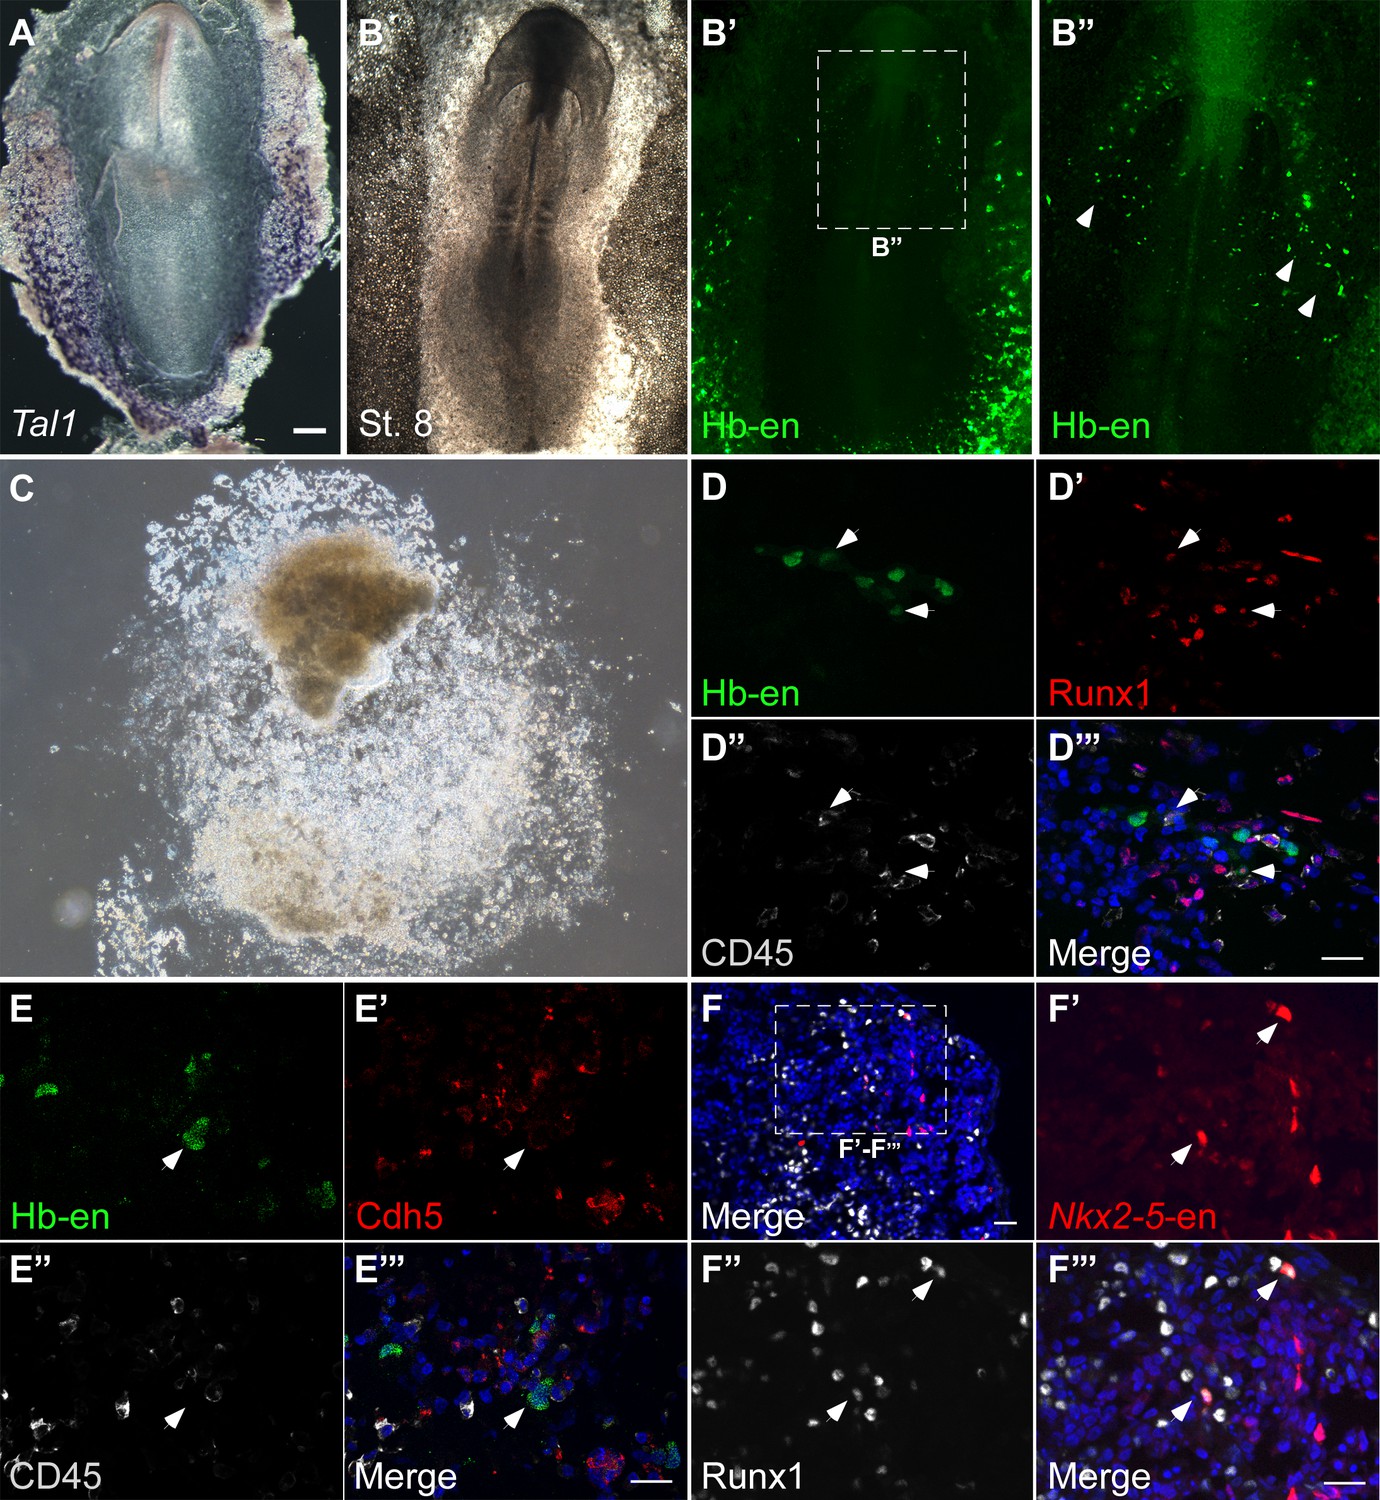
The Hb enhancer is active in endothelial and blood progenitors.
(A) In situ hybridization of Tal1 mRNA at St.8 (B–B") The Hb-en is expressed in the extra-embryonic region with a similar pattern to Tal1 endogenous mRNA. Expression can also be detected in the cardiac crescent where endothelial cells give rise to the endocardium. (C) Example of a posterior LPM explant expressing the Hb-en, cryo-sectioned and (D–E"') immune-stained for early hematopoietic and endothelial markers. (F) A posterior LPM explant expressing the Nkx2-5-en (red) cryo-sectioned and stained for early hematopoietic marker Runx1. (F’–F’’’) is a higher magnification image of the square box in F. Co-expressing cells are marked by white arrow heads. Scale bar: 20 μm.
Figure 4 with 1 supplement
Hemangiogenic progenitors migrate to the heart through the inflow tract, and contribute to the endocardium.
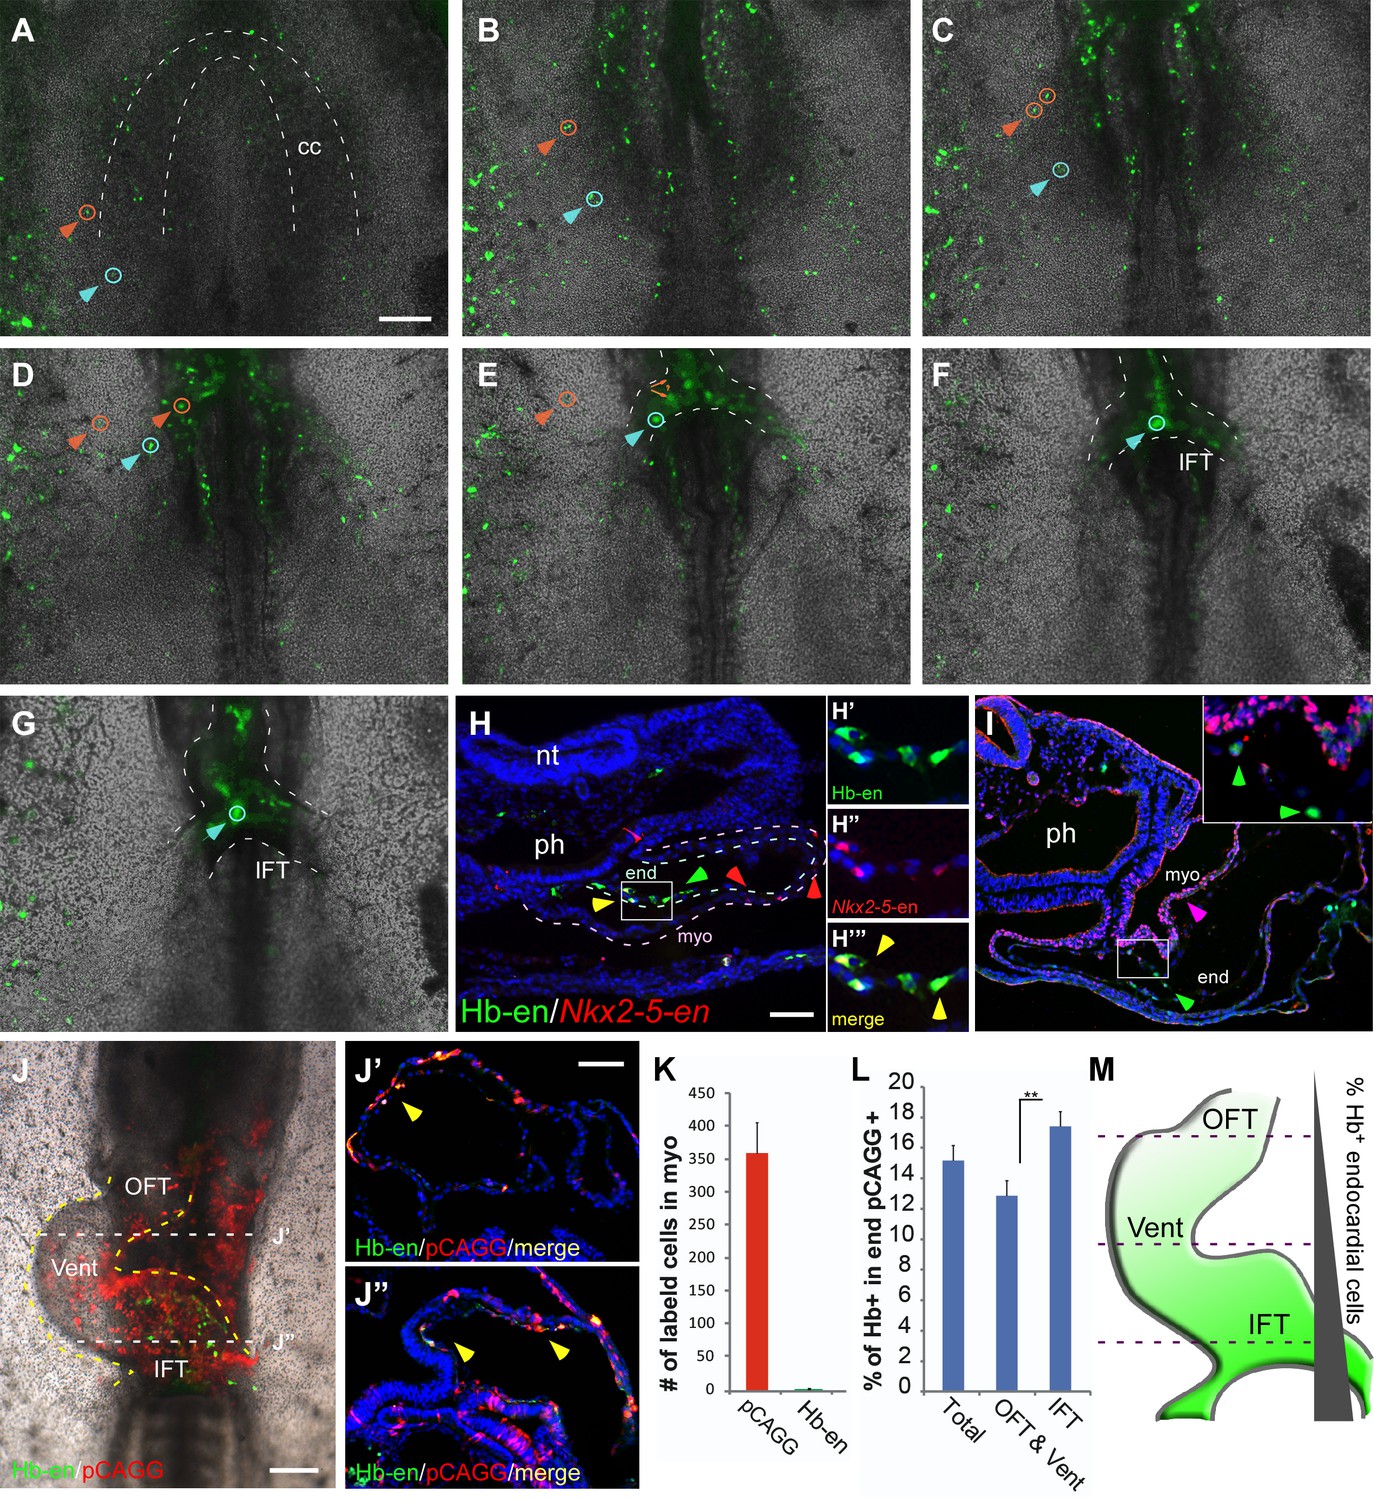
(A–G) Time-lapse images taken from an embryo electroporated with Hb-en (GFP). Images span a 24 hr time frame, from St. 6 to St. 11 of the same embryo. The orange and cyan circles distinguish between two distinct Hb-en+ cells. Cells were manually marked and tracked throughout the 24 hr window. (H) A St. 11 embryo co-electroporated with Nkx2-5-en and Hb-en. The embryo was sectioned at the level of the heart to show the distribution of cells within the heart tube. Arrows mark Hb-en+ (green), Hb-en+/Nkx2-5-en+ (yellow) and Nkx2-5-en+ (red) cells. (H’–H’’’) include higher magnification images of single channels from the square box in H. (I) A St. 11 embryo electroporated with Hb-en. The section was immunostained for Nkx2.5 (magenta), and its expression pattern compared to that of Hb-en. (J) An embryo electroporated with the Hb-en-GFP and control vector pCAGG-RFP at St. 12. (J’) Cryo-section through the outflow tract region (OFT) of the heart shown in J. (J”) Cryo-section through the inflow tract region (IFT) of the heart shown in J. Yellow arrows correspond to Hb-en+ /pCAGG+ cells in the endocardium. (K) Quantification of Hb-en+ cell contribution to the myocardium compared to the contribution of pCAGG-RFP+ cells. (L) Quantification of Hb-en+ cell contribution to the endocardium relative to the contribution of pCAGG-RFP+ cells. The quantifications represent two independent experiments with n = 3. For both quantifications, double positive cells (RFP+/GFP+) were manually counted and compared to the total number of RFP+ cells. (M) Schematic representation of relative Hb-en+ cell contribution to different parts of the endocardium. Hb-en+ cells numbers are increased towards the venous (IFT) pole of the heart. CC: cardiac crescent; IFT: inflow tract; OFT: outflow tract; vent: ventricle; myo: myocardium; end: endocardium. Scale bars: 100 µm. n = 9/12. See also Video 3 and Figure 4—source data 1.
-
Figure 4—source data 1
The distribution of Hb-en+ cells in the chick embryo.
Analysis is based on six embryos from two independent experiments. The first column represents the tissues checked for Hb-en+ cells. The second column represents the percentage of embryos in which Hb-en+ cells were detected. The third column represents the percentage of double positive Hb-en+/CD45+ cells out of the total CD45+ cells.
- https://doi.org/10.7554/eLife.20994.012
Figure 4—figure supplement 1
Double positive Nkx2-5-en+/Hb-en+ cells migrate towards the heart and yolk sac.
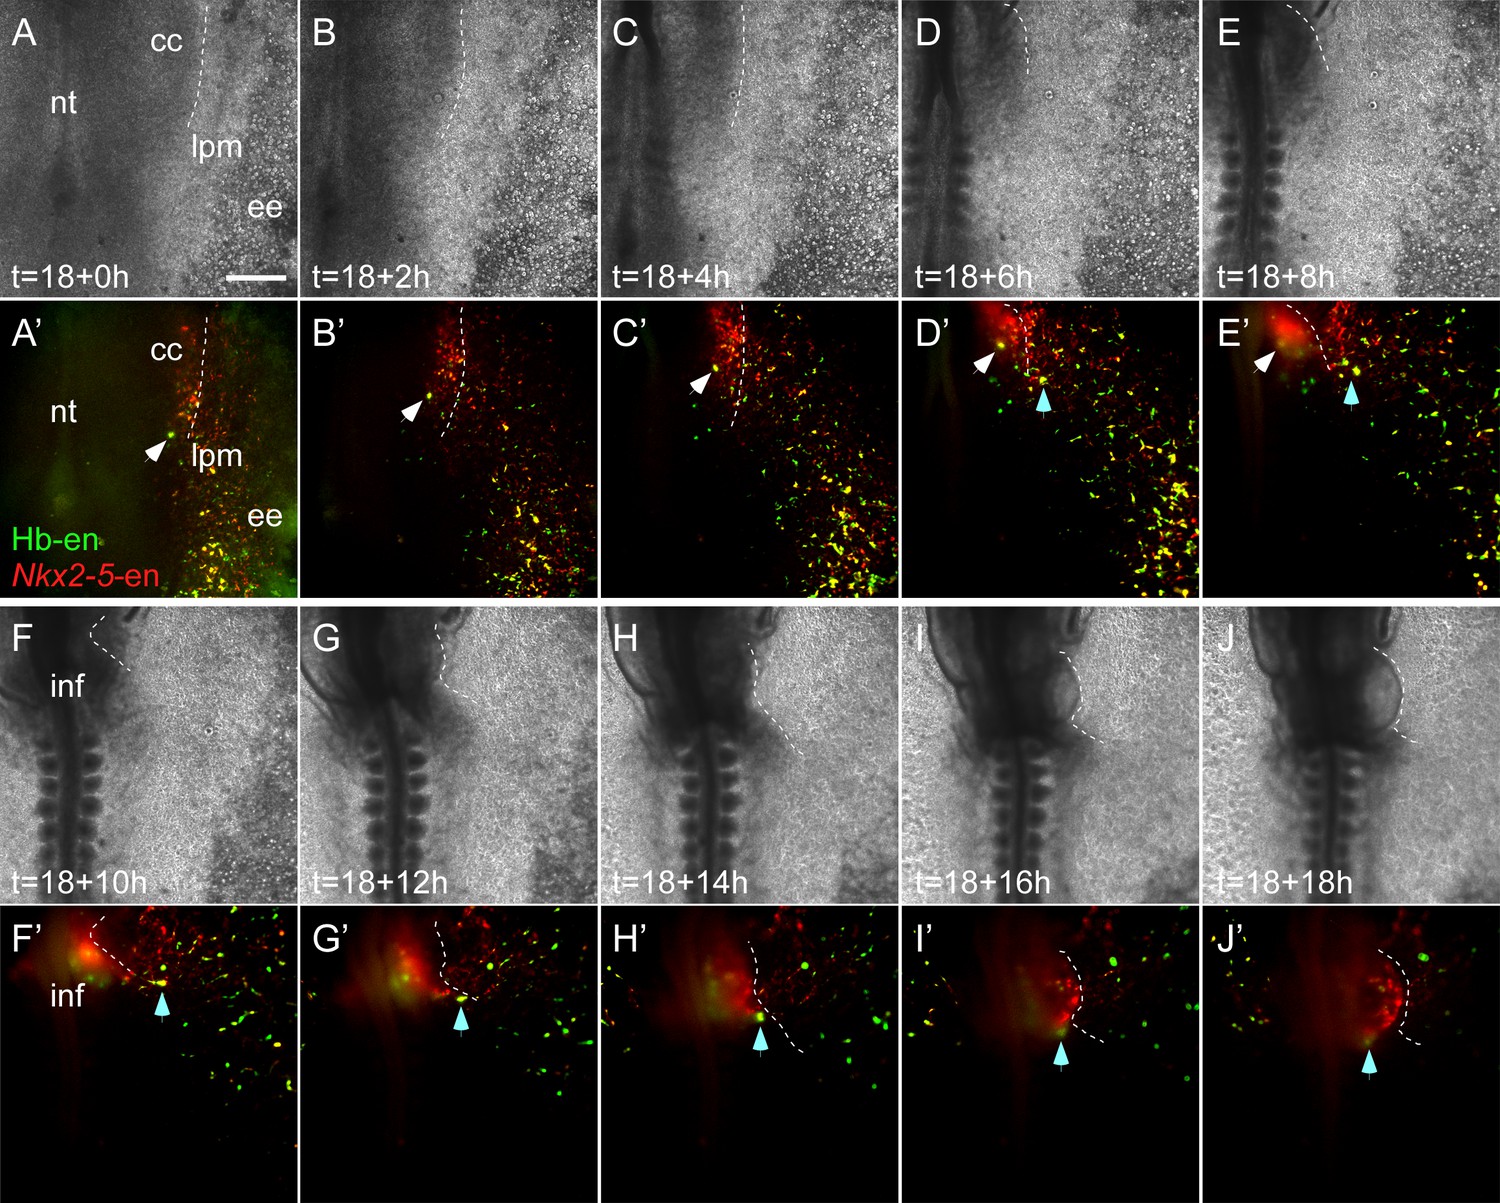
Time-lapse images taken from an embryo electroporated with Hb-en (GFP) and Nkx2-5-en (RFP). Images span an 18 hr time frame, from St. six to St. 11 of the same embryo. Images were taken in a way that the cardiac crescent, LPM and extraembryonic tissues are visible simultaneously. (A–E’) Tracking an Hb-en+/Nkx2-5-en+ cell at the border between the cardiac crescent and the LPM (white arrow). (D–J’) Tracking an Hb-en+/Nkx2-5-en+ cell that is located outside of the cardiac crescent and eventually incorporated into the heart tube (cyan arrow). Note the large number of double positive cells extending from the LPM towards the extraembryonic tissue that are migrating to the yolk sac in a circulation independent matter. that cc - cardiac crescent; ee - extraembryonic tissue; lpm - lateral plate mesoderm; nt - neural tube. Scale bar: 100 µm.
Figure 5

Hb-en+ and Nkx2-5-en+ cells contribute to the hemogenic endothelium of the dorsal aorta.
(A–A”) A St.17 embryo sectioned at the level of the AGM and stained with novel anti Cdh5 (VE-cadherin) and CD45 antibodies delineating the endothelium and hematopoietic cells, respectively. (B–B''') St.14–15 embryo electroporated with the Hb-en (GFP) and sectioned at the level of the early fused dorsal aorta stained for CD45, Runx1 and GFP. The arrow marks the initiation of hemogenic clusters indicated by CD45 expression. (C) Section of a St.14 embryo expressing the Nkx2-5-en in the right aspect of the newly fused dorsal aorta (arrowheads). While no CD45 expression is detected the Nkx2-5-en expression co-localized with Cdh5. (D–D") Section of an early St.14 embryo expressing the Nkx2-5-en. Hemogenic endothelium cells are marked by Runx1 which precedes the expression of CD45. DA–dorsal aorta. Scale bars: 100 μm (A), 20 μm (B–D). Scale bar: 100 µm. n = 4/6. See also Figure 4—source data 1.
Figure 6
Hb-en+ and Nkx2-5-en+ cells give rise to hemogenic endocardium.
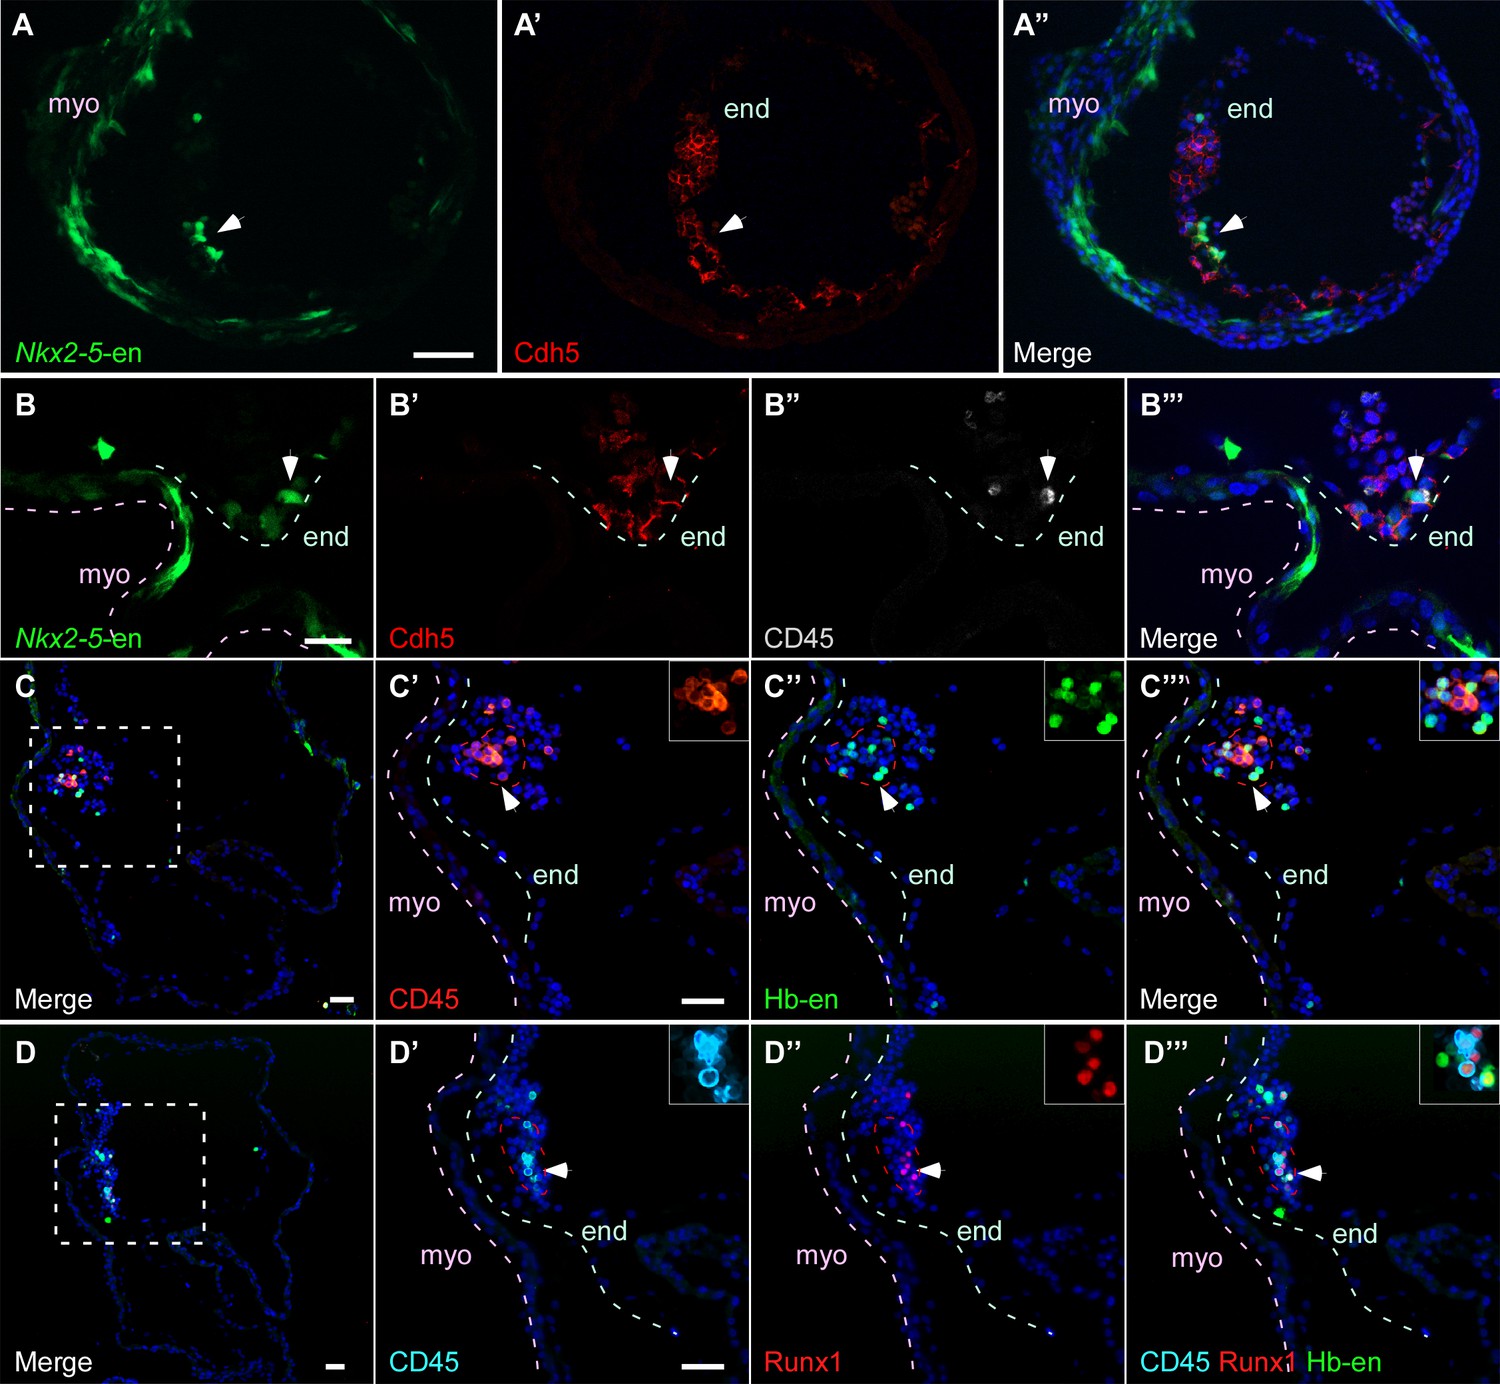
(A) Section through a heart of a St.12–13 embryo expressing the Nkx2-5-en. Staining for Cdh5 delineates the endocardium (white arrow) which expresses the Nkx2-5-en. (B) High magnification of a section through the heart of a St13-14 embryo expressing Nkx2-5-en. A hemogenic cluster is attached to the endocardium delineated by Cdh5 and CD45 staining. (C) St.14–15 embryo electroporated with the Hb-en sectioned at the level of the heart. (C'–C''') Higher magnification of the square box area marked in C. The section was stained for CD45 and shows a large hemogenic cluster in the endocardium. The arrow indicates Hb-en+ cells that express CD45. The endocardium and myocardium are delineated by grey and pink dashed lines, respectively. The dashed red line delineates the hemogenic cell cluster. (D) St.14–15 embryo electroporated with the Hb-en and sectioned at the level of the heart tube. (D'–D''') Higher magnification of the square box area marked in D. The section was stained for CD45, Runx1 and GFP. White arrow highlights an Hb-en+ cell co-expressing CD45 and Runx1. For each dotted red line a higher magnification image is shown at the upper right side of the panel. end: endocardium; myo: myocardium. Scale bars: 100 µm, B – 20 µm. n = 4/6.
Figure 7 with 1 supplement
Nkx2.5 is expressed in the nascent mesoderm in the chick primitive streak.
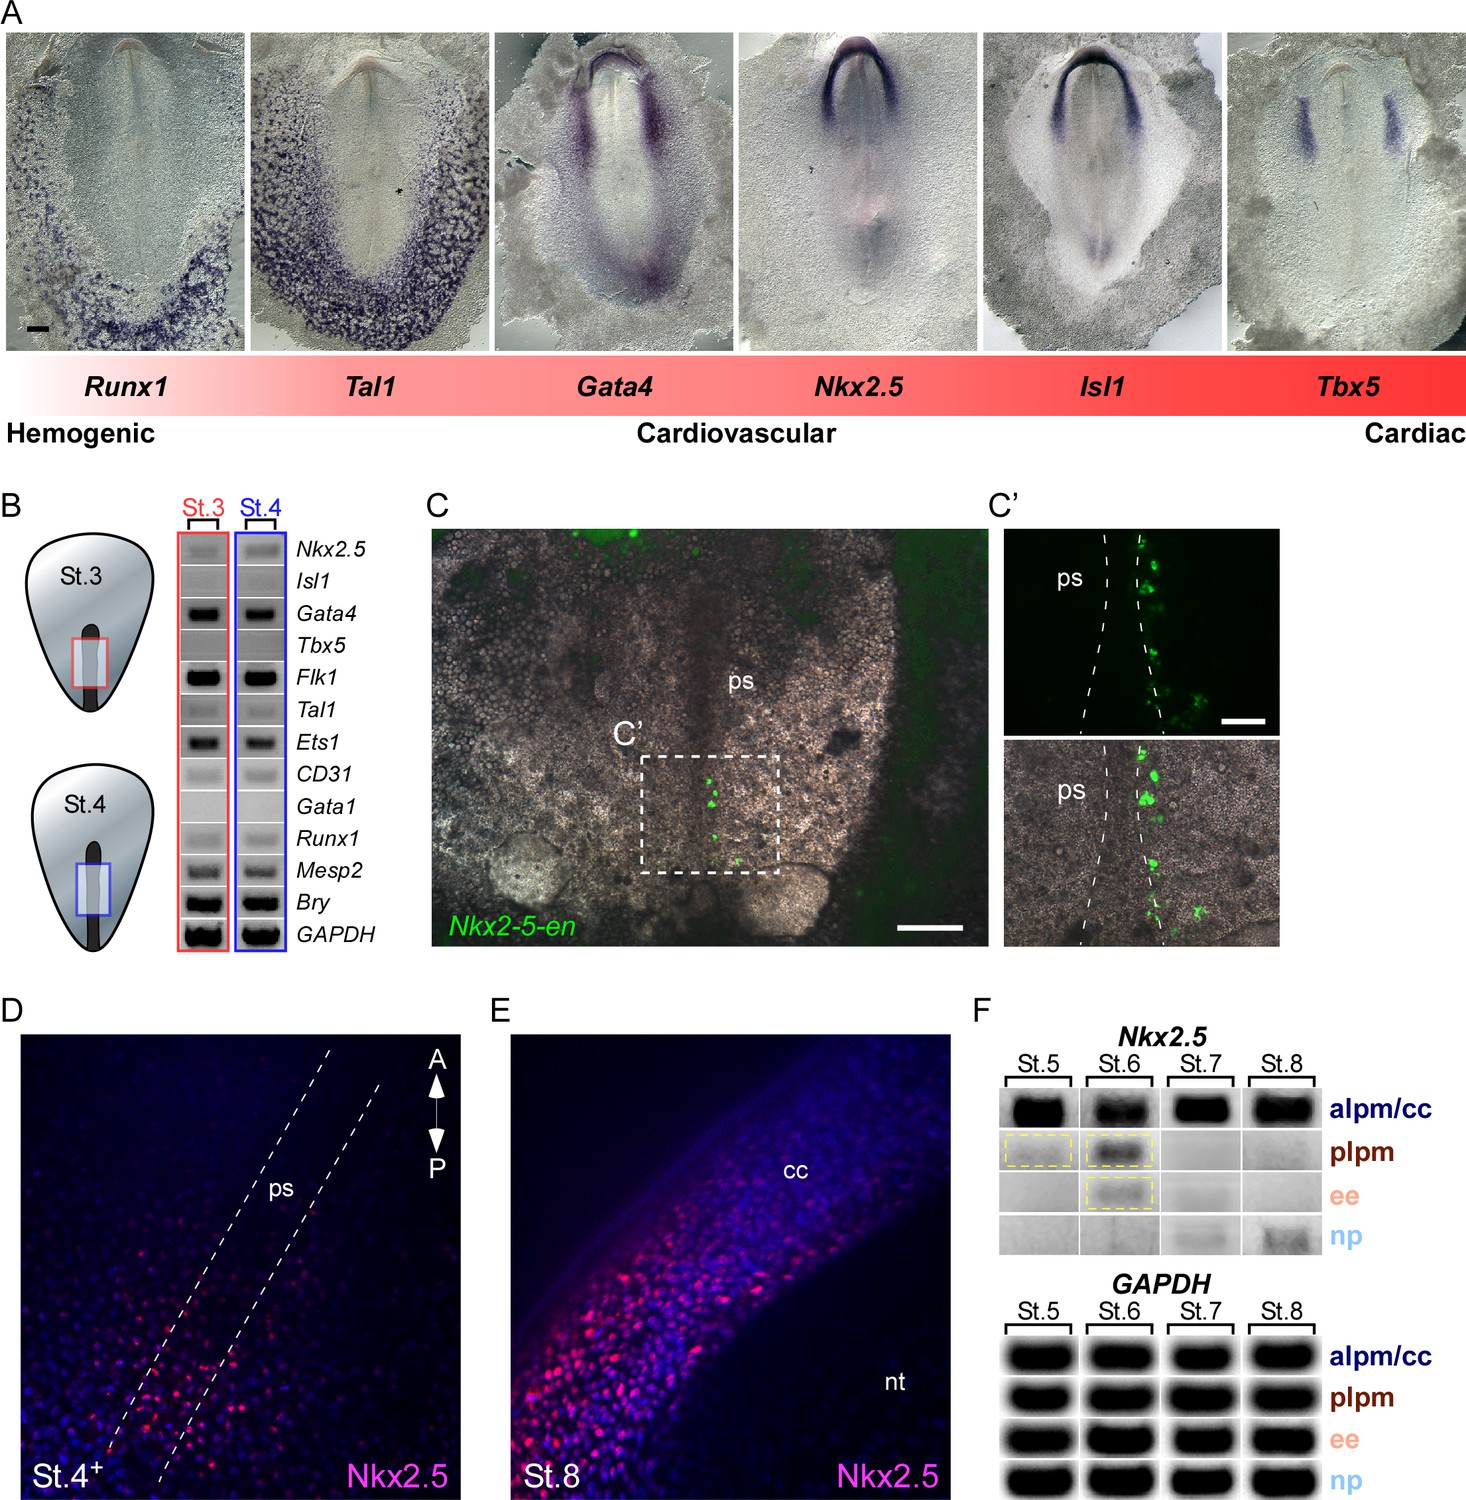
(A) The cardiovascular network gradient. In situ hybridization of key genes involved in blood, vascular and cardiac development. (B) Semi qRT-PCR analysis of cardiovascular genes in early St. 3 (red box) and St. 4 (blue box) embryos. (C–C’) A St. 3–4 embryo electroporated with the Nkx2-5-en. (C’) shows a higher magnification of the square box in (C), displaying the GFP channel and the merge with the BF channel. (D) Wholemount immunofluorescence staining for Nkx2.5 on late St. 4 embryo. (E) Wholemount immunofluorescence of St. 8 embryo. Nkx2.5 expression is restricted to the cardiac crescent. (F) Semi qRT-PCR time course analysis of Nkx2.5 mRNA expression at different embryonic stages and tissues. Nkx2.5 expression is highlighted in yellow boxes. GAPDH is used as control. CC: cardiac crescent; NT: neural tube; PS: primitive streak. Scale Bars – C: 100 µm; C’: 25 µm.
Figure 7—figure supplement 1
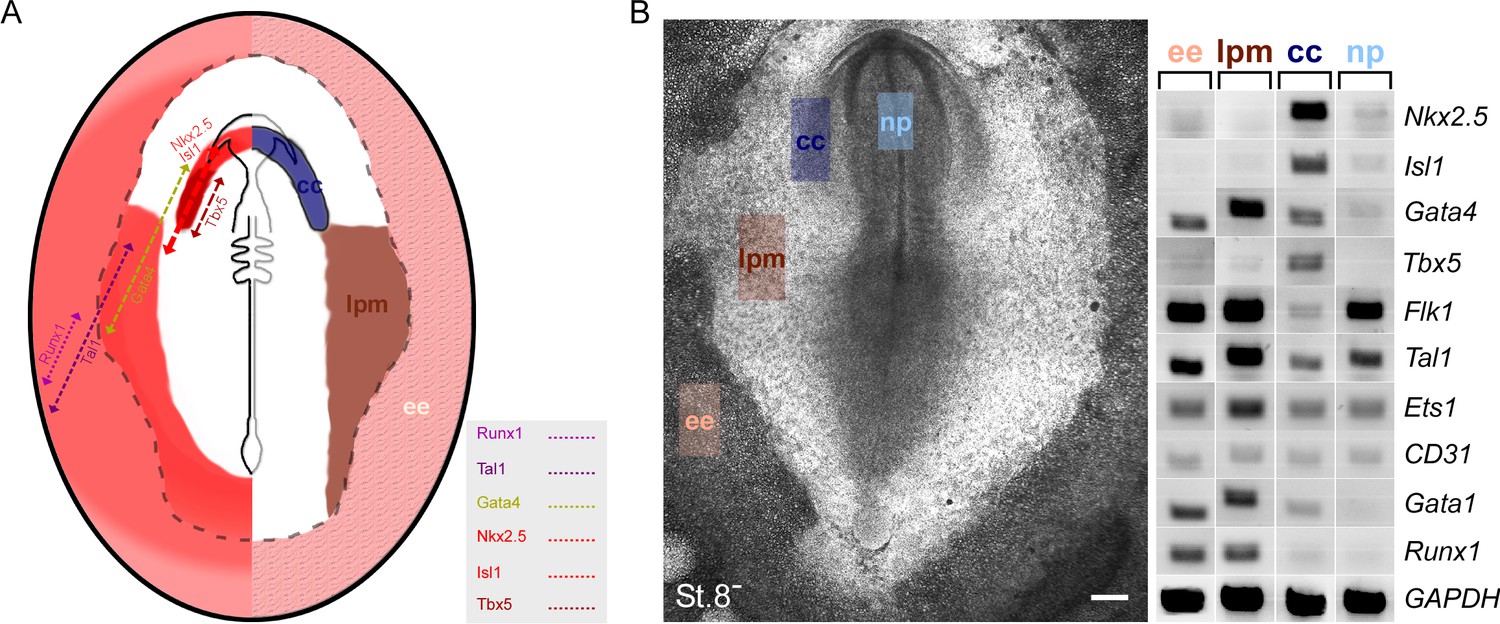
Key cardiovascular gene expression gradient in a chick embryo.
(A) Super-position of the different cardiovascular factors on a single embryo based on in situ hybridization and semi qRT-PCR analysis. (B) Semi qRT-PCR analysis of cardiovascular genes in a St.8- embryo. The embryo is divided to four sections that are manually dissected and subjected to RNA analysis. Representative results of three different biological repeats. lpm – lateral plate mesoderm; np – neural plate; cc – cardiac crescent; ee – extraembryonic tissue.
Figure 8 with 2 supplements
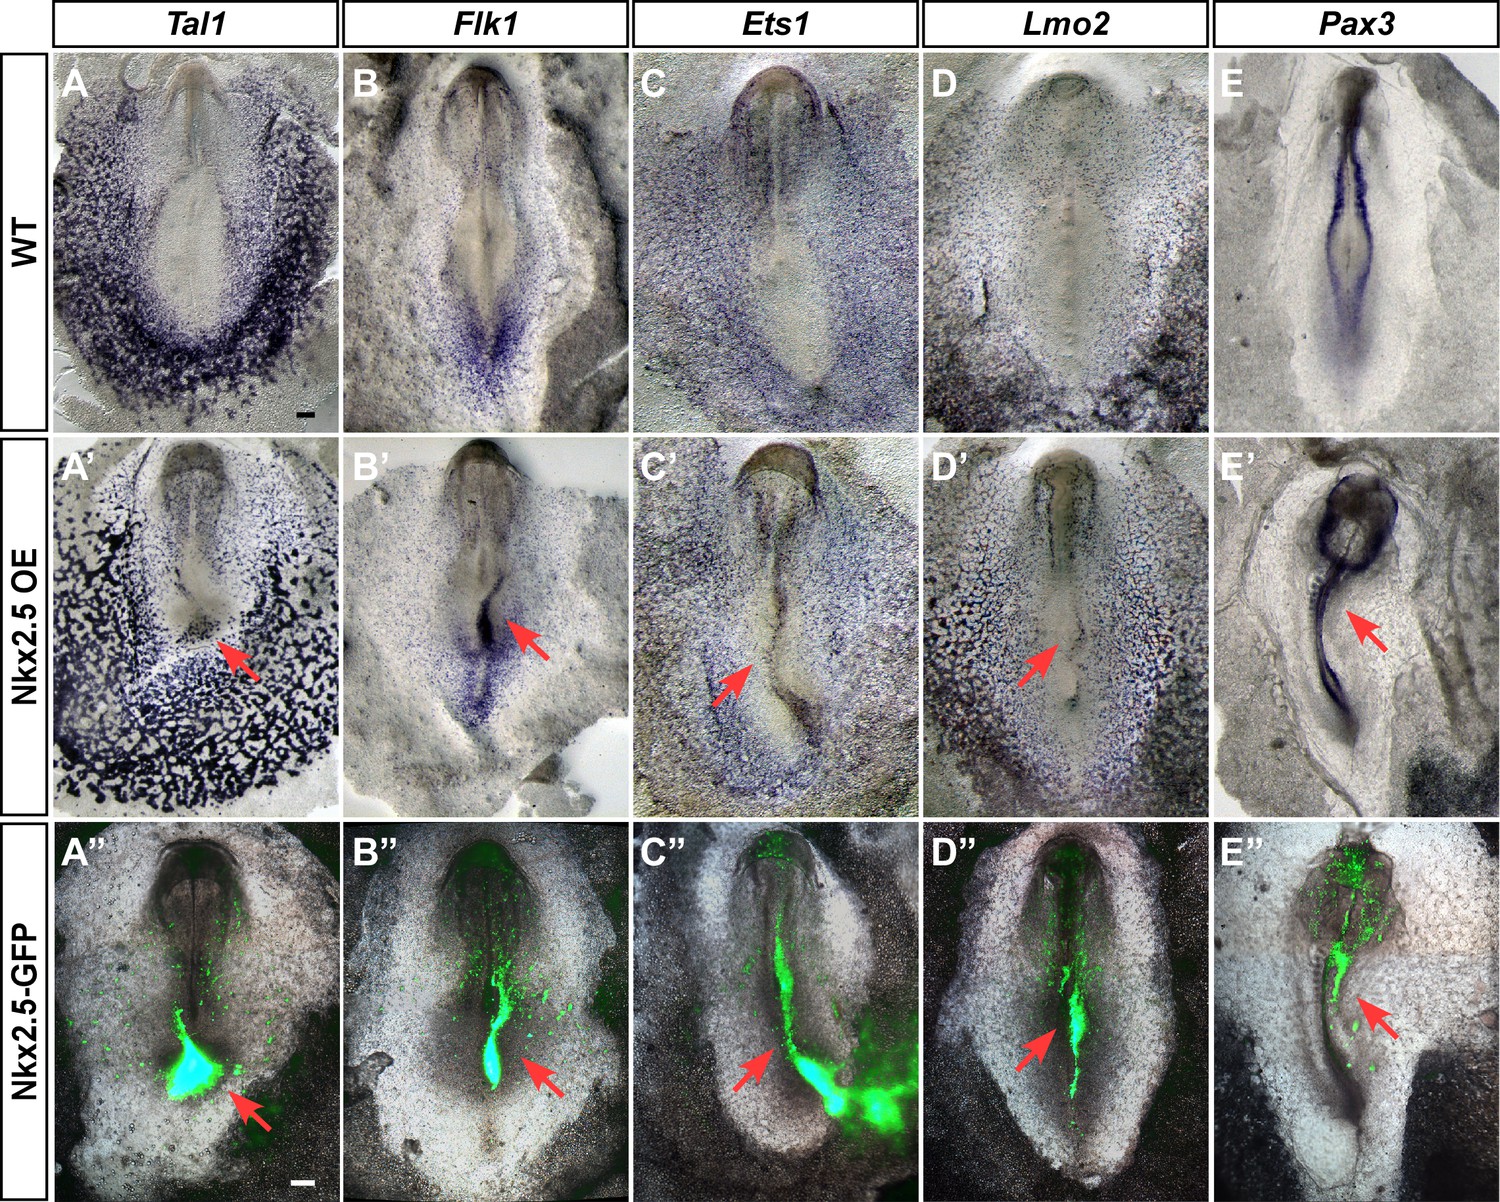
Ectopic expression of Nkx2.5 induces angioblast gene expression.
(A–E) In situ hybridization for Tal1, Flk1, Ets1 and Lmo2 and Pax3 in control embryos. (A’–E’) Embryos electroporated at St.3 with a vector over-expressing Nkx2.5 (pCIG-Nkx2.5-GFP). Embryos were subsequently incubated to St.7 and then subjected to in situ hybridization for the respected genes. Red arrow indicates where the ectopic expression of a gene was detected compared to its control embryo. (A”–E”) The same embryos as in A'–E' merged with the GFP channel visualizing the Nkx2.5 over-expressing tissues. The over-expressing phenotype corresponds to the area where the vector expression was the highest. Scale bar: 100 μm. See also Figure 9—figure supplements 1 and 2.
Figure 8—figure supplement 1
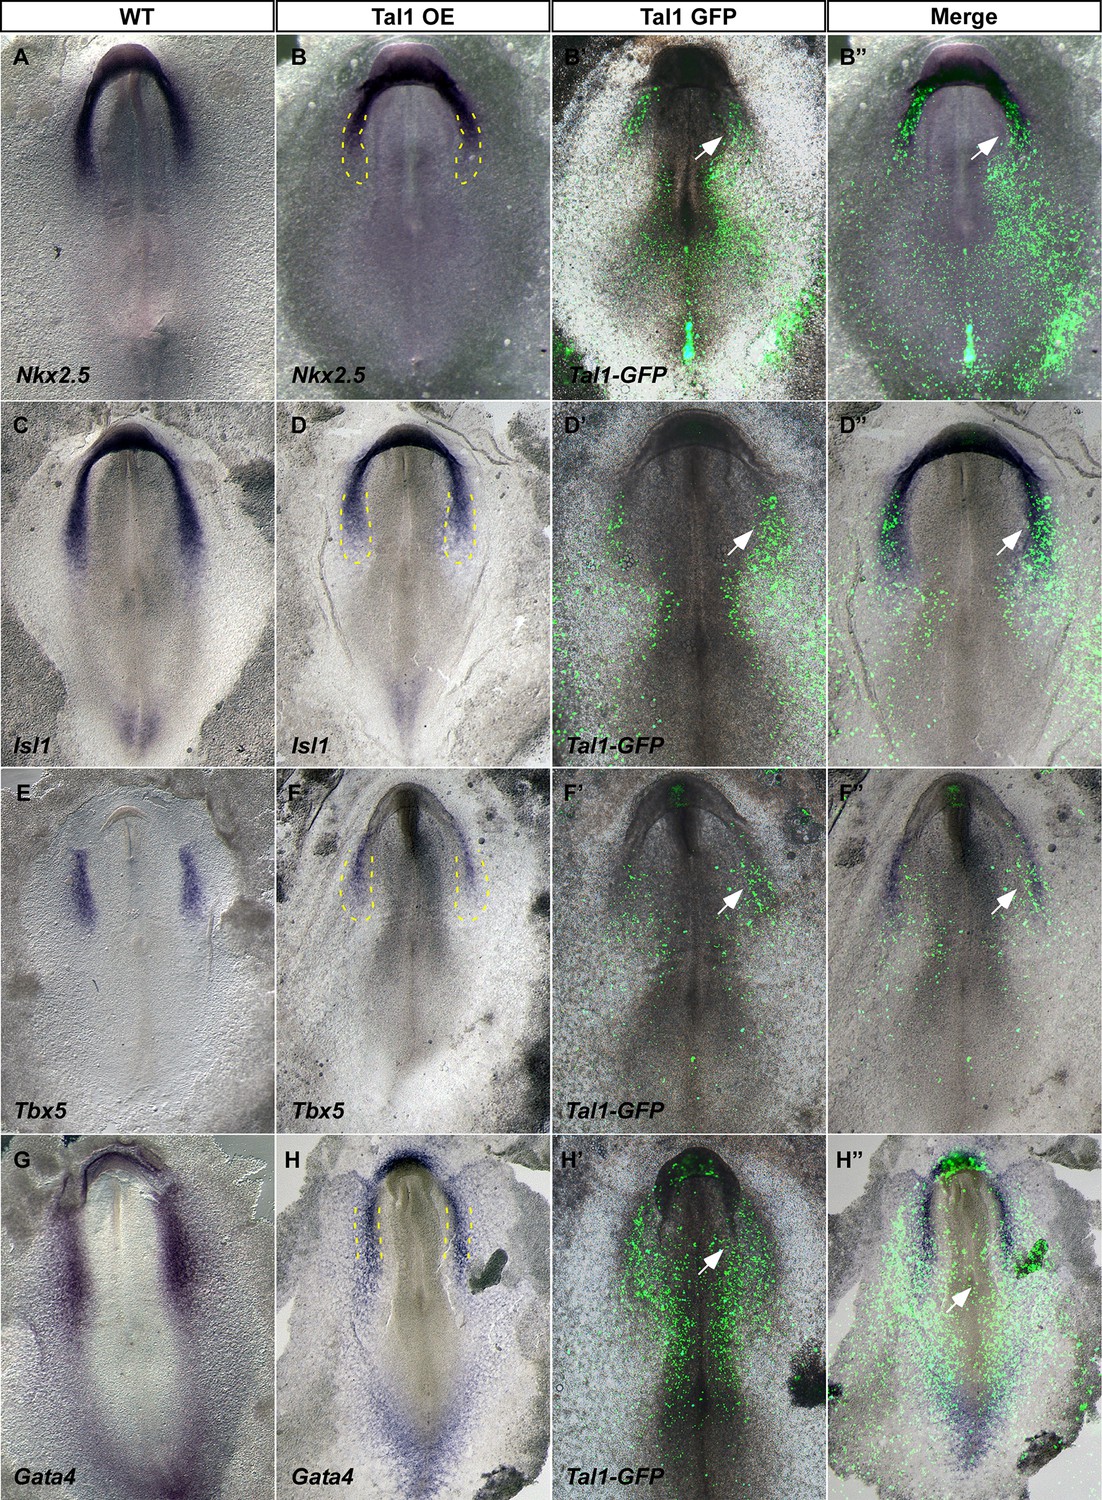
Tal1 over-expression inhibits cardiogenesis.
The coding sequence of chick Tal1 was cloned into an expression vector and electroporated into St.3 embryos. (A,C,E,G) Expression profile in WT control embryos. (B,D,F,H) Expression profile in Tal1 gain-of-function embryos. (B',D',F',H') GFP expression marks the cells where Tal1 is expressed. (B",D",F",H") Overlay of the GFP signal and the in-situ hybridization assay. The yellow dotted line represents the normal borders of the cardiac crescent.
Figure 8—figure supplement 2
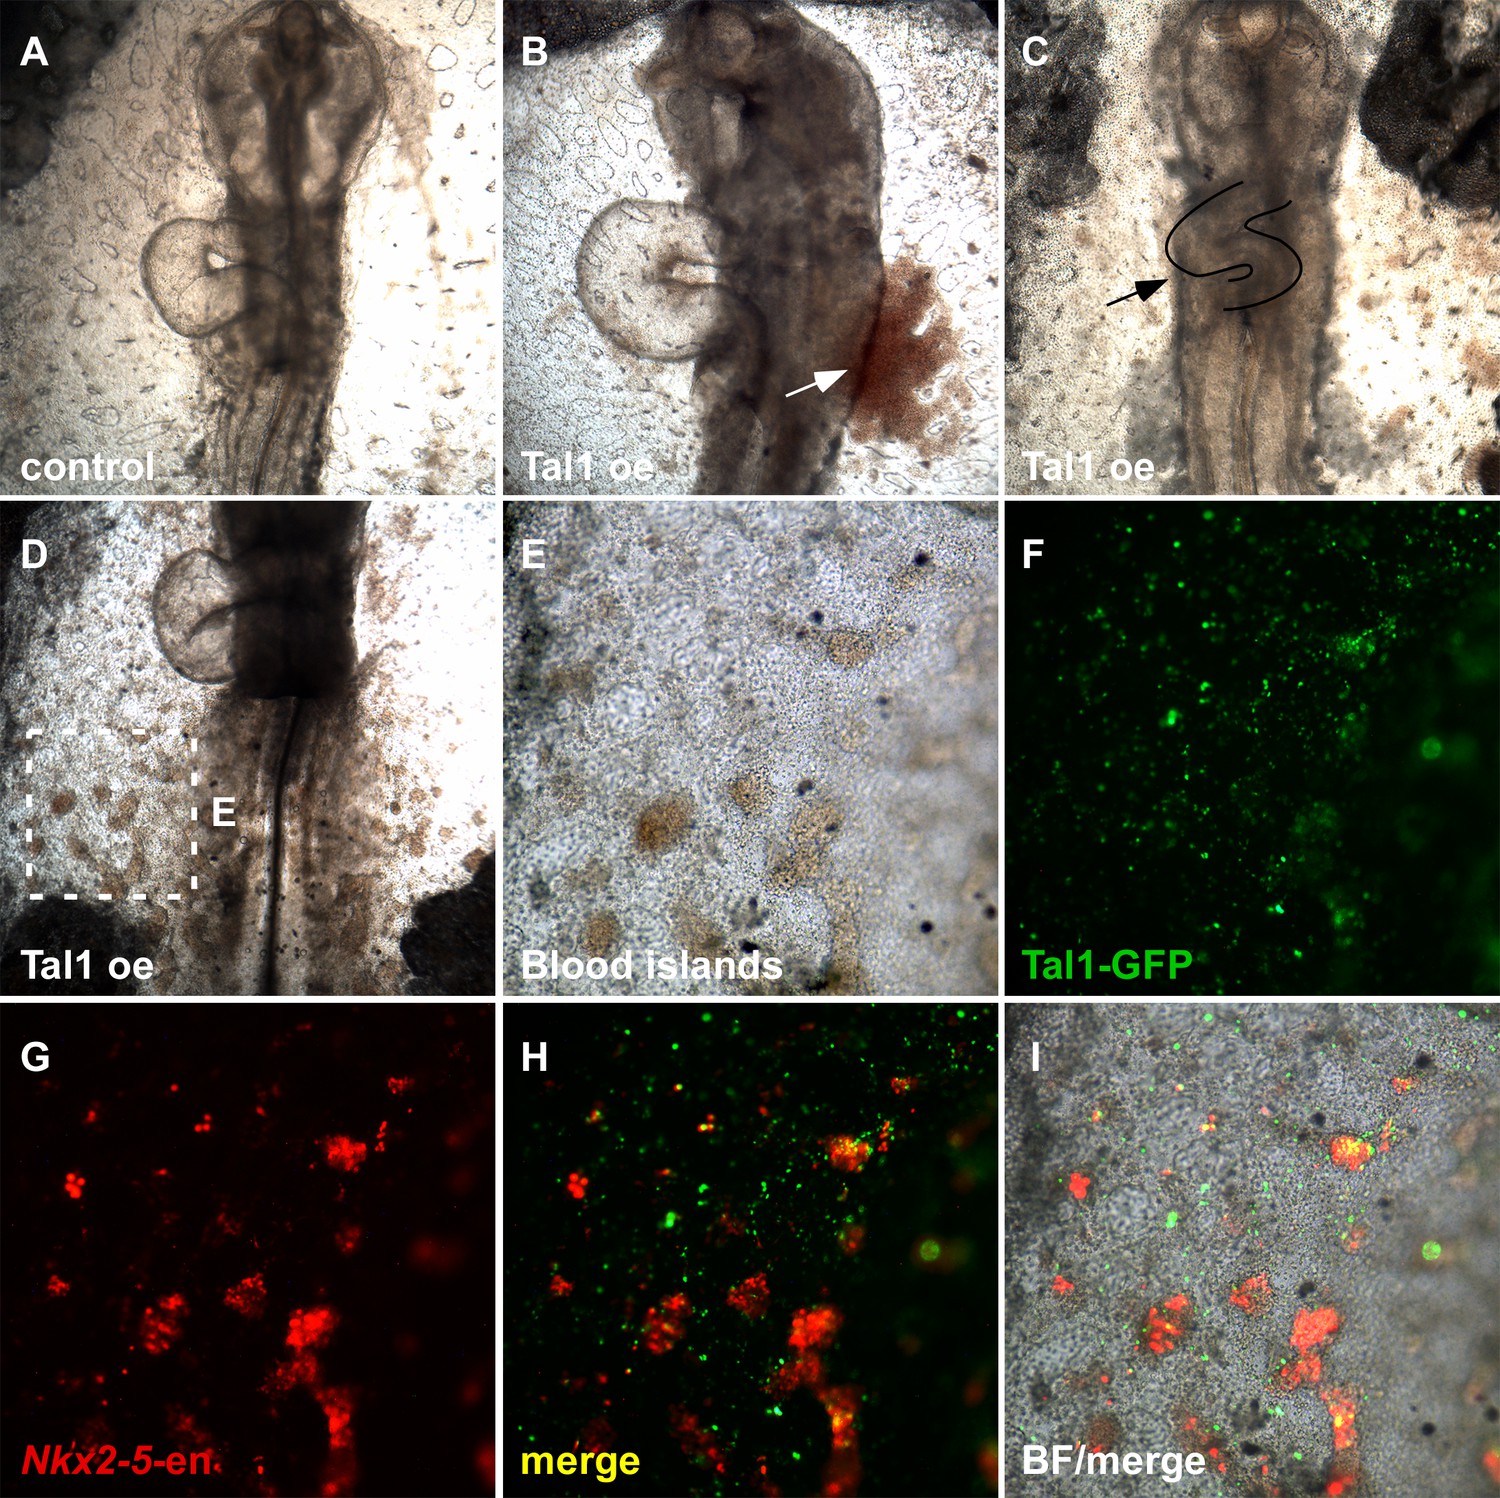
Tal1 over-expression impairs normal heart development.
(A) Control St.13 WT embryo. (B) Tal1 over-expressing embryo with edema. (C) Tal1 over-expressing embryo with defected cardiac looping and size. (D) Tal1 over-expressing embryo with ectopic intra-embryonic blood islands. (E–I) Higher magnification of the square box in D. Tal1 – GFP; Nkx2-5-en – RFP.
Figure 9 with 5 supplements
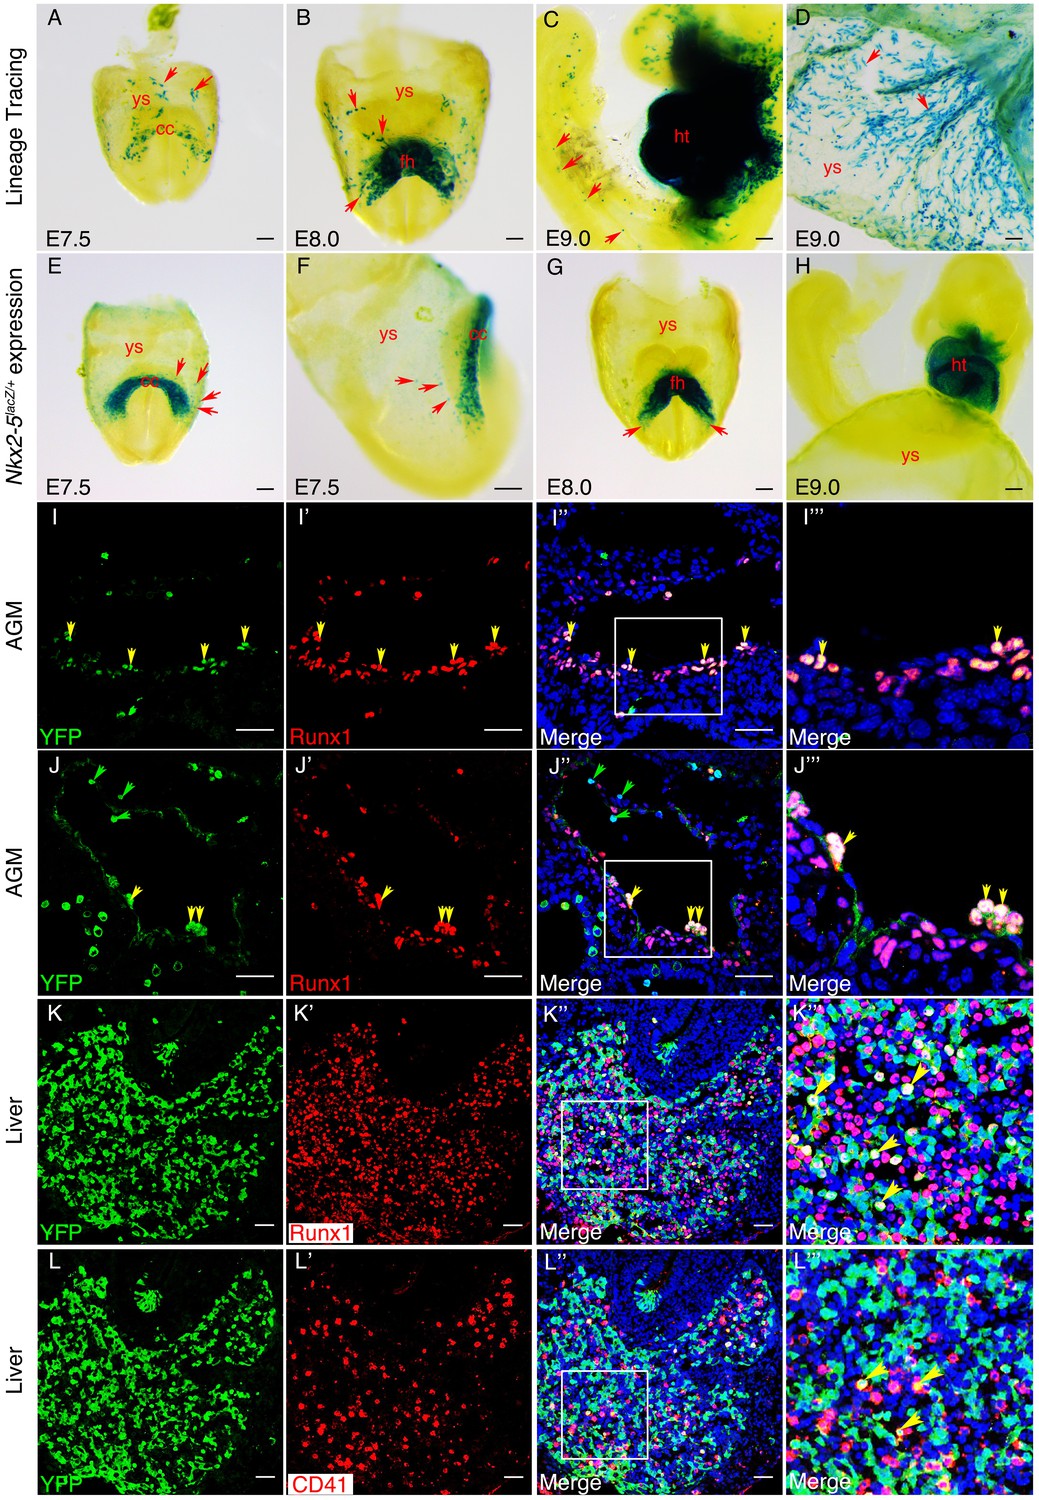
An Nkx2-5+ lineage contributes to hemogenic endothelium of the dorsal aorta in the mouse.
(A–D) Lineage tracing β-gal staining of Nkx2-5irescre;R26R embryos. (A) E7.5 showing β-gal staining beginning in the cardiac crescent (cc) and yolk sac (ys). (B) E8.0 showing β-gal staining in the forming heart (fh) and yolk sac. Red arrows in A and B indicate β-gal positive cells in the anterior half of yolk sac. (C) E9.5 showing β-gal staining in the looped heart (ht) and associated pharyngeal region extending into the head (potentially angiogenic cells or blood cells). Isolated cells are also found within the trunk and tail regions of the embryo (red arrows). (D) E9.5 showing β-gal staining in the yolk sac marking angiogenic and potentially hemoangiogenic cells within the vasculature (red arrows; see sections in Figure 9—figure supplement 1B–D’). (E–H) Nkx2-5 expression β-gal staining of Nkx2-5lacZ/+ embryos. (E–F) E7.5 showing Nkx2-5-LacZ expression in the cardiac crescent and proximal yolk sac. Red arrows show single β-gal positive cells in yolk sac in close proximity to the cardiac crescent. (G–H) E8.0 (G) and E9.0 (H) embryos showing Nkx2-5-LacZ expression in the forming heart and looped heart respectively. Red arrows show caudal parts of the cardiac zone that contain positive cells in yolk sac. (I–I’’’) E10.5 Nkx2-5irescre;ROSAYFP embryos sectioned at the level of the aorta gonad mesonephros (AGM) region and immunostained for Runx1 (red) and YFP (green). Co-labelled Runx1+ YFP+ cells are present mostly in the floor of the dorsal aorta (da). (J–J’’’) E10.5 Nkx2-5irescre;ROSAYFP embryo depicting Nkx2-5 lineage+ (YFP+) hemogenic cells (Runx1+) protruding from the endothelial layer of the dorsal aorta in the AGM region. (K–L’’’) E10.5 embryos showing co-staining for Nkx2-5-lineage+ (YFP+) and Runx1+ (K–K’’’) or CD41+ (L–L’’’) cells in the developing liver. Yellow arrows in I-K’’’ mark YFP+ Runx1+ cells and in L-L’’’ mark YFP+ CD41+ co-labelled cells. Green arrows in J and J’’ depict YFP+ Runx1- single positive cells. Scale bar: A-H - 100 µm; I-J’’ - 50 µm; K-L’’ - 100 µm.
Figure 9—figure supplement 1
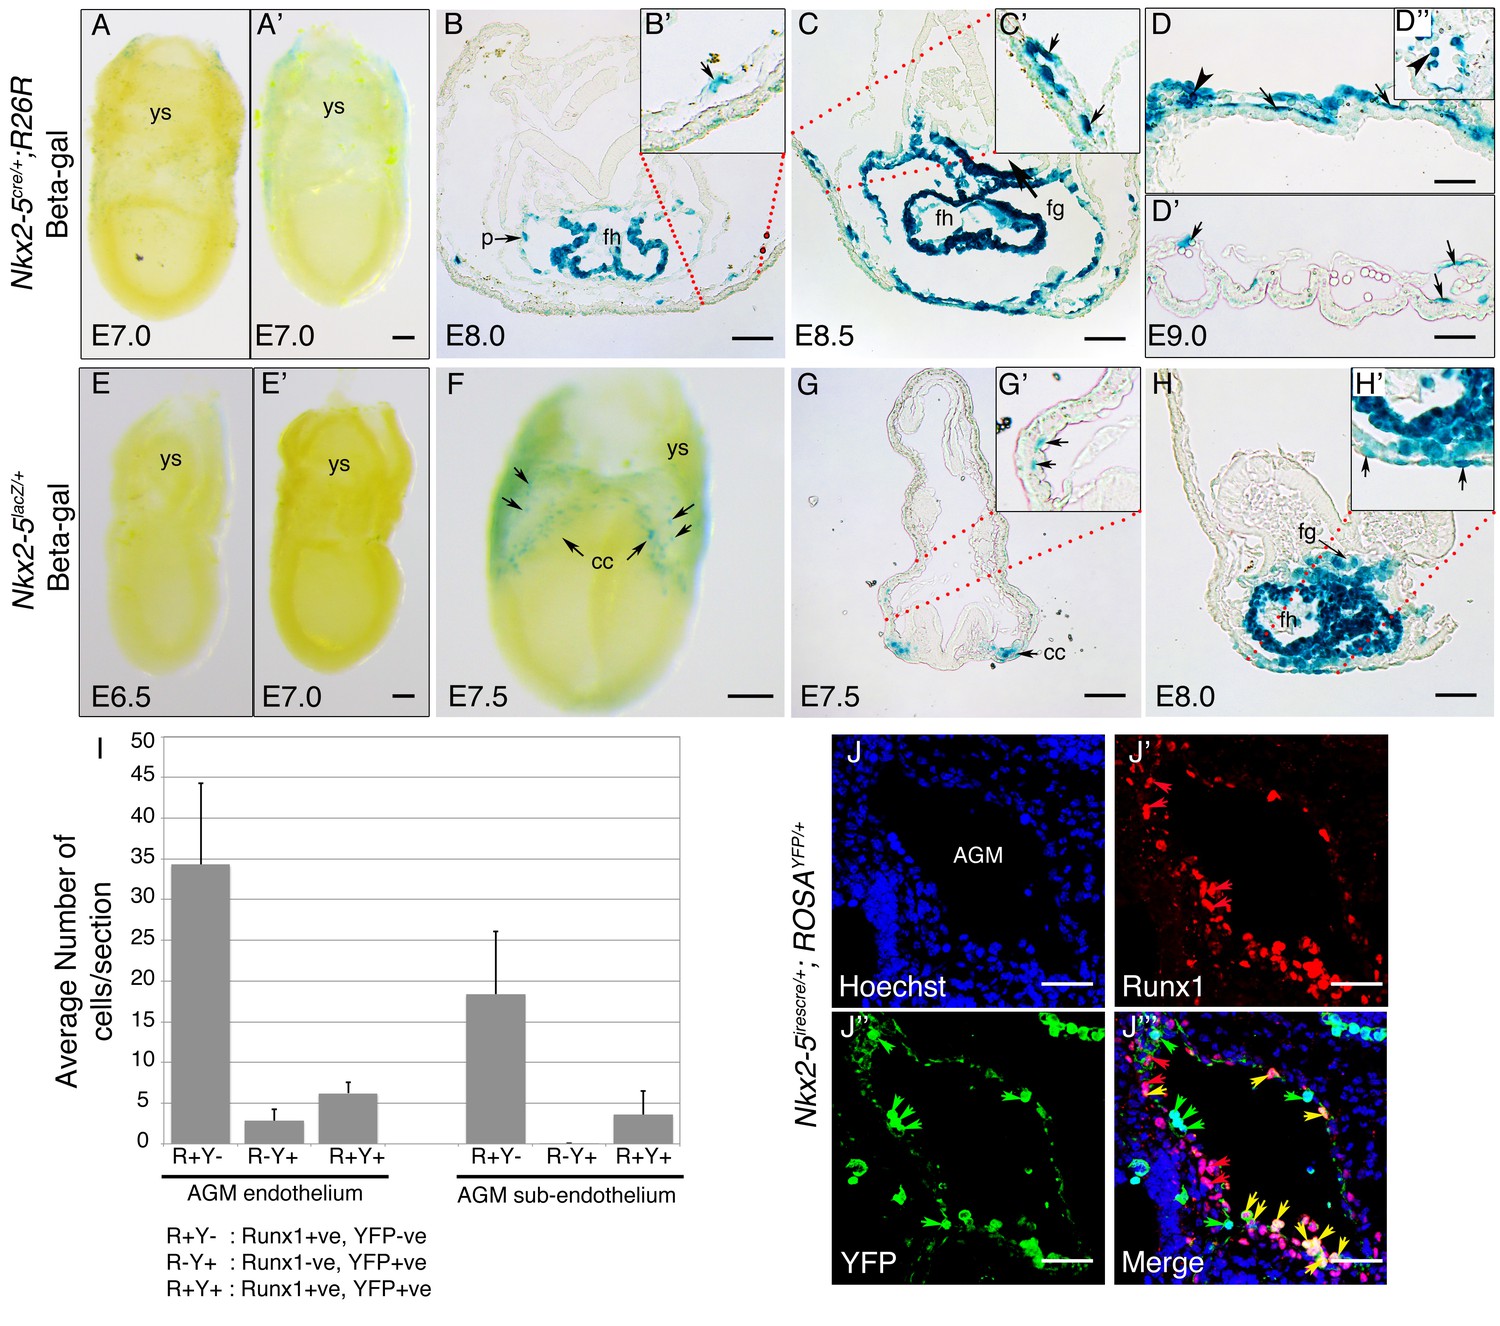
Nkx2-5 is transiently expressed in yolk sac mesoderm from cardiac crescent stages.
(A) Lateral view of whole mount β-gal staining in an E7.0 mid-gastrula-stage Nkx2-5+/+;R26R (control) embryo. Weak background is detected sporadically across the yolk sac (ys). (A’) Lateral view of an E7.0 Nkx2-5irescre/+;R26R embryo. Note lack of β-gal-positive cells in the embryo and yolk sac. (B–D’’) Cryo-sections of Nkx2-5irescre/+;R26R embryos through the forming heart (ft) and yolk sac at E8.0, E8.5, and E9.0, respectively, showing isolated β-gal-positive cells in the yolk sac vessel mesothelium. Labelling is also seen in the foregut (fg) and pericardium (p). Vessel staining is mosaic - in some vessels most or all mesothelial cells are labelled (C’, D) while in others few or none are labelled (D’). A positive blood cell within a yolk sac vessel is also shown (D; arrowhead). (D’’) Additional section showing labelled blood cells within a yolk sac vessel at E9.0 (arrowhead). (E–E’) early and mid-primitive streak stage Nkx2-5lacZ/+embryos at ~E70.0. No β-gal-positive cells are seen in the embryo or yolk sac. (F) E7.5 Nkx2-5lacZ/+embryo showing the earliest detectable labelling of in the cardiac crescent (cc) and yolk sac (arrows). (G–G’) Cryo-section of E7.5 embryos showing clusters of labelled cells in the cardiac crescent, and isolated cells embedded within the mesodermal layer of the yolk sac (arrows). (H) Cryosection through the forming heart region of E8.0 embryo showing β-gal-positive cells in yolk sac mesoderm and endoderm (arrows) only in close association with the heart. Scale bars: 100 μm. (I) Graph showing quantification of Runx1+ and YFP+ cells in the floor of the dorsal aorta in the AGM region of E10.5 Nkx2-5irescre/+;ROSAYFP/+ embryos (n = 3 embryos; average number of cells/section with standard deviation). (J–J’’’) Transverse section of E10.5 Nkx2-5irescre/+;ROSAYFP/+ embryo through the region of AGM immunostained for Runx1 (red) and Nkx2-5+ lineage traced YFP+ cells. Nuclei indicated by Hoechst. Yellow arrows mark YFP+ Runx1+ cells; red arrows mark YFP- Runx1+ cells; green arrows mark YFP+ Runx1- cells in the endothelium. Note, the majority of Runx1+ cell are YFP- both in the endothelium and sub-endothelial regions of the AGM. These stainings complement those shown in Figure 9I–J’’’ and indicate a section in which there are several Nkx2-5-lineage traced YFP+ cells that are Runx1- (quantified in panel I). Scale bar: 50 µm.
Figure 9—figure supplement 2

Nkx2-5+ lineage contributes to hemogenic endothelium of yolk sac vasculature.
Co-immunostaining of E9.0 Nkx2-5irescre;ROSAYFP (A–C’’’) and Nkx2-5irescre;Z/EG (D–E’’’) embryos. (A-B’’’; D–D’’’). Cryosections of yolk sac immunostained for YFP (green) and endothelial marker Vegfr2/Flk1 (Red). Co-localization of Nkx2-5+ lineage traced YFP+ cells and Vegfr2 was observed in the mesothelium of vessels as marked by arrows. (C-C’’’; E–E’’’). Immunostaining of yolk sac cryosections for Nkx2-5-lineage traced YFP+ cells (green) and VE-cadherin (red). Arrows depict co-localization of YFP+ cells with VE-cadherin. Scale bar: 50 µm.
Figure 9—figure supplement 3

Nkx2-5 expression in single cells of mouse E7. 0–7.75 embryos.
(A) t-SNE plots were used to visualize single cells transiting through stages of mouse mesodermal development in vivo, with cell clustering and identification of subtypes based on categorizations determined previously (left plot) (Scialdone et al., 2016). Nkx2-5 expression is shown overlaid across these populations (right plot). (B–C) The fraction of cells expressing Nkx2-5 (B) and violin plots depicting the distribution of Nkx2-5 expression levels (C) are shown for each of the nine different cell populations identified including mesodermal populations as well as epiblast and extra-embryonic ectoderm. Dashed line in C represents chosen threshold of 1 normalised read count/cell.
Figure 9—figure supplement 4

Spatial RNA-seq analysis of Nkx2-5 expression in mouse gastrula-stage embryos.
(A–C) ‘Corn plots’ showing examples of the spatial domains of Nkx2-5 expression in the epiblast, ectoderm and mesoderm of mouse embryo at different stages of gastrulation (taken from published RNA-seq data at E7.0 (n = 3) (Peng et al., 2016) and unpublished data at E6.5 (n = 4) and E7.5 (n = 3)). (A) E6.5: anterior (A) and posterior (P) halves at seven proximo-distal levels. In the example shown, only segment A3 showed expression. (B) E7.0: A, P, left (L) and right (R) quadrants at 11 proximo-distal levels (A and P only from level 1) (upper panel); and mesoderm pooled from both sides (M) and posterior epiblast quadrant containing primitive streak (P) at 12 proximo-distal levels (lower panel). (C) E7.5: A and P quadrants, left and right anterior lateral quadrants (L1, R1) and left and right posterior lateral half quadrants (L2, R2) at nine proximo-distal levels (A and P only in level 1) (upper panel); and separate left and right mesodermal wings (M1 and M2) compared to posterior ectoderm quadrant at nine proximo-distal levels (lower panel). Scales represent levels of Nkx2-5 expression as log10 of fragments per kilobase million (FPKM +1) (D) Nkx2-5 expression level (mean log10 of FPKM ± standard deviation of replicates) in the positive segments describe in (A–C) above (Peng et al., 2016). (E) Table of Nkx2-5 spatial expression values (log10 of FPKM) used to construct corn plots shown in (A–C). Segments in which there were no detectable transcripts are not shown.
Figure 9—figure supplement 5
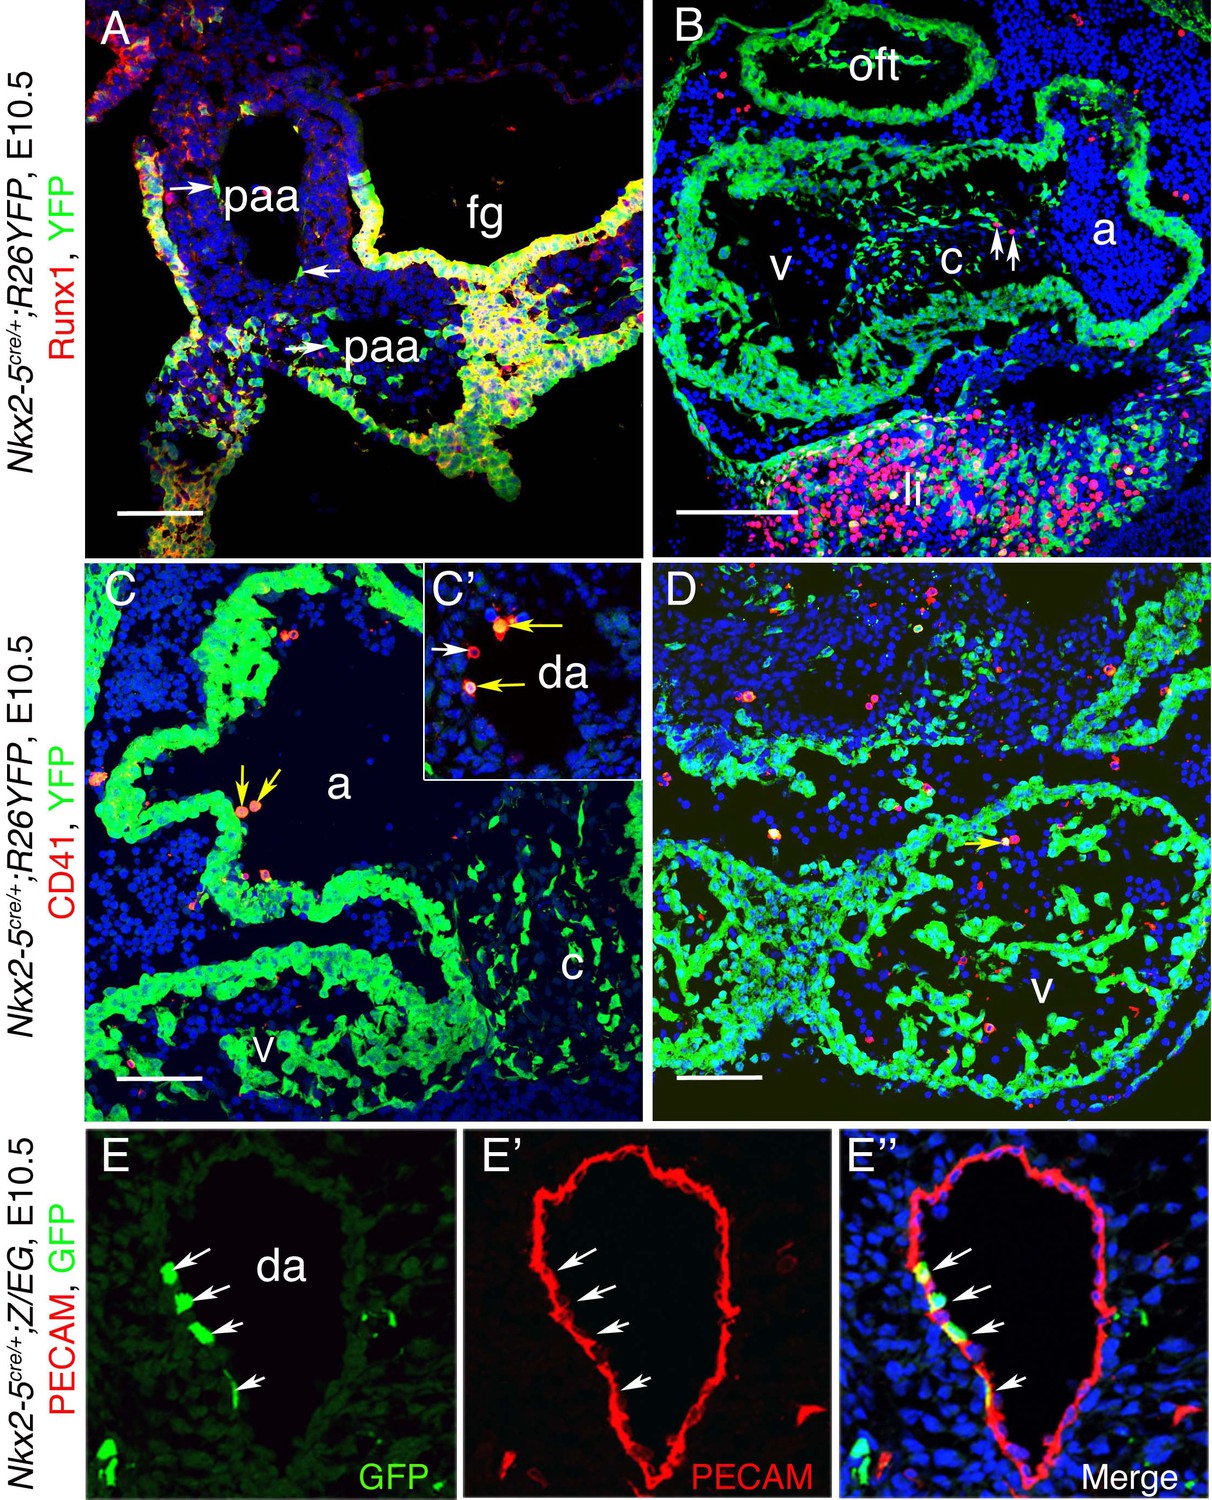
Nkx2-5 lineage+ cells in the cardio-pharyngeal region.
(A–E”) Co-immunostaining of cryo-sections from E10.5 Nkx2-5irescre; ROSAYFP (A–D) and Nkx2-5irescre;Z/EG (E–E”) embryos. (A) Section showing Nkx2-5 lineage traced cells (YFP+) in the endothelium of the pharyngeal arch arteries (paa) and endoderm of foregut (fg). In pharyngeal arch arteries, YFP+ cells do not express Runx1 (white arrows), however note co-expression of YFP and Runx1 in the foregut floor and ectoderm lateral to one pharyngeal arch artery. (B) Nkx2-5 lineage traced YFP+ cells contribute extensively to the myocardium of outflow tract (oft), atrium (a), ventricle (v) and atrio-ventricular cushion tissue (c), as well as liver (li). Few Runx1+YFP- cells were observed in cushion tissues (arrows) which are potentially blood cells. Other Runx1+YFP- blood cells can be seen within the atrium and pericardium (haemorrhaged during preparation). (C–D) CD41+YFP+ endothelial (and potentially hemogenic) cells observed in the atrium, ventricles and paired anterior dorsal aorta (da) (yellow arrows). One double positive cell in the atrium may be in the process of extrusion into the lumen. One CD41+YFP- cell is also shown (white arrow). (E–E”) Co-immunostaining demonstrates Nkx2-5 lineage traced GFP+ cells embedded within Pecam1+ endothelial cells of anterior dorsal aorta (white arrows). Scale bar: A-D; 100 µm.
Figure 10
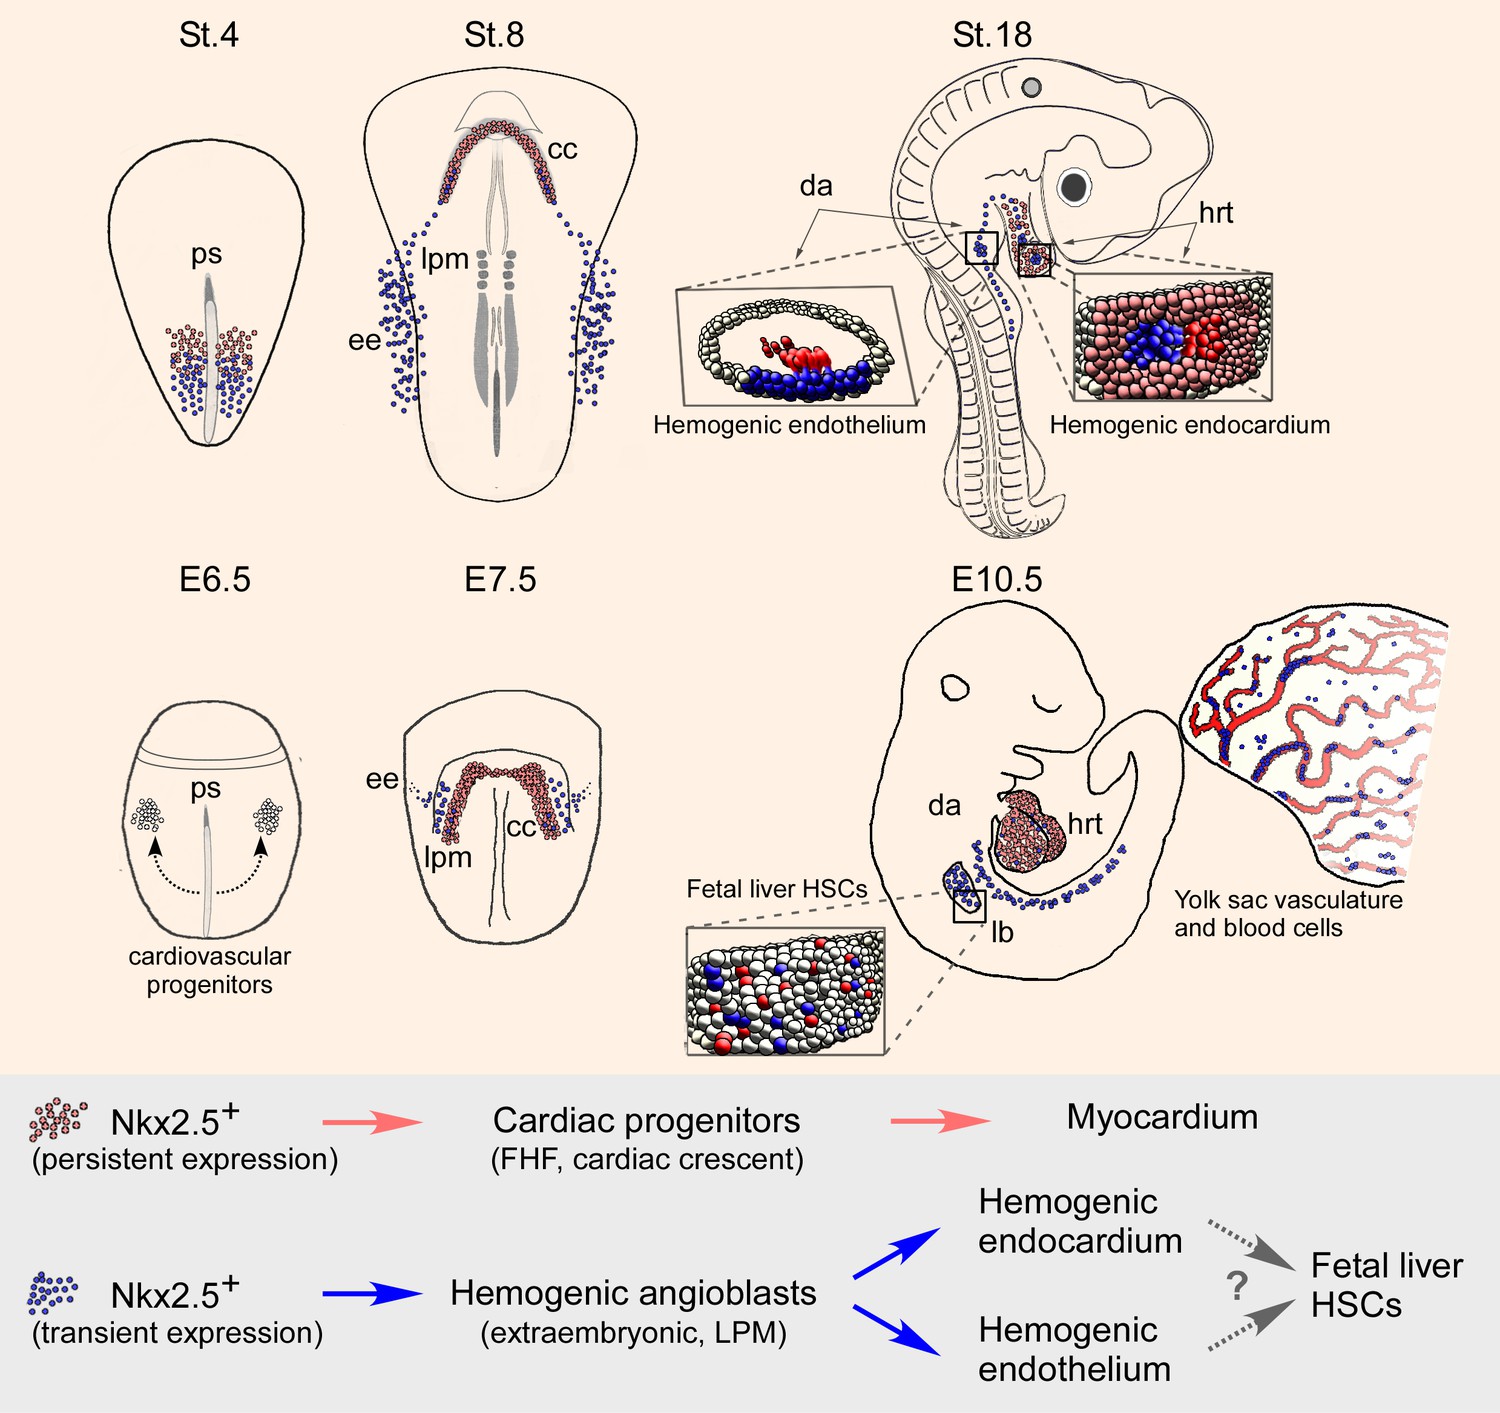
Nkx2.5 marks hemogenic angioblasts that contribute to the formation of the endocardium and dorsal aorta.
Cardiovascular progenitors begin to form at the onset of gastrulaion. These populations segregate as the cells begin to migrate in a lateral fashion towards the extraembryonic tissue. During early gastrulation in the chick (St.4) or late gastrula stages in the mouse (cardiac crescent, E7.5) Nkx2.5+ hemogenic angioblasts are specified. While Nkx2.5 expression is maintained at the cardiac crescent its expression in the hemogenic angioblasts is downregulated. Nkx2.5 lineage-derived cells populate the cardiac crescent, extraembryonic tissue and lateral plate mesoderm in both species (St.8 and E7.5). As the embryo develops Nkx2.5 derived hemogenic angioblasts migrate to the endocardium and dorsal aorta, there generating blood cells via the hemogenic endothelium (St.18 and E10.5). In both chick and mouse Nkx2.5 lineage derived cells contribute massively to the yolk sac vasculature and to HSCs in the fetal liver (mouse). CC – cardiac crescent; DA – dorsal aorta; EE – extraembryonic; FHF – first heart field; hrt – heart; LB – liver bud; LPM – lateral plate mesoderm; PS – primitive streak.
Videos
Video 1
Time lapse movie of a developing embryo expressing the Isl1 enhancer.
Relates to Figure 1. An embryo electroporated with the Isl1-en (GFP) plasmid at St. 3. The time-lapse video follows from St.5to St.11 when the heart tube has already formed and the embryo has begun to turn. oft: outflow; inf: inflow.
Video 2
Time lapse movie of a developing embryo co-expressing the Nkx2-5 and Isl1 enhancers.
Relates to Figure 2. A St. 3 embryo was co-electroporated with the Isl1-en (RFP) and Nkx2-5-en (GFP) plasmids. The embryo was cultured overnight and time-lapse analysis started at St.6. The embryo was allowed to grow to St.11–12 when the heart tube is visible and begins to loop. The BF channel was omitted from the movie to enhance the visibility of distinct cardio-vascular progenitor populations. cc: cardiac crescent; lpm: lateral plate mesoderm; ee: extraembryonic; da: dorsal aorta; shf: second heart field.
Video 3
Time lapse movie of a developing embryo expressing the Hb enhancer.
Relates to Figure 4. A St.3 embryo electroporated with the Hb-en plasmid (GFP) and cultured overnight. The movie covers the development of the embryo between St.6 to St. 11–12. The BF and GFP channels were merged to better assess the migration of cells towards the inflow of the heart. Hb: hemangioblast; ee: extraembryonic; cc: cardiac crescent; nt: neural tube; hn; hensen’s node; ap: area pellucida; da: dorsal aorta; oft: outflow; inf: inflow.
Video 4
Time lapse movie of a developing embryo co-expressing the Hb and Nkx2-5 enhancers.
Relates to Figure 4. A St.3 embryo electroporated with both the Hb-en (GFP) and Nkx2-5-en (RFP) plasmids subsequently cultured overnight. The movie covers the development of the embryo between St.6 to St.11. The GFP and RFP channels were merged to visualize the migration of Hb-en+/Nkx2-5-en+ cells towards the inflow and the yolk sac.
Download links
A two-part list of links to download the article, or parts of the article, in various formats.
Downloads (link to download the article as PDF)
Open citations (links to open the citations from this article in various online reference manager services)
Cite this article (links to download the citations from this article in formats compatible with various reference manager tools)
Nkx2.5 marks angioblasts that contribute to hemogenic endothelium of the endocardium and dorsal aorta
eLife 6:e20994.
https://doi.org/10.7554/eLife.20994


