Coincident postsynaptic activity gates presynaptic dopamine release to induce plasticity in Drosophila mushroom bodies
- Tokyo Metropolitan Institute of Medical Science, Japan
Figures
Figure 1 with 1 supplement

Synaptic vesicle exocytosis upon stimulation of the ALs and AFV.
(A) Schematic diagram of the stimulation/recording system. (B) Fluorescent images of a representative MB-LexA,LexAop-R-GECO1/UAS-spH, GH146-GAL4 brain. (C) AL stimulation induced Ca2+ responses in the MBs, and evoked vesicle exocytosis from PN terminals of the PNs. Left panel, the time course of spH and R-GECO1 fluorescence changes upon AL stimulation. spH fluorescence changes upon AL stimulation (green) and background (black) were measured in the MB calyces (typical images are shown in middle panels), and R-GECO1 fluorescence (red) was measured at the terminals of the MB vertical lobes. The gray bar in the right panel indicates AL stimulation. Right panel, spH responses were obtained by subtracting background fluorescence changes from stimulation-evoked fluorescence changes. One-way ANOVA indicates significant differences in fluorescence (F3,40 = 4.769, p=0.006). N = 11. (D) Fluorescent images of a MB-LexA,LexAop-R-GECO1/UAS-spH;TH-GAL4/+ brain. (E) AFV stimulation did not evoke exocytosis from TH-DA neuron terminals. Left panel, time course of spH and R-GECO1 fluorescence changes upon AFV stimulation. Middle panels, typical images of spH fluorescence changes at TH-DA neuron terminals on the vertical MB lobes. Right panel, one-way ANOVA indicates no significant differences in spH fluorescence (F3,36 = 0.061, p=0.980). N = 10. (F) Fluorescent images of a MB-LexA,LexAop-R-GECO1/UAS-spH;GMR51C07-GAL4/+ brain. (G) AFV stimulation evoked vesicle exocytosis at glutamatergic terminals at the tip of vertical MB lobes. Changes in spH and R-GECO1 fluorescence produced upon AFV stimulation. Right panel, One-way ANOVA indicates significant differences in spH flurorescence (F3,20 = 4.927, p=0.010). N = 6.
Figure 1—figure supplement 1

Activity of glutamatergic neurons is required for normal STM.
(A) When GMR51C07-GAL4/UAS-shits flies are trained and tested at the permissive temperature, 15 min memory is unaffected compared to controls. (B) when these flies are trained at a restrictive temperature (30°C) and tested at the permissive temperature, 15 min memory is significantly reduced.
Figure 2 with 1 supplement

NR activation can substitute for AFV stimulation during LTE induction.
(A) AFV-evoked Ca2+ responses in the MBs are significantly diminished in Nmdar1EP331 mutants. Upper panel, typical images of G-CaMP fluorescence immediately after AFV stimulation in MB-LexA, LexAop-G-CaMP2 (control) and MB-LexA, LexAop-G-CaMP2; Nmdar1EP331 mutants. (B) LTE induced by AL+AFV stimulation is abolished in Nmdar1 mutants. The upper panels show a schematic diagram of the LTE induction protocol, and typical traces of AL-induced Ca2+ responses before and 15 min after induction. Arrowheads indicate AL-stimulation. Lower panels, one-way ANOVA indicates significant LTE in controls (filled columns, F3,20 = 9.347, p<0.001) but not in Nmdar1 mutants (blank columns, F3,20 = 0.621, p=2.900). N = 6. (C) Schematic of LTE induction by simultaneous AL stimulation and puff application of NMDA (AL + NMDA). Dotted lines in the lower panel indicate the position of a micropipette. (D) LTE induced by simultaneous AL stimulation and NMDA application. One-way ANOVA indicates significant LTE upon AL + NMDA (F2,18 = 6.062, p=0.010, N = 7) but not upon NMDA puff alone (F2,18 = 1.470, p=0.256, N = 7). (E) Expressing Nmdar2-IR in the MBs from the OK107-GAL4 driver (MB-LexA, LexAop-G-CaMP2/+; UAS-Nmdar2-IR/+; OK107-GAL4/+) abolishes LTE. Left panel, one-way ANOVA did not identify significant differences between time points (F2,15 = 0.031, p=0.969, N = 6). One-way ANOVA indicates significant LTE in control flies containing the OK107-GAL4 driver alone (F2,12 = 5.169, p=0.024 for GAL4 alone, N = 5), or the UAS-Nmdar2-IR construct alone (F2,15 = 11.388, p<0.001, N = 6).
Figure 2—figure supplement 1
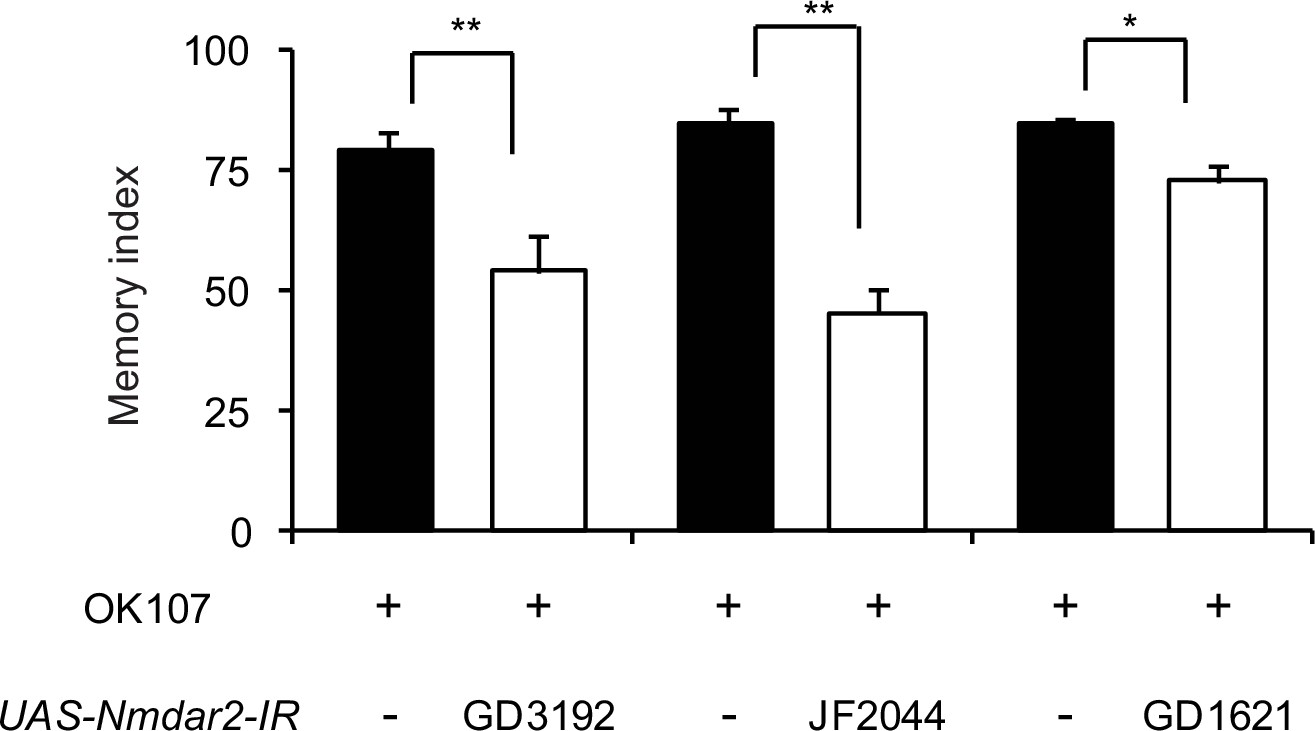
NRs in the MBs are required for normal learning.
Knocking down NRs in the MBs by expressing different inverted repeats of Nmdar2 (Nmdar2-IR) from the OK107-GAL4 driver reduces 3 min memory compared to driver alone controls.
Figure 3
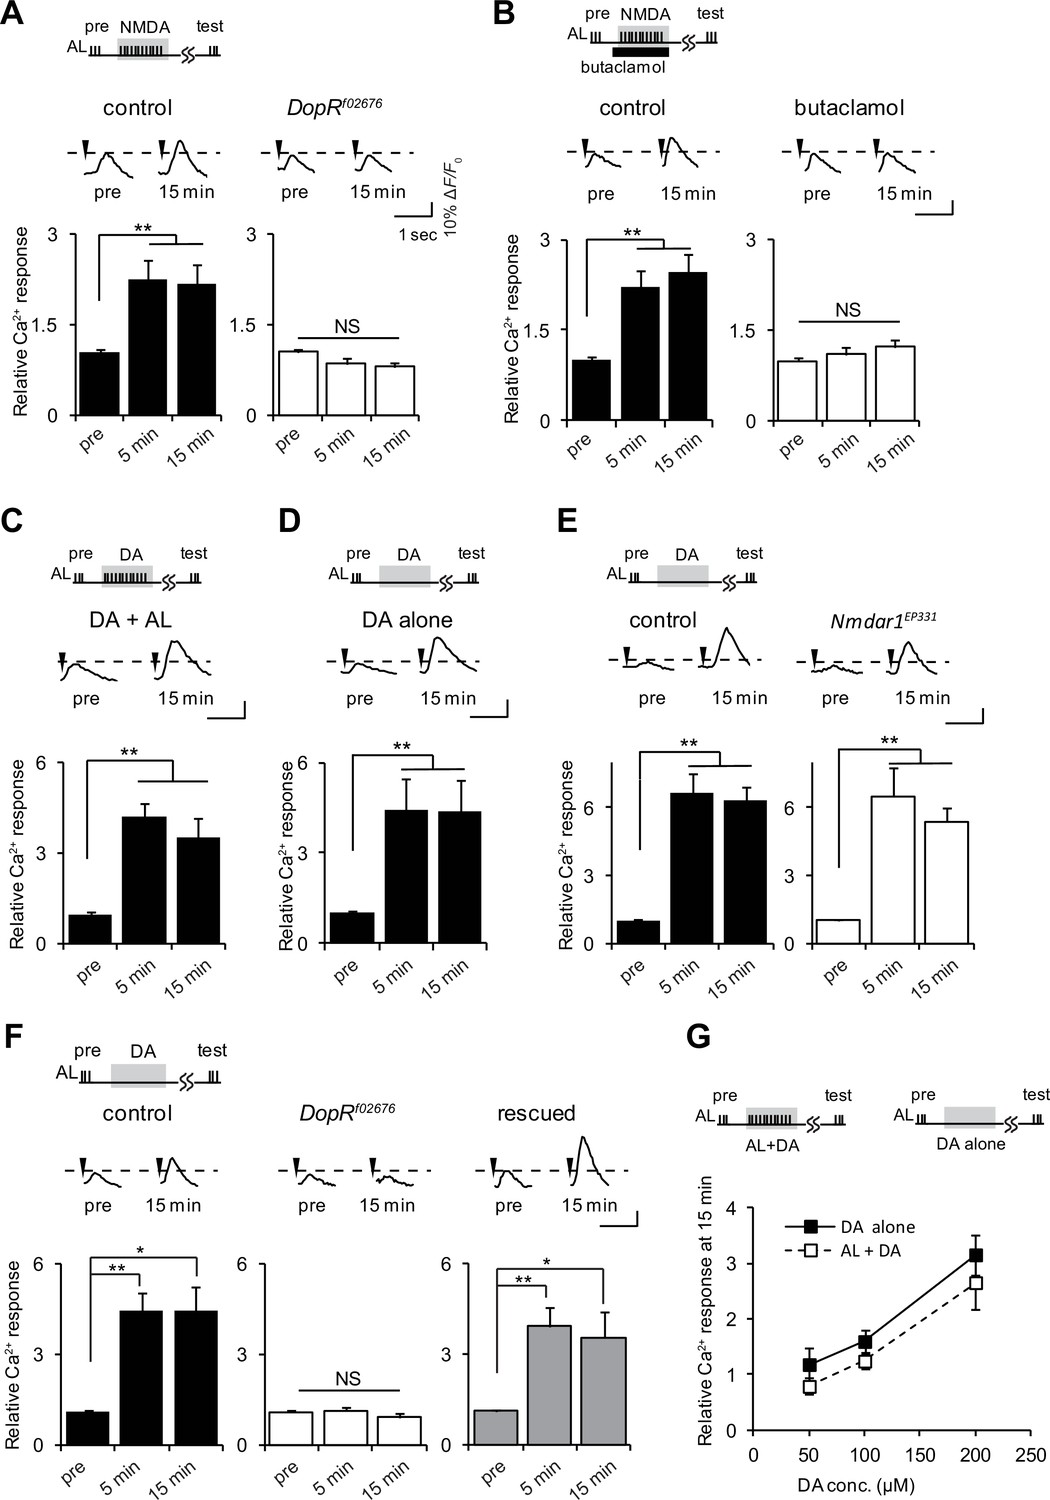
D1R activation is necessary and sufficient to induce LTE.
(A) DopRf02676 mutations suppress LTE induced by AL + NMDA stimulation. Left panel, MB-LexA, LexAop-G-CaMP2/+, one-way ANOVA (F2,18 = 5.932, p<0.001). Right panel, MB-LexA, LexAop-G-CaMP2/+; DopRf02676, one-way ANOVA (F2,18 = 3.479, p=0.053). N = 7 for both genotypes. (B) LTE induced by AL + NMDA stimulation in MB-LexA, LexAop-G-CaMP2 brains is abolished by the addition of the D1R antagonist 10 min prior to AL + NMDA stimulation. Control, F2,15 = 22.148, p<0.001, butaclamol, F2,15 = 0.334, p=0.801, N = 6 for all data. (C) LTE is induced by simultaneous AL + DA stimulation in c309-GAL4; UAS-G-CaMP brains, F2,18 = 5.374, p=0.015, N = 7. (D) LTE can be induced by application of DA alone. One-way ANOVA (F2,18 = 25.306, p<0.001, N = 7). (E) DA-induced LTE in Nmdar1EP331 mutants is indistinguishable from DA-induced LTE in controls. Left panel, MB-LexA, LexAop-G-CaMP2/+, one-way ANOVA (F2,18 = 22.591, p<0.001, N = 7). Right panel, MB-LexA, LexAop-G-CaMP2/+; Nmdar1EP331, one-way ANOVA (F2,15 = 10.335, p=0.002, N = 6). (F) DA-induced LTE is restored in DopRf02676 mutants by expressing a DopR transgene in the MBs. Control (MB-LexA, LexAop-G-CaMP2/+), one-way ANOVA (F2,15 = 8.261, p=0.004). DopRf02676 (MB-LexA, LexAop-G-CaMP2/+; DopRf02676), one-way ANOVA (F2,15 = 0.111, p=0.351). Rescude (MB-LexA, LexAop-G-CaMP2/c747-GAL4; DopRf02676), one-way ANOVA (F2,15 = 5.556, p=0.016). N = 6. (G) LTE induced by DA alone is indistinguishable from LTE induced by AL + DA stimulation. Peak LTE responses plotted as a function of DA concentration. Two-way ANOVA demonstrated significant differences in Ca2+ responses due to DA concentration (F2,30 = 22.49, p<0.0001), but no differences due to the stimulation protocol (DA alone versus DA + AL, F1,30 = 2.869, p=0.1007, N = 6).
Figure 4
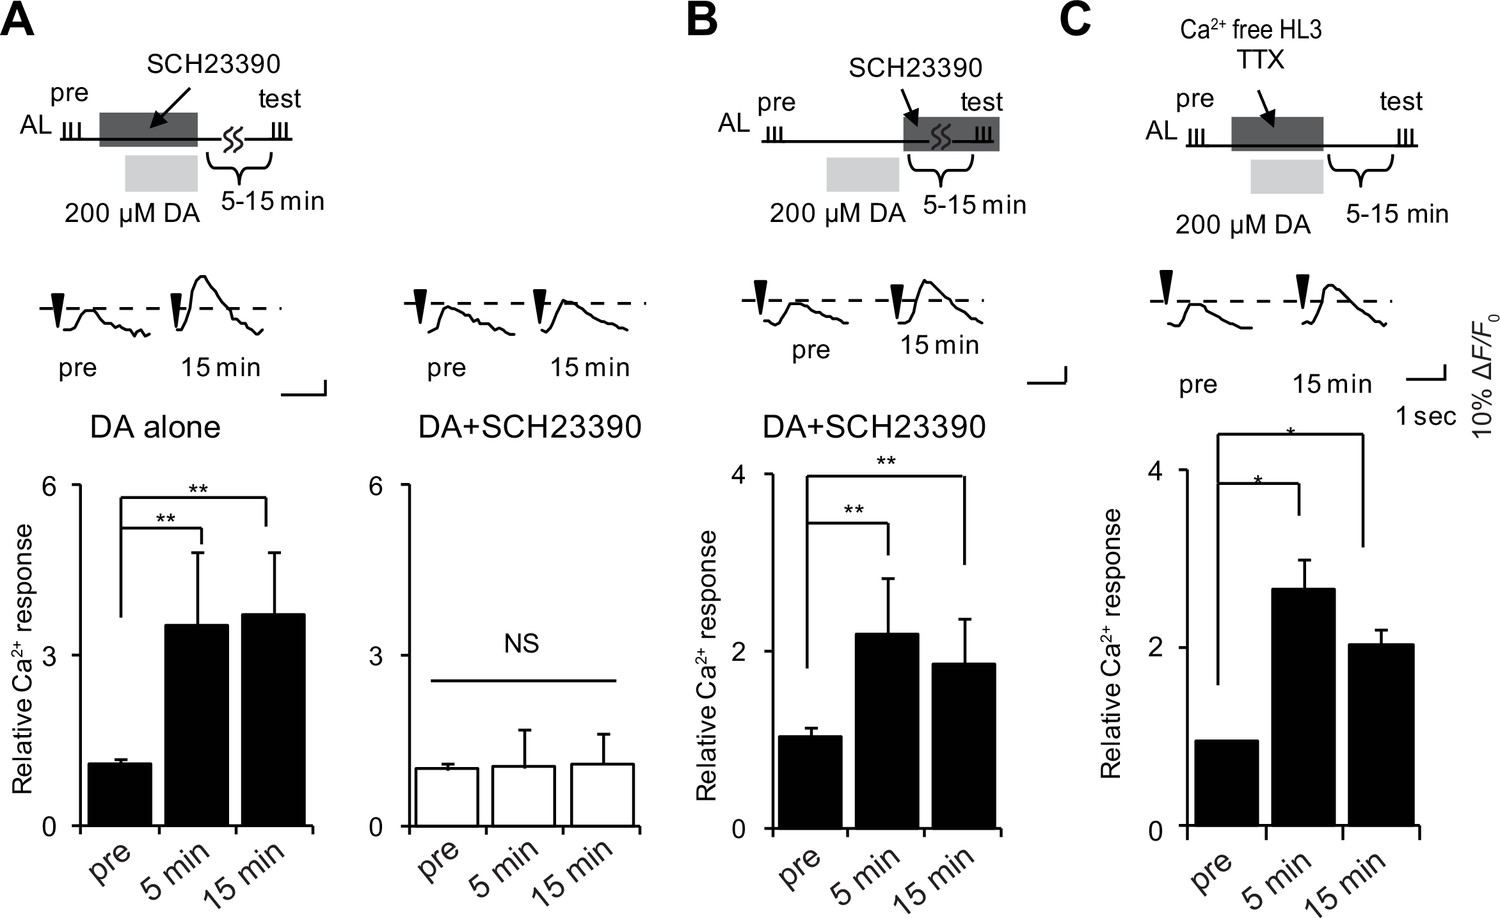
DA is required for induction but not maintenance or expression of LTE.
(A) DA-induced LTE was abolished by applying 100 μM SCH23390 10 min prior to treatment with 200 μM DA in c309-GAL4; UAS-G-CaMP brains. One-way ANOVA indicates significant differences between time points in DA alone (F2,15 = 11.050, p=0.001) but not in DA + SCH23390 (F2,15 = 0.051, p=0.950). N = 6. (B) LTE was unaffected when SCH23390 was applied immediately after DA treatment in c309-GAL4; UAS-G-CaMP brains. One-way ANOVA indicates significant differences between time points (F2,15 = 14.745, p=<0.001, N = 6). (C) DA-induced LTE was not suppressed in external Ca2+ free solution containing 1 mM EGTA and 100 nM tetrodotoxin (TTX) in c309-GAL4; UAS-G-CaMP brains. One-way ANOVA indicates significant differences between time points in control (F2,15 = 9.926, p=0.002, N = 6).
Figure 5
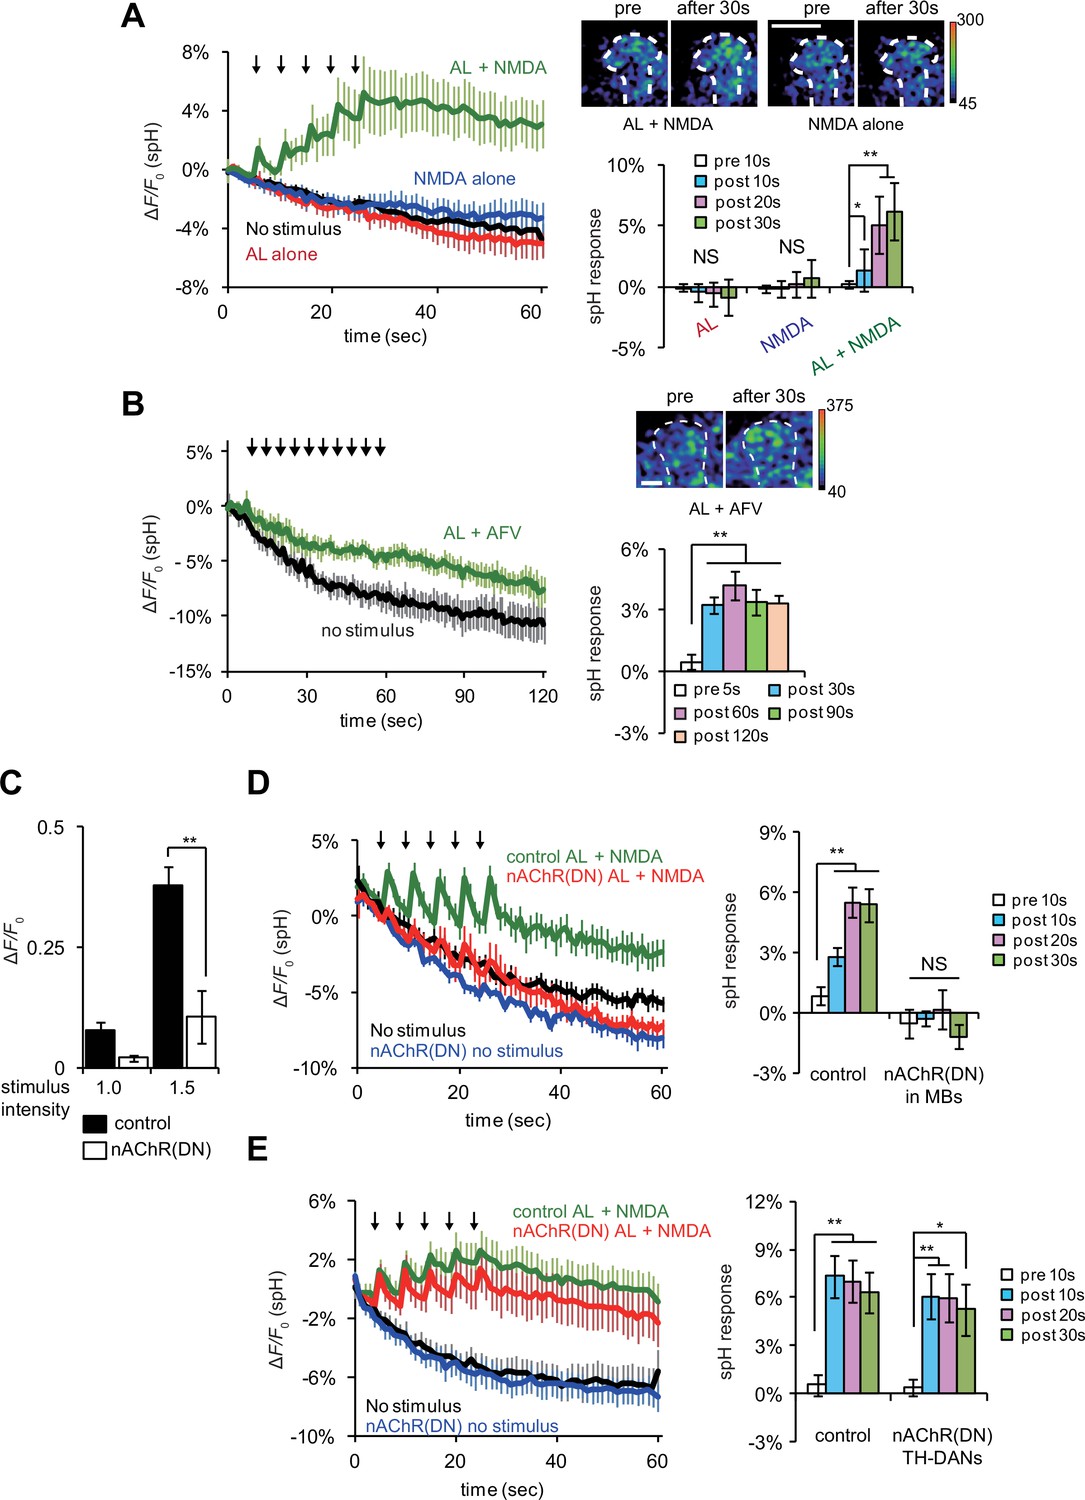
Coincident AL stimulation and NMDA application induces DA release.
(A) Time course of spH fluorescence changes and quantification of spH responses at TH-DA terminals on the vertical lobes of the MBs upon indicated treatments. Brains were first exposed to 100 µM NMDA for 1 min while spH fluorescence was scanned (blue traces). Following washout and a 3 min interval, spH fluorescence was scanned while brains were subjected to 5 trains of AL stimulation (red traces). After another 3 min interval, spH fluorescence was scanned while brains were exposed simultaneously to NMDA and AL stimulation (green traces). Black traces show spH fluorescence in the absence of stimulation. Arrows represent AL stimulation. One-way ANOVA indicates significant differences between time points upon AL + NMDA stimulation (F4,25 = 6.593, p=0.001, N = 6). (B) Time course of spH fluorescence changes and quantification of spH responses at TH-DA terminals induced by AL + AFV stimulation. One-way ANOVA indicates significant differences between time points (F4,25 = 6.593, p=0.001, N = 6). (C) Ca2+ responses in the MBs upon AL stimulation are inhibited by expressing dominant negative nAChRs, nAChR(DN)s, in the MBs. Control, UAS-G-CaMP3/+;;OK107 and nAChR(DN), UAS-G-CaMP3/UAS- nAChRα7Y195T;;OK107. Stimulus intensities of 1.0 and 1.5 refer to pulse durations of 1.0 and 1.5 ms, respectively. Two-way ANOVA indicates significant differences due to stimulus intensity (F1,20 = 20.58, p=0.0002) and genotype (F1,20 = 28.7, p<0.0001). N = 6 for all genotypes. (D) Expression of nAChR(DN)s in MB neurons abolishes AL + NMDA stimulation-induced DA release. One-way ANOVA indicates significant differences between time points upon AL + NMDA stimulation in control (F3,32 = 11.888, p<0.001) but not nAChR(DN) brains (F3,32 = 0.664, p=0.058). (E) Expression of nAChR(DN)s in TH-DA neurons does not affect the DA release induced by AL + NMDA stimulation. Control, UAS-spH/+; TH-GAL4/+ and nAChR DN, UAS-spH/ UAS-nAChRα7Y195T; TH-GAL4. One-way ANOVA indicates significant differences between time points upon AL + NMDA stimulation in control (F3,28 = 9.59, p=0.0002) and nAChR DN brains (F3,28 = 3.45, p=0.0298). N = 8 for all genotypes.
Figure 6

LTE and DA release require Rut-Ac activity in the MBs.
(A) LTE induced by simultaneous AL + AFV stimulation is suppressed in rut mutants. N = 7 for both control (MB-LexA, LexAop-G-CaMP2) and rut mutants (rut2080; MB-LexA, LexAop-G-CaMP2). (B) DA release induced by AL + NMDA stimulation is abolished in rut mutants. Time course of spH fluorescent changes at TH-DA terminals in controls (LexAop-spH/+; TH-LexA/+), and rut2080 mutants (rut2080; LexAop-spH/UAS-rut; TH-LexA/+) upon AL + NMDA stimulation. N = 8 for all genotypes. (C) MB expression of rut+ restores DA release upon AL + NMDA stimulation. The time course of spH fluorescent changes and spH responses at TH-DA terminals in rut2080 mutants expressing a rut+ transgene in the MBs (rut2080; LexAop-spH/UAS-rut; TH-LexA/30Y-GAL4) upon AL + NMDA stimulation. N = 8. (D) spH responses upon AL + NMDA stimulation in indicated lines. Two-way ANOVA indicates significant differences due to time point (F3,84 = 6.69, p<0.0164) and genotype (F2,84 = 34.70, p<0.0001). N = 9 for all genotypes.
Figure 7
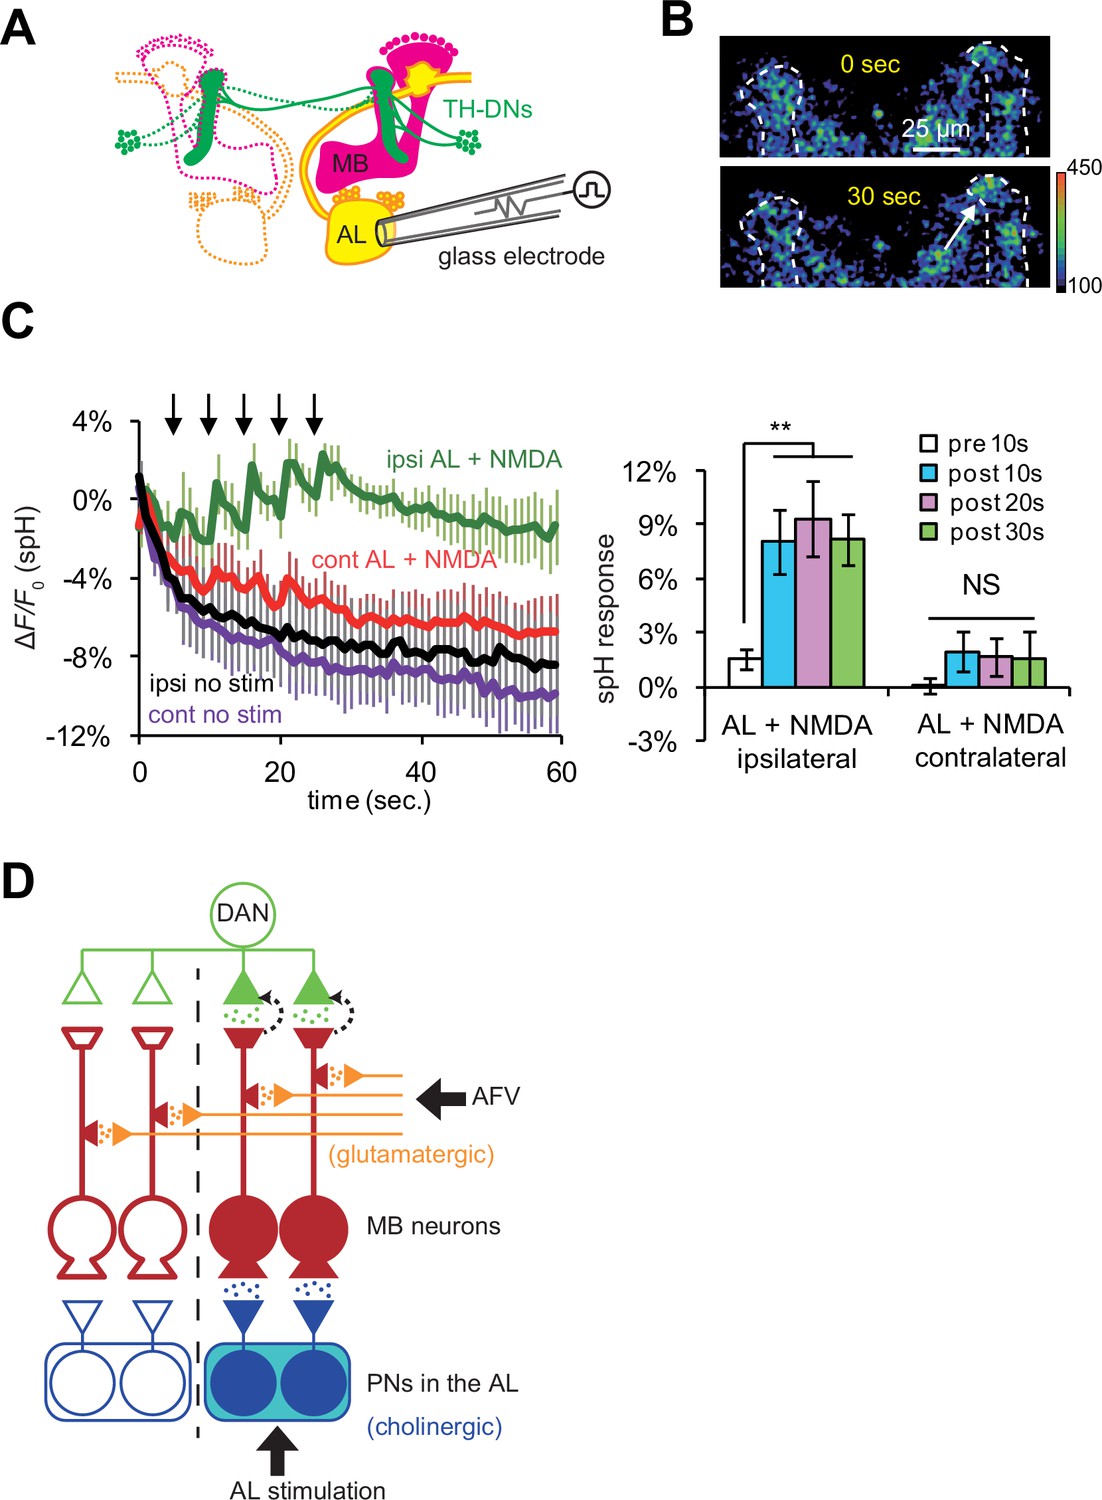
DA release is restricted to coincidentally postsynaptic MB neurons.
(A) Schematic diagram of the connections between ALs, MBs, and TH-DA neurons. PNs (yellow) connect ALs only to ipsilateral MB calyces, whereas DA neurons (green) innervate MBs bilaterally. (B) Typical fluorescence images of spH at TH-DA neuron terminals on the vertical lobes 0 s and 30 s after AL + NMDA stimulation. The arrow indicates the vertical lobe of the MB (dotted lines) ipsilateral to the stimulated AL. (C) Left panel, changes in spH fluorescence at TH-DA terminals on ipsilateral and contralateral MB lobes receiving coincident AL + NMDA stimulation. N = 5. Right panel, one-way ANOVA indicates significant differences in spH fluorescence in the ipsilateral MB (F3,16 = 5.333, p=0.001), but not the contralateral MB (F3,16 = 0.458, p=0.716). N = 5. (D) Proposed model of a cellular circuit regulating DA release and LTE formation. Simultaneous activation of cholinergic AL inputs (blue) and glutamatergic AFV inputs (orange) to MB neurons activates a gating mechanism that allows DA (green dots) to be released onto these coincidently activated MB neurons. DA is not released onto MB neurons that only receive single inputs. PNs and ALs are outlined in blue, MB neurons are outlined in red, inputs from the AFV are shown in orange, and a DA neuron is shown in green. Released glutamate from AFV inputs and acetylcholine from PNs are shown by orange dots and blue dots, respectively. Filled areas represent activated (depolarized) regions.
Download links
A two-part list of links to download the article, or parts of the article, in various formats.
Downloads (link to download the article as PDF)
Open citations (links to open the citations from this article in various online reference manager services)
Cite this article (links to download the citations from this article in formats compatible with various reference manager tools)
Coincident postsynaptic activity gates presynaptic dopamine release to induce plasticity in Drosophila mushroom bodies
eLife 6:e21076.
https://doi.org/10.7554/eLife.21076


