Sec24 phosphorylation regulates autophagosome abundance during nutrient deprivation
- University of California, San Diego, United States
- Columbia University, United States
- University of Pittsburgh School of Medicine, United States
- MRC Laboratory of Molecular Biology, United Kingdom
Figures
Figure 1 with 2 supplements
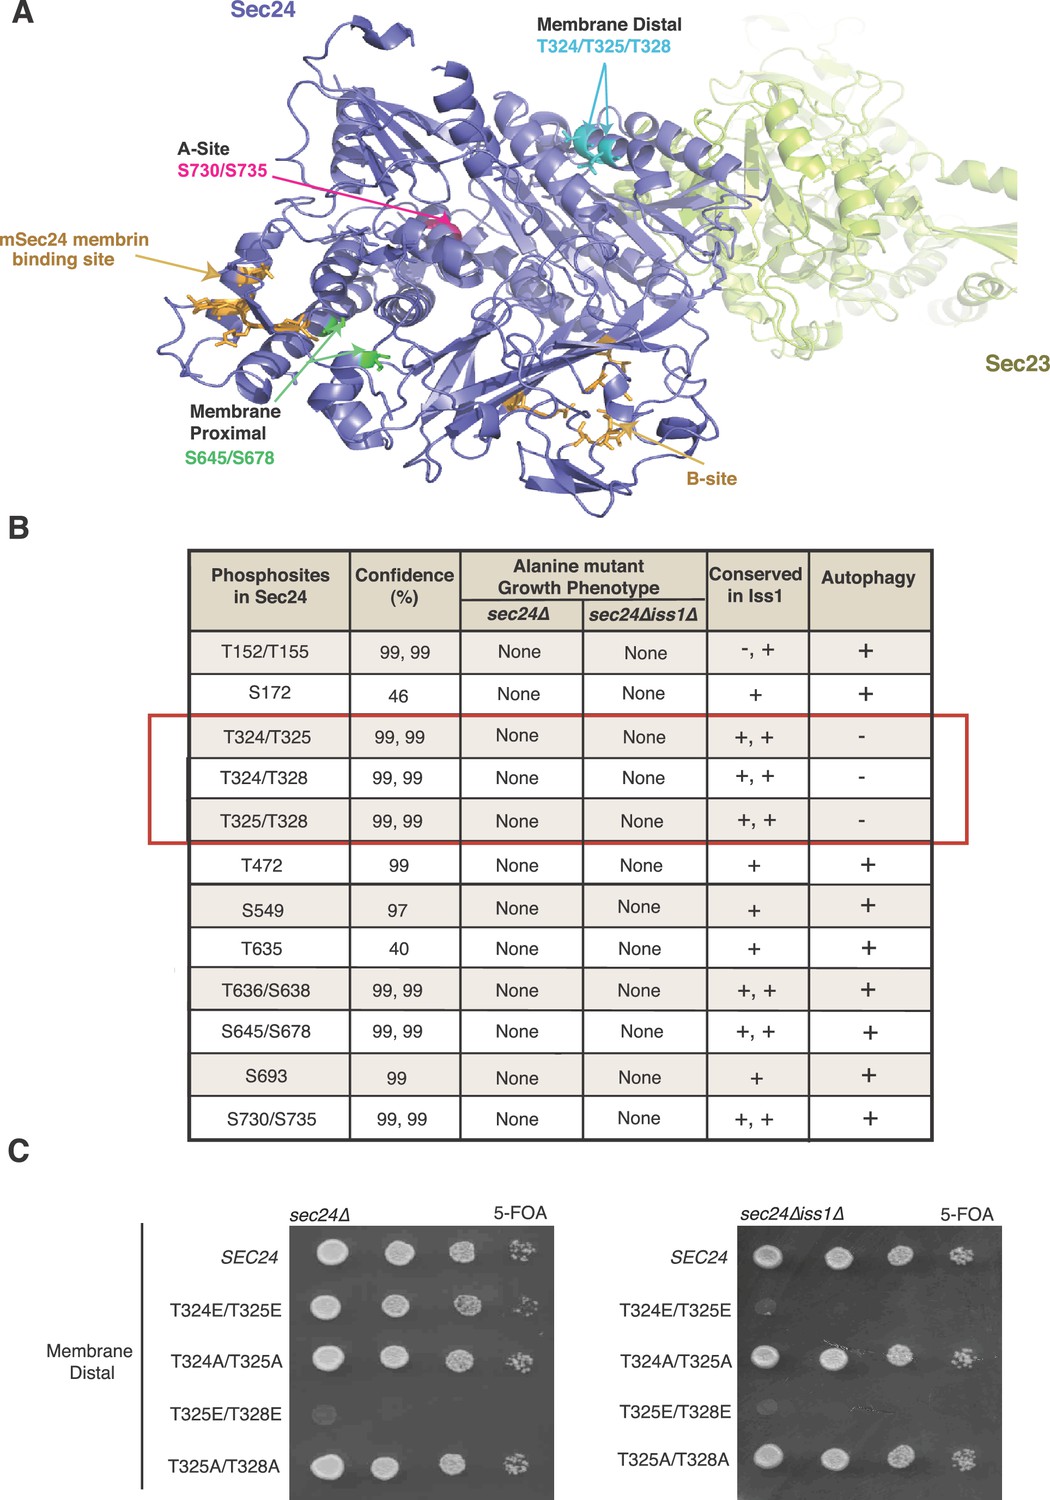
Identification of Sec24 phosphorylation sites required for autophagy.
(A) Ribbon diagram of Sec23 (lime) and Sec24 (lavender) with groups of key Sec24 phosphorylation sites (green, pink, and teal). The mSec24 membrin-binding site and conserved cargo binding B-site are colored light brown. (B) Sec24 phosphorylated residues conserved in Iss1 were mutated to alanine and introduced into sec24∆ and sec24∆iss1∆ deletion strains as described in the Materials and Methods. Sec24 and Iss1 were aligned using MAFFT alignment program and residues were considered conserved if either serine or threonine. Mutants in the sec24∆iss1∆ background were screened for autophagy defects 2 to 4 hr after nitrogen starvation using vacuolar alkaline phosphatase activity as a marker. Assays were performed in triplicate biological replicates and mutants were considered defective if p<0.05 using Student’s paired t-test. (C) Plasmids encoding SEC24 (WT) or mutant sec24 were expressed in SFNY2201 (left) or SFNY2202 (right) and grown on 5-FOA at 25°C to select against the WT balancing plasmid as described in the Materials and methods.
Figure 1—figure supplement 1
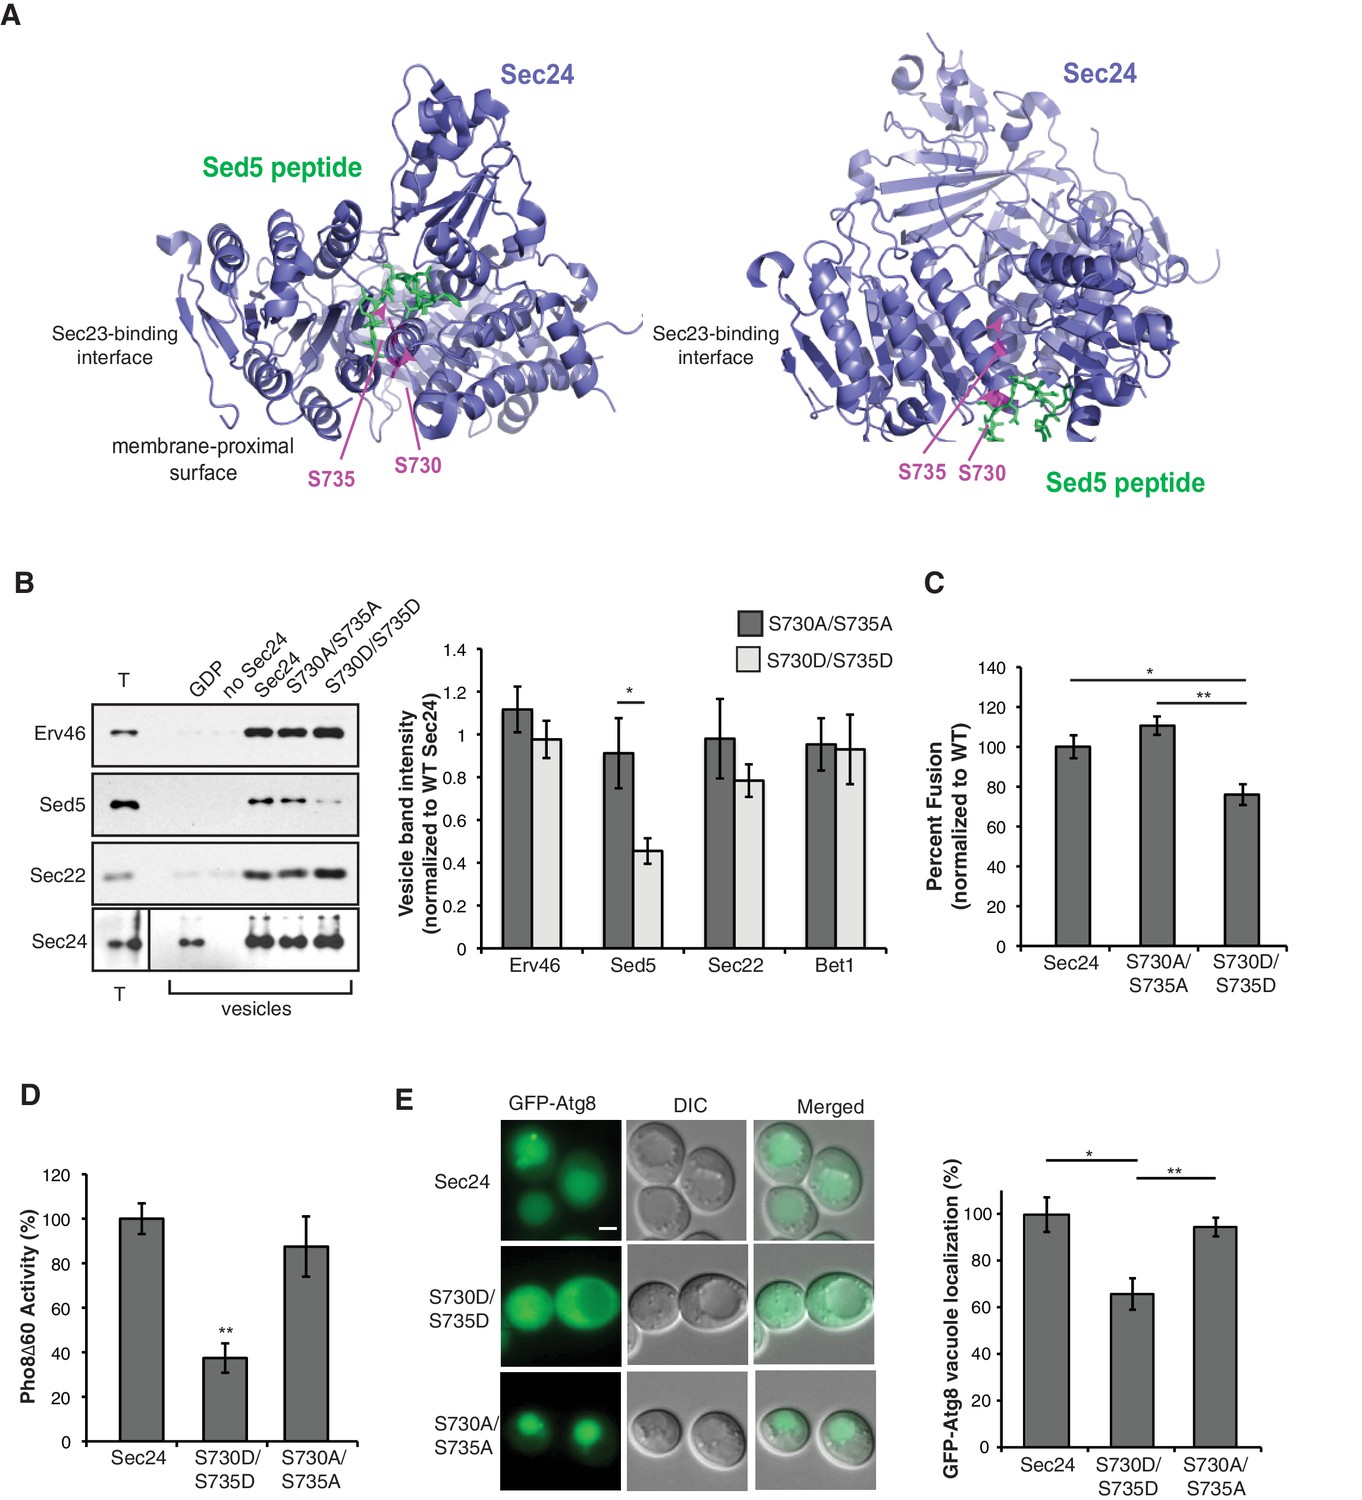
Phosphorylation of Sec24 S730/S735 disrupts Sed5 packaging.
(A) Two different views of a ribbon diagram of Sec24 (lavender) bound to a Sed5 peptide (green) with S730 and S735 highlighted (pink). (B) Total membranes (T) and budded vesicles were collected from in vitro budding reactions performed with wild-type (WT) or mutant Sec24 proteins as indicated. Incorporation of Sed5 and other cargo was determined by immunoblotting (left) and quantitated using fluorescent secondary antibodies (right). For each sample, cargo abundance in the vesicle pool was normalized to the reaction containing WT Sec24. Note, vesicles do not form in the presence of GDP. Averages and s.d. are shown for five biological replicates; p=0.012 for Sed5 (S730A/S735A and S730D/S735D), Student’s unpaired t-test. (C) Vesicles were generated in vitro with WT or mutant Sec24 harboring mutations in S730 and S735 and tested for their ability to fuse with acceptor membranes. Averages and s.e.m for six biological replicates are shown. p-values=0.011 (WT and S730D/S735D), 0.006 (S730A/S735A and S730D/S735D), Student’s unpaired t-test. (D) Vacuolar phosphatase activity was assayed in lysates prepared from WT and mutant Sec24. The activity of WT 2 hr after starvation was set as 100% and time 0 was subtracted, Averages and s.e.m. are shown for three biological replicates; p-value = 0.003, Student’s unpaired t-test. (E) The translocation of GFP-Atg8 to the vacuole was examined in WT Sec24, Sec24-730D/735D and Sec24-S730A/S735A cells 30 min after nitrogen starvation at 37°C. Upon autophagy induction, GFP-Atg8 is incorporated into the autophagosomal membrane and cleaved after it is delivered to the vacuole. Scale bar 2 µm (left). 300 cells were quantitated in three biological replicates (right). WT was set to 100% for each experiment and had an average of 75% vacuolar localization. Averages and s.e.m. are shown; p-values=0.032 (WT and S730D/S735D) and 0.006 (S730D/735D and S730A/S735A), Student’s paired t-test. *p<0.05, **p<0.01.
Figure 1—figure supplement 2

Sec24 S645/S678 does not affect cargo packaging.
Vesicles were collected from in vitro budding reactions performed with WT (lane 1), no Sec24 (lane 2) or mutant Sec24 proteins (lanes 3–4). The incorporation of a panel of cargo was determined by immunoblotting. Cropped (left) and uncropped (right) western blots are shown.
Figure 2 with 2 supplements

Phosphorylation of T324/T325/T328 in Sec24 is required for autophagy, but not ER-Golgi transport.
(A) Vacuolar alkaline phosphatase activity was assayed in lysates prepared from a sec24∆iss1∆ deletion strain harboring sec24 alanine mutations. The activity of wild-type (WT) 2 hr after starvation was set as 100% and 0 time-point values were subtracted. Averages and s.e.m. are shown for 3 (or four for T324A/T325A) biological replicates. p-values=0.006 (T324A), 0.012 (T325A), 0.009 (T328), 0.008 (T324A/T328A), 0.02 (T324A/T325A), 0.01 (T325A/T328A), 0.006 (T324A/T325A/T328A), Student’s paired t-test. (B, C) As in (A) except activity was assayed in extracts from phosphomimetic mutations in sec24∆iss1∆ (B) or sec24∆ (C) deletion strains. Averages and s.e.m. are shown for three biological replicates. p-values=0.88 (T325E), 0.78 (T328E), 0.32 (T324E/T328E), 0.26 (T324E/T325E), Student’s paired t-test. (D) The translocation of GFP-Atg8 to the vacuole was examined 1 hr after nitrogen starvation at 25°C in sec24∆iss1∆ and sec24∆ deletion strains in either the presence of WT Sec24 or Sec24-3A. Representative images (left) and quantification from 300 cells (right) are shown. Scale bar 2 µm. WT was set to 100% for each experiment and had an average vacuolar localization of 76% (sec24∆iss1∆) and 86% (sec24∆). Averages and s.e.m. are shown for three biological replicates. p-values=0.006 (sec24∆iss1∆), 0.02 (sec24∆), Student’s paired t-test. (E) Cleavage of GFP-Atg8 was examined in sec24∆iss1∆ cells expressing Sec24 or Sec24-3A 1 hr after starvation at 25°C (left). The ratio of free GFP to GFP-Atg8 was quantitated. The cleavage in WT was set to 1 (right). Averages and s.e.m. are shown for three biological replicates. p-value = 0.015, Student’s unpaired t-test. (F) sec24∆iss1∆ cells expressing Sec24 (lanes 1–4) or Sec24-3A (lanes 5–8) were pulse-labeled for 4 min and chased for the indicated times (left). The p1 (ER), p2 (Golgi) and m (vacuolar) forms of CPY are labeled. Quantitation of the ratio of p2/p1 CPY for the 5 and 10 min time points are shown (right). Averages and s.e.m. are shown for three biological replicates. p-values=0.08 (5 min), 0.66 (10 min), Student’s unpaired t-test. *p<0.05; **p<0.01.
Figure 2—figure supplement 1
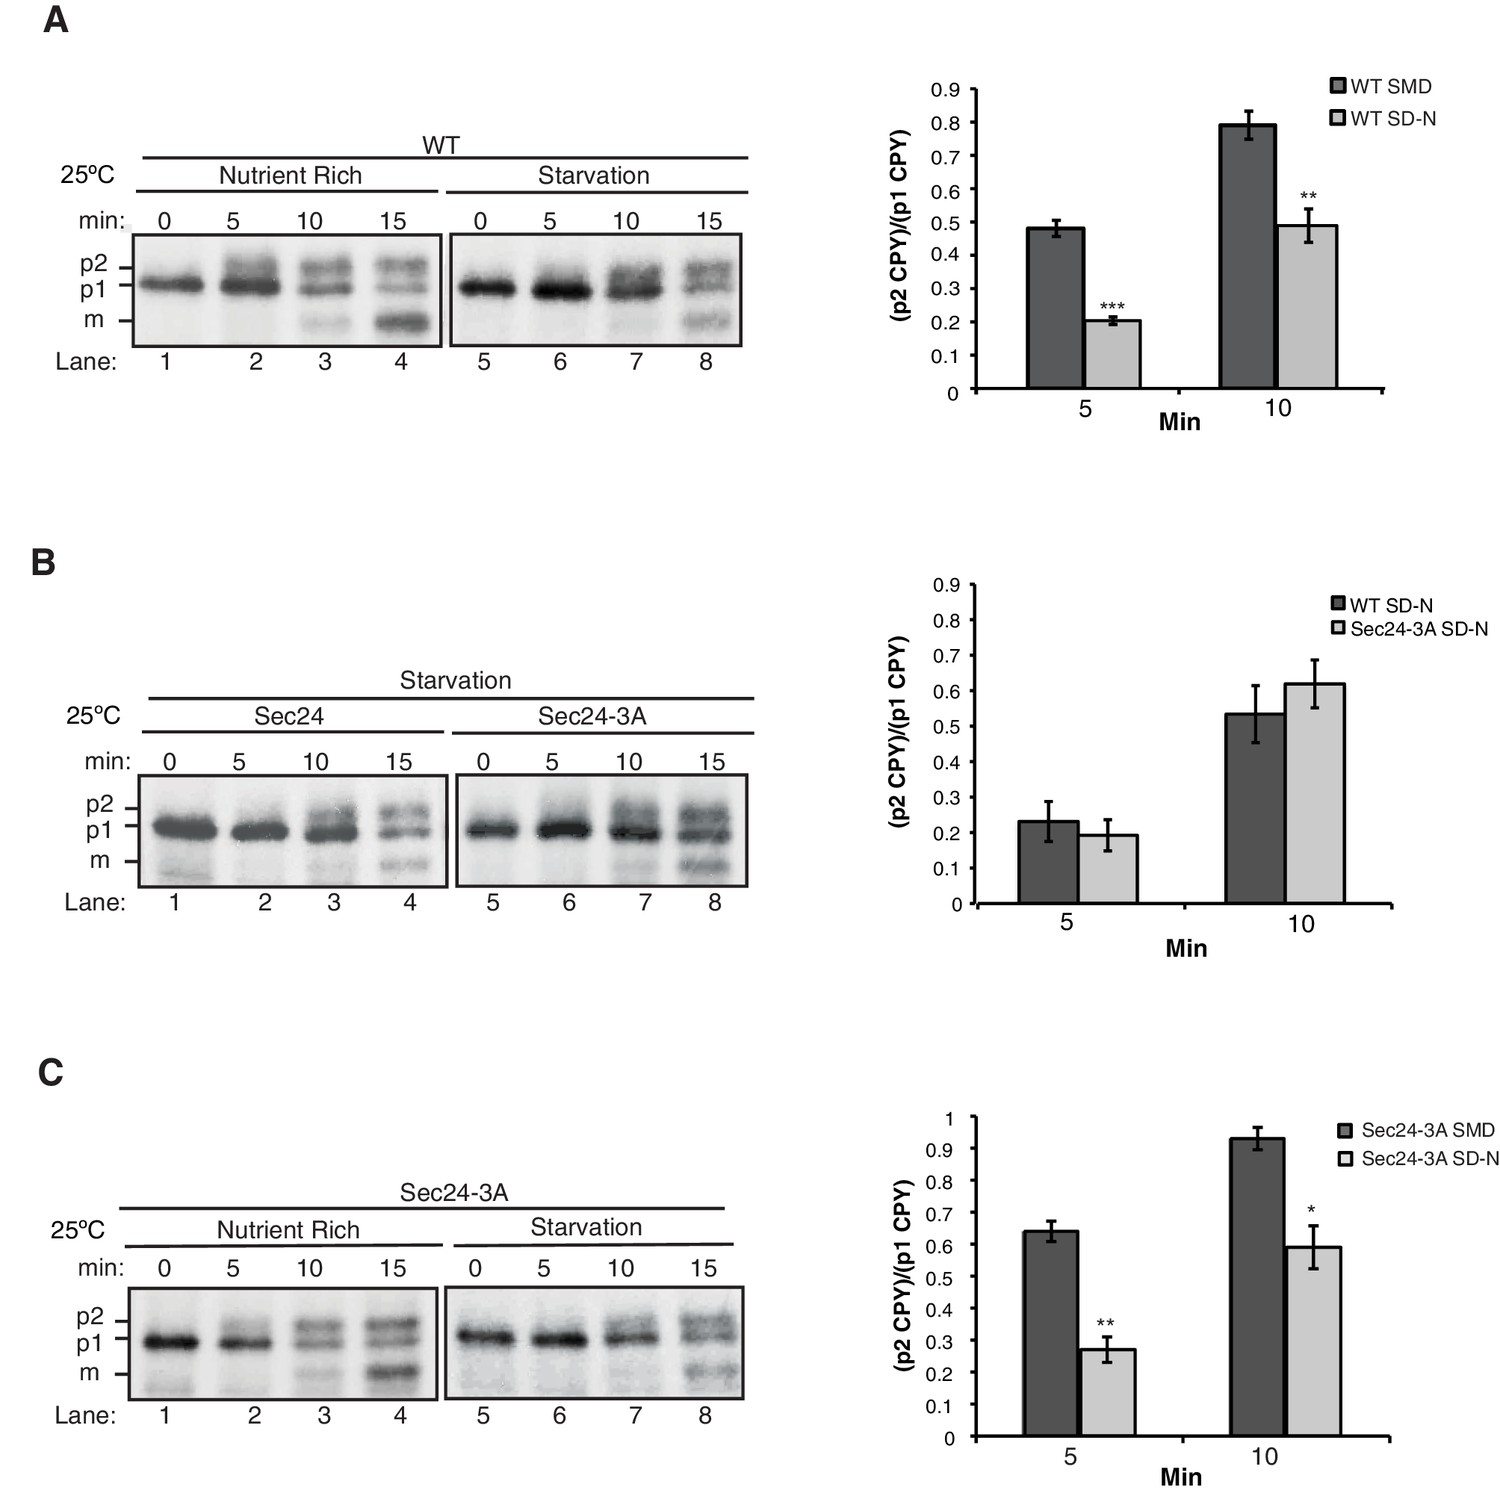
ER-Golgi transport is delayed during autophagy.
(A) WT cells were grown in nutrient rich media (SMD) (lanes 1–4) or starved for nitrogen (SD-N) for 1 hr at 25°C (lanes 5–8). Cells were pulse-labeled for 4 min and chased at the indicated times as described in the Materials and Methods before CPY was immunoprecipitated. ER (p1), Golgi (p2) and vacuolar (m) forms of CPY are labeled (left). Ratio of p2 to p1 CPY was determined (right). Averages and s.e.m. are shown for three biological replicates, p-values=0.0005 (5 min) and 0.009 (10 min), Student’s unpaired t-test. (B) As in (A) except sec24∆iss1∆ cells expressing Sec24 or Sec24-3A were starved for nitrogen for 1 hr at 25°C (left). Ratio of p2 to p1 CPY was determined (right). Averages and s.e.m. are shown for three biological replicates. p-values=0.46 (5 min) and 0.96 (10 min), Student’s unpaired t-test. (C) As in (A) except Sec24-3A cells were grown in nutrient rich media (SMD) (lanes 1–4) or starved for nitrogen (SD-N) for 1 hr at 25°C (lanes 5–8). Averages and s.e.m. are shown for three biological replicates, p-values=0.0015 (5 min) and 0.01 (10 min), Student’s unpaired t-test. *p<0.05; **p<0.01; ***p<0.001.
Figure 2—figure supplement 2
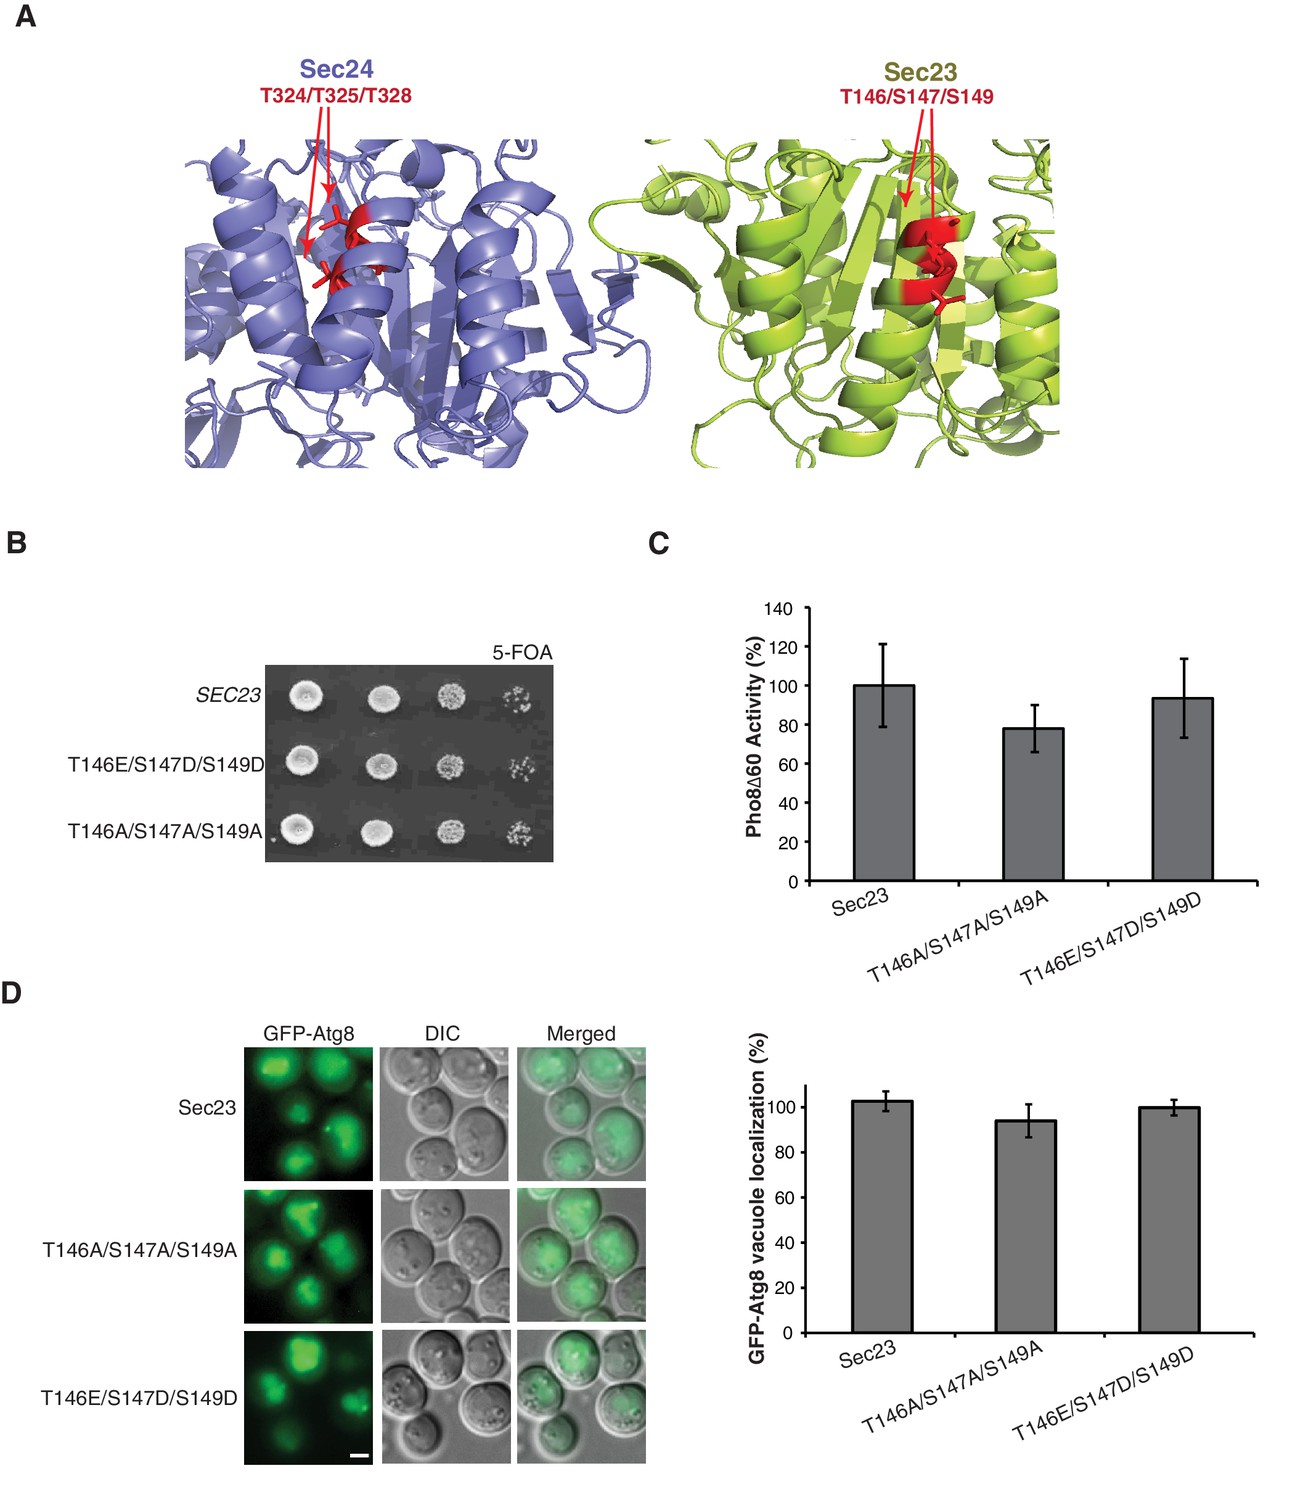
Phosphorylation of the Sec23 membrane distal sites is not required for autophagy.
(A) Ribbon diagram of Sec23 (lime) and Sec24 (lavender) with membrane distal phosphorylation sites highlighted (red). (B) Plasmids encoding SEC23 (WT) or mutant sec23 were expressed in SFNY1948 and grown on 5-FOA at 25°C for 2–3 days to select against the WT plasmid. (C) Vacuolar phosphatase activity was measured in protein extracts of cells expressing WT Sec23 and mutant Sec23-T146A/T147A/S149A or Sec23-T146E/S147D/S149D. The activity of WT 2 hr after starvation was set as 100% and time 0 was subtracted. Averages and s.e.m are shown for three biological replicates, p-values=0.48 (T146A/T147A/S149A), 0.6 (T146E/S147D/S149D). (D) Translocation of GFP-Atg8 to the vacuole was examined in WT and the sec23 mutants 1 hr after nitrogen starvation at 25°C (left). Scale bar 2 µm. 300 cells were quantitated (right). WT was set to 100% for each experiment and had an average of 75% vacuolar localization. Averages and s.e.m are shown for three biological replicates, p-values=0.34 (T146A/T147A/S149A), 0.74 (T146E/S147D/S149D).
Figure 3 with 1 supplement
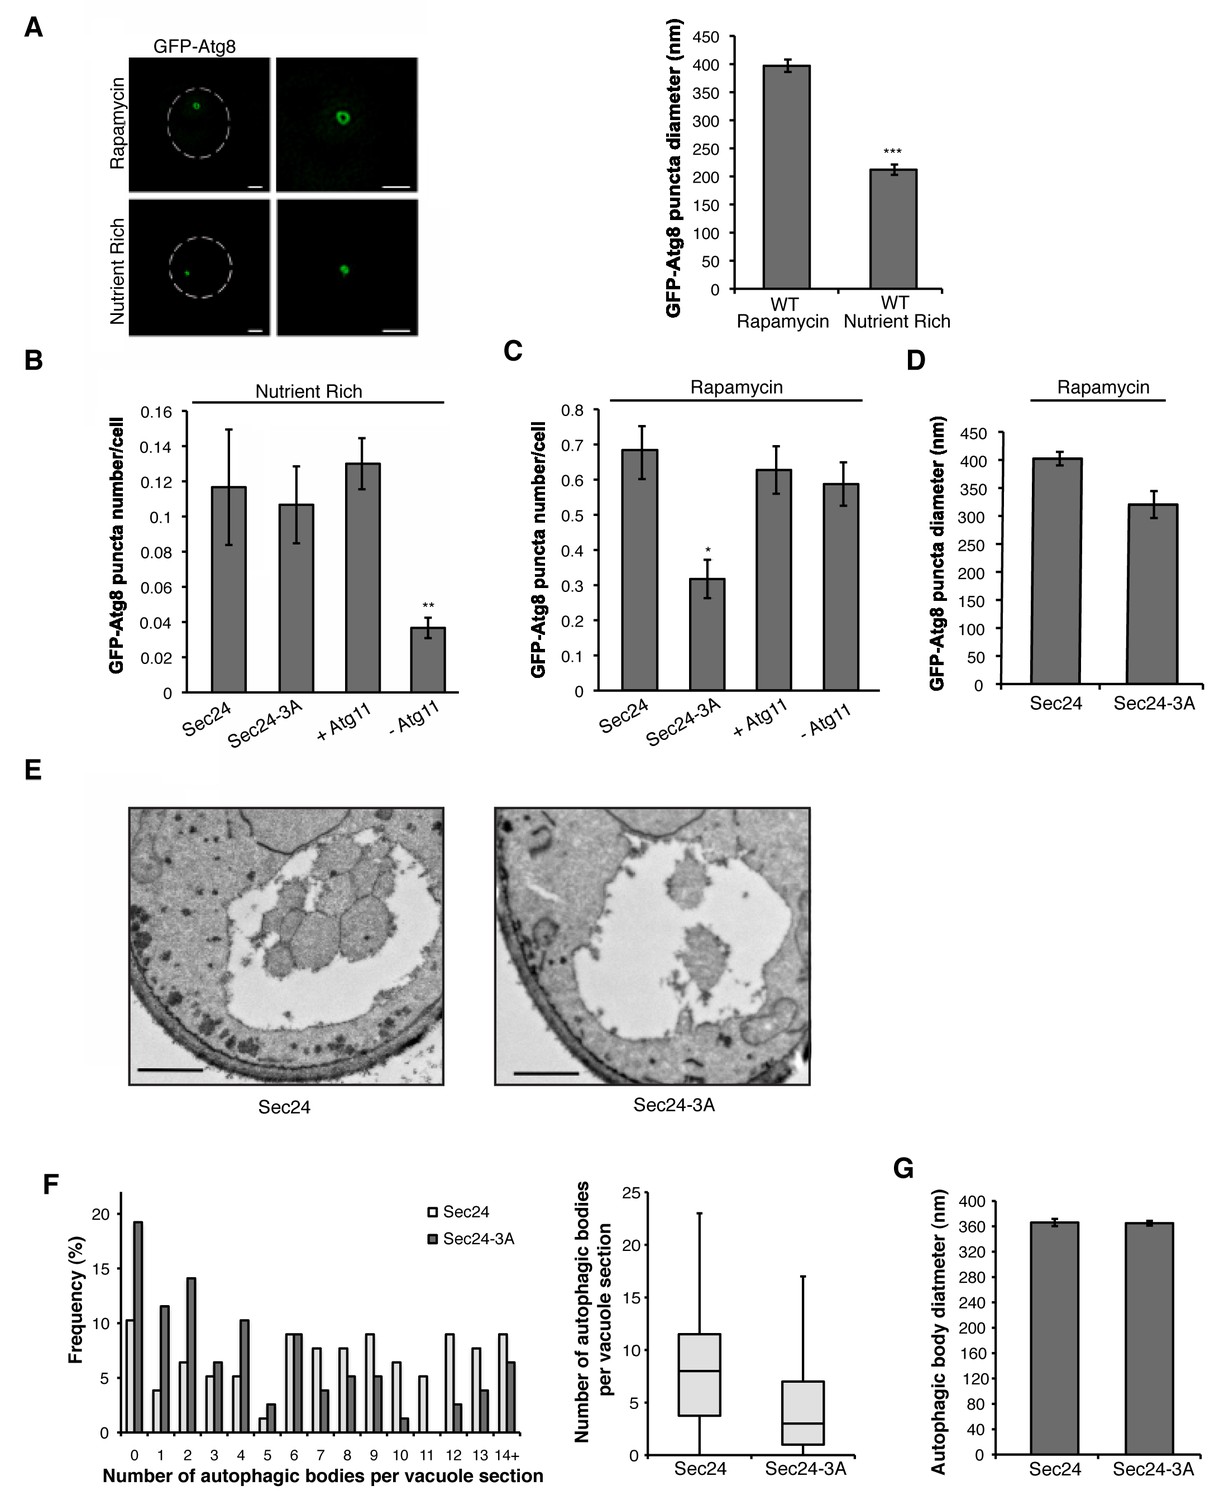
Phosphorylation of Sec24 regulates autophagosome frequency during starvation.
(A) Representative images from WT cells expressing GFP-Atg8 treated with 400 ng/ml rapamycin for 1 hr at 25°C (left top) or untreated (left bottom). Deconvolved images are shown. Scale bar, 1 µm. 100 GFP-Atg8 puncta were measured in WT cells treated with or without rapamycin (right). Averages and s.e.m. are shown for three biological replicates; p=0.0002, Student’s unpaired t-test. (B) WT Sec24 and Sec24-3A expressed in the sec24Δiss1Δ deletion strain, and WT (+Atg11) and atg11Δ cells (-Atg11) expressing GFP-Atg8 were imaged and the number of puncta per cell was quantitated from 300 cells. Averages and s.e.m. are shown for three biological replicates; p-values=0.81 (Sec24-3A), 0.009 (-Atg11), Student’s unpaired t-test. (C) As in (B) except cells were treated with 400 ng/ml rapamycin for 1 hr at 25°C. Averages and s.e.m. are shown for three biological replicates; p-values=0.02 (Sec24-3A), 0.68 (-Atg11), Student’s unpaired t-test. (D) As in (C) only the diameter of 100 GFP-Atg8 puncta was measured from cells expressing WT Sec24 and Sec24-3A in sec24Δiss1Δ deletion strains treated with 400 ng/ml rapamycin for 1 hr at 25°C. Averages and s.e.m. are shown for four biological replicates; p-value = 0.057, Student’s unpaired t-test. (E) Representative images of autophagic bodies in cells expressing Sec24 (left) and Sec24-3A (right) in sec24Δiss1Δpep4Δ deletion strains after 1.5 hr of nitrogen starvation at 30°C. Scale bar represents 500 nm. (F) Histogram showing the distribution of the number of autophagic bodies per vacuole section in Sec24 and Sec24-3A. The number of autophagic bodies was quantitated for 78 vacuole sections for each strain (left). p-value = 0.00012; Mann-Whitney Test. Box plot of the number of autophagic bodies per vacuole section. Bars show data between the lower and upper quartiles, the median is a horizontal line within the box. Whiskers indicate the smallest and largest observations (right). (G) The diameter of autophagic bodies was determined. For Sec24 N = 398, for Sec24-3A N = 342. Averages with error bars as s.e.m. are shown. *p<0.05; **p<0.01; ***p<0.001.
Figure 3—figure supplement 1

GFP-Atg8 puncta formation is affected in the sec12-4 mutant during autophagy induction.
(A) Cells with (left) and without (right) Iss1 were lysed as described in the Materials and methods and Ape1 processing was assayed by western blot analysis. Ape1 is processed in the sec24 alanine mutants to the same extent as wild-type. (B) WT and sec12-4 mutant cells expressing GFP-Atg8 were treated with 400 ng/ml rapamycin (left) or untreated (right) for 1 hr at 37°C. The number of GFP-Atg8 puncta per cell was determined for 300 cells. Averages and s.e.m. are shown for three biological replicates; p-value = 0.002 (rapamycin) 0.51 (nutrient rich), Student’s unpaired t-test. **p<0.01. (C) The size of GFP-Atg8 puncta from WT and sec12-4 cells treated with rapamycin was determined for 100 puncta. Averages and s.e.m. are shown for four biological replicates; p-value = 0.13, Student’s unpaired t-test.
Figure 4 with 1 supplement
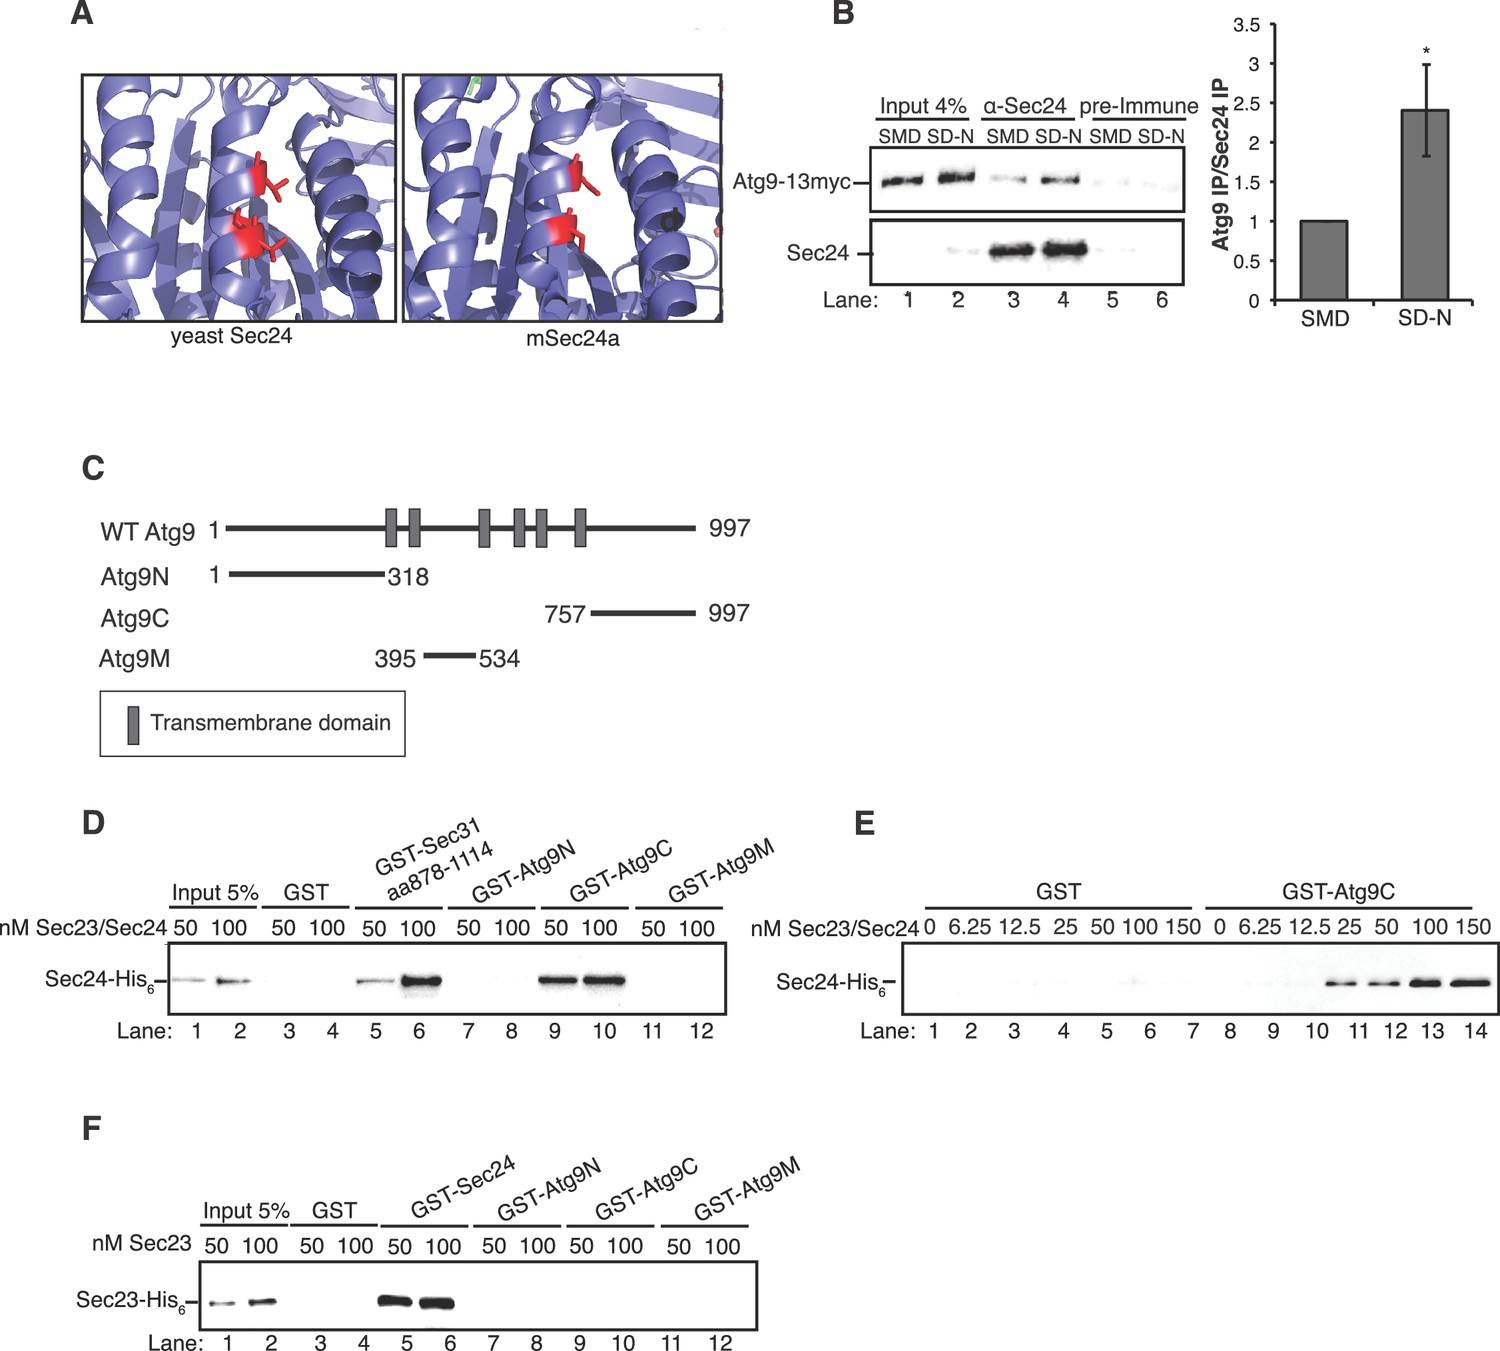
The Sec23/Sec24 complex binds the C-terminus of Atg9.
(A) Structure of yeast Sec24 and mSec24a with conserved residues in membrane distal sites (red). (B) ypt7∆ cells expressing Atg9-13myc were grown in nutrient rich (SMD) or starvation (SD-N) media for 4 hr and Sec24 was immunoprecipitated and blotted for Atg9-13myc (left). Precipitated Atg9-13myc was quantitated and normalized to the amount of Sec24 in the precipitate. SMD was set as one for each experiment. ypt7∆ cells were used as autophagosomes fail to fuse with the vacuole in the absence of Ypt7 and accumulate in the depleted cells (Kirisako et al., 1999). Averages and s.e.m. are shown for four biological replicates, p-value = 0.037, Student’s unpaired t-test. (C) Schematic showing cytosolic domains of Atg9. (D) Equimolar amounts (200 nM) of purified GST, GST-Sec31 (aa878-1114) or GST-Atg9 fragments were incubated with 50 or 100 nM of Sec23/Sec24-His6. (E) Equimolar amounts (100 nM) of purified GST or GST-Atg9C was incubated with increasing amounts of Sec23/Sec24-His6. (F) Same as (D) except His6-Sec23 was used.
Figure 4—figure supplement 1

Ponceau staining of in vitro bindings in Figure 4D, E and F.
(A) Ponceau staining of Figure 4D. Equimolar amounts (200 nM) of purified GST, GST-Sec31 (aa878-1114) or GST-Atg9 fragments were incubated with 50 or 100 nM of Sec23/Sec24-His6. Asterisks denote GST fusion protein and arrowheads denote bound Sec24-His6. (B) Ponceau staining of Figure 4E. Equimolar amounts (100 nM) of purified GST or GST-Atg9C was incubated with increasing amounts of Sec23/Sec24-His6. Asterisks denote GST fusion protein. (C) Ponceau staining of Figure 4F. Equimolar amounts (200 nM) of purified GST, GST-Sec24 or GST-Atg9 fragments were incubated with 50 or 100 nM of His6-Sec23. Asterisks denote GST fusion protein and arrowhead denotes bound His6-Sec23.
Figure 5 with 5 supplements
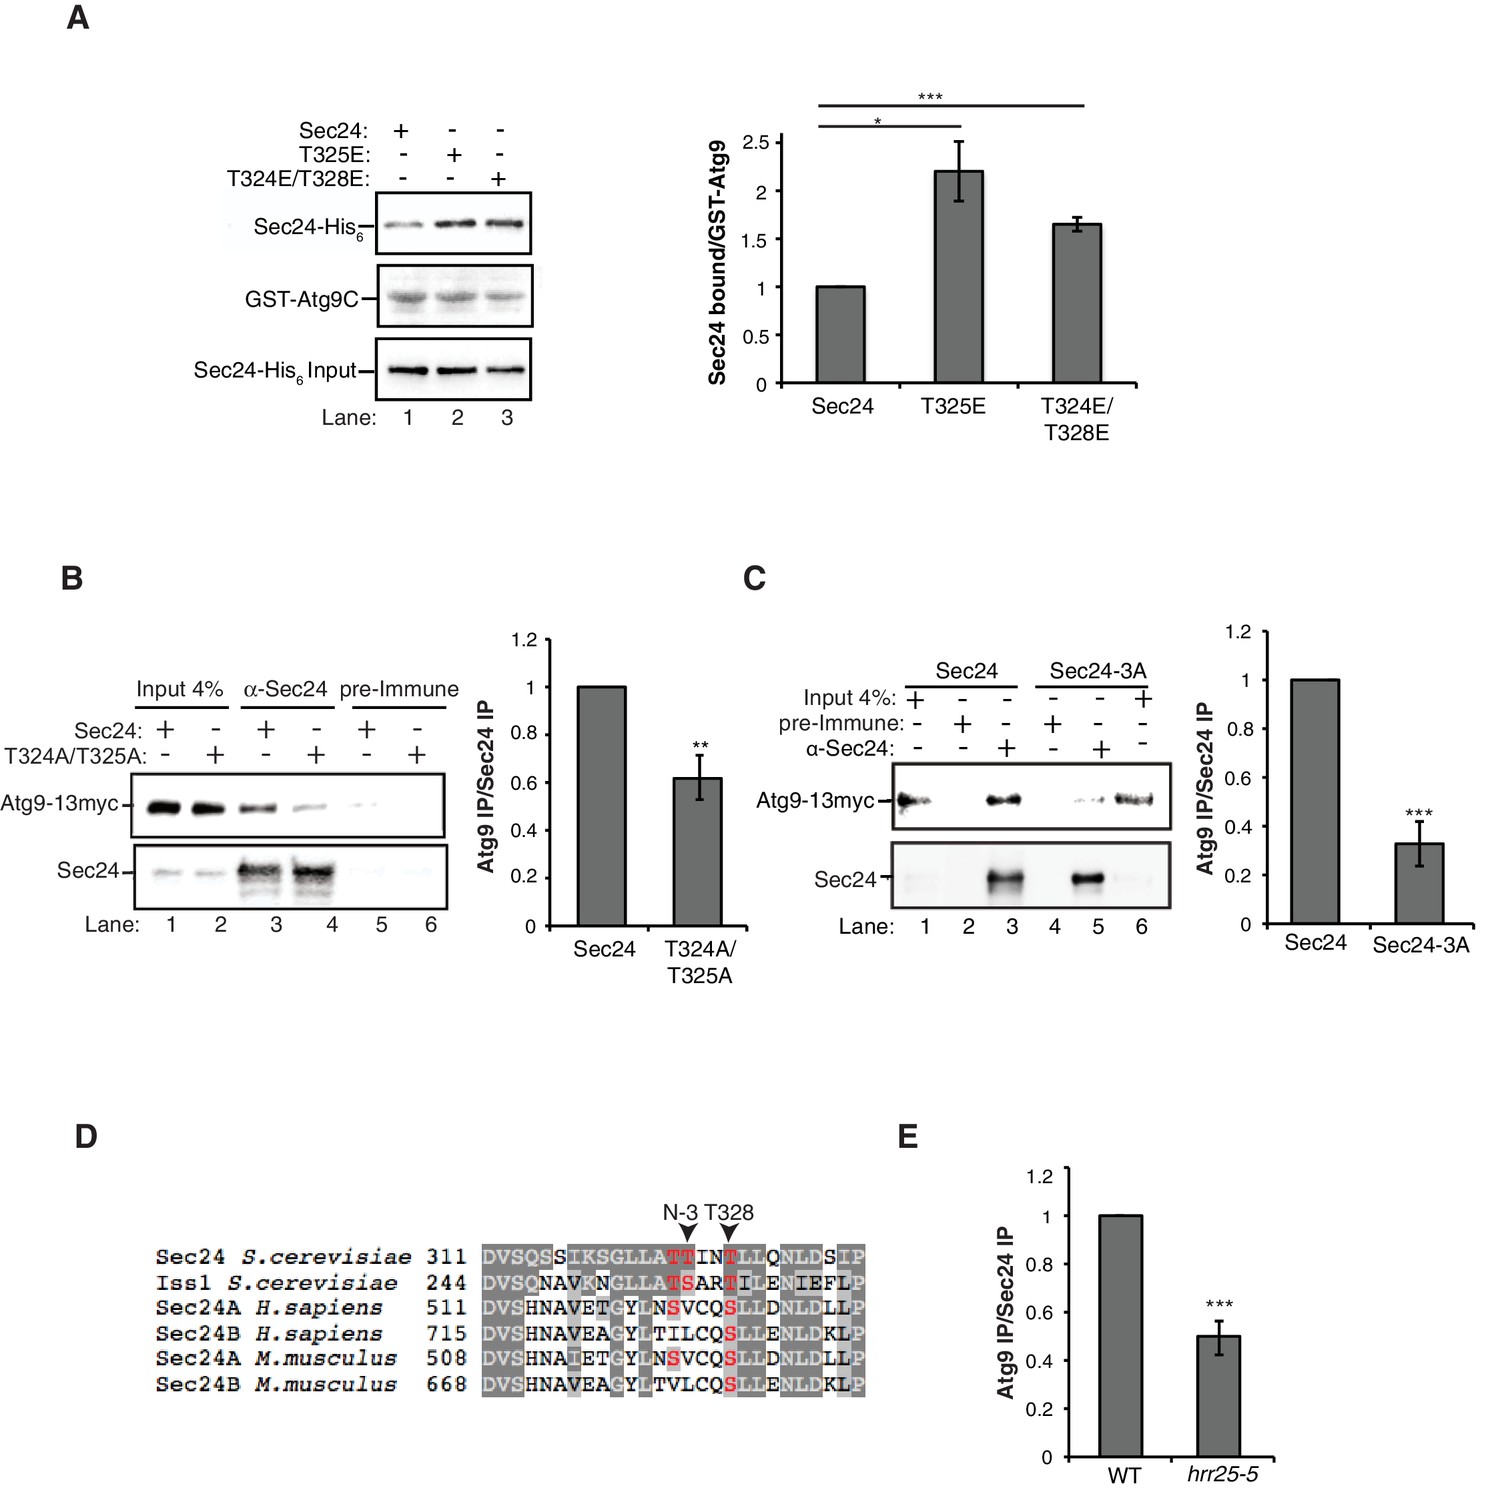
Phosphorylation of the Sec24 membrane distal sites regulates the Sec24-Atg9 interaction.
(A) GST-Atg9C (200 nM) was incubated with 37.5 nM of WT Sec23/Sec24-His6, Sec23/Sec24-T325E-His6 or Sec23/Sec24-T324E/T328E-His6 (left). Ratio of Sec24 bound to GST-Atg9C was quantified from three biological replicates. Averages and s.e.m. are shown (right). WT Sec23/Sec24 was set as one for each experiment; p-value = 0.018 (T325E), 0.0008 (T324E/T328E), Student’s unpaired t-test. (B) Sec24 (WT) and Sec24-T324A/T325A or (C) Sec24-T324A/T325A/T328A (Sec24-3A) were immunoprecipitated from lysates expressing Atg9-13myc as described in the Materials and Methods. Precipitated Atg9-13myc was quantitated and normalized to the amount of Sec24 in the precipitate. WT Sec24 was set as one for each experiment. Averages and s.e.m. are shown for 4 (B) or 5 (C) biological replicates; p-value = 0.006 (B), 0.0008 (C) Student’s unpaired t-test. (D) Alignment of the region surrounding T324/T325/T328 (shown in red) with Sec24 orthologues. (E) Same as (B) except Sec24 was immunoprecipitated from WT or hrr25-5 lysates. Averages and s.e.m. are shown for five biological replicates. p-value = 0.0002, Student’s unpaired t-test. **p<0.01; ***p<0.01; ***p<0.001.
Figure 5—figure supplement 1
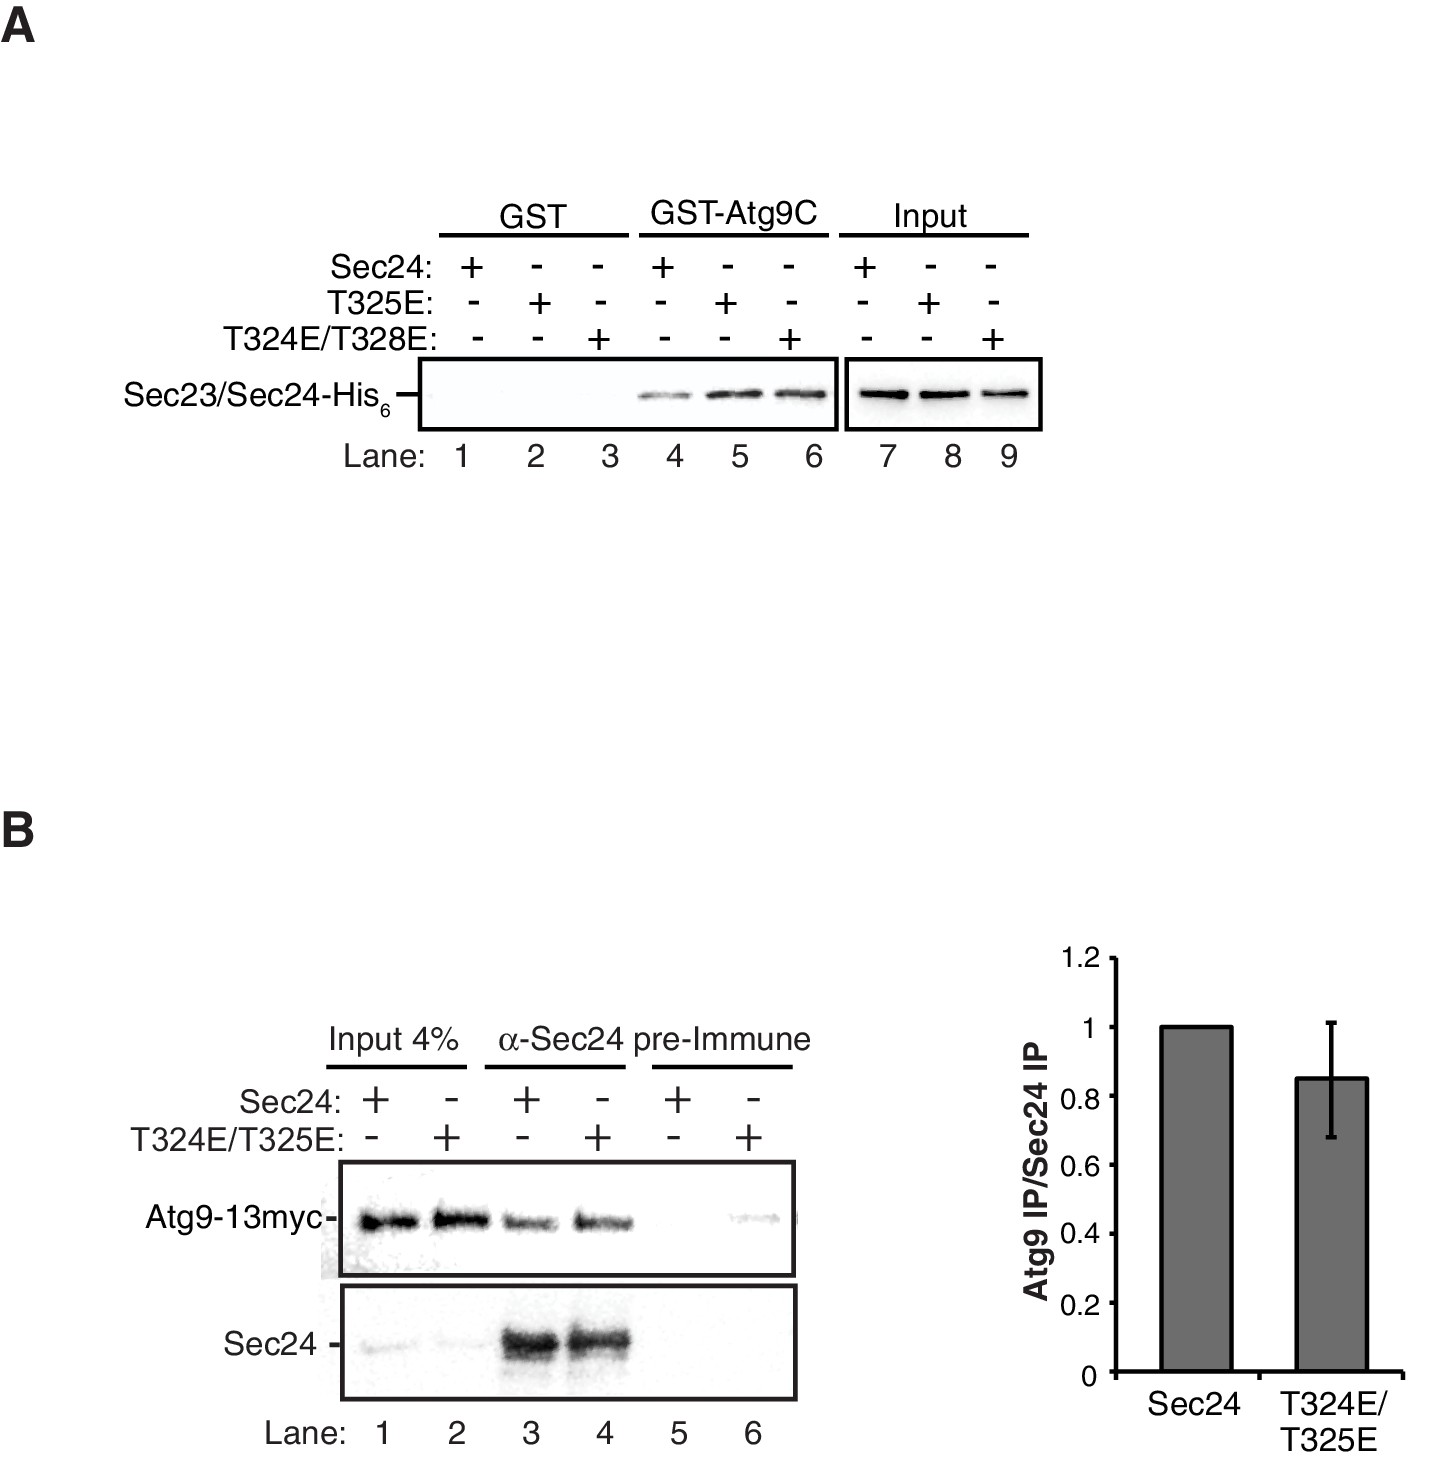
GST negative control for in vitro binding in Figure 5A.
(A) Equimolar amounts of GST or GST-Atg9C (200 nM) were incubated with 37.5 nM of WT Sec23/Sec24-His6, Sec23/Sec24-T325E-His6 or Sec23/Sec24-T324E/T328E-His6. (B) Sec24 T324E/T325E does not disrupt the Sec24-Atg9 interaction in vivo. Sec24 T324E/T325E was immunoprecipitated from lysates expressing Atg9-13myc as described in the Materials and Methods (left). Precipitated Atg9-13myc was quantitated and normalized to the amount of Sec24 in the precipitate (right). Precipitated WT Sec24 was set as one for each experiment. Averages and s.e.m. are shown for five biological replicates; p-value = 0.39, Student’s unpaired t-test.
Figure 5—figure supplement 2
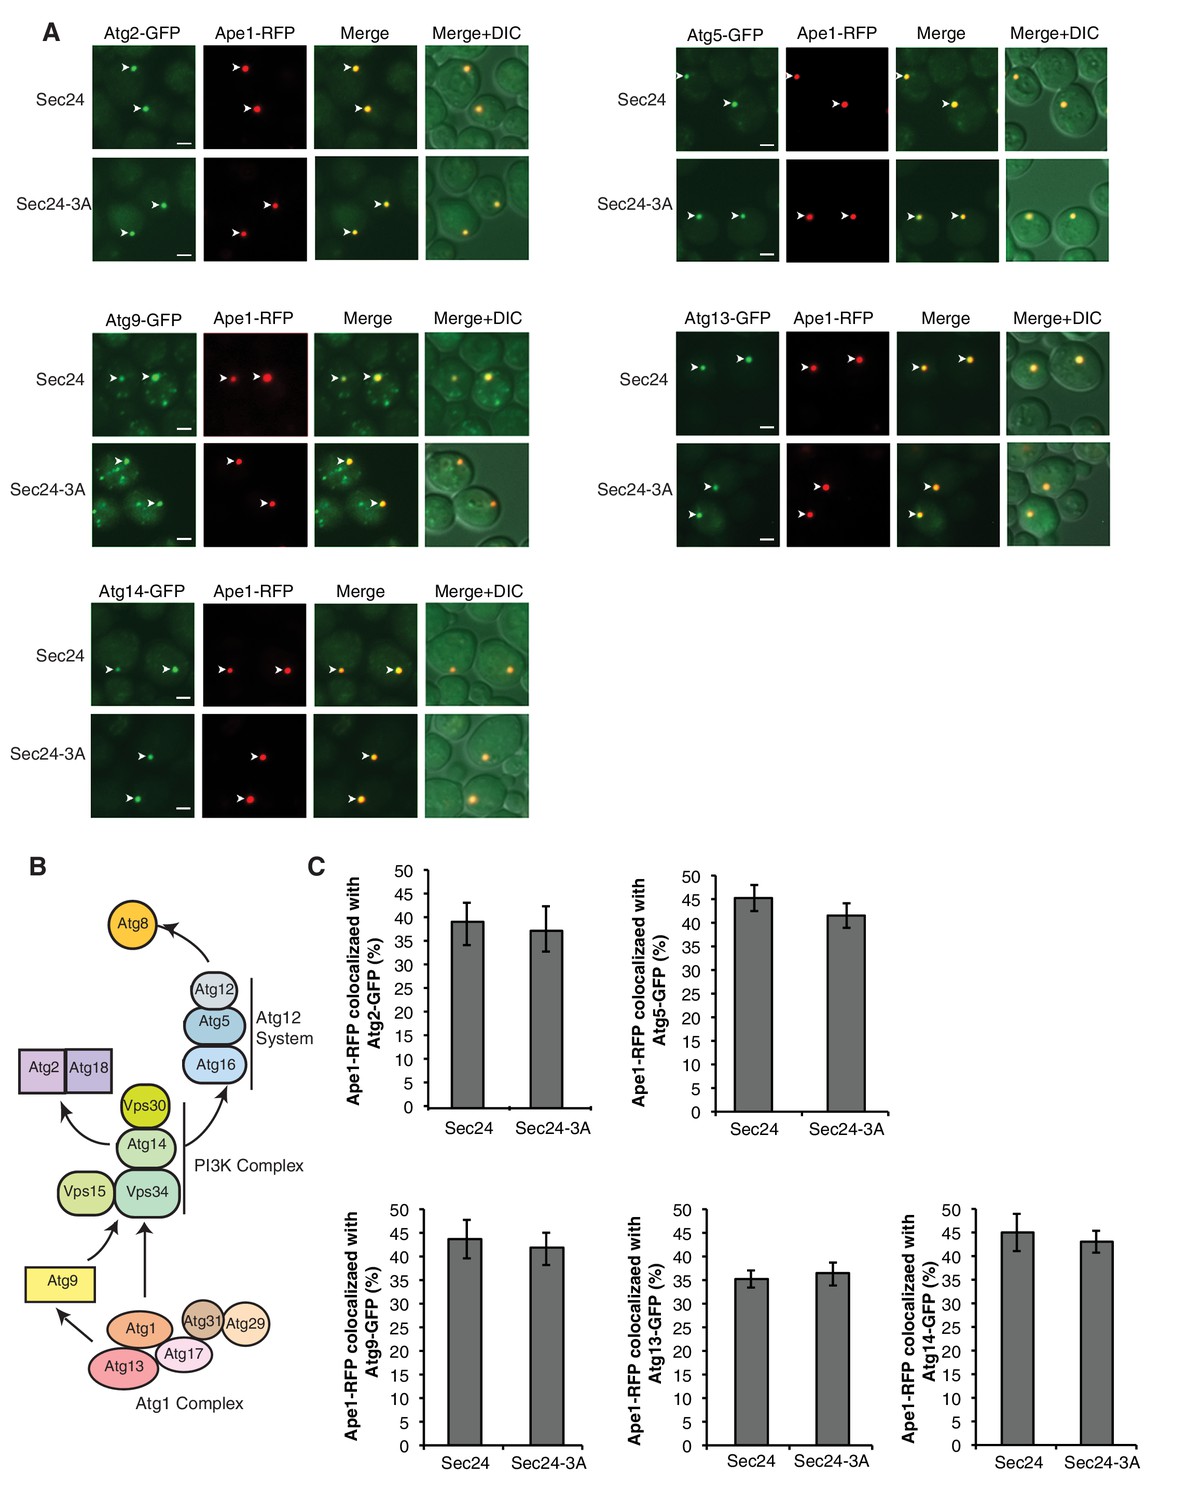
Sec24-3A does not affect Atg assembly at the PAS.
(A) Sec24 and Sec24-3A cells expressing Ape1-RFP and GFP tagged Atgs were treated with 400 ng/mL rapamycin for 1 hr at 25°C and the percent of Ape1-RFP colocalized with Atgs was determined in 300 cells. Arrowheads point to Ape1 puncta that colocalize with the Atg. Scale bar 2 µm. (B) The six Atg hierarchy groups are the Atg1 complex; the phosphatidylinositol 3-phosphate kinase complex (PI3K); the Atg2/Atg18 complex; the transmembrane protein Atg9; and two different ubiquitin-like conjugating systems, Atg12/Atg5/Atg16 and Atg8-PE. Asterisks denote Atgs that were examined. (C) Quantitation of data in (A). Averages and s.e.m. are shown for three biological replicates; p-value = 0.78 (Atg2), 0.38 (Atg5), 0.75 (Atg9), 0.7, (Atg13) 0.69 (Atg14), Student’s unpaired t-test.
Figure 5—figure supplement 3

Sec24-3A does not affect ERES formation.
(A) Cells with Sec13-GFP and expressing either Sec24 or Sec24-3A were grown in nutrient rich medium (SMD) or starved for nitrogen (SD-N) for 2 hr at 25°C. Scale bar 2 µm. (B) The number of Sec13-GFP puncta per cell was quantitated. Over 300 cells were quantitated from three biological replicates. Averages and s.e.m. are shown; p-value = 0.8 (SMD), 0.35 (SD-N).
Figure 5—figure supplement 4

Representative blots for quantitation shown in Figure 5E.
Sec24 was immunoprecipitated from lysates prepared from WT and hrr25-5 cells expressing Atg9-13myc. Cropped western blot (top). Uncropped western blot (bottom) from top showing pre-immune controls (left boxed area) for samples in lanes 5 and 6 (right boxed area).
Figure 5—figure supplement 5
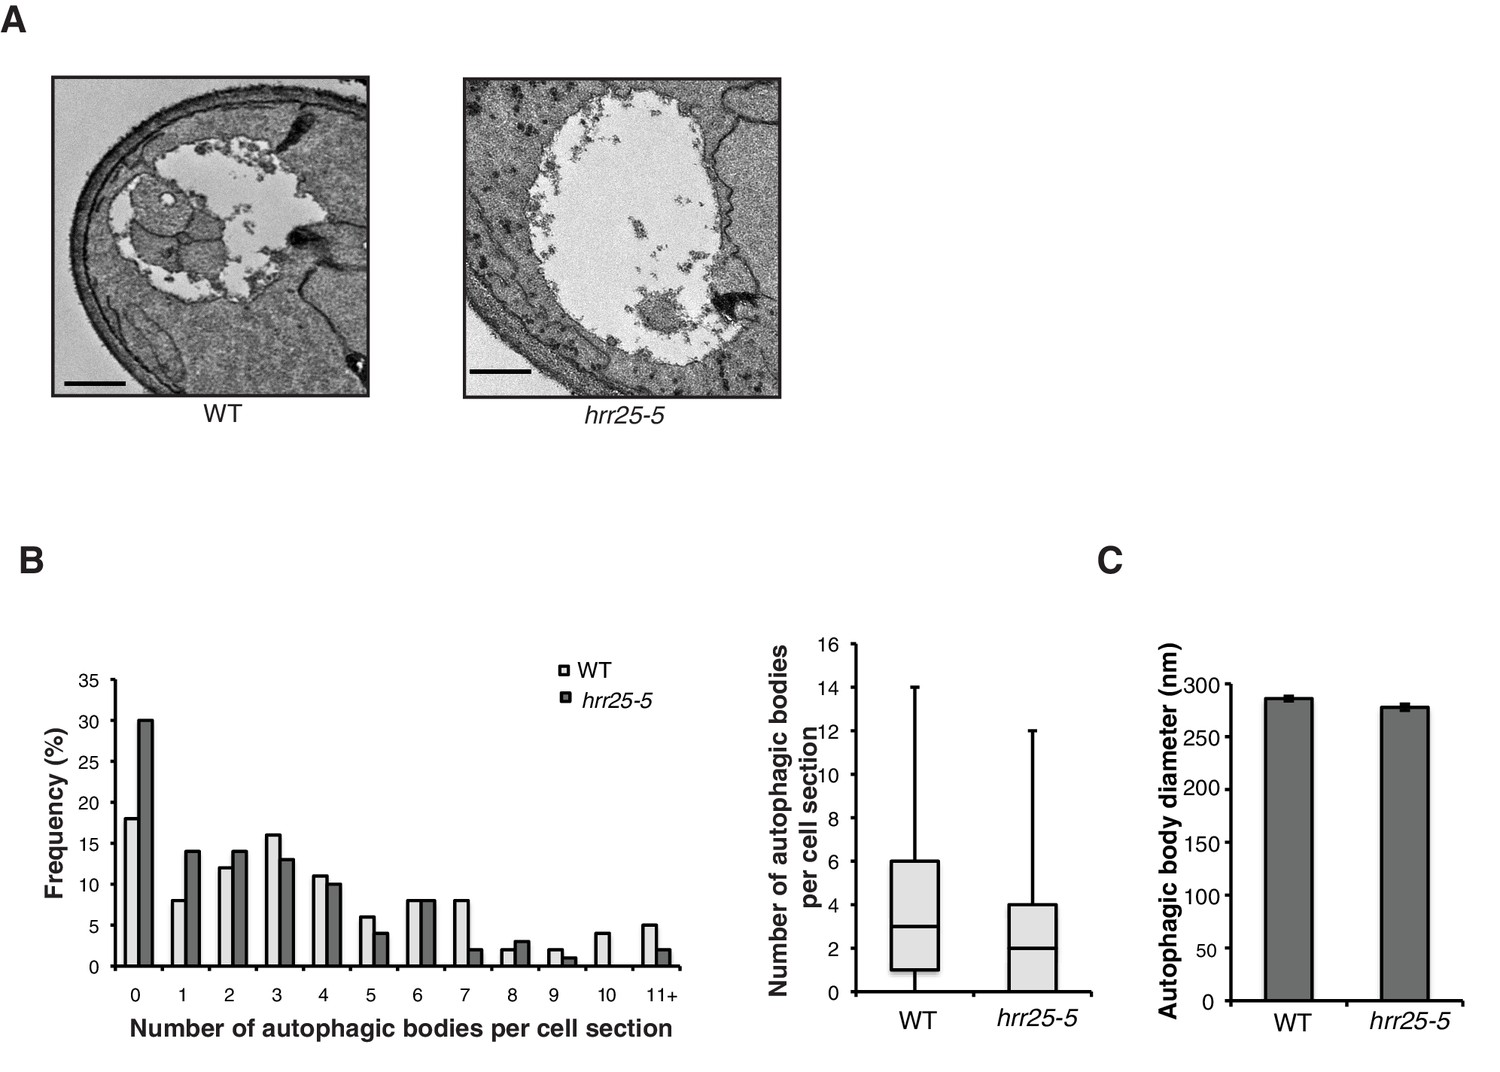
Autophagic body number is reduced in the hrr25-5 mutant.
(A) Representative images of autophagic bodies in pep4Δ (left) or hrr25-5pep4Δ (right) cells 1.5 hr after nitrogen starvation at 37°C. Scale bar represents 500 nm. (B) Histogram showing the distribution of the number of autophagic bodies per cell section in WT and the hrr25-5 mutant. The number of autophagic bodies was quantitated for 100 cell sections for each strain (left). p-value = 0.0016; Mann-Whitney Test. Box plot of the number of autophagic bodies per cell section. Bars show data between the lower and upper quartiles, the median is a horizontal line within the box. Whiskers indicate the smallest and largest observations (right). (C) The diameter of autophagic bodies was determined. For WT N = 396, for hrr25-5 N = 254. Averages with error bars as s.e.m. are shown.
Figure 6 with 4 supplements

Hrr25 regulates autophagy via phosphorylation of the Sec24 membrane distal sites.
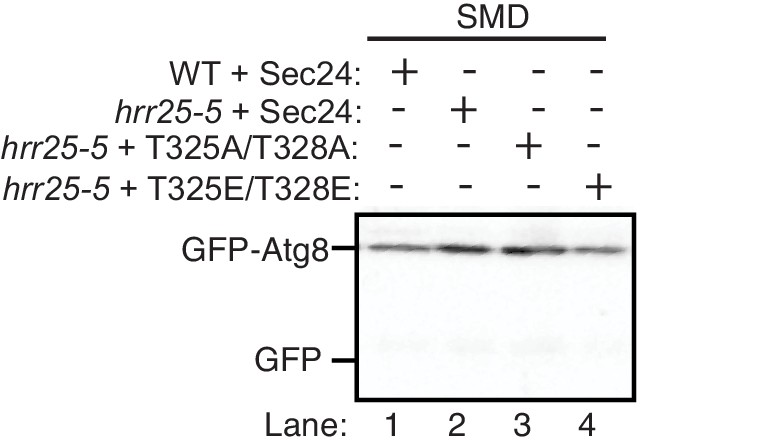
(A) Sec24 was immunoprecipitated from WT or hrr25-5 cells expressing Atg9-13myc and either WT Sec24 or Sec24 T325A/T328A or Sec24 T325E/T328E. Precipitated Atg9-13myc was quantitated and normalized to the amount of Sec24 in the precipitate. WT was set as one for each experiment. Averages and s.e.m. are shown for three biological replicates. p-value = 0.01 (hrr25-5 + T325E/T328E), 0.81 (hrr25-5 + T325A/T328A), Student’s unpaired t-test. (B) Vacuolar localization of GFP-Atg8 was examined 2 hr after nitrogen starvation at 37°C in WT or hrr25-5 cells expressing either WT Sec24 or Sec24 T325A/T328A or Sec24 T325E/T328E. Scale bar, 2 µm (left). Over 300 cells were quantitated from three biological replicates. WT was set as 100% for each experiment. Averages and s.e.m. are shown. p-value = 0.006 (hrr25-5 + T325E/T328E), 0.17 (hrr25-5 + T325A/T328A), Student’s unpaired t-test. (C) Cleavage of GFP-Atg8 in hrr25-5 cells expressing WT Sec24 or Sec24 T325A/T328A or Sec24 T325E/T328E were examined 2 hr after nitrogen starvation at 37°C (left). The ratio of GFP to GFP-Atg8 was quantitated from three biological replicates. The cleavage in WT was set to 1. Averages and s.e.m. are shown. p-value = 0.03 (hrr25-5 + T325E/T328E), 0.99 (hrr25-5 + T325A/T328A), Student’s unpaired t-test. *p<0.05; **p<0.01.
Figure 6—figure supplement 1
Nutrient rich controls for GFP-Atg8 cleavage in Figure 6C.
https://doi.org/10.7554/eLife.21167.020
Figure 6—figure supplement 2

Hrr25 is not regulated during starvation.
(A) Lysates were prepared from WT cells starved for nitrogen for the indicated time periods by incubating 2.5 OD600 units of cells with 200 µl 0.1 M NaOH for 5 min at room temperature. The precipitate was pelleted and heated in sample buffer for 5 min at 95°C. Lysates were immunoblotted with anti-Hrr25 (top) and anti-Bos1 (bottom) antibodies. The SNARE Bos1 was used as a loading control. (B) Hrr25-HA was immunoprecipitated from cells grown in nutrient rich media (SMD) or starved for nitrogen (SD-N) for 1 hr at 25°C. The kinase activity of Hrr25 was assayed in vitro using myelin basic protein (MBP) as a substrate as described in the Materials and Methods. Asterisk denotes contaminate band from HA resin. Hrr25 activity was quantitated and normalized to amount of Hrr25-HA in the precipitate (right). SMD was set as one for each experiment. Averages and s.e.m. are shown for four biological replicates; p-value = 0.76, Student’s paired t-test.
Figure 6—figure supplement 3
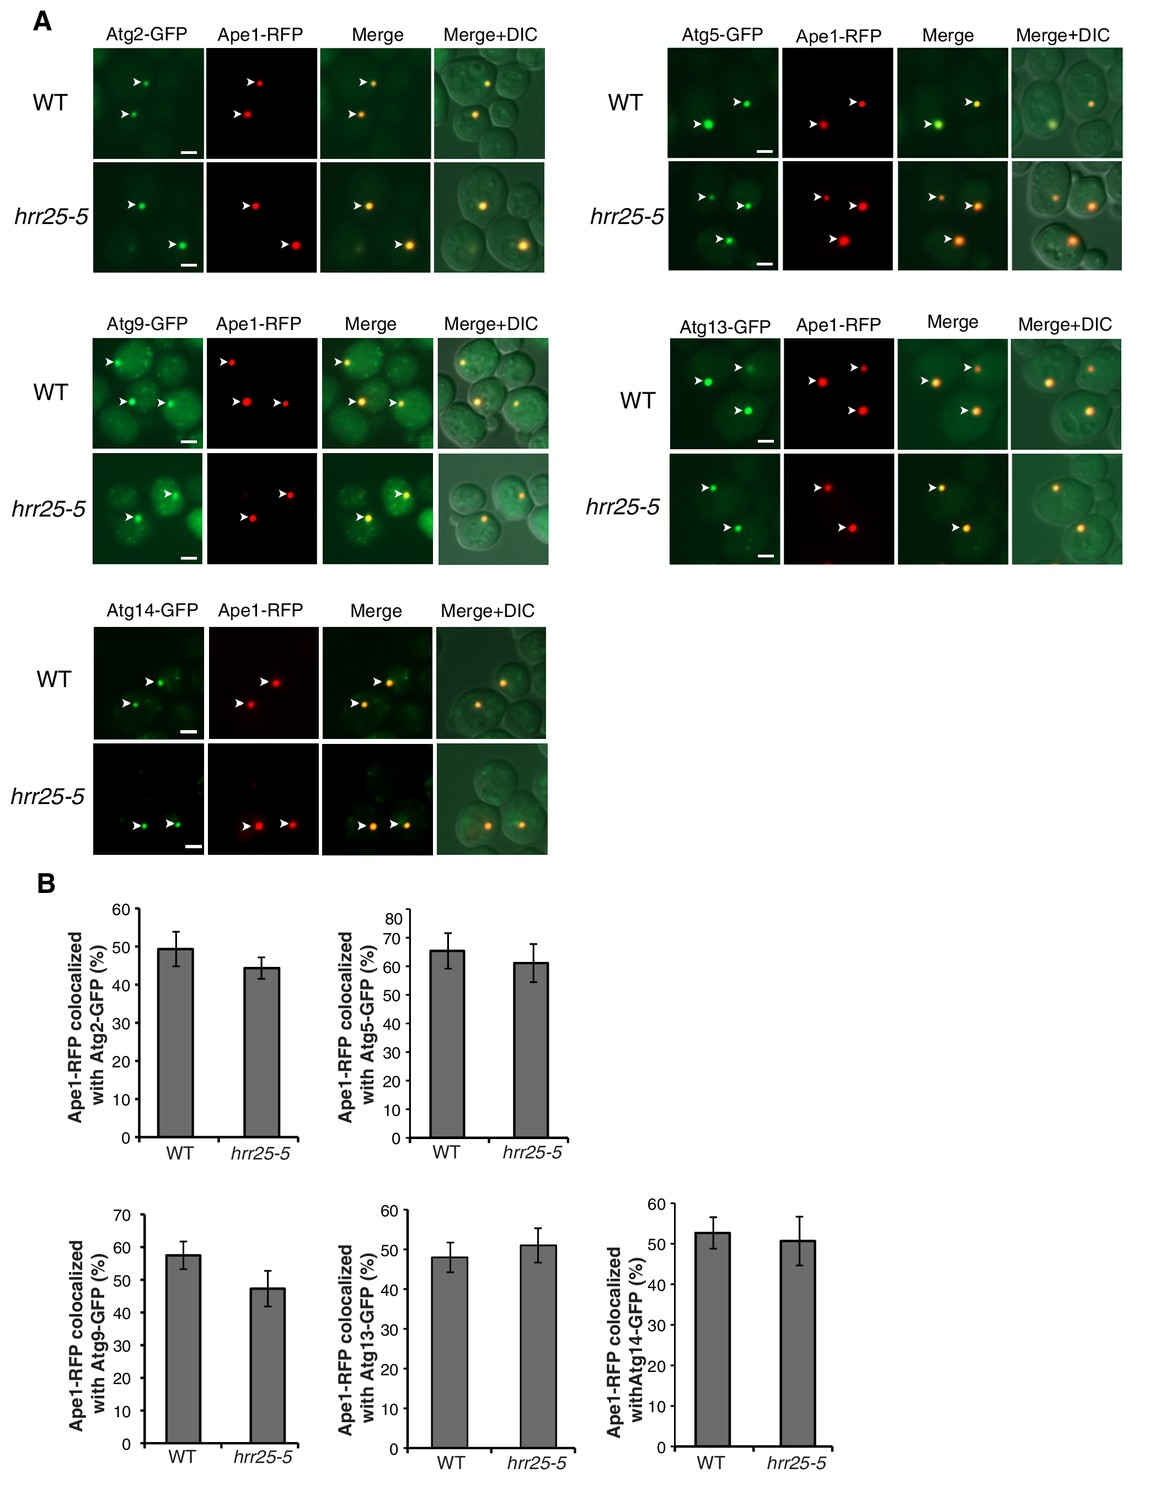
The hrr25-5 mutant does not affect Atg assembly at the PAS.
(A) WT and hrr25-5 cells expressing Ape1-RFP and GFP tagged Atgs were starved for nitrogen for 2 hr at 37°C and the percent of Ape1-RFP colocalized with Atgs was determined in 300 cells. Arrowheads point to Ape1 puncta that colocalize with the Atg. Scale bar 2 µm. (B) Quantitation of data in (A). Averages and s.e.m. are shown for three biological replicates; p-value = 0.4 (Atg2), 0.66 (Atg5), 0.2 (Atg9), 0.6 (Atg13), 0.79 (Atg14), Student’s unpaired t-test.
Figure 6—figure supplement 4

The sec12-4 mutant does not affect Atg2 or Atg14 PAS localization.
(A) WT and sec12-4 cells expressing Ape1-RFP and Atg2-GFP or Atg14-GFP were starved for nitrogen for 2 hr at 37°C and the percent of Ape1-RFP colocalized with Atg2 or Atg14 was determined in 300 cells. Arrowheads point to Ape1 puncta that colocalize with the Atg protein. Scale bar 2 µm. (B) Quantitation of data in (A). Averages and s.e.m. are shown for three biological replicates; p-value = 0.5 (Atg2), 0.19 (Atg14), Student’s unpaired t-test.
Figure 7 with 1 supplement
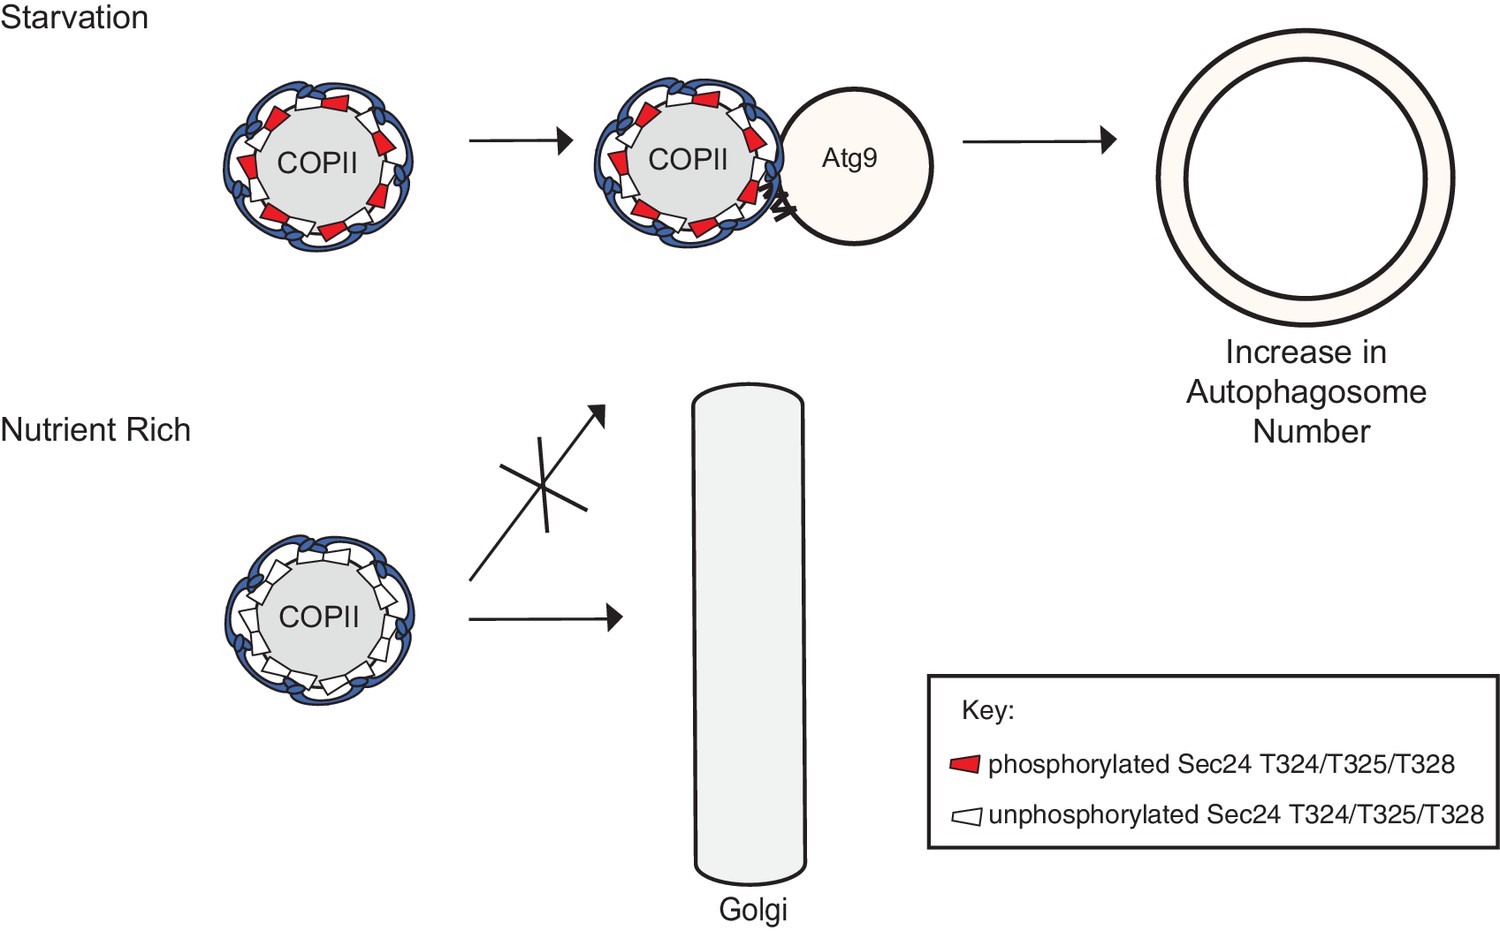
Phosphorylation of a conserved regulatory surface of Sec24 enhances the ability of the COPII coat to recognize the autophagy machinery.
Phosphorylation of the Sec24 membrane distal sites regulates the interaction of Sec24 with the C-terminus of Atg9. During starvation, the Sec24-Atg9 interaction is needed to increase autophagosome number. If Sec24 is not phosphorylated, it is unable to efficiently interact with Atg9 and COPII vesicles traffic to the Golgi.
Figure 7—figure supplement 1
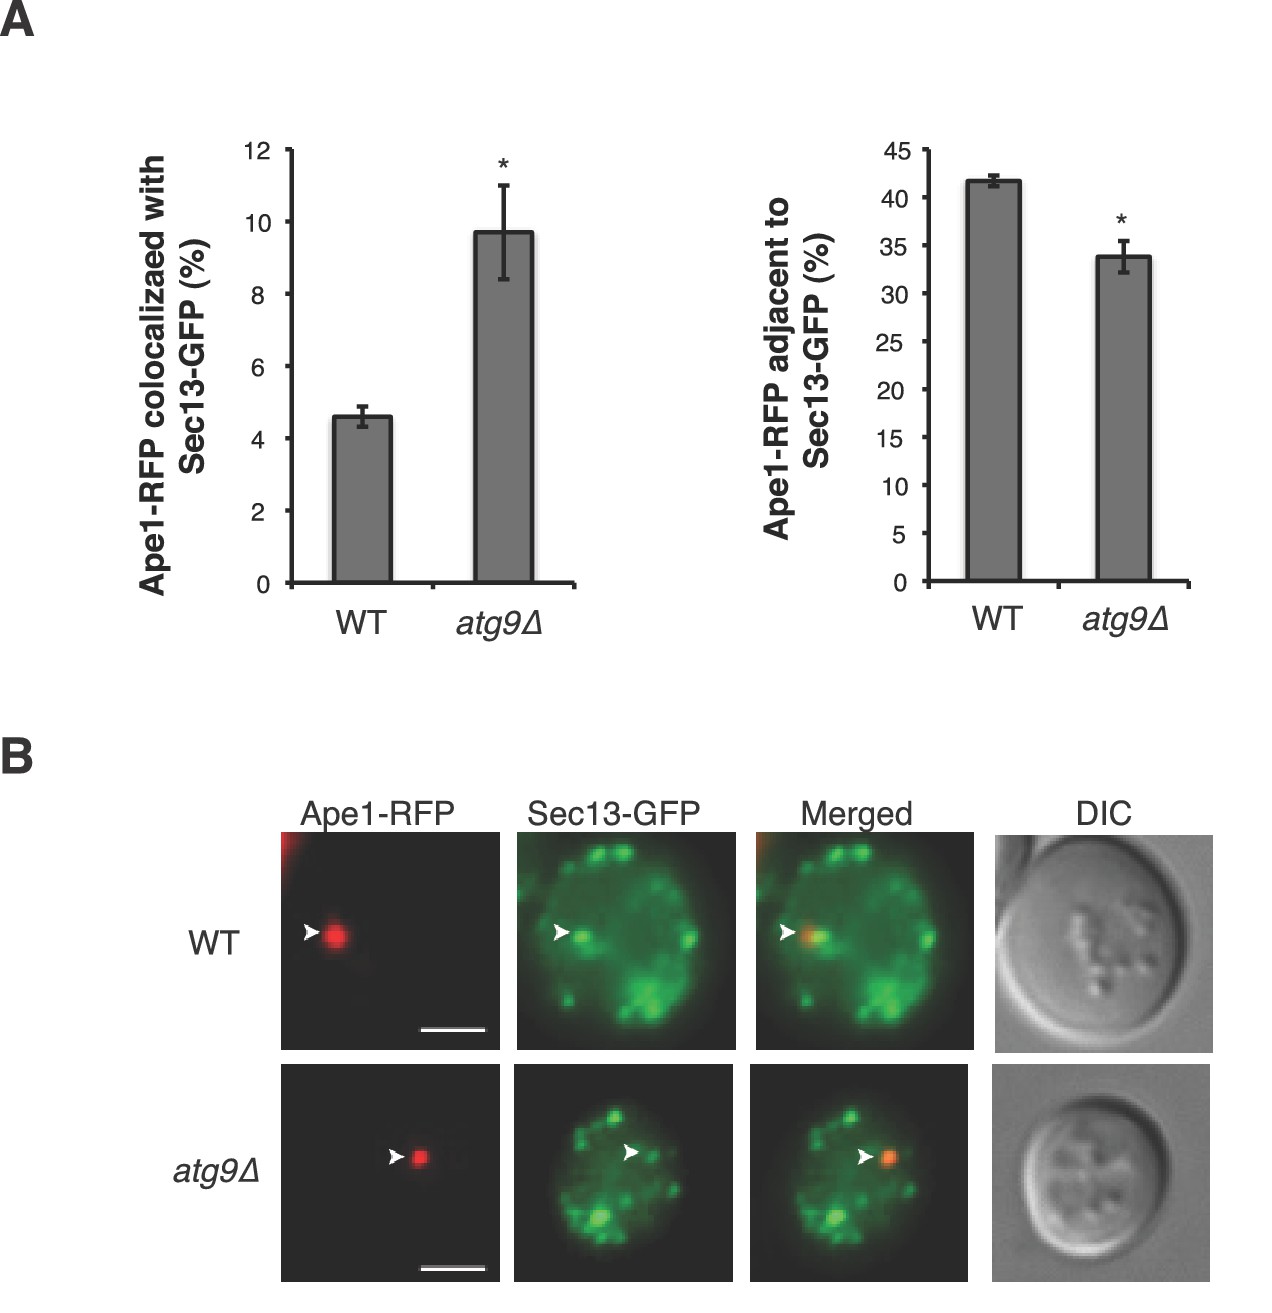
Sec13-GFP accumulates at the PAS in the atg9∆ mutant.
(A) WT and atg9∆ cells expressing Sec13-GFP and Ape1-RFP were starved for nitrogen for 2 hr at 30°C and the percent of Ape1-RFP that colocalized with (left) or was adjacent to (right) Sec13-GFP was determined for over 300 cells from three biological replicates. When the COPII vesicles accumulate in the atg9∆ mutant, fewer are found adjacent to the PAS. Averages and s.e.m. are shown for three biological replicates. p-value = 0.018 (colocalized), 0.01 (adjacent to), Student’s unpaired t-test. *p<0.05. (B) Representative images quantitated in (A). Scale bar 2 µm. Arrowheads mark the PAS.
Additional files
-
Supplementary file 1
Identification of Sec24 phosphorylation sites.
Sec24-His6 was purified from yeast and subjected to tandem mass spectrometry as described in the Materials and Methods. Phosphorylation sites with a confidence level of 40% or greater were further analyzed. Phosphorylated residues were mutated to either aspartic or glutamic acid and introduced into sec24∆ and sec24∆iss1∆ deletion strains as described in the Materials and Methods. Sec24 and Iss1 were aligned using MAFFT alignment program and residues were considered conserved if either serine or threonine.
- https://doi.org/10.7554/eLife.21167.026
-
Supplementary file 2
Key yeast strains used in this study.
- https://doi.org/10.7554/eLife.21167.027
-
Supplementary file 3
High confidence Sec24 phosphorylated peptides.
Compilation of mass spectrometry data of Sec24 phosphorylated peptides summarized in Figure 1B and Supplementary file 1.
- https://doi.org/10.7554/eLife.21167.028
Download links
A two-part list of links to download the article, or parts of the article, in various formats.
Downloads (link to download the article as PDF)
Open citations (links to open the citations from this article in various online reference manager services)
Cite this article (links to download the citations from this article in formats compatible with various reference manager tools)
Sec24 phosphorylation regulates autophagosome abundance during nutrient deprivation
eLife 5:e21167.
https://doi.org/10.7554/eLife.21167


