PDE2A2 regulates mitochondria morphology and apoptotic cell death via local modulation of cAMP/PKA signalling
- University of Oxford, United Kingdom
- University of Glasgow, United Kingdom
- University of Groningen, The Netherlands
- University of Padova, Italy
- University of Gothenburg, Sweden
Figures
Figure 1 with 2 supplements
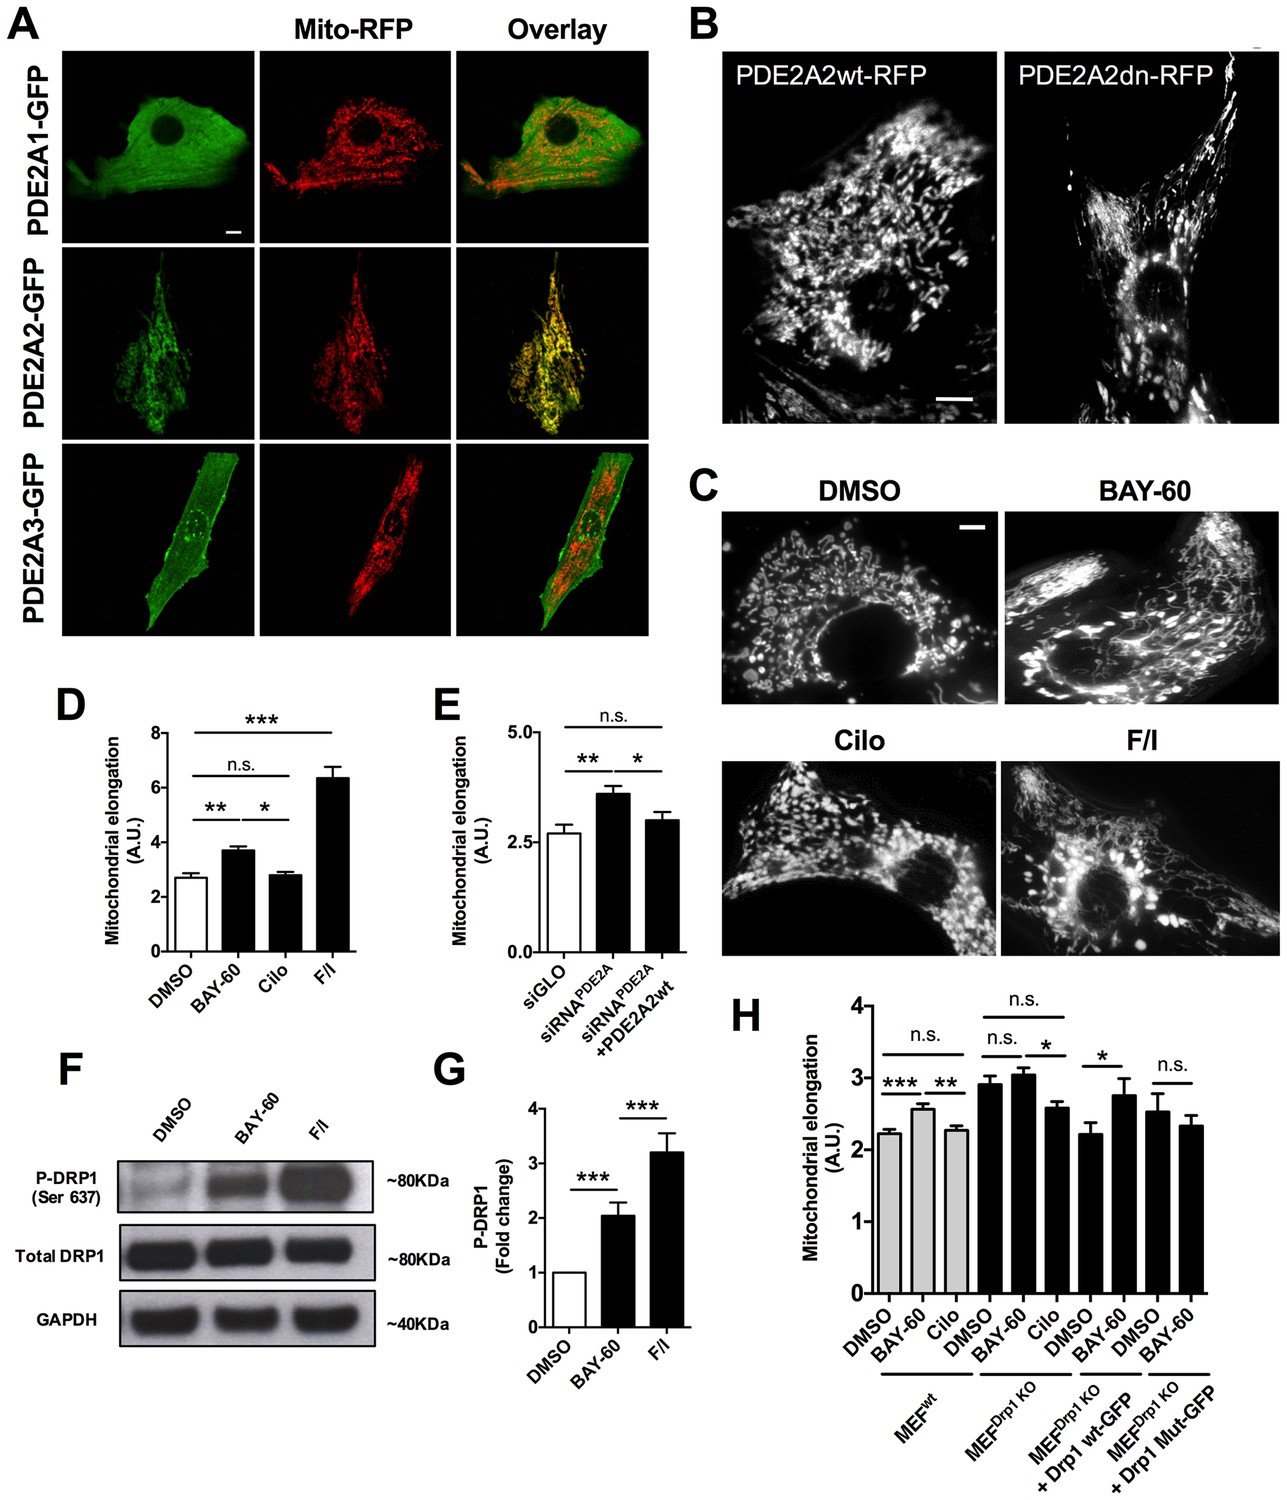
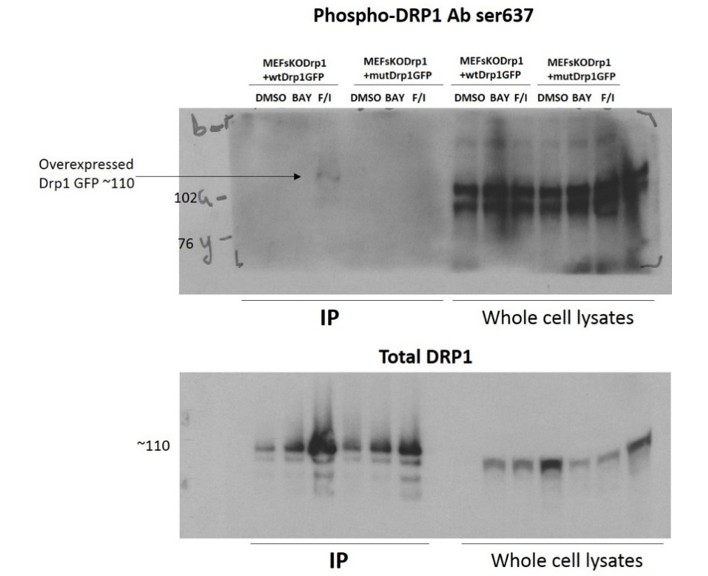
PDE2A2 localises to the mitochondria in NRVM and regulates mitochondria morphology via DRP1.
(A) Localisation of PDE2A1-GFP, PDE2A2-GFP and PDE2A3-GFP in neonatal rat ventricular myocytes (NRVM) labelled with mitotracker red. Scale bar: 10 µm. (B) Localisation of wild type (PDE2A2wt-RFP) or catalytically inactive (PDE2A2dn-RFP) PDE2A2 in NRVM. Scale bar: 10 µm. (C) NRVM treated with the indicated drugs (F/I: Forskolin/IBMX) and incubated with mitotracker red to stain mitochondria. Scale bar: 10 µm. (D) Quantitative analysis of mitochondrial length on cells as shown in C. n = 40 cells from three biological replicates. (E) Quantitative analysis of mitochondrial length in cells transfected with a control siRNA sequence (siGLO), a specific siRNA for PDE2A (siRNAPDE2A) alone or in combination with a plasmid carrying a siRNA-resistant PDE2A2 sequence. n = 30 cells from 3 biological replicates. (F) Western blotting analysis of cell lysates obtained from NRVM treated with the indicated drugs and probed for phospho-DRP1 (ser637), total DRP1 and GAPDH, as indicated. Representative of 5 biological replicates. (G) Quantification of the western blotting analysis as shown in F). (H) Quantitative analysis of mitochondrial length in MEFswt and MEFs Drp1KO stable clones treated with DMSO, BAY60 and Cilostamide, and MEFsDrp1KO overexpressing Drp1 wt-GFP or Drp1 mut -GFP and treated with the same drugs. n = 30 cells from three biological replicates. ANOVA test with Bonferroni correction was used for statistical analysis. *0.01≤p≤0.05, **0.001≤p<0.01, ***p<0.001.
Figure 1—figure supplement 1
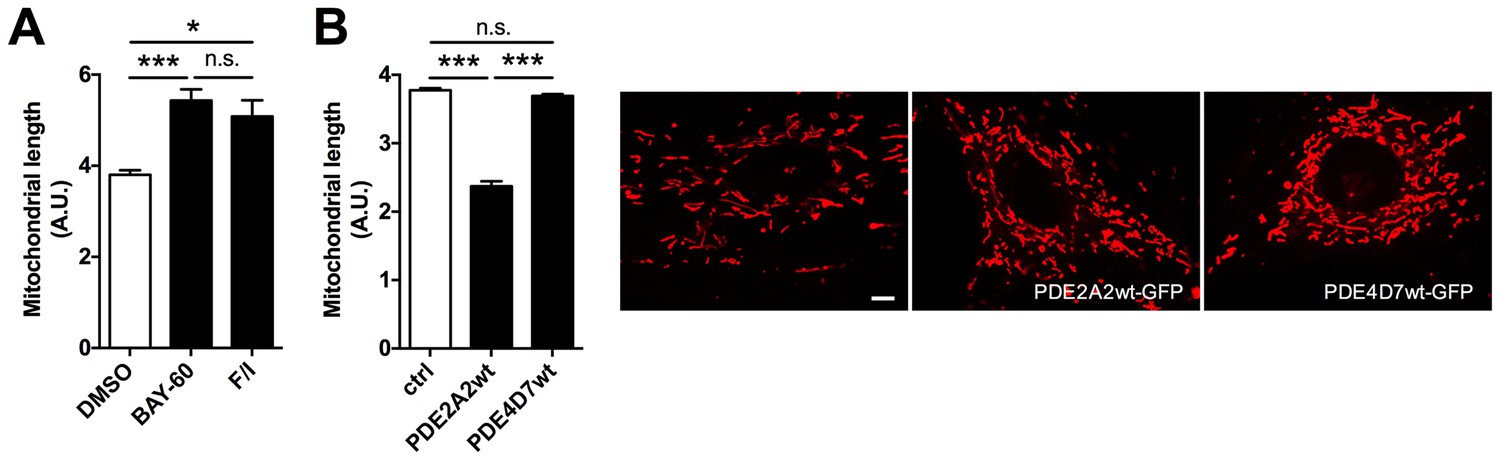
PDE2A2 regulates mitochondria morphology in H9C2 myoblasts.
(A) Analysis of mitochondrial length in H9C2 cells treated with Bay 60–7550 (1 µM) or Forskolin (25 µM) and IBMX (100 µM). (B) Left panel: analysis of mitochondrial length in H9C2 cells expressing PDE2A2wt or PDE4D7wt (n = 3). Right panels: images of the H9C2 cells incubated with Mitotracker red to stain mitochondria and representative of the experiment summarised on the left. Scale bar: 10 µm. ANOVA test with Bonferroni correction was used for statistical analysis. *0.01≤p≤0.05, **0.001≤p<0.01, ***p<0.001.
Figure 1—figure supplement 2
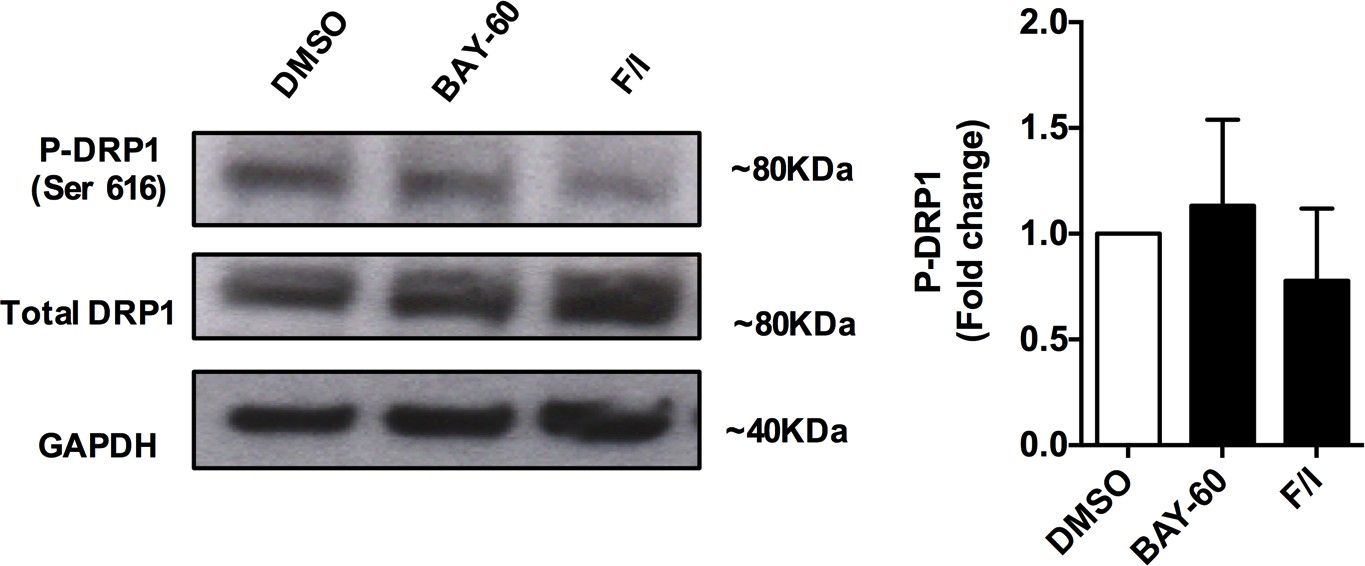
The effect of PDE2A inhibition on DRP1 phosphorylation at ser616.
Western blotting analysis of cell lysates from NRVM treated with DMSO, Bay 60–7550 (1 µM) or forskolin (25 µM) plus IBMX (100 µM) and probed for the CDK1 site ser616 on DRP1. The panel on the right shows the quantification of 3 biological replicates. ANOVA test with Bonferroni correction used for statistical analysis did not show any significance.
Figure 2
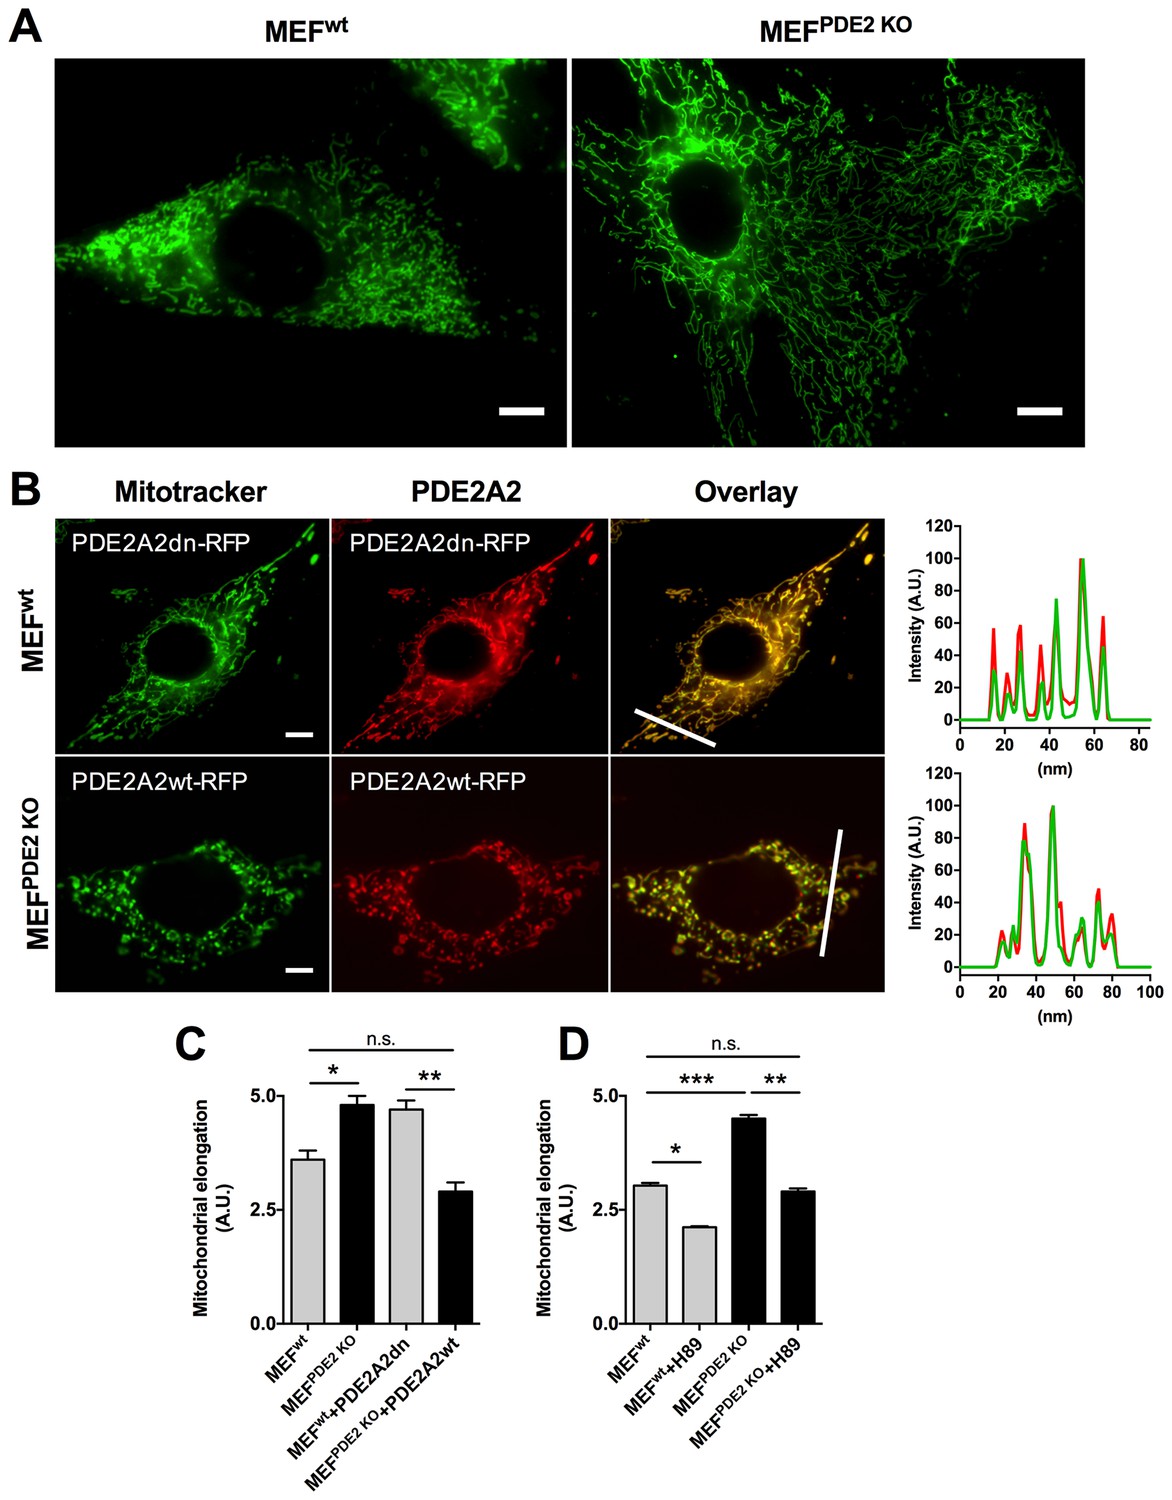
Mitochondria morphology is affected by PDE2A knock out.
(A) Wild type (MEFwt) and PDE2KO (MEFPDE2KO) mouse embryonic fibroblasts stained with mitotracker green. Scale bar: 10 µm. (B) MEFwt and MEFPDE2KO expressing catalytically inactive (PDE2A2dn-RFP) or wild type (PDE2A2wt-RFP) PDE2A2, respectively and stained with mitotracker green. The overlay of the RFP and mitotracker signal is also shown. Panels on the right show the fluorescence intensity profile for the mitotracker (red line) and PDE2A2-RFP proteins (green line) along with the line shown in the overlay images. Scale bar: 10 µm. (C) Quantitative analysis of mitochondria morphology on images shown in B. n = 35 cells from three biological replicates. (D) Quantitative analysis of mitochondria morphology in MEF cells treated with the PKA inhibitor H89. n = 25 cells from two biological replicates. ANOVA test with Bonferroni correction was used for statistical analysis. *0.01≤p≤0.05, **0.001≤p<0.01, ***p<0.001.
Figure 3 with 2 supplements
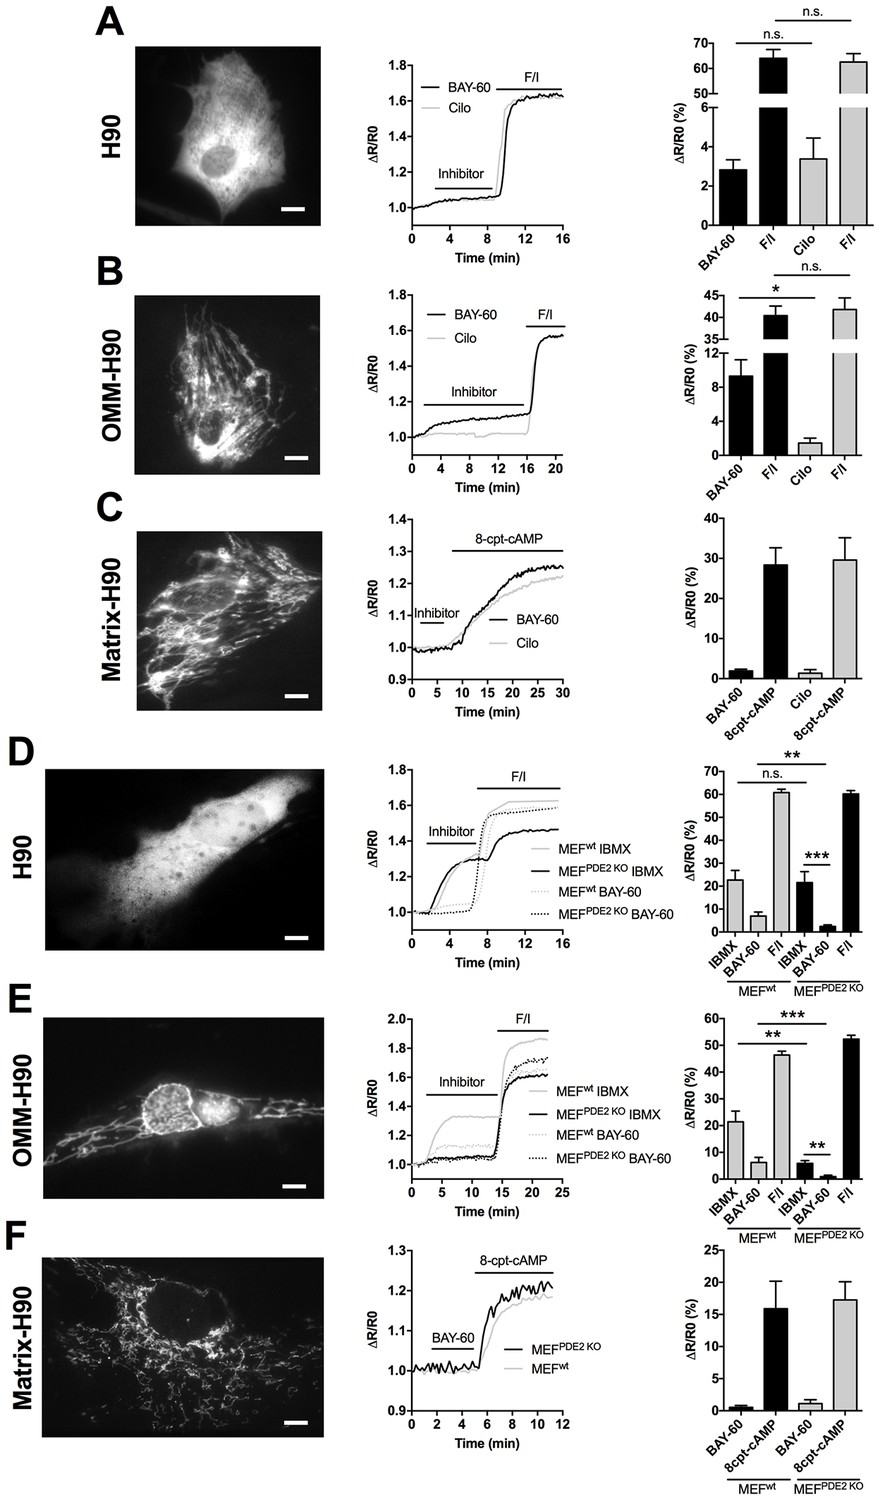
PDE2A2 controls cAMP at the outer mitochondrial membrane.
(A) FRET analysis in NRVM expressing the cytosolic EPAC-based H90 sensor (left) and treated with the PDE2 selective inhibitor Bay 60–7550 (BAY60, 1 µM) or the PDE3 selective inhibitor cilostamide (Cilo), 10 µM). 25 µM Forskolin and 100 µM IBMX (F/I) was applied at the end of the experiment to achieve saturation of the sensor. Representative kinetics of FRET change are shown in the middle panel and summary of all experiments is shown in the panel on the right. n = 15 cells from three biological replicates. Scale bar: 10 µm. (B) FRET analysis in NRVM expressing an outer mitochondrial membrane-targeted version (OMM) of H90 and relative representative traces and summary of all the experiments. Cell treatment was as in A). n = 15 cells from three biological replicates. Scale bar: 10 µm. (C) FRET analysis in NRVM expressing a version of H90 targeted to the matrix and challenged with PDE selective inhibitors as in A, followed by application of the membrane permeable cAMP analogue 8CPT (200 µM). Representative kinetics and summary of experiments is shown in the middle and right panel, respectively. n = 12 cells from three biological replicates. Scale bar: 10 µm. (D) FRET analysis in Wild type (MEFwt) and PDE2KO (MEFPDE2KO) MEFs expressing the cytosolic EPAC-based H90 sensor (left) and treated with the non-selective PDEs inhibitor IBMX (100 µM) or the PDE2 selective inhibitor Bay 60–7550 (BAY60 100 nM). 25 µM Forskolin and 100 µM IBMX (F/I) was applied at the end of the experiment to achieve saturation of the sensor. Representative kinetics of FRET change are shown in the middle panel and summary of all experiments is shown in the panel on the right. n = 10 cells from three biological replicates. Scale bar: 10 µm. (E) FRET analysis in Wild type (MEFwt) and PDE2KO (MEFPDE2KO) expressing the outer mitochondrial membrane-targeted version (OMM) of H90 (left) and treated with the non-selective PDEs inhibitor IBMX (100 µM) or the PDE2 selective inhibitor Bay 60–7550 (BAY60 100 nM). Representative kinetics and summary of experiments is shown in the middle and right panel, respectively. n = 10 cells from three biological replicates. Scale bar: 10 µm. (F) FRET analysis in Wild type (MEFwt) and PDE2KO (MEFPDE2KO) expressing the mitochondrial matrix-targeted version of H90 (left) and treated with the PDE2 selective inhibitor Bay 60–7550 (BAY60 100 nM). Representative kinetics and summary of experiments is shown in the middle and right panel, respectively. n = 6 cells from two biological replicates. Scale bar: 10 µm. ANOVA test with Bonferroni correction was used for statistical analysis. *0.01≤p≤0.05, **0.001≤p<0.01, ***p<0.001.
Figure 3—figure supplement 1
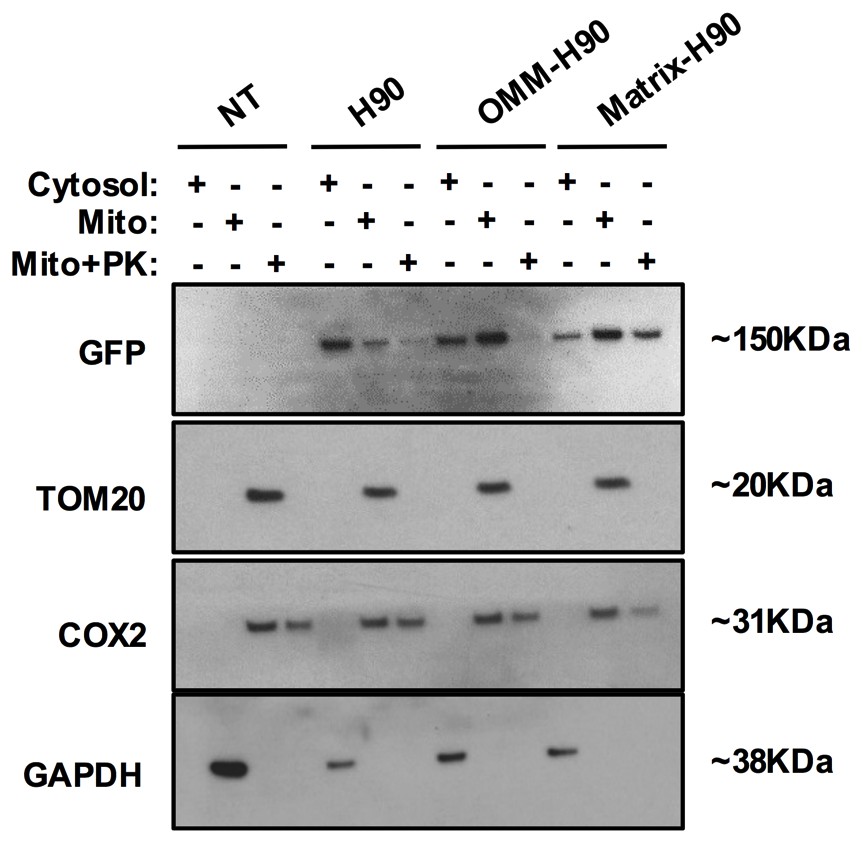
Localisation of cytosolic and targeted H90.
Representative Western blotting analysis of cytosolic and mitochondrial (Mito) sub-fractions obtained from NRVM lysates not treated and treated with Proteinase K (PK, 10 µM). Cells were not transfected (NT) or transfected with the sensor H90, OMM-H90 or matrix-H90. The fluorophore of the sensors was detected with a GFP antibody. To assess fraction purity, antibodies for TOM20 (OMM), COX2 (matrix), and GAPDH (cytosol) were used. N = 3 biological replicates.
Figure 3—figure supplement 2
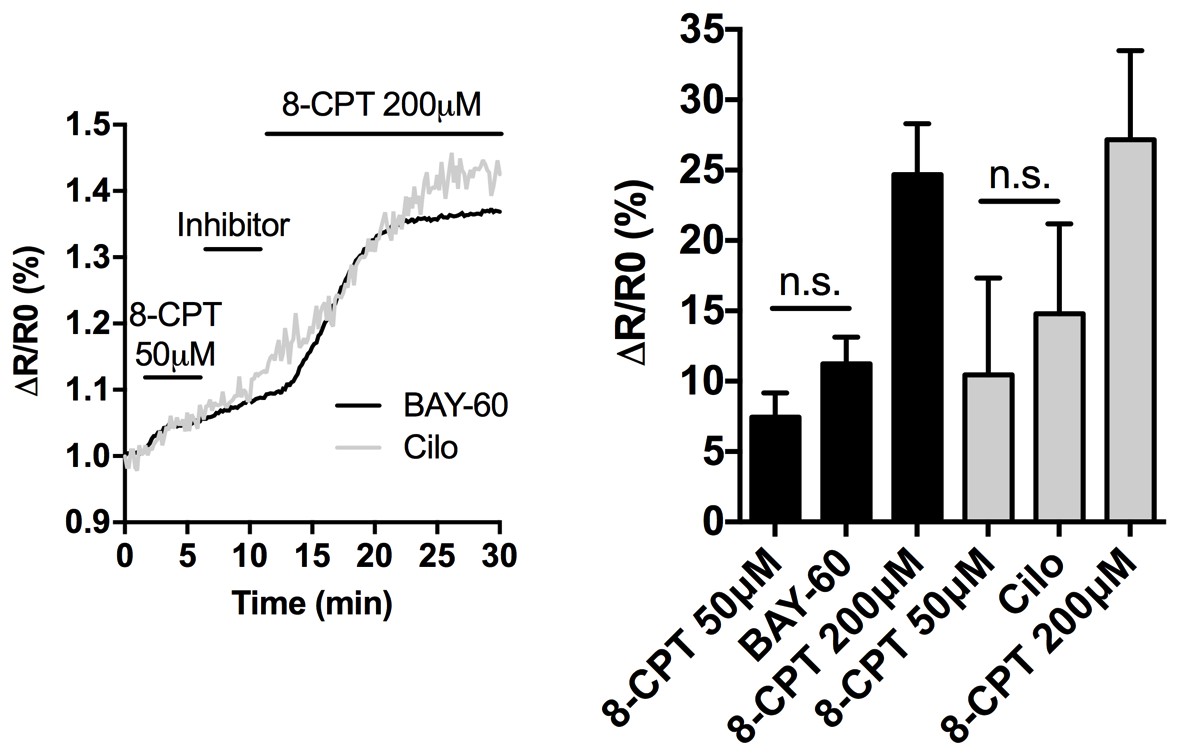
Effect of PDE2A inhibition on cAMP levels in the matrix.
Representative kinetics (left) and summary data (right) of FRET analysis of cAMP changes detected in the mitochondrial matrix of NRVM expressing the matrix-targeted sensor matrix-H90. Cells were treated with a non-saturating concentration of the cAMP analogue 8-CPT (50 µM), followed by treatment with Bay 60–7550 (1 µM) or cilostamide (10 µM). Subsequent addition of 200 µM 8-CPT saturates the sensor. N > 10 cells from three biological replicates. ANOVA test with Bonferroni correction was used for statistical analysis.
Figure 4 with 1 supplement
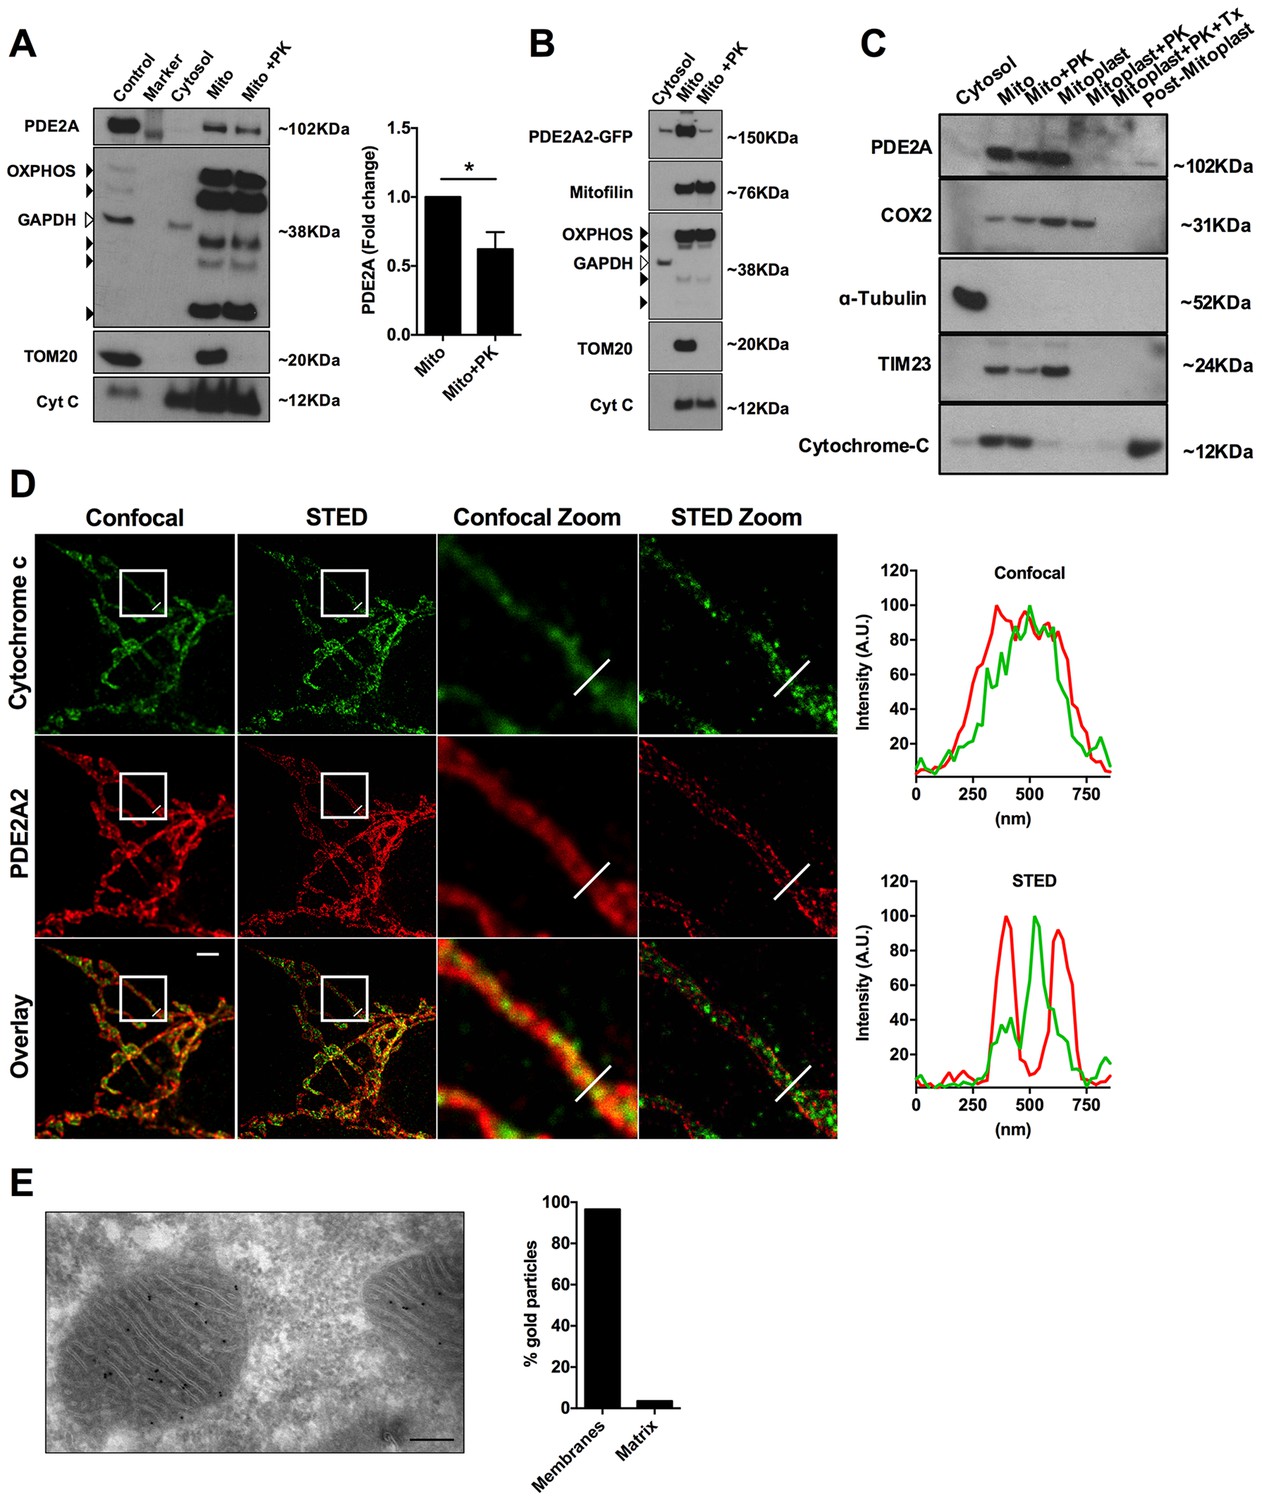
Submitochondrial localisation of PDE2A2.
(A) Representative Western blotting analysis of cytosolic and mitochondrial sub-fractions obtained from NRVM lysates not treated and treated with Proteinase K (10 µM). PDE2A was probed with a PDE2A specific antibody. To assess fraction purity, antibody for OXPHOS subunits (black arrowheads), TOM20 and Cytochrome C were used. GAPDH was used to assess contamination of cytosol in the mitochondrial fraction. The panel on the right shows the quantification from four biological replicates. Student t-test was used for statistical analysis. * = p<0.05. (B) Representative Western blot of subcellular fractions obtained from Hela cells expressing PDE2A2-GFP. The mitochondrial fraction was either non treated or treated with Proteinase K. PDE2A2 was assessed with a GFP-specific antibody. Mitofilin was probed here in addition to the mitochondrial markers used in A). This experiment was repeated twice with similar results. (C) Representative Western blot of cytosolic, mitochondrial, mitoplasts and post-mitoplast fractions obtained from NRVM lysates. Samples were either untreated or treated with Proteinase K (PK, 10 µM) or Triton-X plus PK. PDE2A was probed with a PDE2A specific antibody. Cytochrome c oxidase subunit II (COX2) is a marker for mitochondrial matrix; Tubulin is marker for cytosol; TIM23 is marker for IMM; cytochrome-c is a marker for IMS. Blot is representative of three independent experiments. (D) Confocal and STED image (first and second column, respectively) of a HeLa cell expressing PDE2A2-GFP and labelled with antibodies to cytochrome c and GFP. Third and fourth columns show magnification of the boxed areas. Plots on the right show average intensity profiles across the indicated mitochondrial tubule section. Cytochrome c profile is in green and PDE2A2 profile is in red. Scale bar: 2 µm. (E) Representative electron microscopy image of NRVM probed with PDE2A antibody detected by protein A conjugated with 10 nm gold beads. The count of relative mitochondrial distribution of the immunogold particles is shown on the right (n = 25 mitochondria). Magnification 100X, scale bar: 200 nm.
Figure 4—figure supplement 1
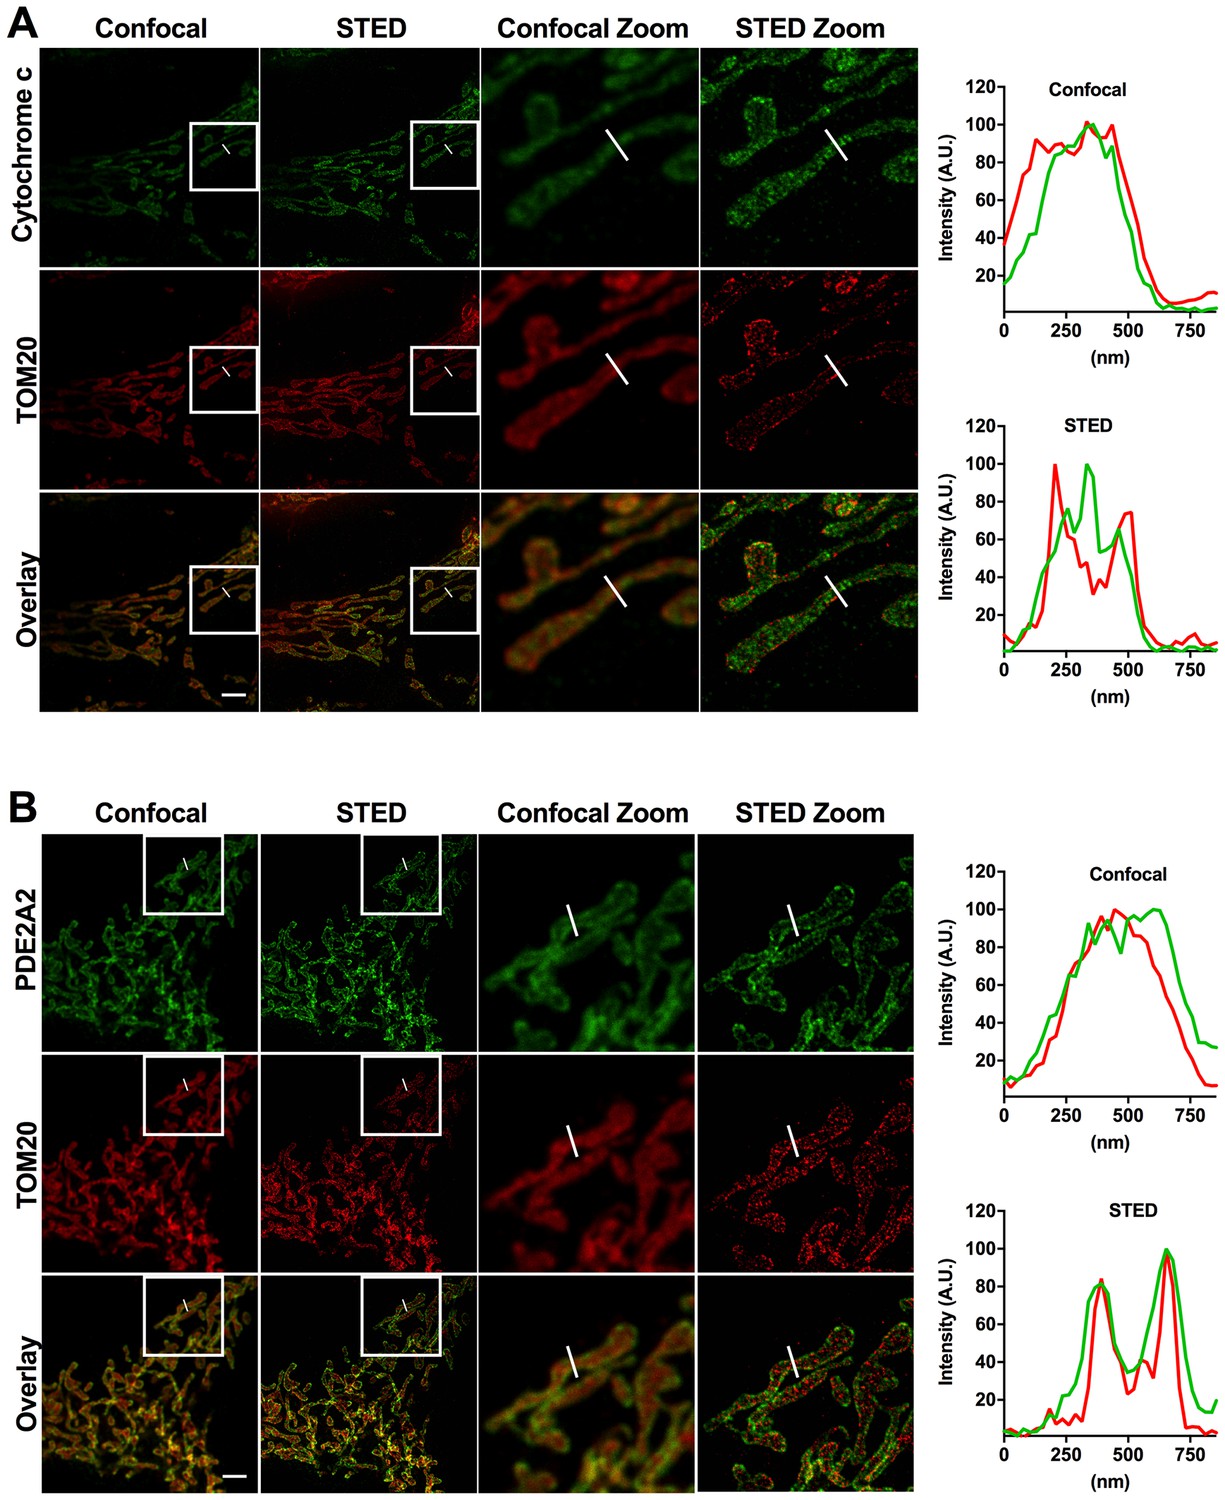
Relative localisation of PDE2A2 and either TOM20 or cytochrome c as revealed by STED microscopy analysis.
(A) Representative confocal and STED images of a HeLa cell labelled with antibodies specific to cytochrome c and TOM20. (B) Representative confocal and STED images of HeLa cell expressing PDE2A2-GFP and labelled with antibodies specific to TOM20 and GFP. (C) In both panels, a magnification of the boxed areas is also shown. Panels on the right show fluorescence intensity profiles across the indicated mitochondrial tubule section. Scale bar: 2 µm.
Figure 5 with 1 supplement
PDE2A inhibition affects mitochondrial membrane potential and cell survival.
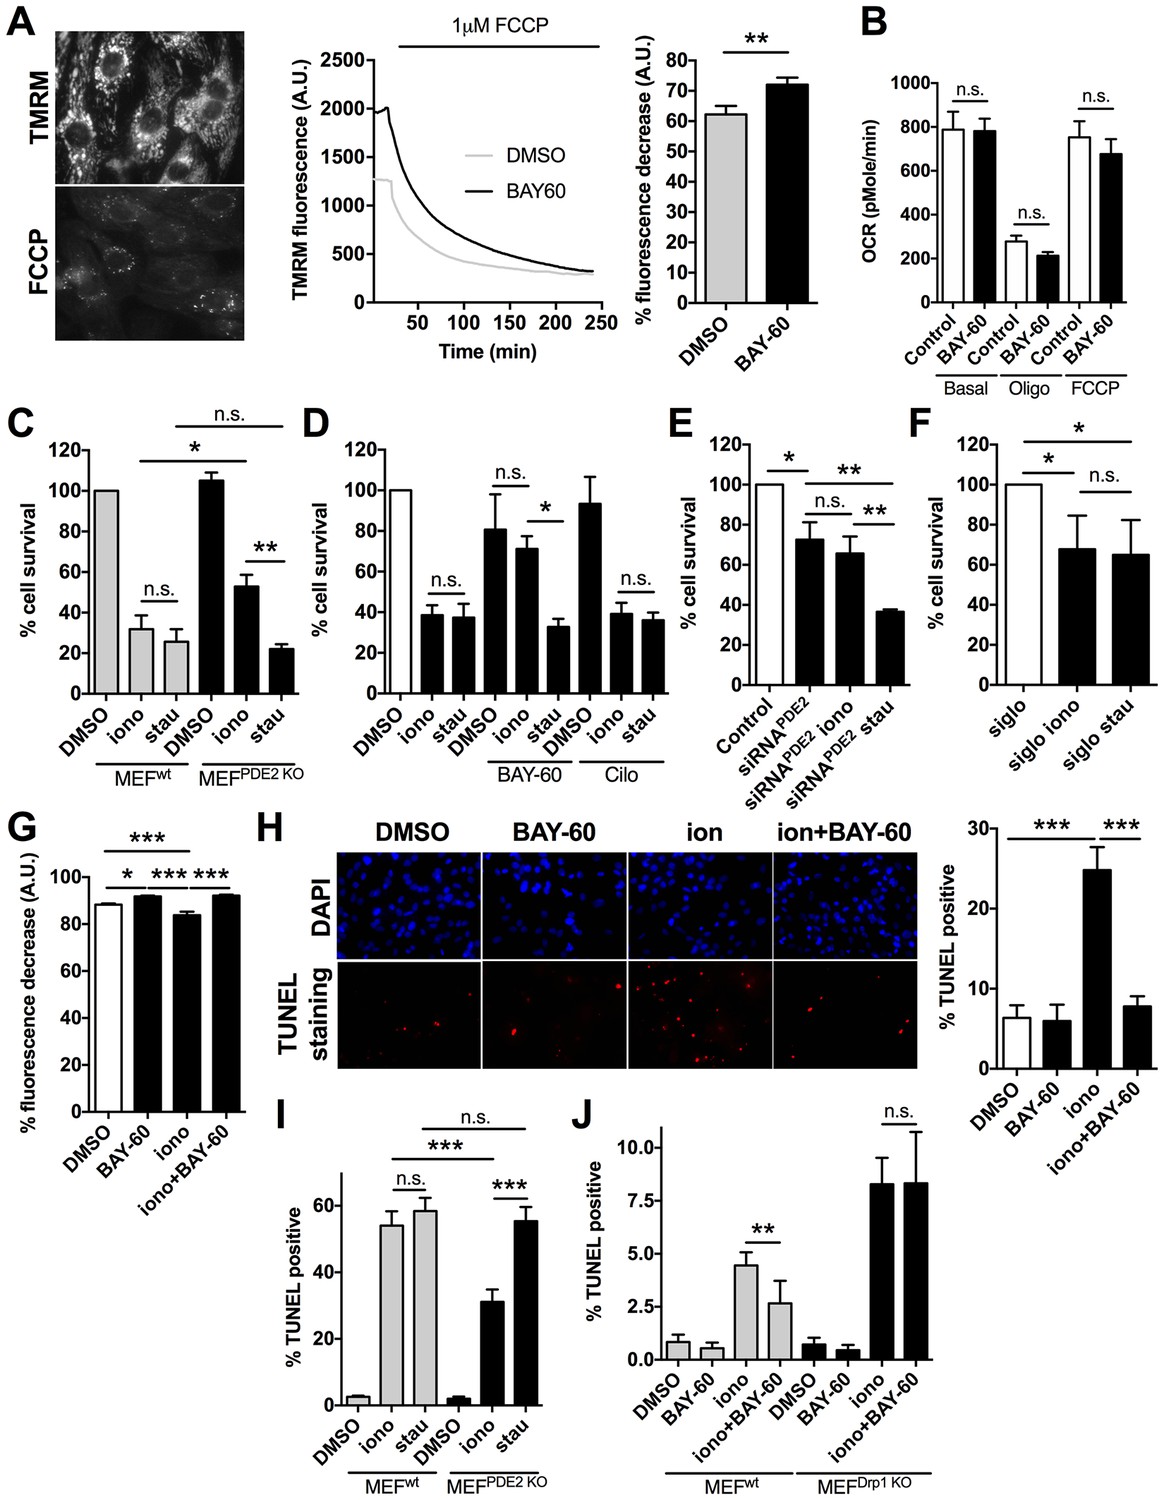
(A) Left panel: TMRM fluorescence signal before and after application of 1 µM FCCP to NRVM. Representative kinetics (middle panel) and summary of experiments (right panel, n = 60 cells from three biological replicates) showing the effect of pre-treatment of NRVM with the PDE2A inhibitor Bay 60–7550 (1 µM) compared to control, on the TMRM signal decay after application of FCCP. Values are expressed as percent decrease. (B) Oxygen consumption rates (OCR) of NRVM treated with DMSO (control) or with Bay 60–7550 (1 µM) for 24 hr. Basal rates or rates after the addition of 1 μM oligomycin (oligo) or FCCP (100 nM) are the mean ± SEM of three time points in triplicate. Data are from three biological replicates. (C) Effect of 10 µM ionomycin or 500 nM staurosporin on survival of MEFwt and MEFPDE2KO relative to untreated MEFwt cells. n = 4 biological replicates, each with eight technical replicates per condition. (D) Effect of ionomycin or staurosporin on survival of NRVM treated with ionomycin or staurosporin and in the presence of either the PDE2A inhibitor Bay 60–755 (1 µM) or the PDE3 inhibitor cilostamide (10 µM). Values are expressed relative to untreated controls. n = 6 biological replicates, each with eight technical replicates per condition. (E) Effect of ionomycin or staurosporin on cell viability of NRVM in which PDE2A was knocked down by siRNA. Values are expressed as relative to untreated and non-transfected cells. n = 4 biological replicates, each with eight technical replicates per condition. (F) Effect of ionomycin or staurosporin on cell viability of NRVM transfected with the control siRNA sequence siGLO. n = 4 biological replicates, each with eight technical replicates per condition. (G) Summary of experiments (n > 40 cells) showing the effect of acute application of ionomycin (10 µM) on NRVM pre-treated with the PDE2A inhibitor Bay 60–7550 (1 µM) compared to control. Values are expressed as percent decrease of the TMRM signal after application of FCCP. (H) Representative images of TUNEL assay performed in NRVM treated with ionomycin (10 µM) or ionomycin (10 µM) plus Bay 60–7550 (1 µM). The bar graph on the right shows the summary data (n = 3 biological replicates, each with two technical replicates per condition). Values are TUNEL positive as percent of DAPI positive nuclei. (I) Quantification of TUNEL assay performed in MEFwt and MEFPDE2KO treated with ionomycin (10 µM) or staurosporin (500 nM). n = 3 independent experiments, each with four technical replicates per condition. (J) Quantification of TUNEL assay performed in MEFWT and MEFDrp1KO treated with ionomycin (10 µM) or Ionomycin plus Bay 60–7550 (1 µM). n = 3 independent experiments, each with two technical replicates per condition. Student t-test was used for statistical analysis in A. ANOVA test with Bonferroni correction was used in all the other cases. *0.01≤p≤0.05, **0.001≤p<0.01, ***p<0.001.
Figure 5—figure supplement 1
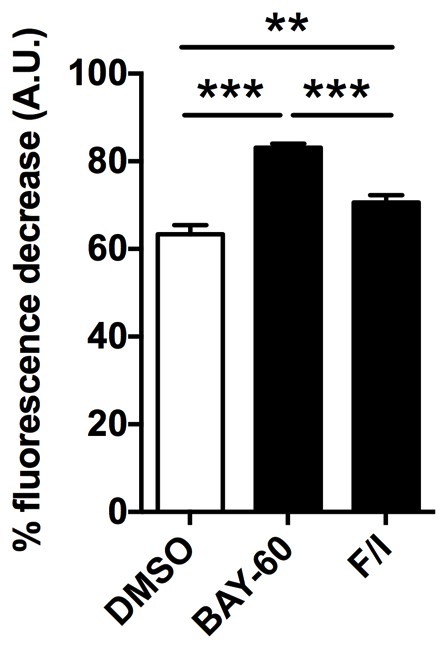
PDE2A affects mitochondrial membrane potential in H9C2 cells.
Mitochondria membrane potential measured in H9C2 myoblasts treated with DMSO, Bay 60–7550 (1 µM) or forskolin (25 µM) plus IBMX (100 µM). The cells were loaded with TMRM to fluorescently label the mitochondria and were challenged with FCCP to collapse the mitochondria membrane potential. Summary from three biological replicates. ANOVA test with Bonferroni correction was used for statistical analysis. **0.001≤p<0.01, ***p<0.001.
Figure 6
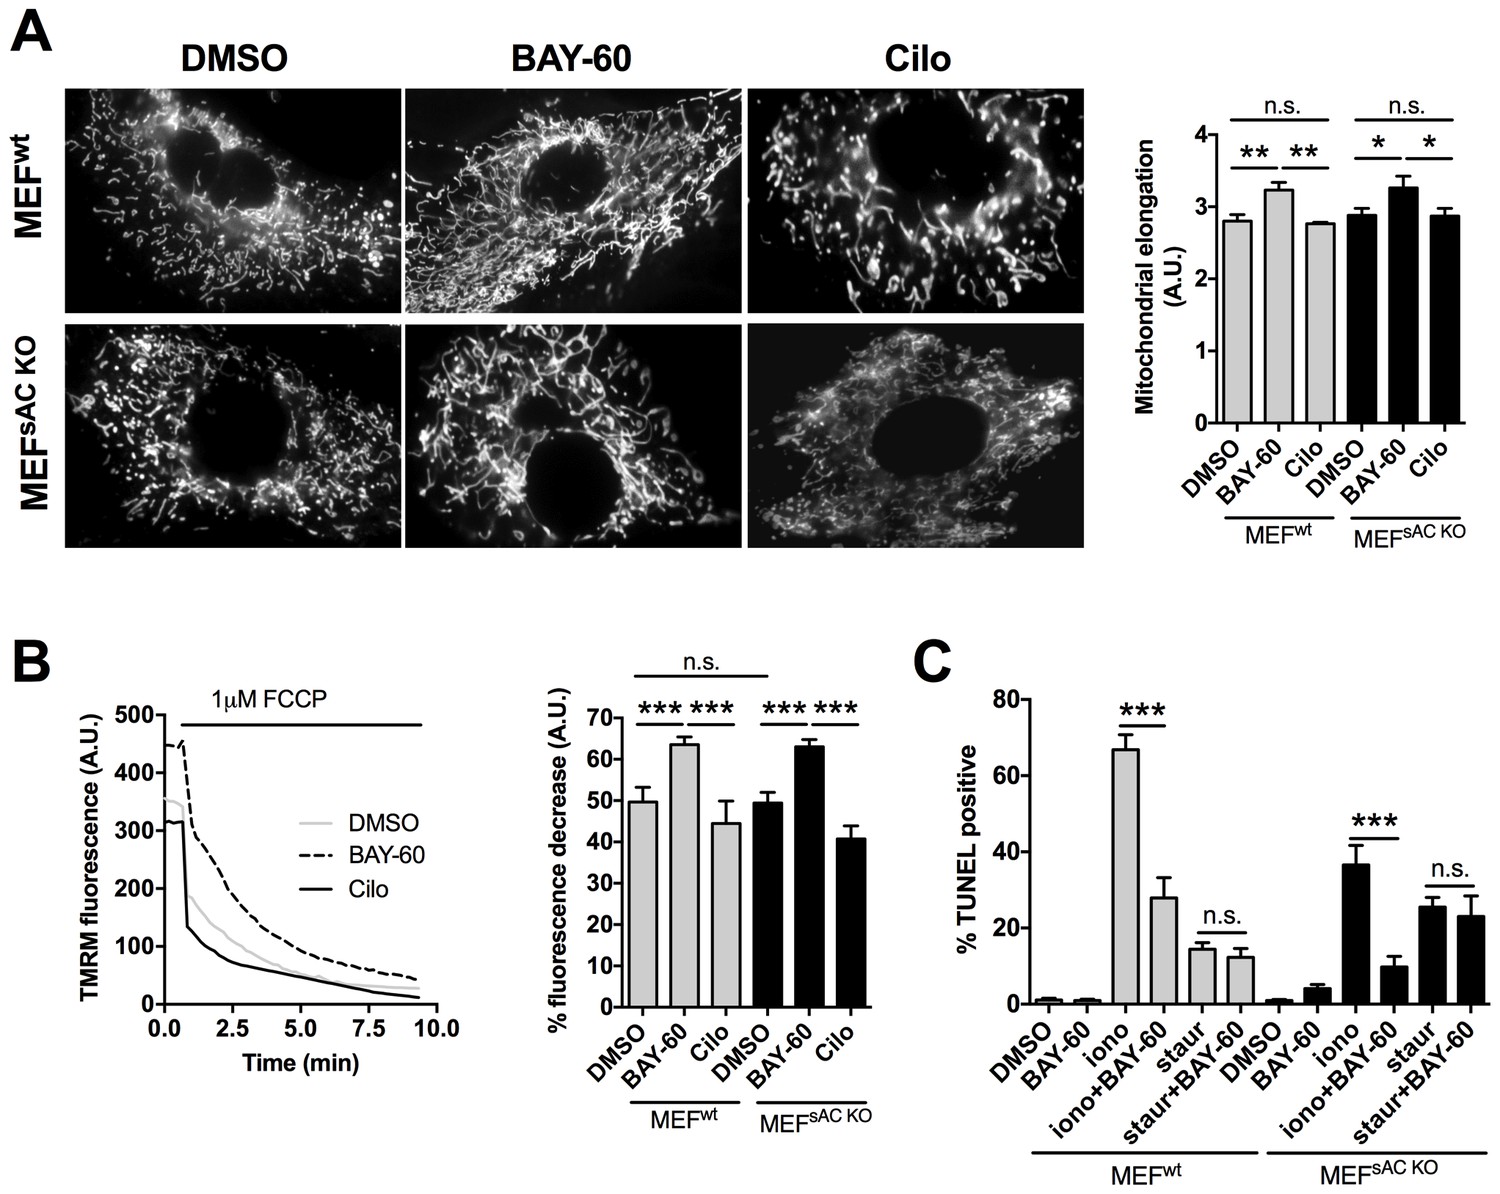
The effect of PDE2A2 inhibition on mitochondria morphology, mitochondrial membrane potential and apoptotic cell death is independent of sAC.
(A) On the left, representative image of MEFwt and MEFsACKO cells either untreated (DMSO) or treated with Bay 60–7550 (1 µM) or cilostamide (10 µM), and loaded with mitotracker red. The summary analysis of mitochondrial length is shown on the right (n = 22 cells from two independent experiments). (B) Analysis of mitochondrial membrane potential measured in MEFwt and MEFsACKO untreated or treated with Bay 60–7550 or cilostamide and labelled with TMRM. Representative kinetics of TMRM fluorescence decay on application of FCCP to MEFwt are shown on the left. Summary data on the right are expressed as percent decrease (n > 50 cells from four independent experiments). (C) TUNEL assay performed in MEFwt and MEFsACKO either untreated or treated with Bay 60–7550, ionomycin, staurosporin, or a combination as indicated. n = 3 independent experiments, each with two technical replicates for condition. ANOVA test with Bonferroni correction was used for statistical analysis. *0.01≤p≤0.05, **0.001≤p<0.01, ***p<0.001.
Author response image 1
Download links
A two-part list of links to download the article, or parts of the article, in various formats.
Downloads (link to download the article as PDF)
Open citations (links to open the citations from this article in various online reference manager services)
Cite this article (links to download the citations from this article in formats compatible with various reference manager tools)
PDE2A2 regulates mitochondria morphology and apoptotic cell death via local modulation of cAMP/PKA signalling
eLife 6:e21374.
https://doi.org/10.7554/eLife.21374


