The paranodal cytoskeleton clusters Na+ channels at nodes of Ranvier
- Weizmann Institute of Science, Israel
- Baylor College of Medicine, United States
- University of Edinburgh, United Kingdom
Figures
Figure 1 with 2 supplements
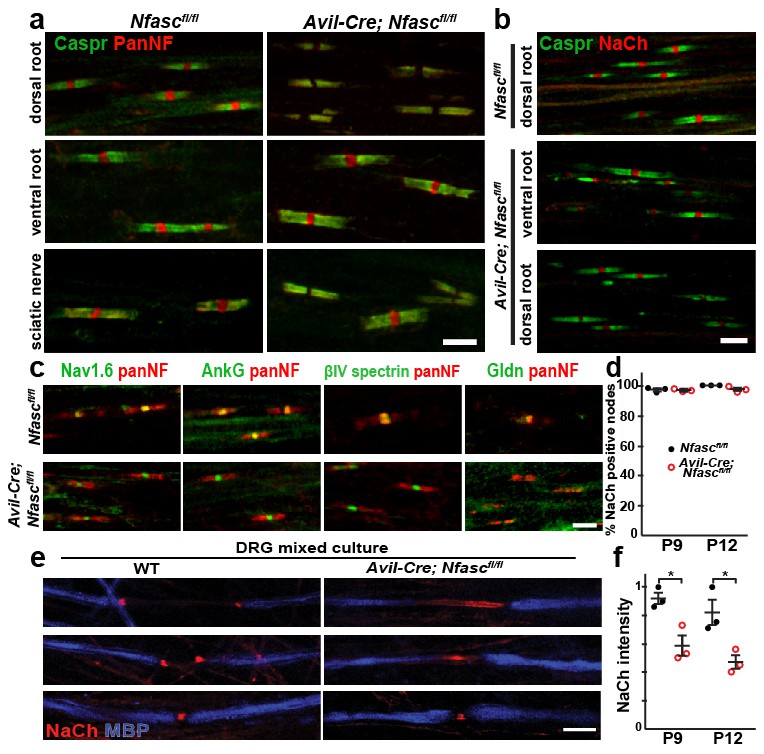
NF155-dependent paranodal junctions can cluster Na+ channels in the PNS.
(a) Immunostaining of P12 dorsal roots, ventral roots, and sciatic nerve from Nfascfl/fl and Avil-Cre;Nfascfl/fl mice using a pan Nfasc (Pan-NF, red) and Caspr (green) antibodies. Note the yellow overlap of the two labels at the paranodes in both genotypes. Scale bar, 5 µm. (b) Immunostaining of P12 dorsal and ventral roots from Nfascfl/fl and Avil-Cre;Nfascfl/fl mice using pan Na+ channel (NaCh, red) and Caspr (green) antibodies. Scale bar, 5 µm. (c) Immunostaining of P12 dorsal roots from Nfascfl/fl and Avil-Cre;Nfascfl/fl mice using panNF (red) to label nodes and paranodes, and antibodies against Nav1.6, AnkG, βIV spectrin, or Gldn to label nodes (green). Note that the nodal panNF staining observed in the Nfascfl/fl mice is much stronger than the paranodal immunoreactivity. Thus, the paranodal panNF staining is more pronounced in the Avil-Cre;Nfascfl/fl mice. Scale bar, 5 µm. (d) Quantification of the percentage of dorsal root nodes of Ranvier with nodal Na+ channels at P9 and P12. N = 3 mice at each time point for each genotype. (e) Immunostaining of dorsal root ganglion/Schwann cell mixed cultures from wild-type and Avil-Cre;Nfascfl/fl mice using antibodies against NaCh (red) and myelin basic protein (MBP, blue). Scale bar = 10 µm. (f) Quantification of the relative Na+ channel fluorescence intensity at P9 and P12. N = 3 mice at each time point for each genotype. *p=0.016 at P9; p=0.026 at P12. The number of nodes measured at P9 were 263 and 250, at P12 were 337 and 269 in the Nfascfl/fl and Avil-Cre;Nfascfl/fl dorsal roots, respectively.
Figure 1—figure supplement 1
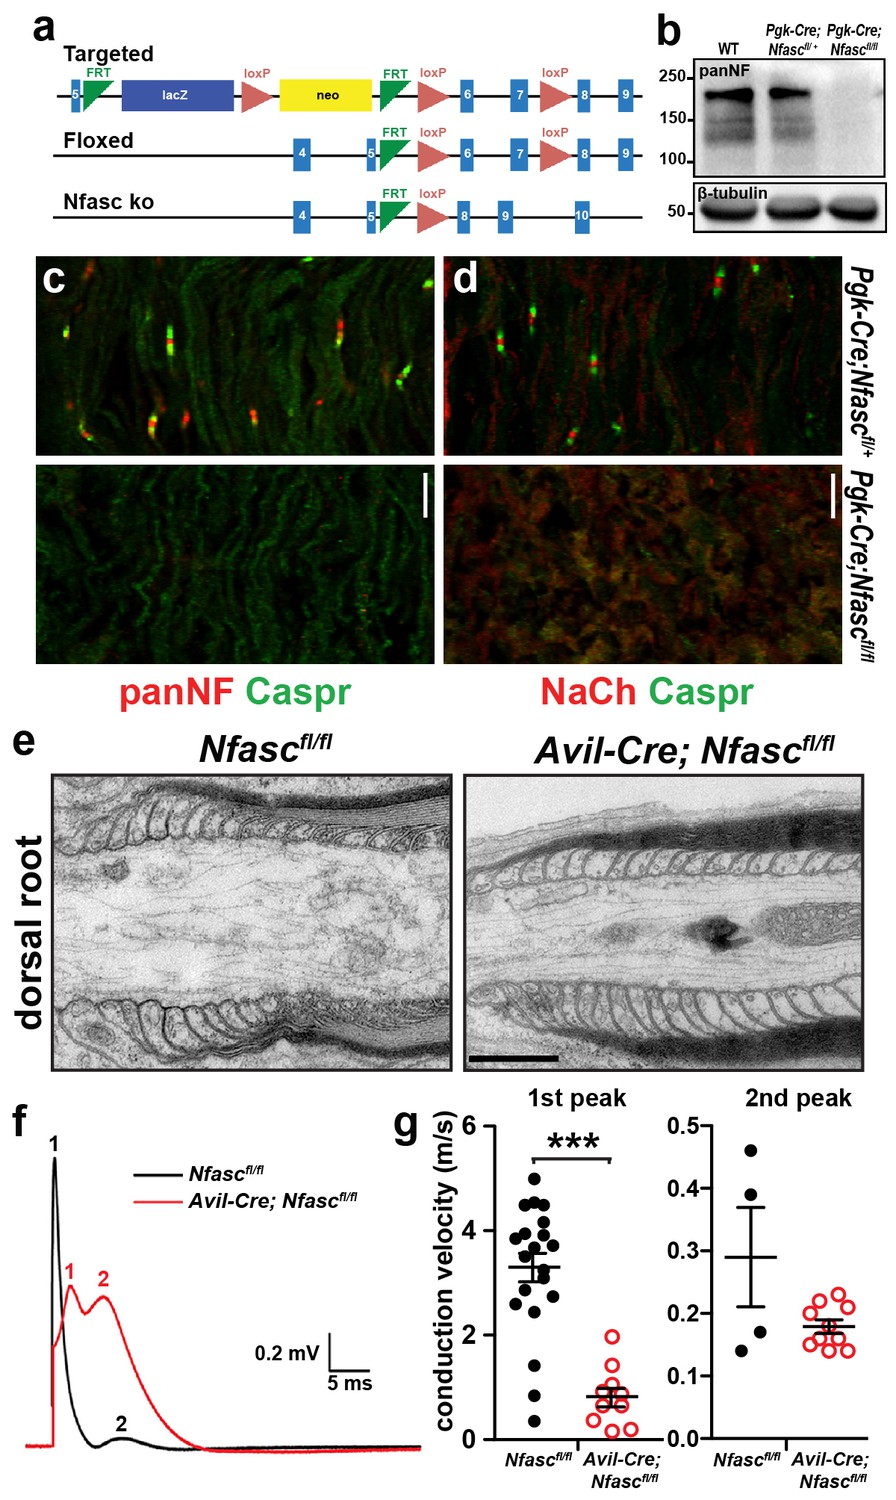
Characterization of Pgk-Cre;Nfascfl/fl and Avil-Cre;Nfascfl/fl mice.
(a) Targeting strategy to generate Nfasc conditional knockout mice. (b) Immunoblot of P6 control and Pgk-Cre;Nfascfl/fl mouse brain lysates using PanNF antibodies and β-tubulin antibodies as a loading control. (c, d) Immunostaining of P4 Pgk-Cre;Nfascfl/+ and Pgk-Cre;Nfascfl/fl mouse sciatic nerves using PanNF (c, red), Nach (d, red), and Caspr (green) antibodies. Scale bar = 10 µm. (e) Transmission electron microscopy of dorsal root paranodes from P12 Nfascfl/fl and Avil-Cre;Nfascfl/fl mice. Scale bar = 0.5 µm. (f) Example of a dorsal root compound action potential from P10 Nfascfl/fl and Avil-Cre;Nfascfl/fl mice. (g) Conduction velocities calculated from the first and second peaks of the compound action potential recorded from P10 dorsal roots. In many recordings, a clear second peak was not always detectable and this was usually the case in the Nfascfl/fl roots. We have only included the second peak where it was clearly resolved in the recordings. ***p=2.62E−08.
Figure 1—figure supplement 2
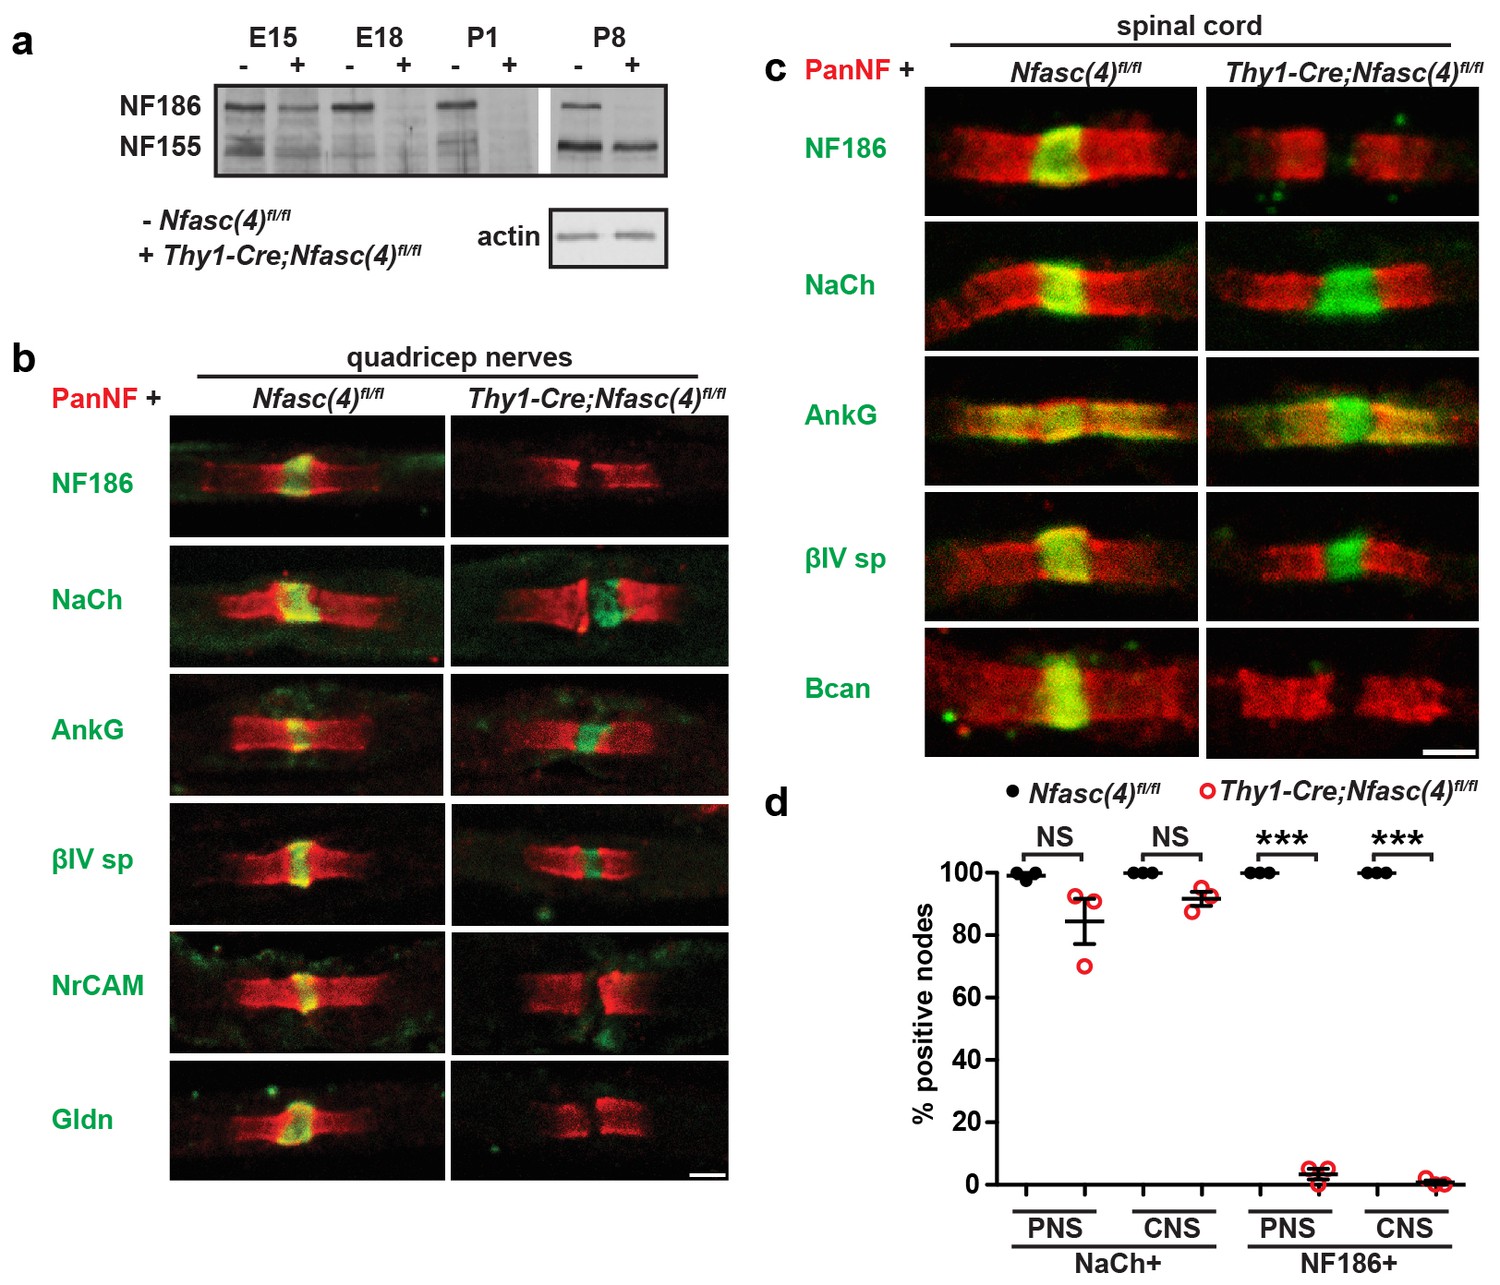
NF155-dependent paranodal junctions can cluster Na+ channels in the PNS and CNS.
(a) Immunoblot of embryonic day 15 (E15), E18, P1, and P8 spinal cords from Nfasc(4)fl/fl and Thy1-Cre;Nfasc(4)fl/fl mice using PanNF antibodies and actin as a loading control. (b–c) Immunostaining of P5 quadriceps nerves (b) and P5 spinal cord (c) from Nfasc(4)fl/fl and Thy1-Cre;Nfasc(4)fl/fl mice using PanNF (red) and other node-specific antibodies (green) as indicated in the figure. Scale bars = 2 µm. (d) The percentage of P5 PNS and CNS nodes from Nfasc(4)fl/fl and Thy1-Cre;Nfasc(4)fl/fl mice that were labeled using antibodies against Na+ channels or NF186. N = 3 mice/genotype. ***p=4.18E−08 (PNS NF186+); p=4.18E−08 (CNS NF186+).
Figure 2 with 1 supplement

NF155-dependent paranodal junctions can cluster Na+ channels in the CNS.
(a–c) Immunostaining of P17, P30, and P60 optic nerves from Nfascfl/fl and Six3-Cre;Nfascfl/fl mice using chicken panNF (green) and mouse monoclonal pan Na+ channel (NaCh, red) antibodies. Scale bar, 10 µm. (d) The percentage of panNF nodes that have Na+ channels. N = 4 animals per time point per genotype. *p=0.03. (e) Nodal Na+ channel immunofluorescence intensity at P17, P30, and P60 in optic nerves from Nfascfl/fl and Six3-Cre;Nfascfl/fl mice. N = 4 animals per time point per genotype.
Figure 2—figure supplement 1
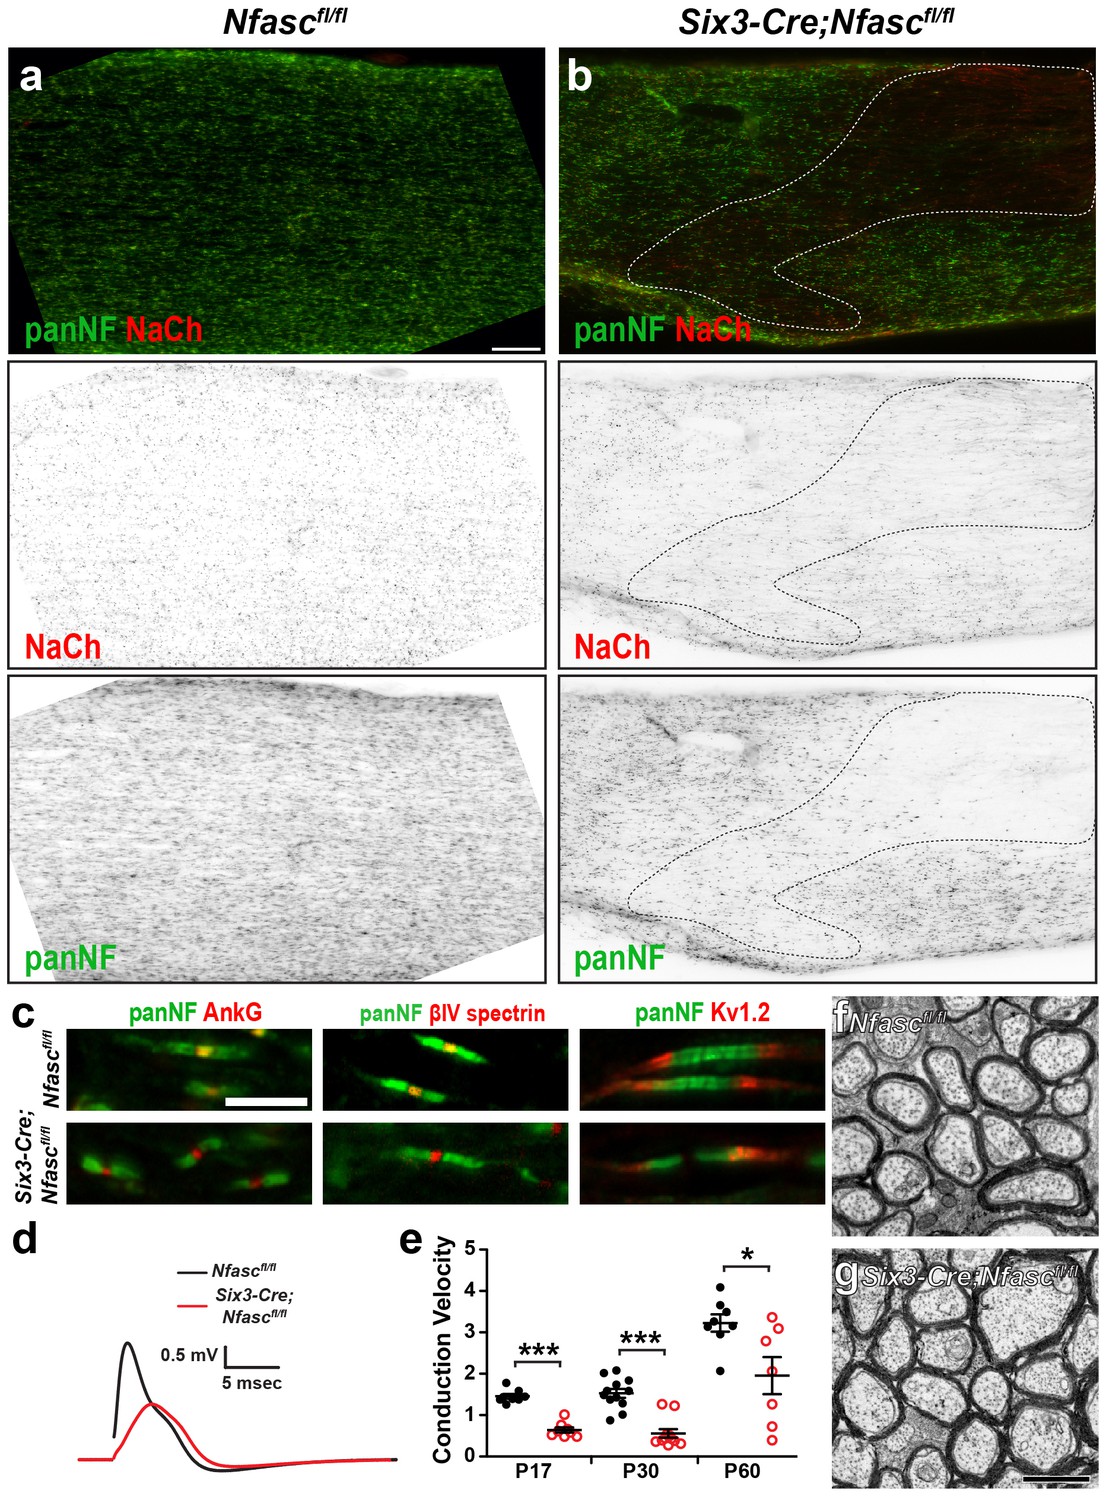
Characterization of Six3-Cre;Nfascfl/fl mice.
(a, b) Immunostaining of Nfascfl/fl (a) and Six3-Cre;Nfascfl/fl (b) optic nerves using antibodies against panNF (green) and Na+ channels (red). The dotted line in (b) indicates a region where recombination occurred in oligodendrocytes. Scale bar = 50 µm. (c) Immunostaining of Nfascfl/fl and Six3-Cre;Nfascfl/fl nodes of Ranvier using antibodies against panNF (green) and AnkG, βIV spectrin, or Kv1.2 (red). Scale bar = 5 µm. (d) Optic nerve compound action potential recordings from P17 Nfascfl/fl and Six3-Cre;Nfascfl/fl mice. (e) Conduction velocities calculated from the peak of the compound action potential recorded from P17, P30, and P60 optic nerves. P17: ***p=2.75E−07. P30: ***p=2.47E−06. P60: *p=0.03. (f, g) Transmission electron microscopy of Nfascfl/fl(F) and Six3-Cre;Nfascfl/fl (G) optic nerves. Scale bar = 1 µm.
Figure 3
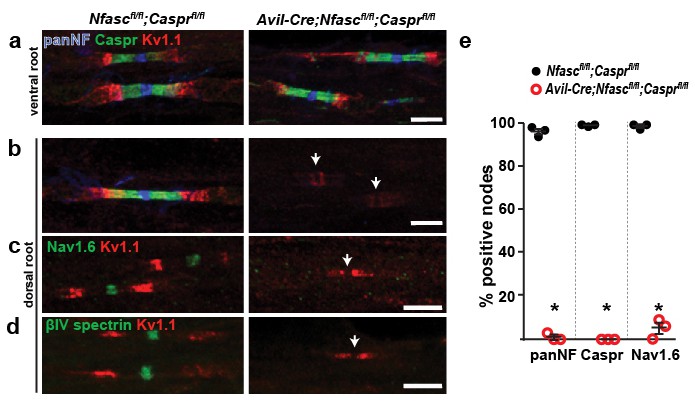
Paranodes can cluster Na+ channels at nodes of Ranvier.
(a, b) Immunostaining of P14 Nfascfl/fl;Casprfl/fl and Avil-Cre;Nfascfl/fl;Casprfl/fl ventral (a) and dorsal (b) roots using antibodies against panNF (blue), Caspr (green), and Kv1.1 (red). Arrows in (b) indicate the location of nodes. Scale bars, 10 µm. (c, d) Immunostaining of P14 Nfascfl/fl;Casprfl/fl and Avil-Cre;Nfascfl/fl;Casprfl/fl dorsal roots using antibodies against Nav1.6 Na+ channels (c, green), βIV spectrin (d, green), and Kv1.1 (red). Arrows indicate the location of nodes. Scale bars, 10 µm. (e) The percentage of nodes or paranodes labeled with the indicated antibodies in P14 Nfascfl/fl;Casprfl/fl and Avil-Cre;Nfascfl/fl;Casprfl/fl dorsal roots. N = 3 animals per genotype. Number of nodes analyzed in Nfascfl/fl;Casprfl/fl dorsal root: PanNF, 288; Caspr, 298; Nav1.6, 301. Number of nodes analyzed in Avil-Cre;Nfascfl/fl;Casprfl/fl dorsal root: PanNF, 365; Caspr, 365; Nav1.6, 336. *PanNF, p=0.0002; Caspr, p=8.07E-06; Nav1.6, p=0.0012.
Figure 4

The paranodal spectrin-based cytoskeleton can assemble nodes of Ranvier.
(a, b) TEM of longitudinal sections from dorsal roots of Nfascfl/fl;Sptbn1fl/fl (a) and Avil-Cre;Nfascfl/fl;Sptbn1fl/fl mice (b). Scale bars, 0.5 µm. (c, d) TEM of cross sections through dorsal roots of Nfascfl/fl;Sptbn1fl/fl (c) and Avil-Cre;Nfascfl/fl;Sptbn1fl/fl mice (d). Scale bars, 4 µm. (e) Immunostaining of P10 Nfascfl/fl;Sptbn1fl/fl and Avil-Cre;Nfascfl/fl;Sptbn1fl/fl dorsal roots using antibodies against Na+ channels and Caspr shows intact paranodal junctions. Scale bar, 5 µm. (f–h) Immunostaining of P15 Nfascfl/fl;Sptbn1fl/fl and Avil-Cre;Nfascfl/fl;Sptbn1fl/fl dorsal roots using antibodies against Na+ channels (e, red), AnkG (f, red), βIV spectrin (g, red) and panNF (green). Scale bar, 5 µm. (i) The percentage of nodes labeled for Na+ channels in P10 and P15 Nfascfl/fl;Sptbn1fl/fl and Avil-Cre;Nfascfl/fl;Sptbn1fl/fl dorsal and ventral roots. N = 4 animals per age and genotype. ***p=2.0E−06 at P10; p=6.26E−08 at P15.
Figure 5

Two glia-dependent mechanisms can cluster Na+ channels at nodes of Ranvier.
(a) Cartoon of control node of Ranvier. (b) Na+ channels are clustered in NF186-deficient mice by a paranodal spectrin cytoskeleton. However, the density of Na+ channels is reduced in the PNS. (c) Na+ channels are clustered in NF155-deficient and other paranodal mutant mice by NF186-ECM interactions. (d) Na+ channels fail to cluster at nodes of Ranvier when both NF186 and the paranodal cytoskeleton are lost.
Author response image 1
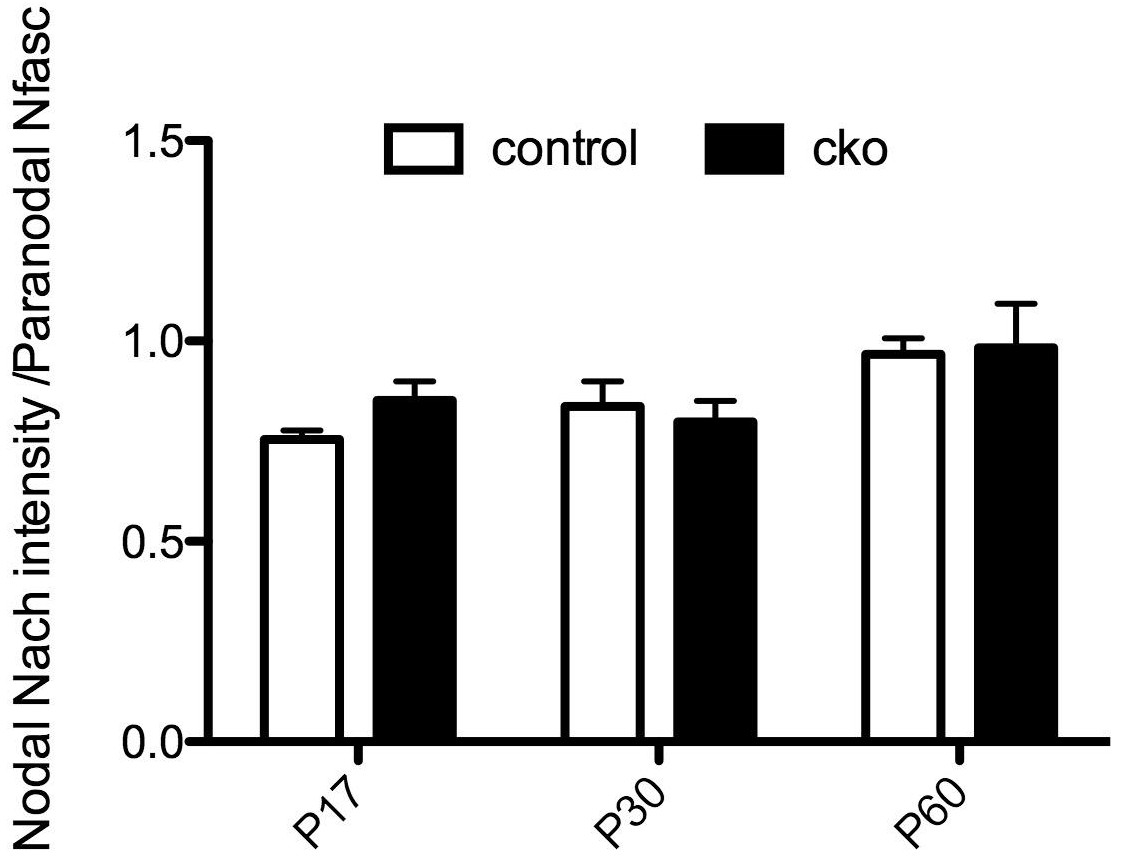
Nodal NaCh intensity in the Six3Cre;Nfascfl/fl CNS optic nerve.
https://doi.org/10.7554/eLife.21392.011Videos
Video 1
Movie of P17 Nfascfl/fl;Sptbn1fl/fl and P17 Avil-Cre;Nfascfl/fl;Sptbn1fl/fl mice.
This video relates to Figure 4.
Download links
A two-part list of links to download the article, or parts of the article, in various formats.
Downloads (link to download the article as PDF)
Open citations (links to open the citations from this article in various online reference manager services)
Cite this article (links to download the citations from this article in formats compatible with various reference manager tools)
The paranodal cytoskeleton clusters Na+ channels at nodes of Ranvier
eLife 6:e21392.
https://doi.org/10.7554/eLife.21392


