Fast-spiking GABA circuit dynamics in the auditory cortex predict recovery of sensory processing following peripheral nerve damage
- Massachusetts Eye and Ear Infirmary, United States
- Harvard Medical School, United States
Figures
Figure 1 with 1 supplement
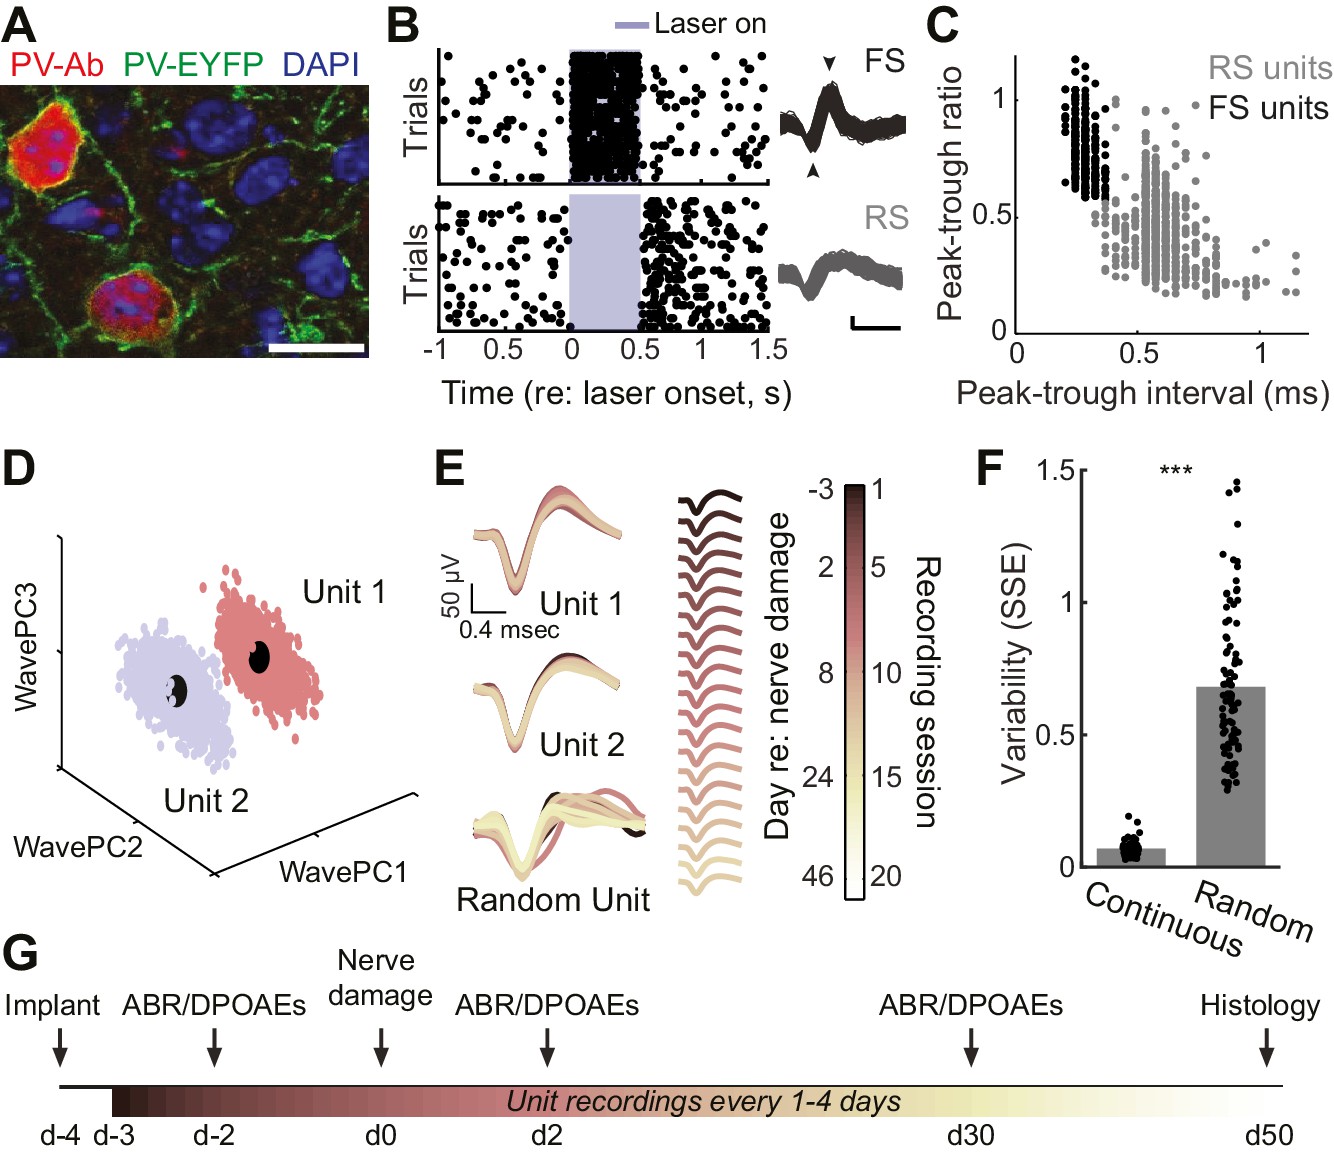
Approach for chronic single unit recordings and optogenetic activation in mouse A1.
(A) Immunolabeling of PV neurons in A1 with co-localization of EYFP reporter in Pv-Cre:Ai32 transgenic mice. DAPI labels cell nuclei. Scale bar = 15 µm. (B) Spike raster plots illustrating that optogenetic activation of fast spiking (FS) PV+ units (black, top) inhibits regular spiking (RS) units (gray, bottom). Right, spike waveforms for the RS and FS units. Arrowheads denote spike peak and trough. Scale bars, 0.5 ms and 50 µV. (C) Scatter plot showing the bimodal distribution of peak-tough amplitude and timing differences across all RS (gray) and FS (black) units. (D) A random sub-sampling of spike waveforms recorded over 53 days from a single wire of a tetrode projected down into the first three principal components (PC). (E) Spike waveforms from the two units identified in (D) across all recording sessions, color-coded and superimposed chronologically. Waveforms for random units were selected at random from all simultaneously recorded units. (F) The variability in the actual unit waveforms, estimated as the sum of squared errors (SSE), is significantly less than randomly shuffled units (p<0.001, f(1)=814.73, mean ± SEM). (G) Experimental design.
Figure 1—figure supplement 1
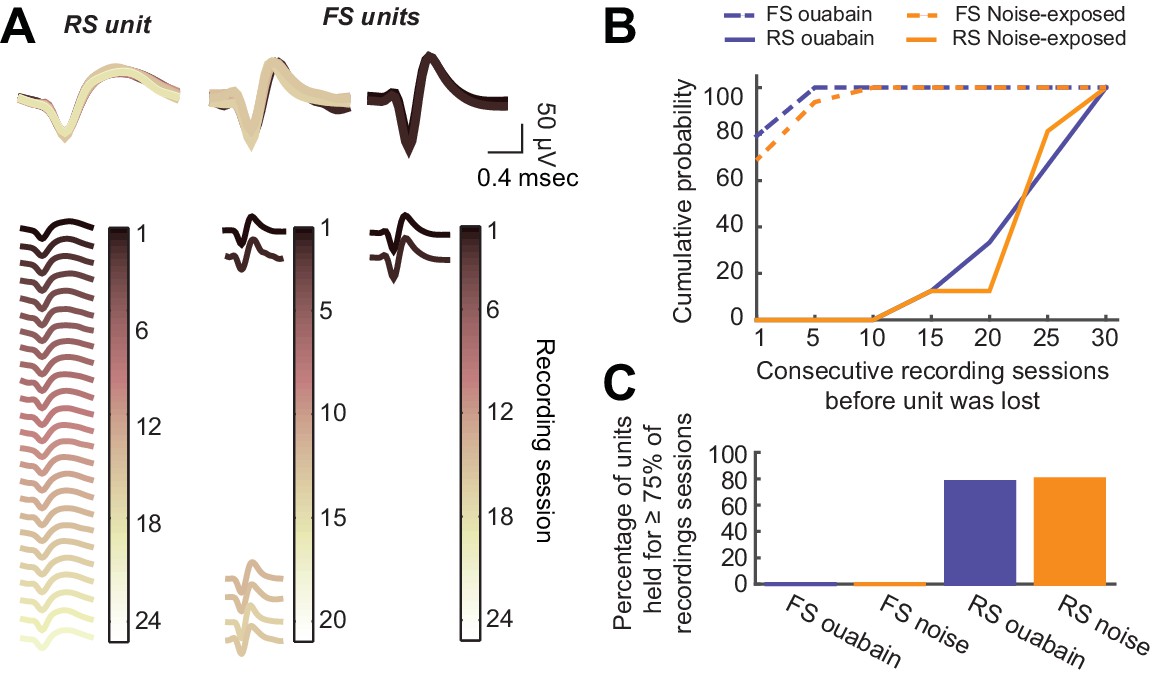
Long-term tetrode recordings from isolated single units is feasible with RS neurons, but not FS neurons.
(A) As per Figure 1E, single unit spike waveforms across all recording sessions, are shown for a representative RS unit as well as two representative FS units. The RS unit waveform is consistent across the 7–8-week recording period, while the FS unit waveforms are lost after a few recording sessions. (B) Cumulative probability functions depict the number of consecutive recording sessions before each RS and FS unit was lost in noise-exposed and ouabain-treated mice. (C) For the analysis provided in the main text, we only analyzed units that were present in at least 75% of all recording sessions for a given mouse. None of the FS units we recorded met this criterion. Thus, we were unable to contrast changes in the FS neurons themselves with changes reported in the main text for RS neurons or PV-mediated inhibition.
Figure 2
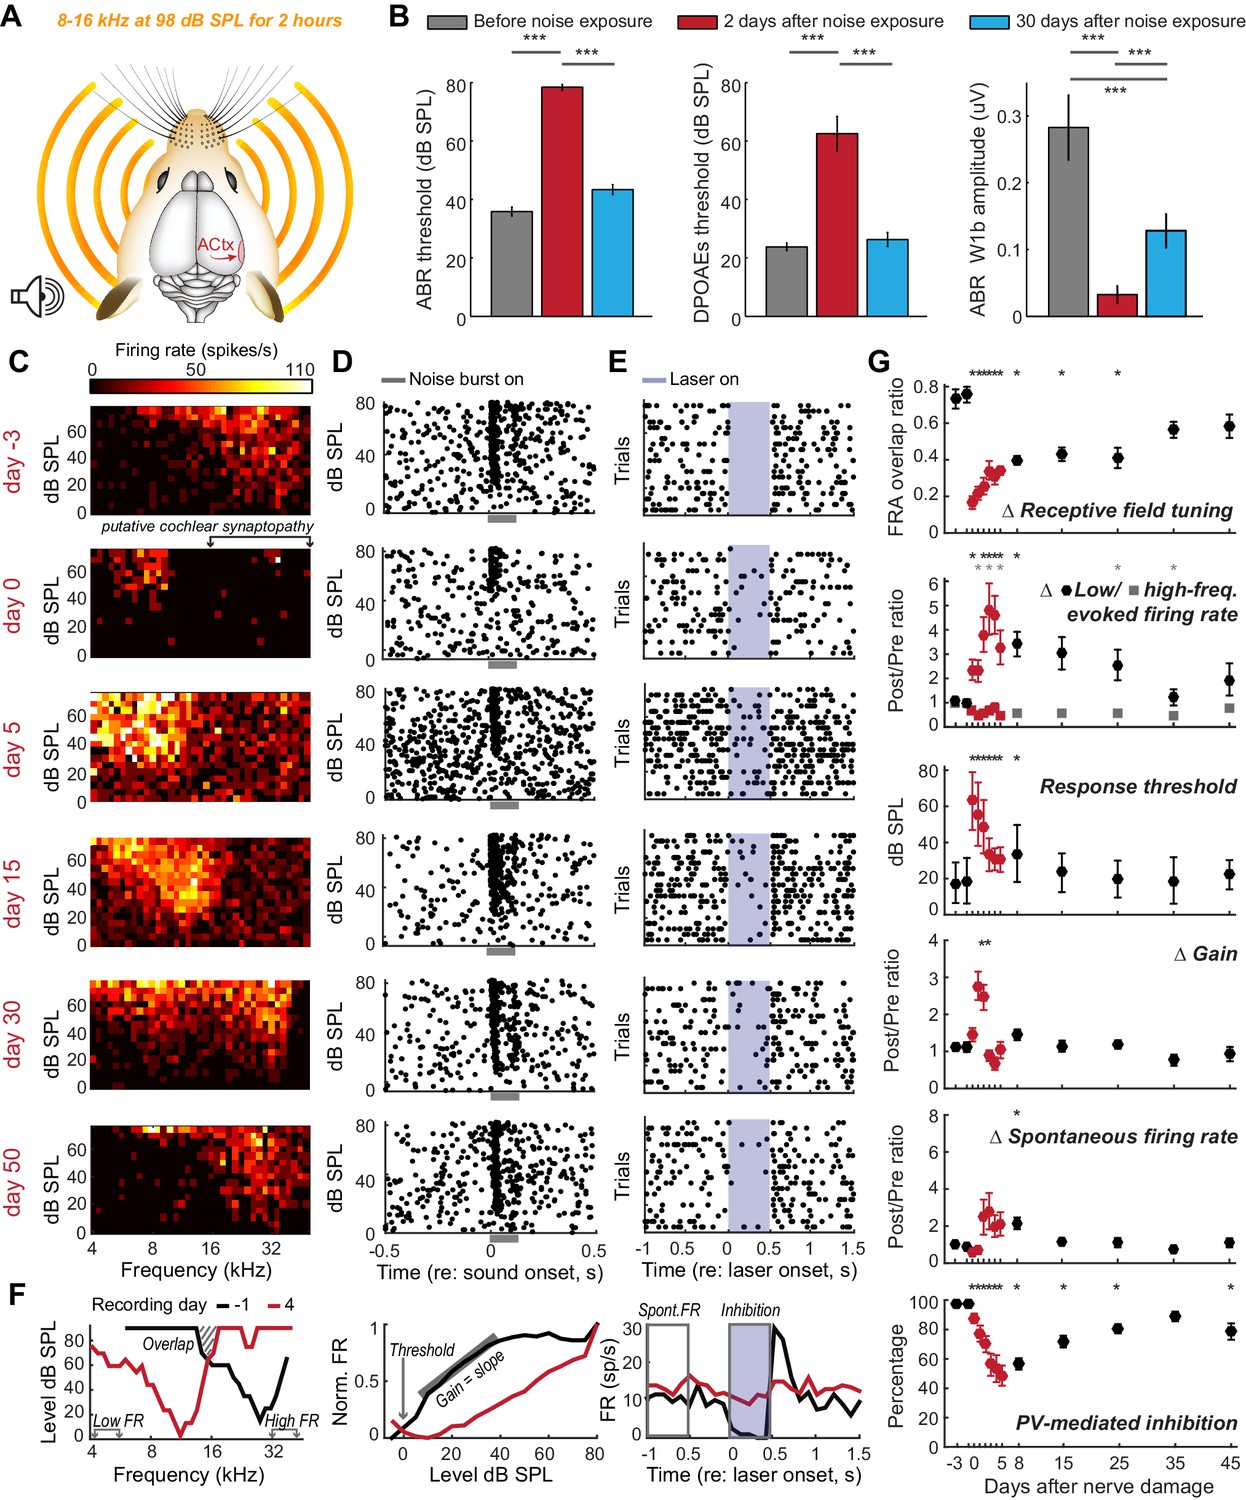
Moderate loss of high-frequency auditory nerve fibers induces striking – but partially reversible - receptive field reorganization and inhibition.
(A) Adult mice (16 weeks) were exposed to octave-wide noise at 98 dB SPL for 2 hr, which has been shown to eliminate approximately 50% of auditory nerve synapses onto inner hair cells in the 16–45 kHz region of the cochlea (Wan et al., 2014; Kujawa and Liberman, 2009). (B) Mean ± SEM ABR (left) and DPOAE thresholds (middle) were temporarily elevated 2 days after noise exposure but recover fully by 30 days. ABR wave 1b amplitude reflects the permanent loss of Type-I spiral ganglion nerve fibers (right). (C) A frequency response area (FRA) from a single unit recorded in the high-frequency zone of the A1 tonotopic map rapidly assumed a low-frequency FRA hours after noise exposure but shifted back towards baseline tuning over the ensuing month. (D–E) Rasters depict spiking from the same RS unit evoked by broadband noise at varying sound levels (D) or inhibited by optogenetic activation of neighboring PV+ neurons (E). Note temporary threshold shift and change in inhibition strength. (F) Quantification approach illustrated from a different single unit recorded before (black) and after (red) noise exposure. (G) Mean ± SEM (n = 208 units) values for each response property illustrated in (F). Data for each unit are normalized to the mean value measured during the 3-day period prior to noise exposure. Red symbols are used to visually highlight the rapid plasticity occurring during the first 5 days following nerve damage. Asterisks = post-hoc pairwise comparison between identified groups (B) or to baseline value (G) p<0.05 after correcting for multiple comparisons.
Figure 3 with 1 supplement
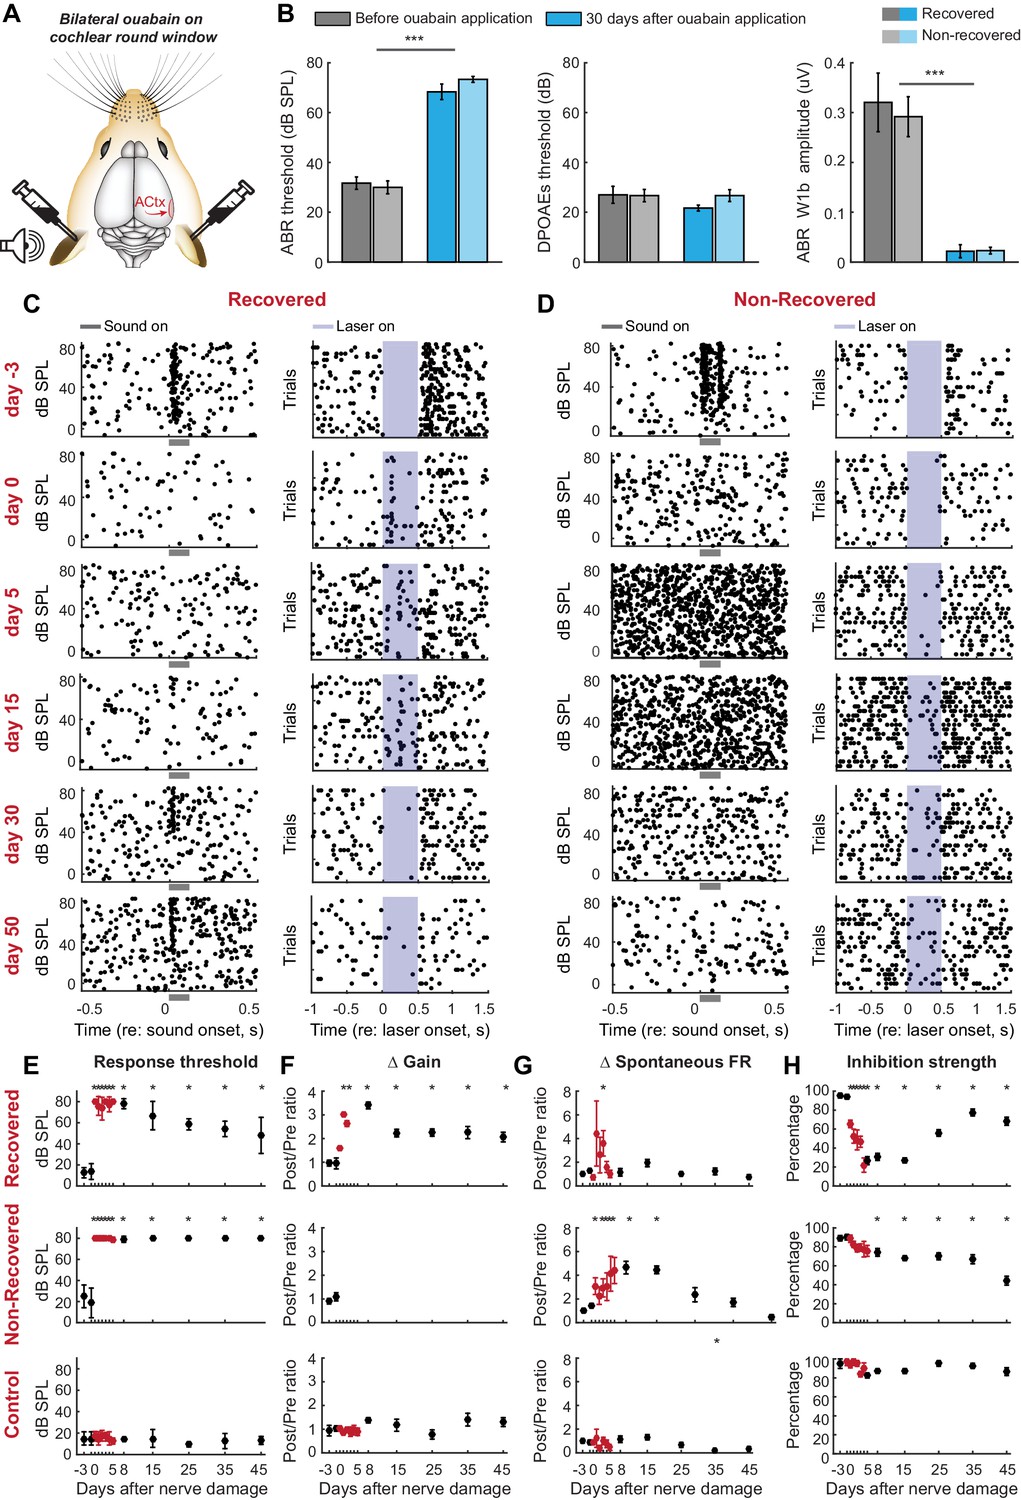
Gradual and variable recovery of auditory processing following a massive, bilateral loss of cochlear afferent nerve fibers can be predicted from early changes in inhibitory strength.
Plotting conventions follow Figure 2. (A) Ouabain was applied bilaterally to the round window membrane. (B) Mean ± SEM ABR thresholds were substantially elevated 30 days after ouabain application (left) but DPOAE thresholds were unaffected, indicating normal outer hair cell function (middle). ABR wave1b was virtually eliminated after ouabain (right). Darker and lighter shading represent measurements from mice that recovered cortical sound thresholds versus mice that did not, respectively. (C–D) Rasters document changes in noise-evoked spiking and laser-induced inhibition, respectively, from single A1 RS units recorded over a 53-day period from a mouse that eventually recovered function (C) and a mouse that did not recover function (D). (E–H) Mean ± SEM noise-evoked thresholds (E), rate-level function gain (F), spontaneous firing rate (G) and inhibition strength (H) for all units recorded from three mice that recovered (top row, n = 156), three mice that did not recover (middle row, n = 169) or three mice that underwent a sham surgery (bottom row, n = 156). Asterisks = post-hoc pairwise comparison between identified groups (B) or to baseline value (E–H) p<0.05 after correcting for multiple comparisons.
Figure 3—figure supplement 1
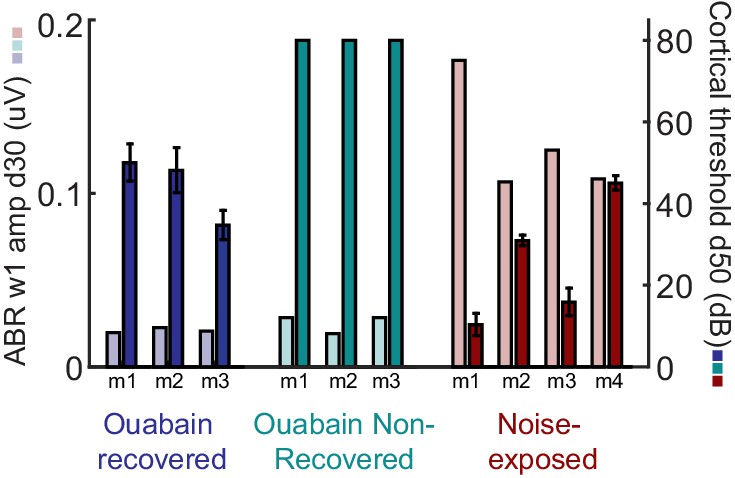
ABR wave 1 amplitude scales with the degree of auditory nerve damage, but does not vary systematically between mice that recover cortical sound thresholds versus those that do not.
The amplitude of ABR wave 1b arises directly from the auditory nerve compound action potential and, provided DPOAE thresholds are normal (as is the case here), serves as a useful proxy for the surviving number of afferent nerve fibers onto inner hair cells. The ABR wave 1 amplitude is presented alongside the mean auditory response threshold measured in A1 single units for each mouse subjected to auditory nerve damage. ABR wave 1 amplitude does not predict the eventual recovery of sound processing in mice subjected to massive auditory nerve damage with ouabain.
Figure 4 with 1 supplement
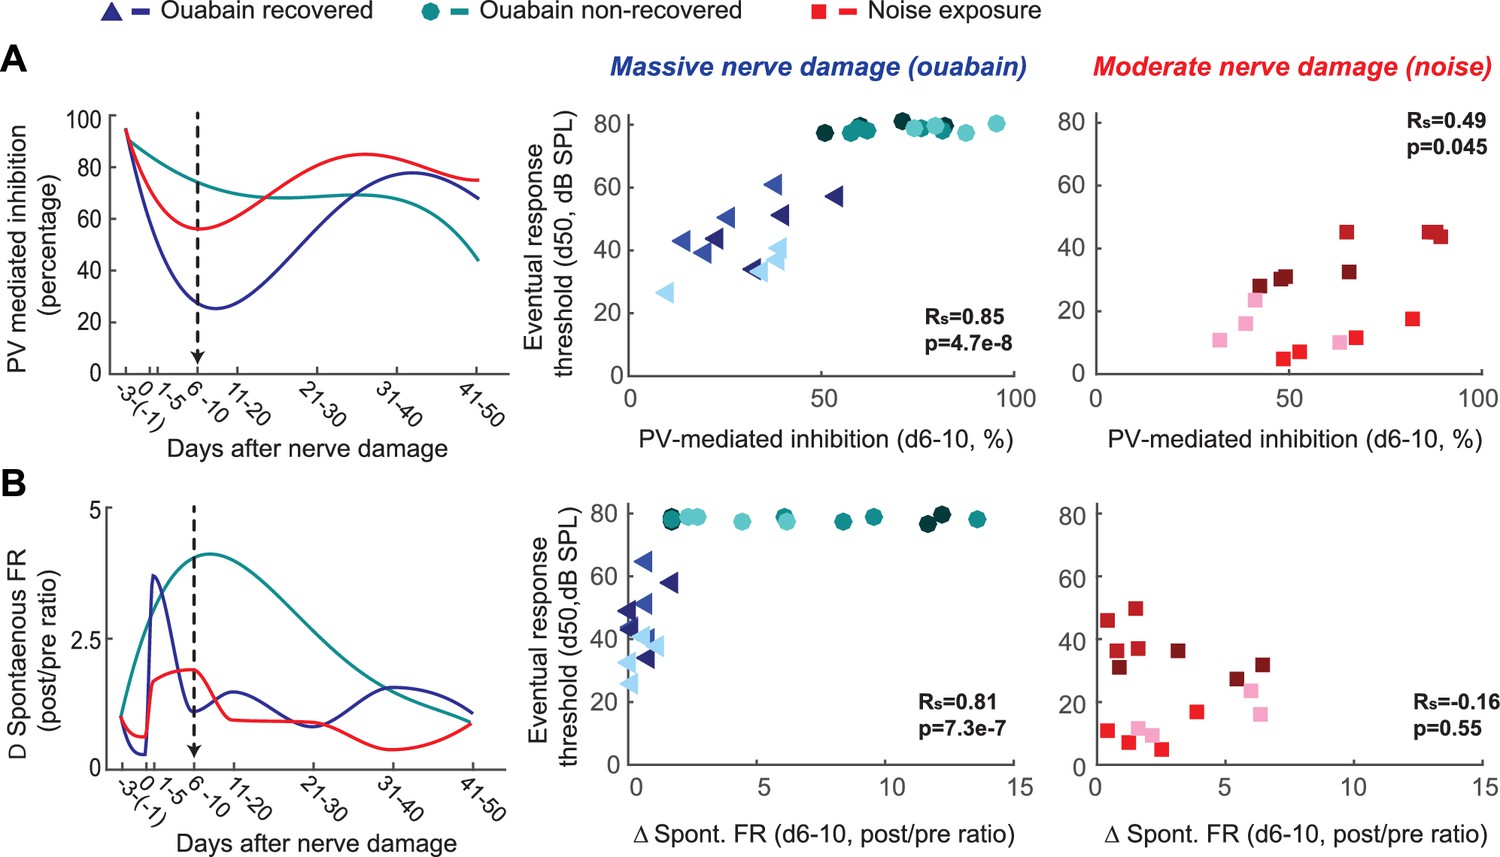
Early changes in PV-mediated inhibitory strength predict eventual recovery of cortical sound processing after nerve damage.
(A–B) PV-mediated inhibition strength (A) and change in spontaneous firing rate (B) timelines for sound exposed, ouabain recovered and ouabain non-recovered mice (red, blue and teal accordingly, plotted for visualization purposes as a fourth order polynomial fit to the data presented Figures 2 and 3). (Middle and Right) Correlation between broadband noise threshold at day 50 and PV-mediated inhibition (A) or spontaneous firing rate change (B) at days 6–10 for ouabain-treated (middle) and sound-exposed mice (right, Spearman’s correlation coefficient, Rs). Each symbol represents a single RS unit. The shape and color correspond to a particular group, as described above. The shading corresponds to a particular mouse within that group.
Figure 4—figure supplement 1
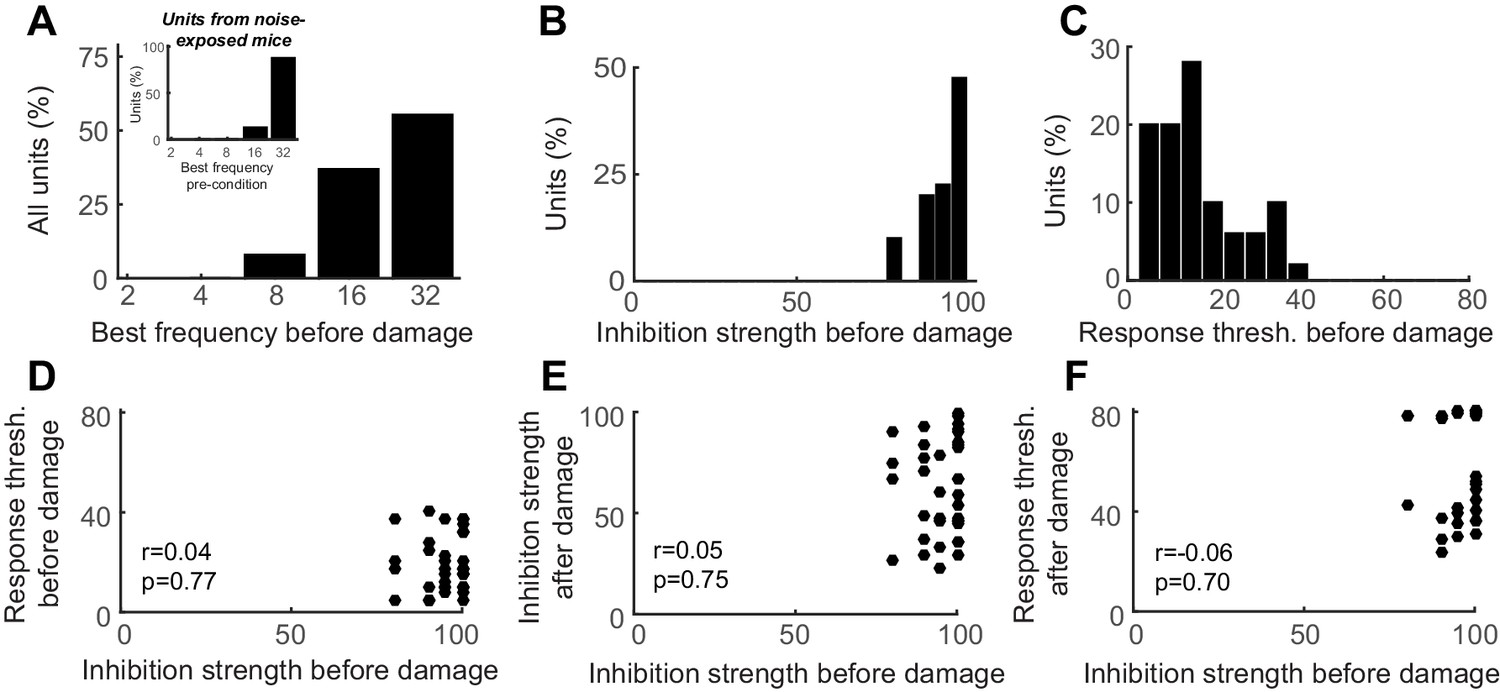
Auditory cortex units show robust PV-mediated inhibition and low-threshold sensory responses prior to nerve damage, both of which are unrelated to the eventual response thresholds after nerve damage.
(A) Distribution of best frequency values for primary auditory cortex units recorded before nerve damage. RS units recorded in noise-exposed mice were targeted to a high-frequency region of the tonotopic map, in the zone of putative cochlear denervation. (B–C) Histogram of PV-mediated inhibition strength (B) and response threshold (C) distributions prior to auditory nerve damage. (D) The strength of PV-mediated inhibition and auditory response thresholds are not correlated with each other before nerve damage (Pearson’s correlation coefficient). (E–F) PV-mediated inhibition strength and auditory response thresholds after nerve damage cannot be predicted from the strength of PV-mediated inhibition before nerve damage (Pearson’s correlation coefficient).
Author response image 1

Additional published data demonstrating the link between temporary ABR threshold shift, permanent wave 1 ABR amplitude loss and permanent loss of cochlear afferent synapses in a C57BL6 hybrid mouse strain.
Cochlear afferent synapses are quantified by measuring GluR2+ puncta on peripheral auditory nerve processes that oppose synaptic ribbons, a presynaptic release protein complex at the base of the inner hair cell.
Author response image 2
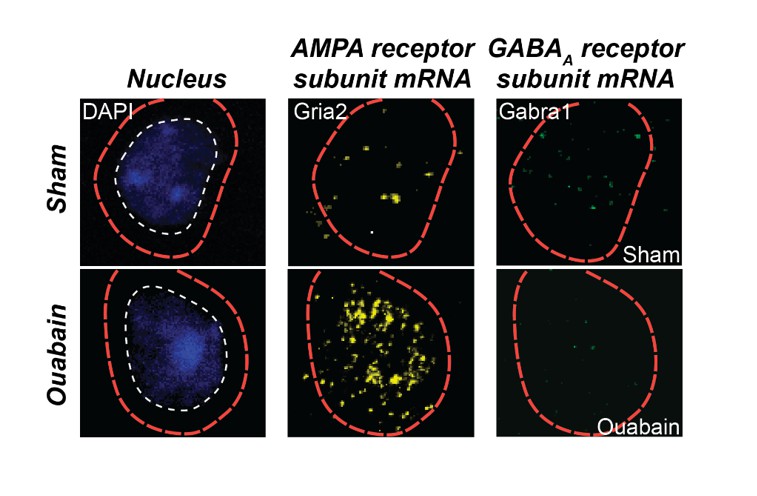
Triple fluorescence in situ hybridization of an example neuron from the auditory cortex of a ouabain-treated adult mouse or an age-matched sham-treated control.
Transcripts for Gria2, which encodes an AMPA receptor subunit, and GABRA1, which encodes a GABAA receptor subunit, are visualized in the peri-nuclear compartment. Compared to the sham control, glutamate receptor transcripts are increased and GABAA receptor transcripts are decreased. These data are part of a separate study that examines the interplay between glutamate sensitization and GABA disinhibition after auditory nerve damage.
Additional files
-
Supplementary file 1
Statistical reporting.
Detailed description of statistical analysis for all figures and figure supplements.
- https://doi.org/10.7554/eLife.21452.009
Download links
A two-part list of links to download the article, or parts of the article, in various formats.
Downloads (link to download the article as PDF)
Open citations (links to open the citations from this article in various online reference manager services)
Cite this article (links to download the citations from this article in formats compatible with various reference manager tools)
Fast-spiking GABA circuit dynamics in the auditory cortex predict recovery of sensory processing following peripheral nerve damage
eLife 6:e21452.
https://doi.org/10.7554/eLife.21452


