Reward-based training of recurrent neural networks for cognitive and value-based tasks
- New York University, United States
- NYU Shanghai, China
Figures
Figure 1 with 4 supplements

Recurrent neural networks for reinforcement learning.
(A) Task structure for a simple perceptual decision-making task with variable stimulus duration. The agent must maintain fixation () until the go cue, which indicates the start of a decision period during which choosing the correct response ( or ) results in a positive reward. The agent receives zero reward for responding incorrectly, while breaking fixation early results in an aborted trial and negative reward. (B) At each time the agent selects action according to the output of the decision network , which implements a policy that can depend on all past and current inputs provided by the environment. In response, the environment transitions to a new state and provides reward to the agent. The value network uses the selected action and the activity of the decision network to predict future rewards. All the weights shown are plastic, i.e., trained by gradient descent. (C) Performance of the network trained for the task in (A), showing the percent correct by stimulus duration, for different coherences (the difference in strength of evidence for L and R). (D) Neural activity of an example decision network unit, sorted by coherence and aligned to the time of stimulus onset. Solid lines are for positive coherence, dashed for negative coherence. (E) Output of the value network (expected return) aligned to stimulus onset. Expected return is computed by performing an 'absolute value'-like operation on the accumulated evidence.
Figure 1—figure supplement 1
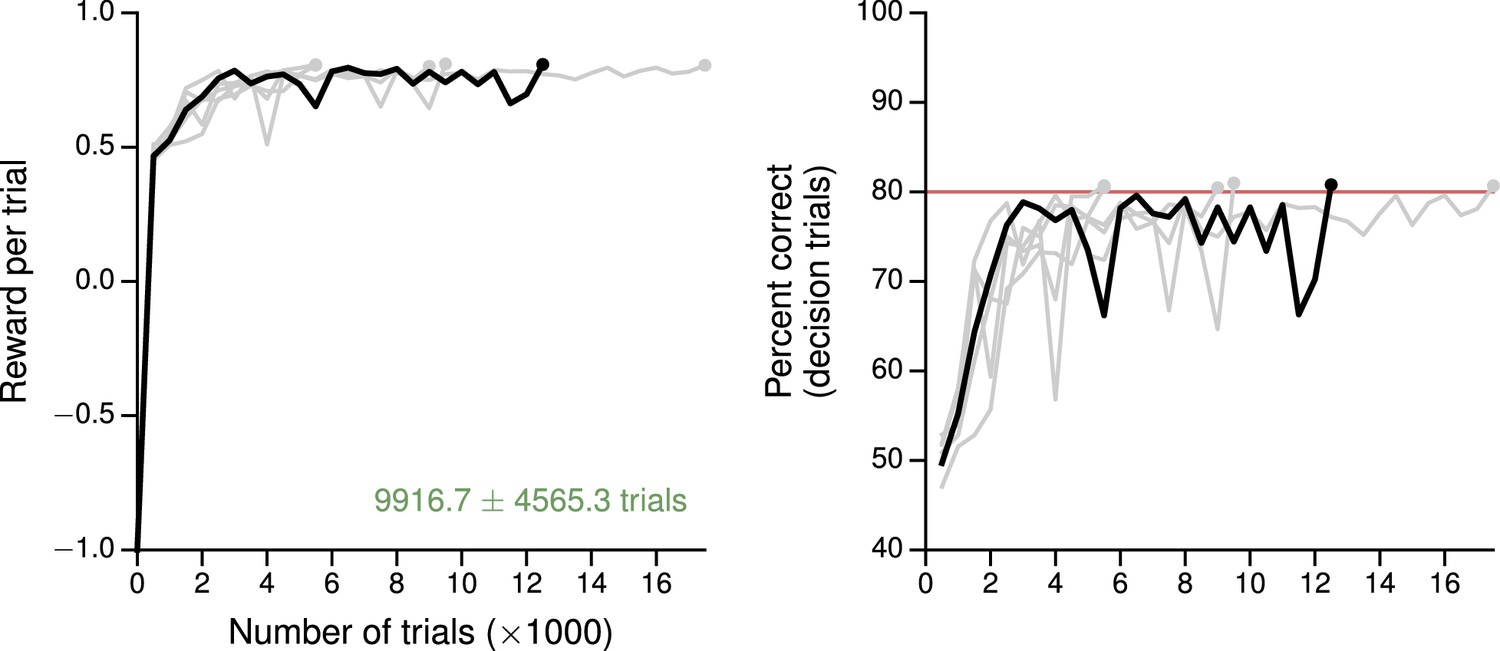
Learning curves for the simple perceptual decision-making task.
(A) Average reward per trial. Black indicates the network realization shown in the main text, gray additional realizations, i.e., trained with different random number generator seeds. (B) Percent correct, for trials on which the network made a decision (99% required for termination). Red: target performance (when training was terminated).
Figure 1—figure supplement 2
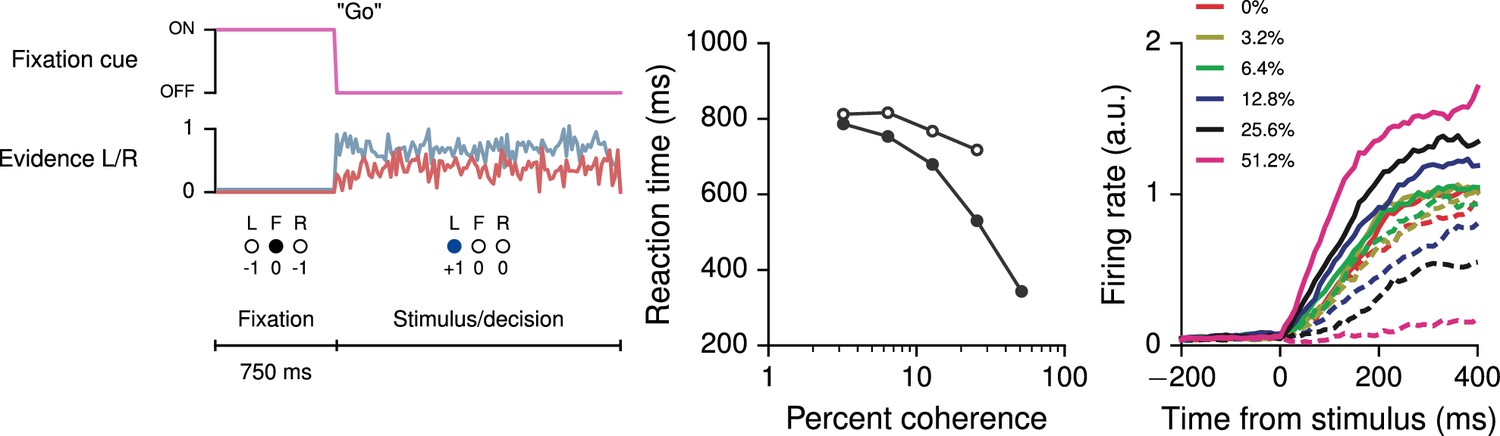
Reaction-time version of the perceptual decision-making task, in which the go cue coincides with the onset of stimulus, allowing the agent to choose when to respond.
(A) Task structure for the reaction-time version of the simple perceptual decision-making task, in which the agent can choose to respond any time after the onset of stimulus. (B) Reaction time as a function of coherence for correct (solid circles) and error (open circles) trials. (C) Neural activity of an example decision network unit, sorted by the coherence (the difference in strength of evidence for L and R) and aligned to the time of stimulus onset. Each trial ends when the network breaks fixation.
Figure 1—figure supplement 3
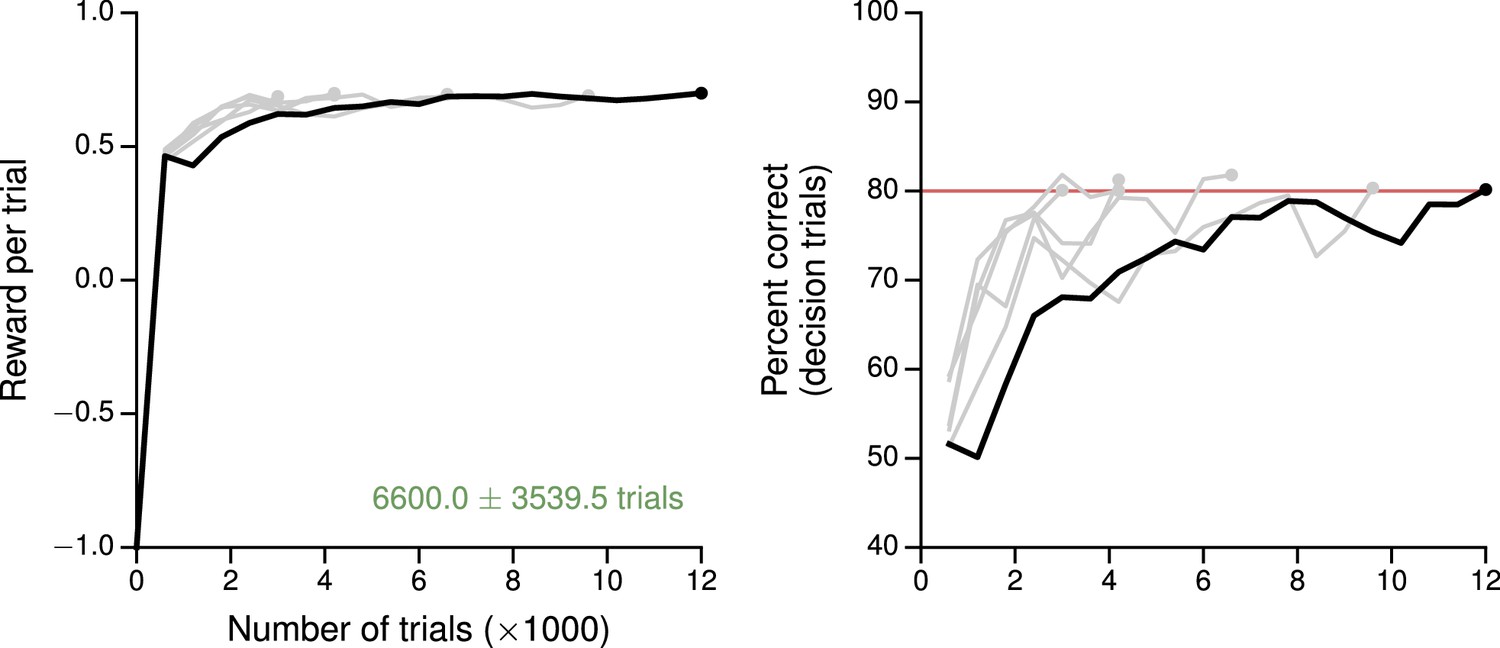
Learning curves for the reaction-time version of the simple perceptual decision-making task.
(A) Average reward per trial. Black indicates the network realization shown in the main text, gray additional realizations, i.e., trained with different random number generator seeds. (B) Percent correct, for trials on which the network made a decision (99% required for termination). Red: target performance (when training was terminated).
Figure 1—figure supplement 4
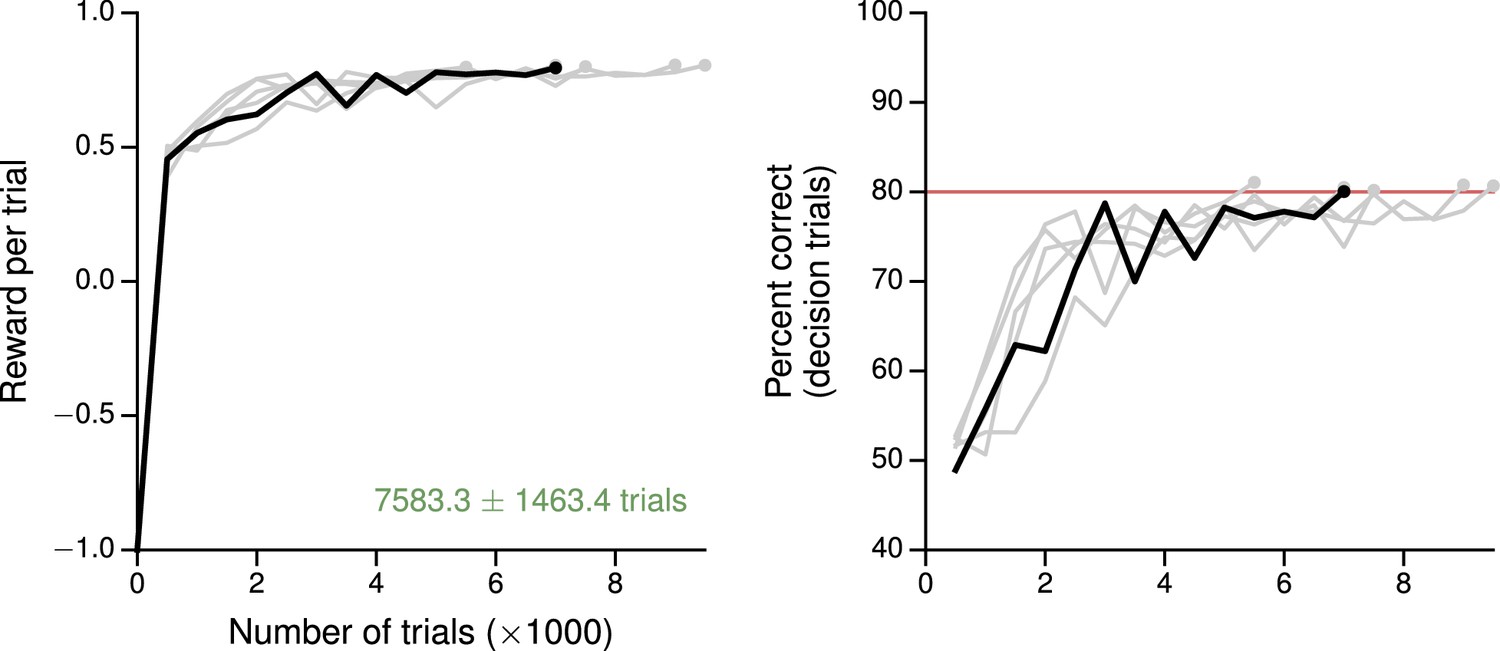
Learning curves for the simple perceptual decision-making task with a linear readout of the decision network as the baseline.
(A) Average reward per trial. Black indicates the network realization shown in the main text, gray additional realizations, i.e., trained with different random number generator seeds. (B) Percent correct, for trials on which the network made a decision (99% required for termination). Red: target performance (when training was terminated).
Figure 2 with 3 supplements
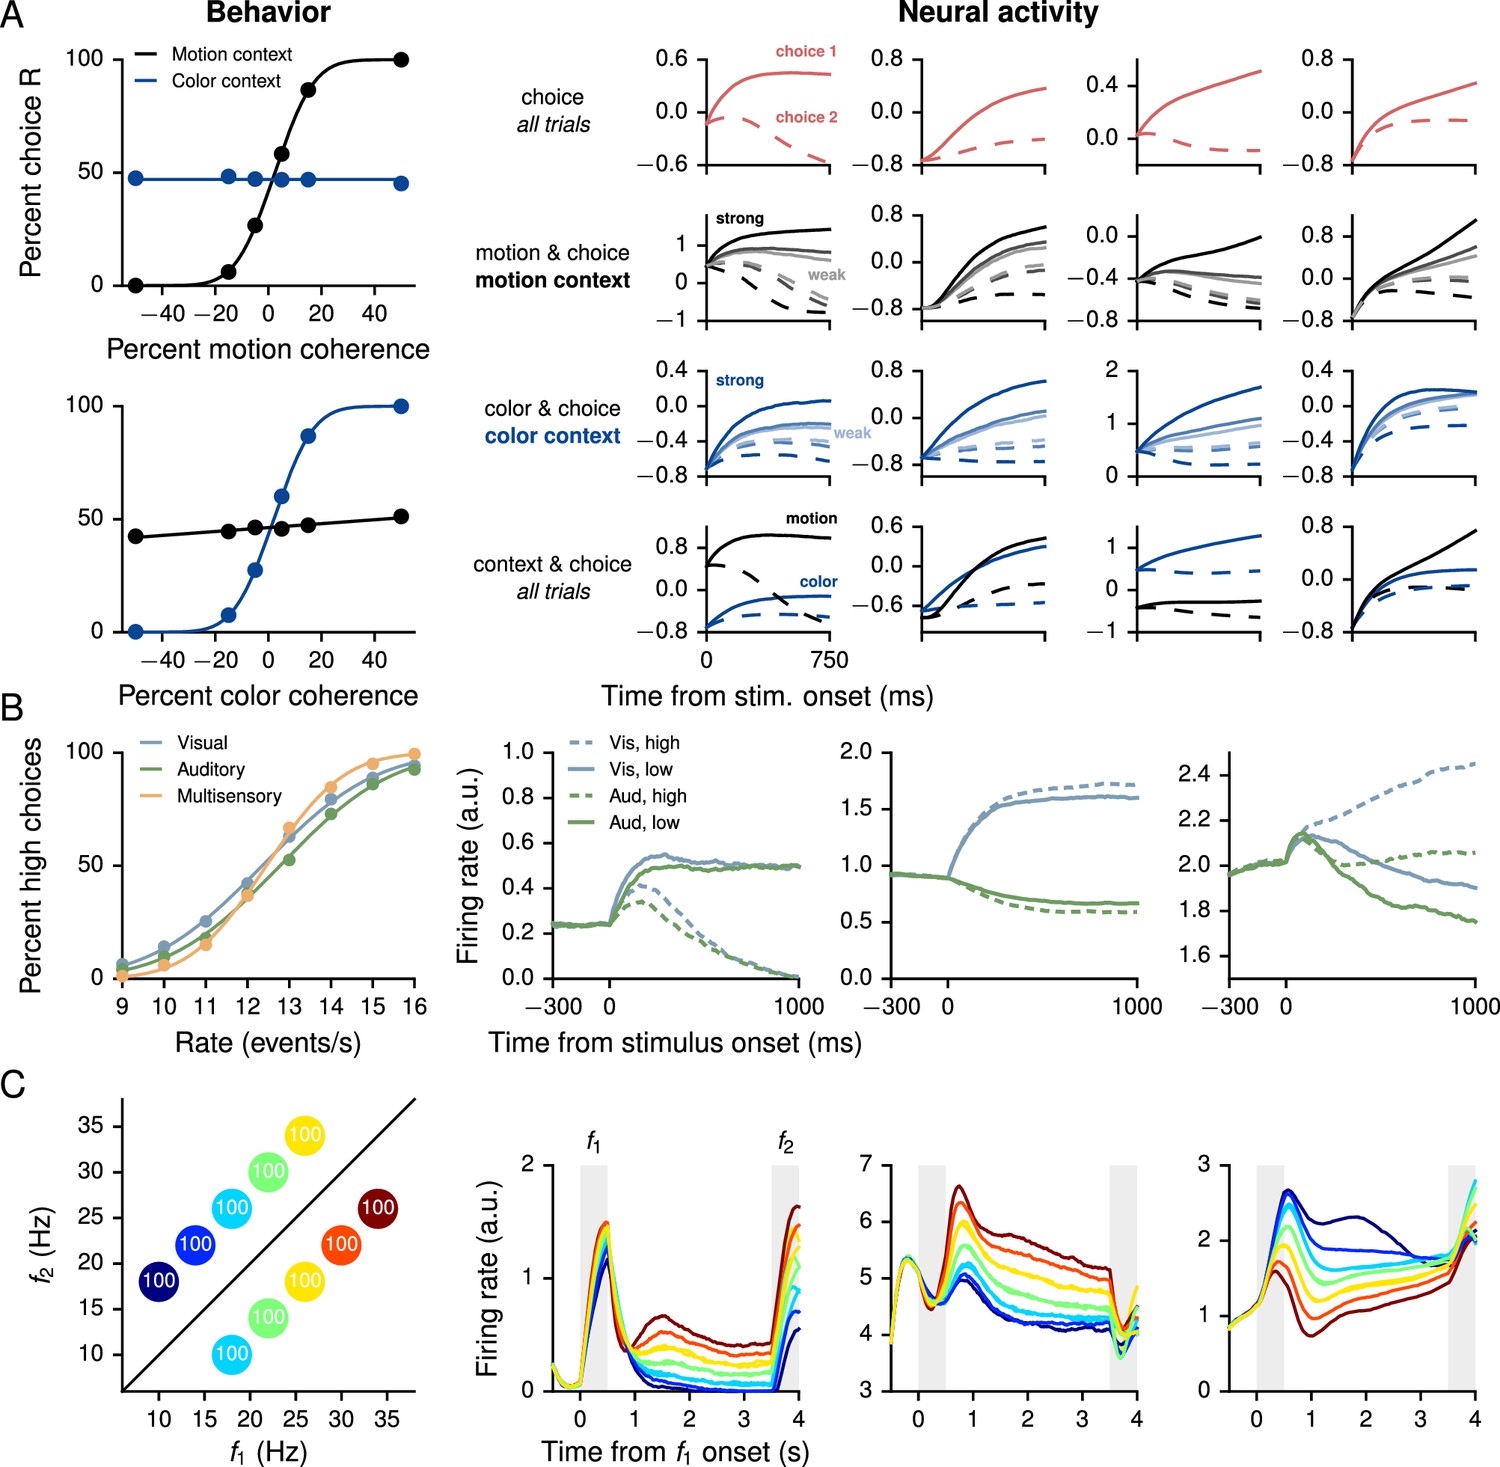
Performance and neural activity of RNNs trained for 'simple' cognitive tasks in which the correct response depends only on the task condition.
Left column shows behavioral performance, right column shows mixed selectivity for task parameters of example units in the decision network. (A) Context-dependent integration task (Mante et al., 2013). Left: Psychometric curves show the percentage of R choices as a function of the signed 'motion' and 'color' coherences in the motion (black) and color (blue) contexts. Right: Normalized firing rates of examples units sorted by different combinations of task parameters exhibit mixed selectivity. Firing rates were normalized by mean and standard deviation computed over the responses of all units, times, and trials. Solid and dashed lines indicate choice 1 (same as preferred direction of unit) and choice 2 (non-preferred), respectively. For motion and choice and color and choice, dark to light corresponds to high to low motion and color coherence, respectively. (B) Multisensory integration task (Raposo et al., 2012, 2014). Left: Psychometric curves show the percentage of high choices as a function of the event rate, for visual only (blue), auditory only (green), and multisensory (orange) trials. Improved performance on multisensory trials shows that the network learns to combine the two sources of information in accordance with Equation 13. Right: Sorted activity on visual only and auditory only trials for units selective for choice (high vs. low, left), modality [visual (vis) vs. auditory (aud), middle], and both (right). Error trials were excluded. (C) Parametric working memory task (Romo et al., 1999). Left: Percentage of correct responses for different combinations of and . The conditions are colored here and in the right panels according to the first stimulus (base frequency) ; due to the overlap in the values of , the 10 task conditions are represented by seven distinct colors. Right: Activity of example decision network units sorted by . The first two units are positively tuned to during the delay period, while the third unit is negatively tuned.
Figure 2—figure supplement 1
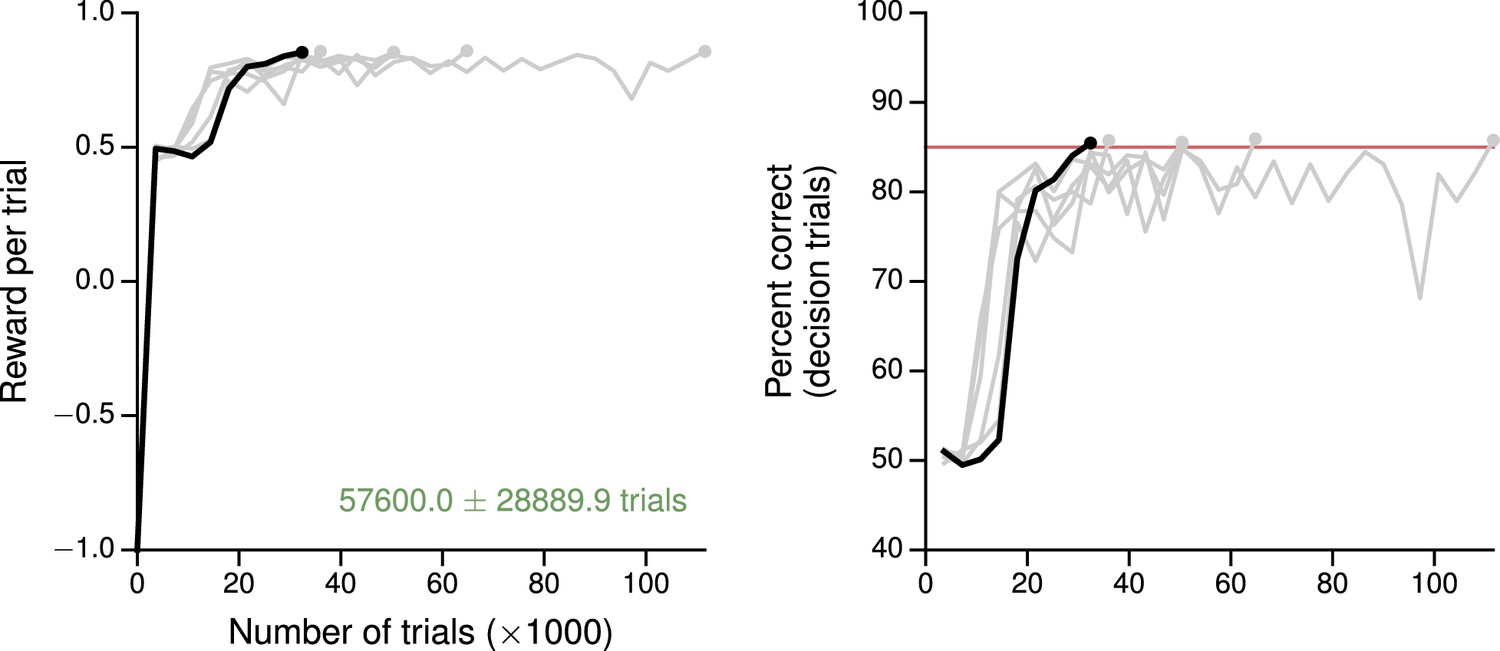
Learning curves for the context-dependent integration task.
(A) Average reward per trial. Black is for the network realization in the main text, gray for additional realizations, i.e., trained with different random number generator seeds. (B) Percent correct, for trials on which the network made a decision (99% required for termination). Red: target performance (when training was terminated).
Figure 2—figure supplement 2
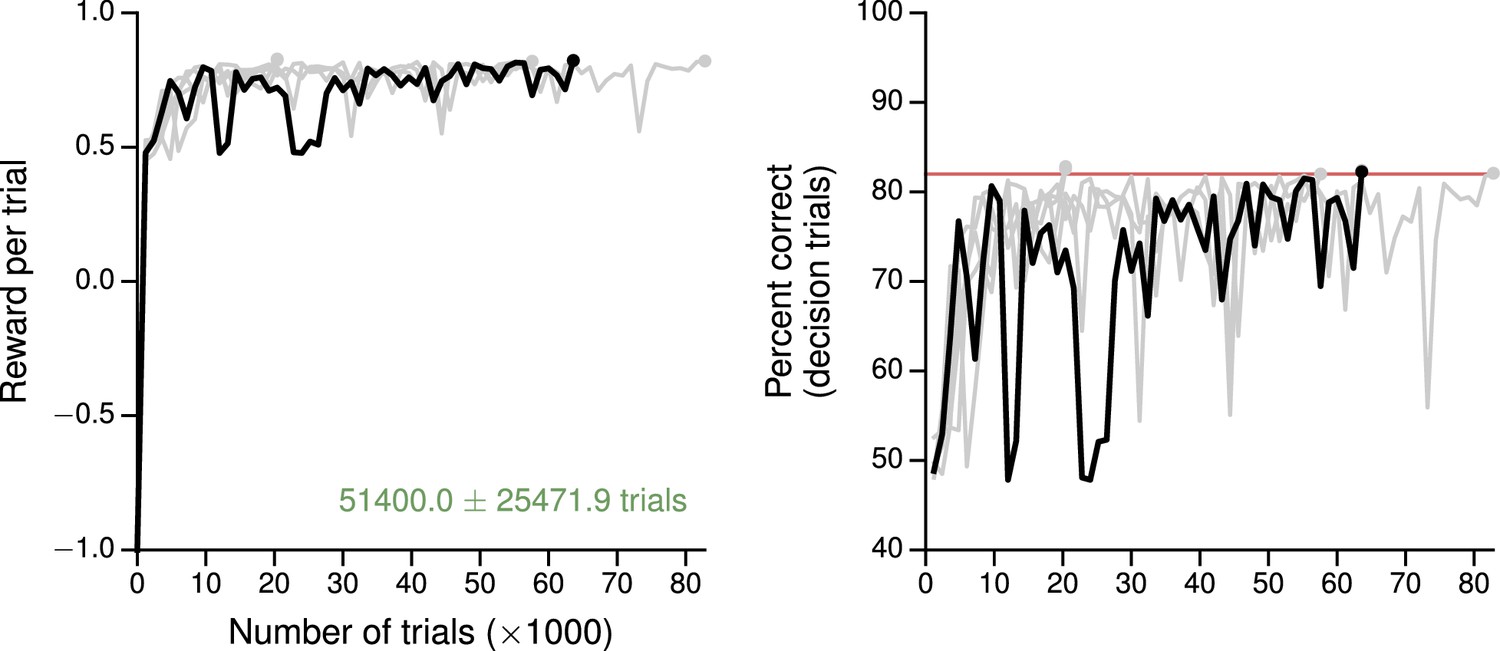
Learning curves for the multisensory integration task.
(A) Average reward per trial. Black indicates the network realization shown in the main text, gray additional realizations, i.e., trained with different random number generator seeds. (B) Percent correct, for trials on which the network made a decision (99% required for termination). Red: target performance (when training was terminated).
Figure 2—figure supplement 3
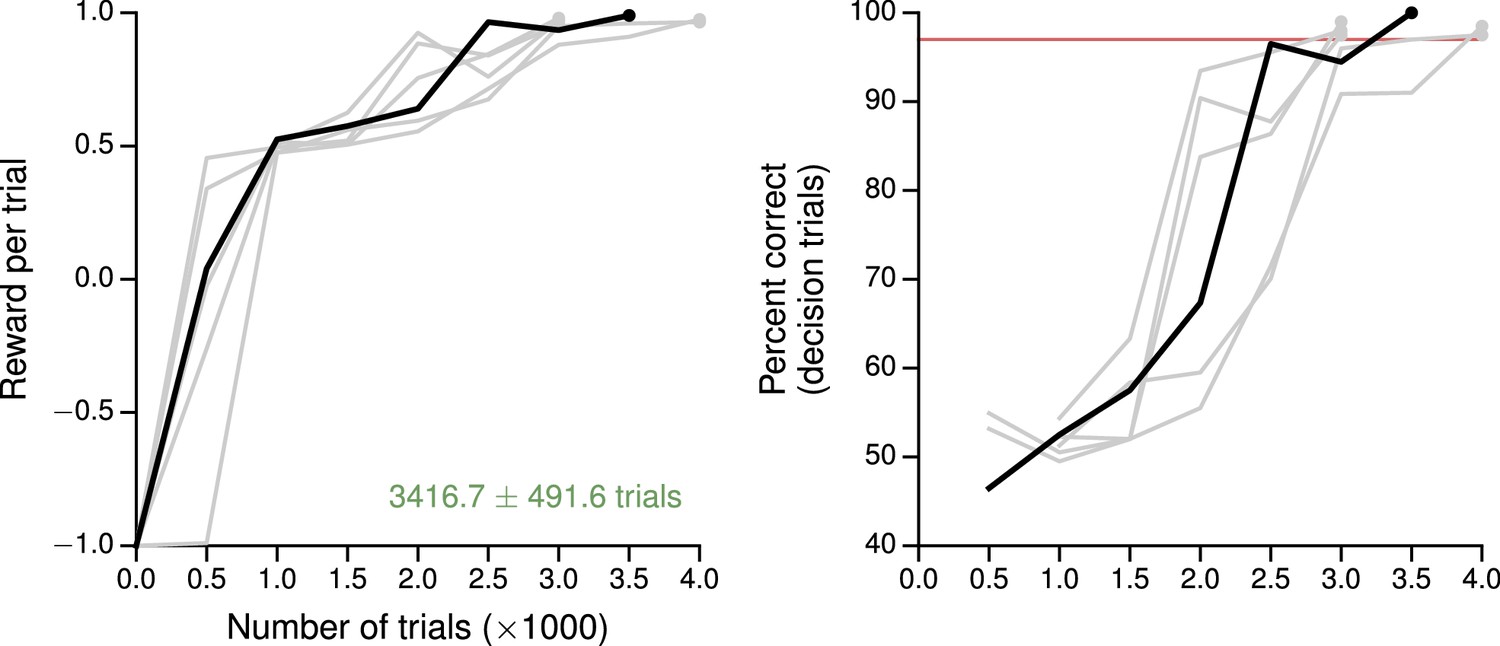
Learning curves for the parametric working memory task.
(A) Average reward per trial. Black indicates the network realization shown in the main text, gray additional realizations, i.e., trained with different random number generator seeds. (B) Percent correct, for trials on which the network made a decision (99% required for termination). Red: target performance (when training was terminated).
Figure 3 with 1 supplement
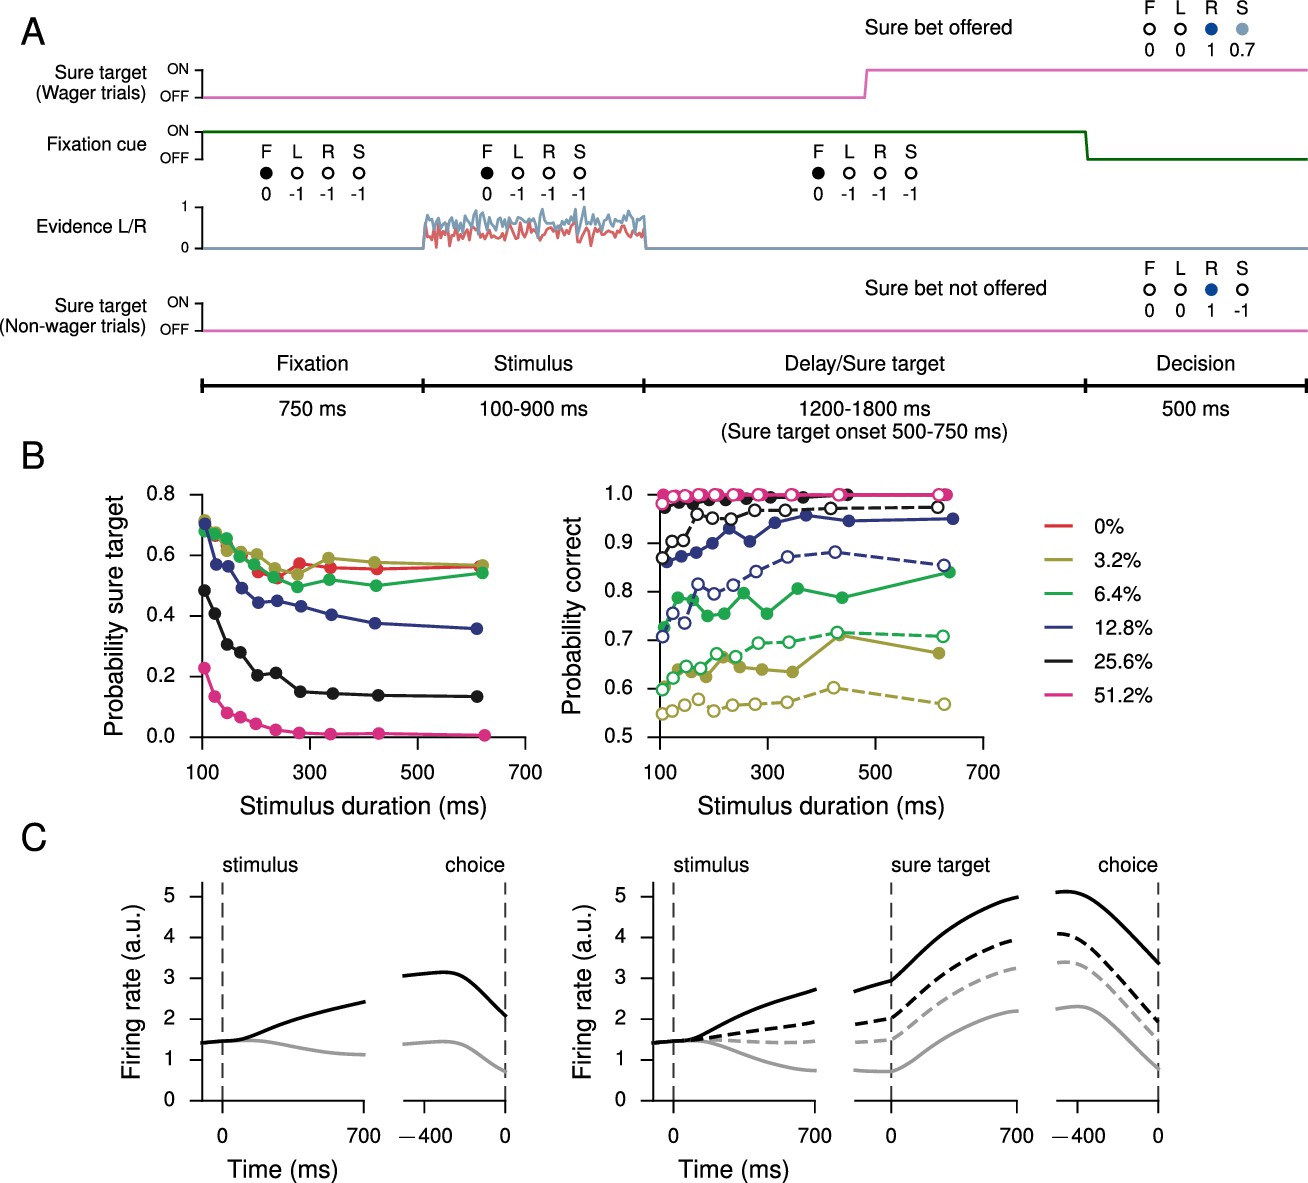
Perceptual decision-making task with postdecision wagering, based on Kiani and Shadlen (2009).
(A) Task structure. On a random half of the trials, a sure option is presented during the delay period, and on these trials the network has the option of receiving a smaller (compared to correctly choosing L or R) but certain reward by choosing the sure option (S). The stimulus duration, delay, and sure target onset time are the same as in Kiani and Shadlen 2009). (B) Probability of choosing the sure option (left) and probability correct (right) as a function of stimulus duration, for different coherences. Performance is higher for trials on which the sure option was offered but waived in favor of L or R (filled circles, solid), compared to trials on which the sure option was not offered (open circles, dashed). (C) Activity of an example decision network unit for non-wager (left) and wager (right) trials, sorted by whether the presented evidence was toward the unit’s preferred (black) or nonpreferred (gray) target as determined by activity during the stimulus period on all trials. Dashed lines show activity for trials in which the sure option was chosen.
Figure 3—figure supplement 1
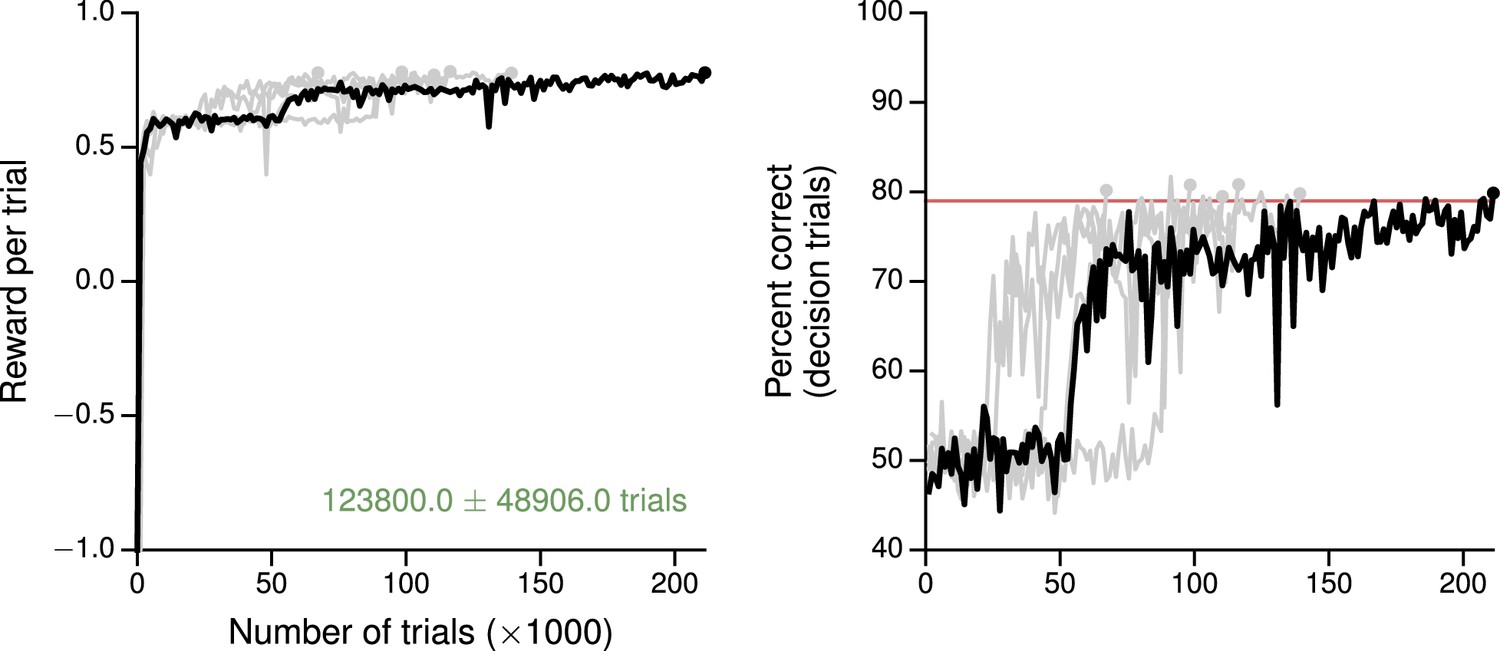
Learning curves for the postdecision wager task.
(A) Average reward per trial. Black indicates the network realization shown in the main text, gray additional realizations, i.e., trained with different random number generator seeds. (B) Percent correct, for trials on which the network made a decision (99% required for termination). Red: target performance when the sure bet was accepted between 40–50% of the time.
Figure 4 with 3 supplements
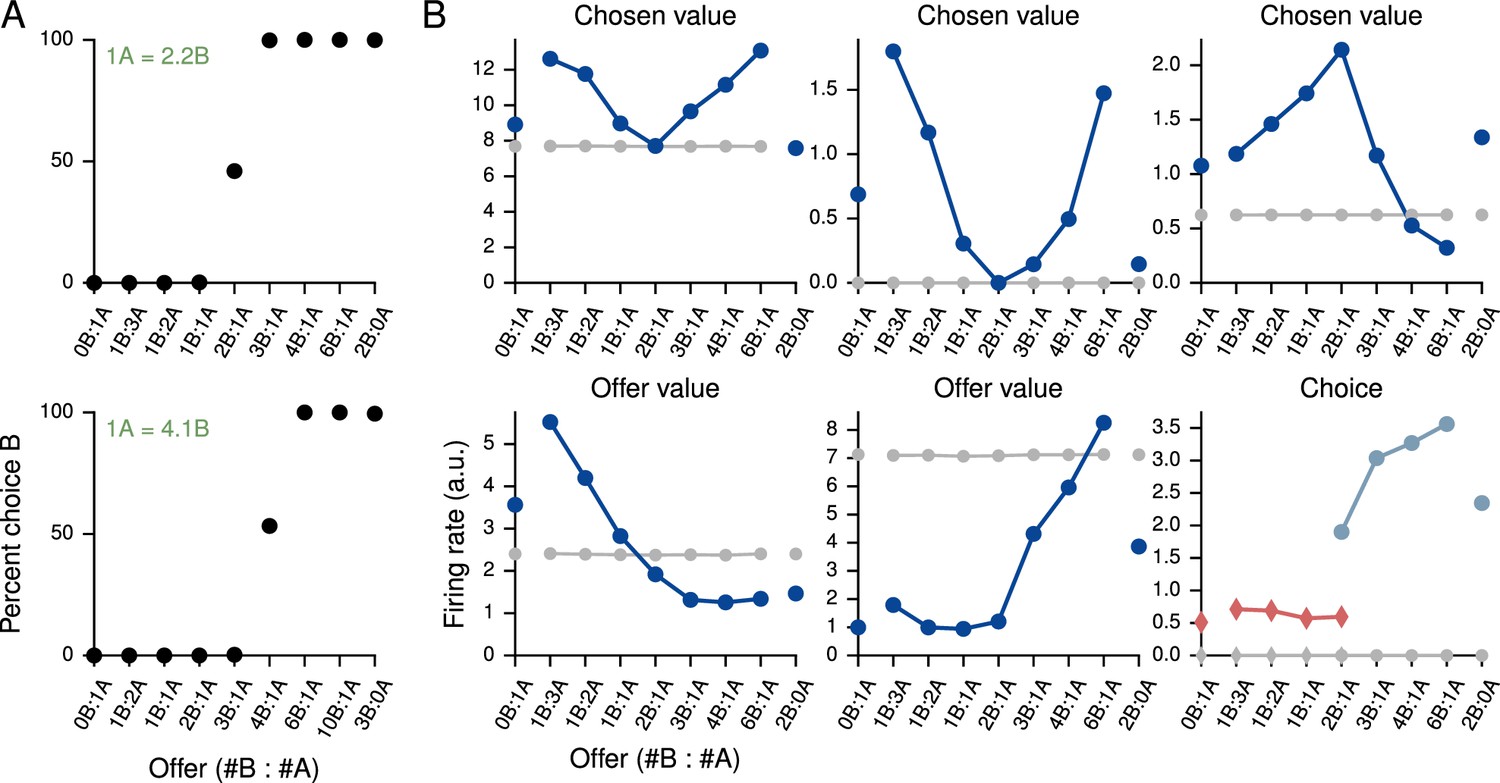
Value-based economic choice task (Padoa-Schioppa and Assad, 2006).
(A) Choice pattern when the reward contingencies are indifferent for roughly 1 'juice' of A and 2 'juices' of B (upper) or 1 juice of A and 4 juices of B (lower). (B) Mean activity of example value network units during the pre-choice period, defined here as the period 500 ms before the decision, for the 1A = 2B case. Units in the value network exhibit diverse selectivity as observed in the monkey orbitofrontal cortex. For 'choice' (last panel), trials were separated into choice A (red diamonds) and choice B (blue circles).
Figure 4—figure supplement 1
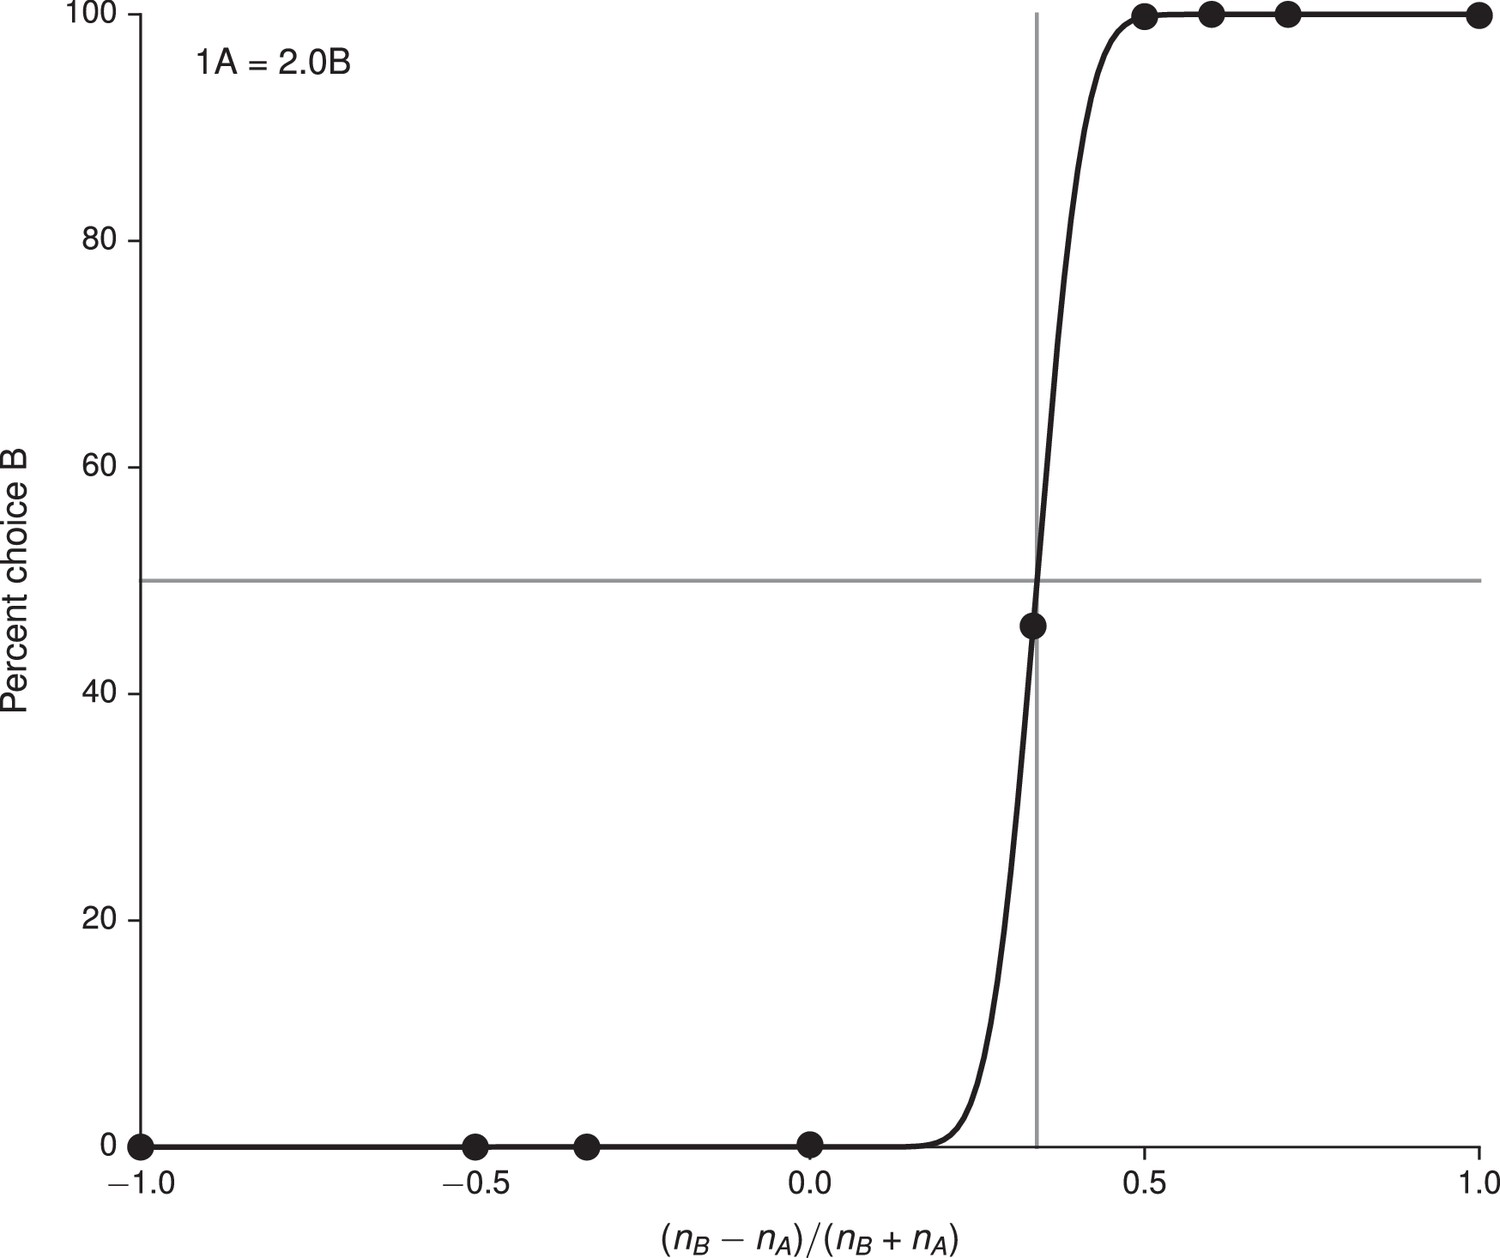
Fit of cumulative Gaussian with parameters , to the choice pattern in Figure 4 (upper), and the deduced indifference point .
https://doi.org/10.7554/eLife.21492.017
Figure 4—figure supplement 2
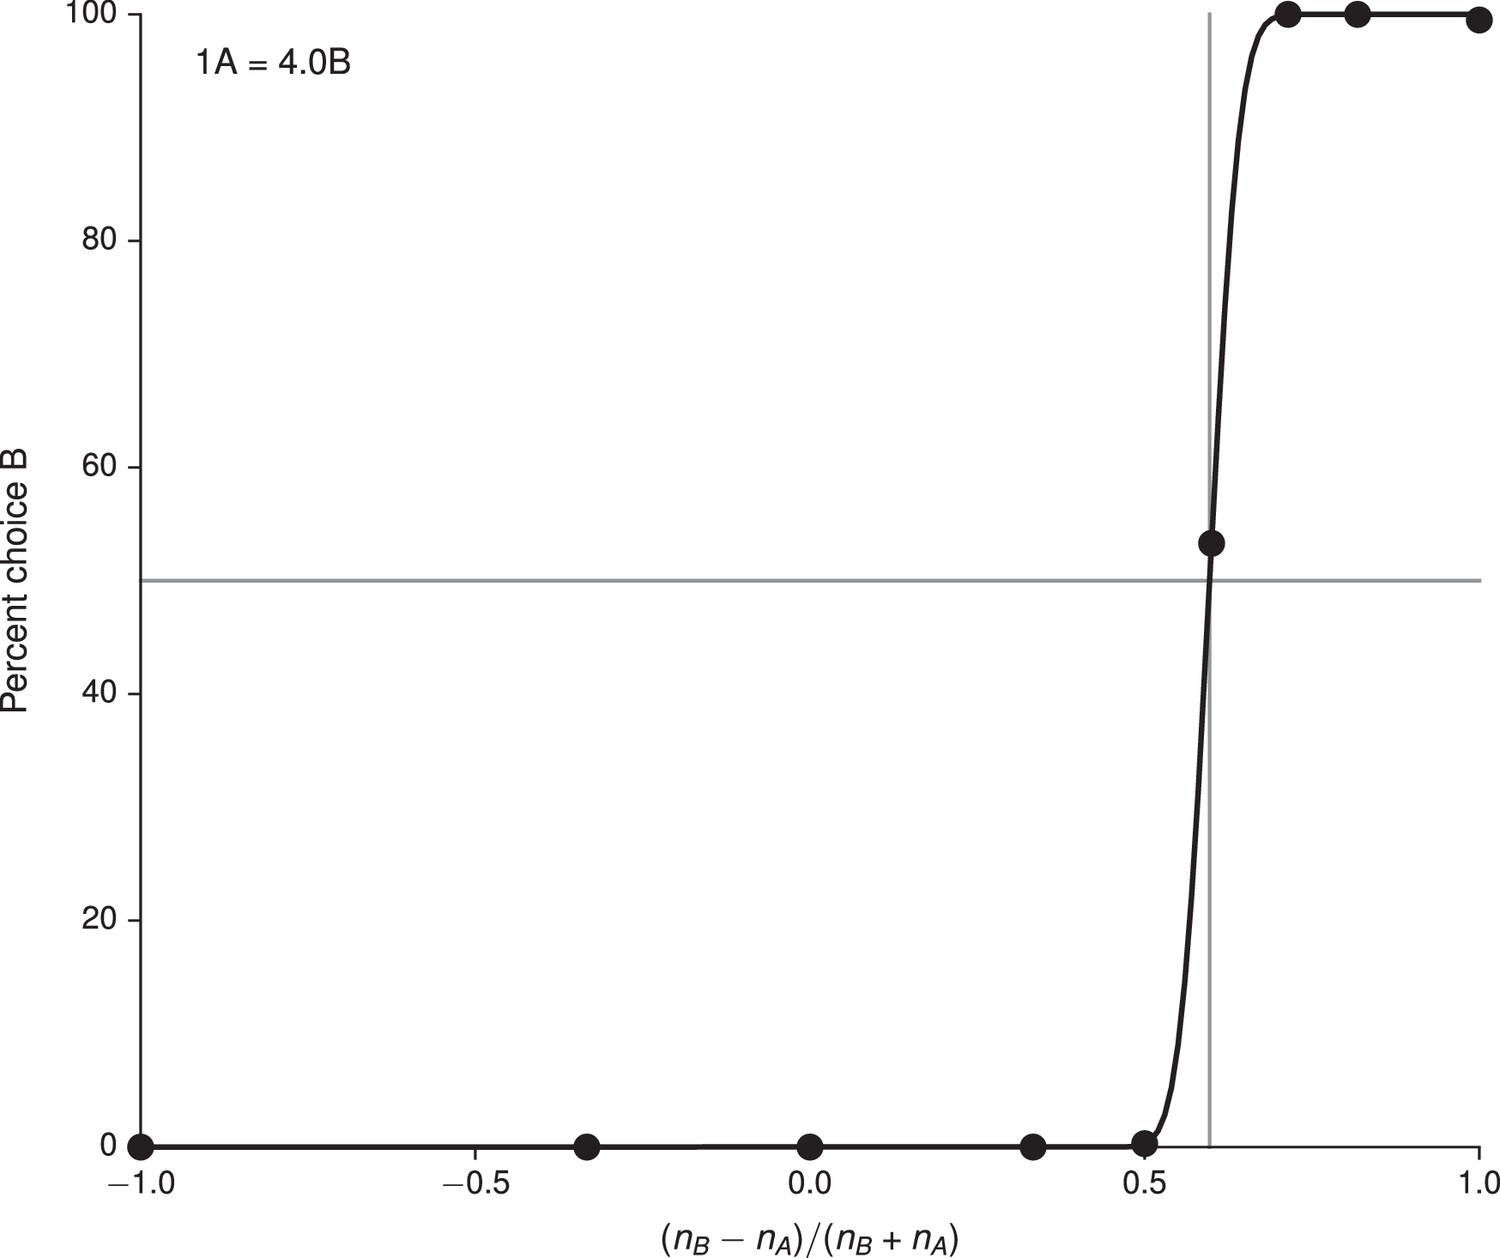
Fit of cumulative Gaussian with parameters , to the choice pattern in Figure 4A (lower), and the deduced indifference point .
https://doi.org/10.7554/eLife.21492.018
Figure 4—figure supplement 3
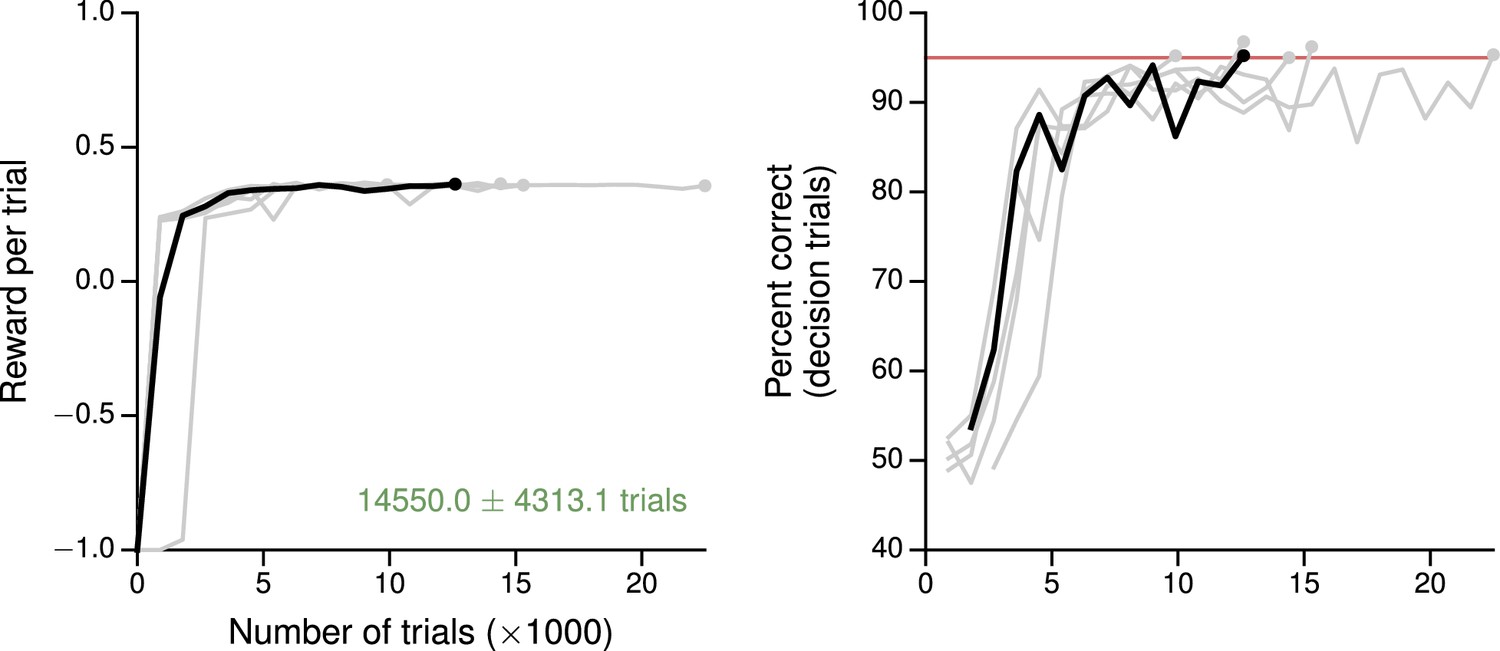
Learning curves for the value-based economic choice task.
(A) Average reward per trial. Black indicates the network realization shown in the main text, gray additional realizations, i.e., trained with different random number generator seeds. (B) Percentage of trials on which the network chose the option that resulted in greater (or equal) reward, for trials where the network made a decision (99% required for termination). Note this is conceptually different from the previous tasks, where 'correct' depends on the sensory inputs, not the rewards. Red: target performance (when training was terminated).
Tables
Table 1
Parameters for reward-based recurrent neural network training. Unless noted otherwise in the text, networks were trained and run with the parameters listed here.
| Parameter | Symbol | Default value |
|---|---|---|
| Learning rate | 0.004 | |
| Maximum gradient norm | 1 | |
| Size of decision/value network | 100 | |
| Connection probability (decision network) | 0.1 | |
| Connection probability (value network) | 1 | |
| Time step | 10 ms | |
| Unit time constant | 100 ms | |
| Recurrent noise | 0.01 | |
| Initial spectral radius for recurrent weights | 2 | |
| Number of trials per gradient update | # of task conditions |
Table 2
Psychophysical thresholds , , and obtained from fits of cumulative Gaussian functions to the psychometric curves in visual only, auditory only, and multisensory trials in the multisensory integration task, for six networks trained from different random initializations (first row, bold: network from main text, cf. Figure 2B). The last two columns show evidence of 'optimal' multisensory integration according to Equation 13 (Raposo et al., 2012).
| 2.124 | 2.099 | 1.451 | 0.449 | 0.475 |
| 2.107 | 2.086 | 1.448 | 0.455 | 0.477 |
| 2.276 | 2.128 | 1.552 | 0.414 | 0.415 |
| 2.118 | 2.155 | 1.508 | 0.438 | 0.440 |
| 2.077 | 2.171 | 1.582 | 0.444 | 0.400 |
| 2.088 | 2.149 | 1.480 | 0.446 | 0.457 |
Download links
A two-part list of links to download the article, or parts of the article, in various formats.
Downloads (link to download the article as PDF)
Open citations (links to open the citations from this article in various online reference manager services)
Cite this article (links to download the citations from this article in formats compatible with various reference manager tools)
Reward-based training of recurrent neural networks for cognitive and value-based tasks
eLife 6:e21492.
https://doi.org/10.7554/eLife.21492


