Dynamic transcriptional signature and cell fate analysis reveals plasticity of individual neural plate border cells
- California Institute of Technology, United States
Figures
Figure 1
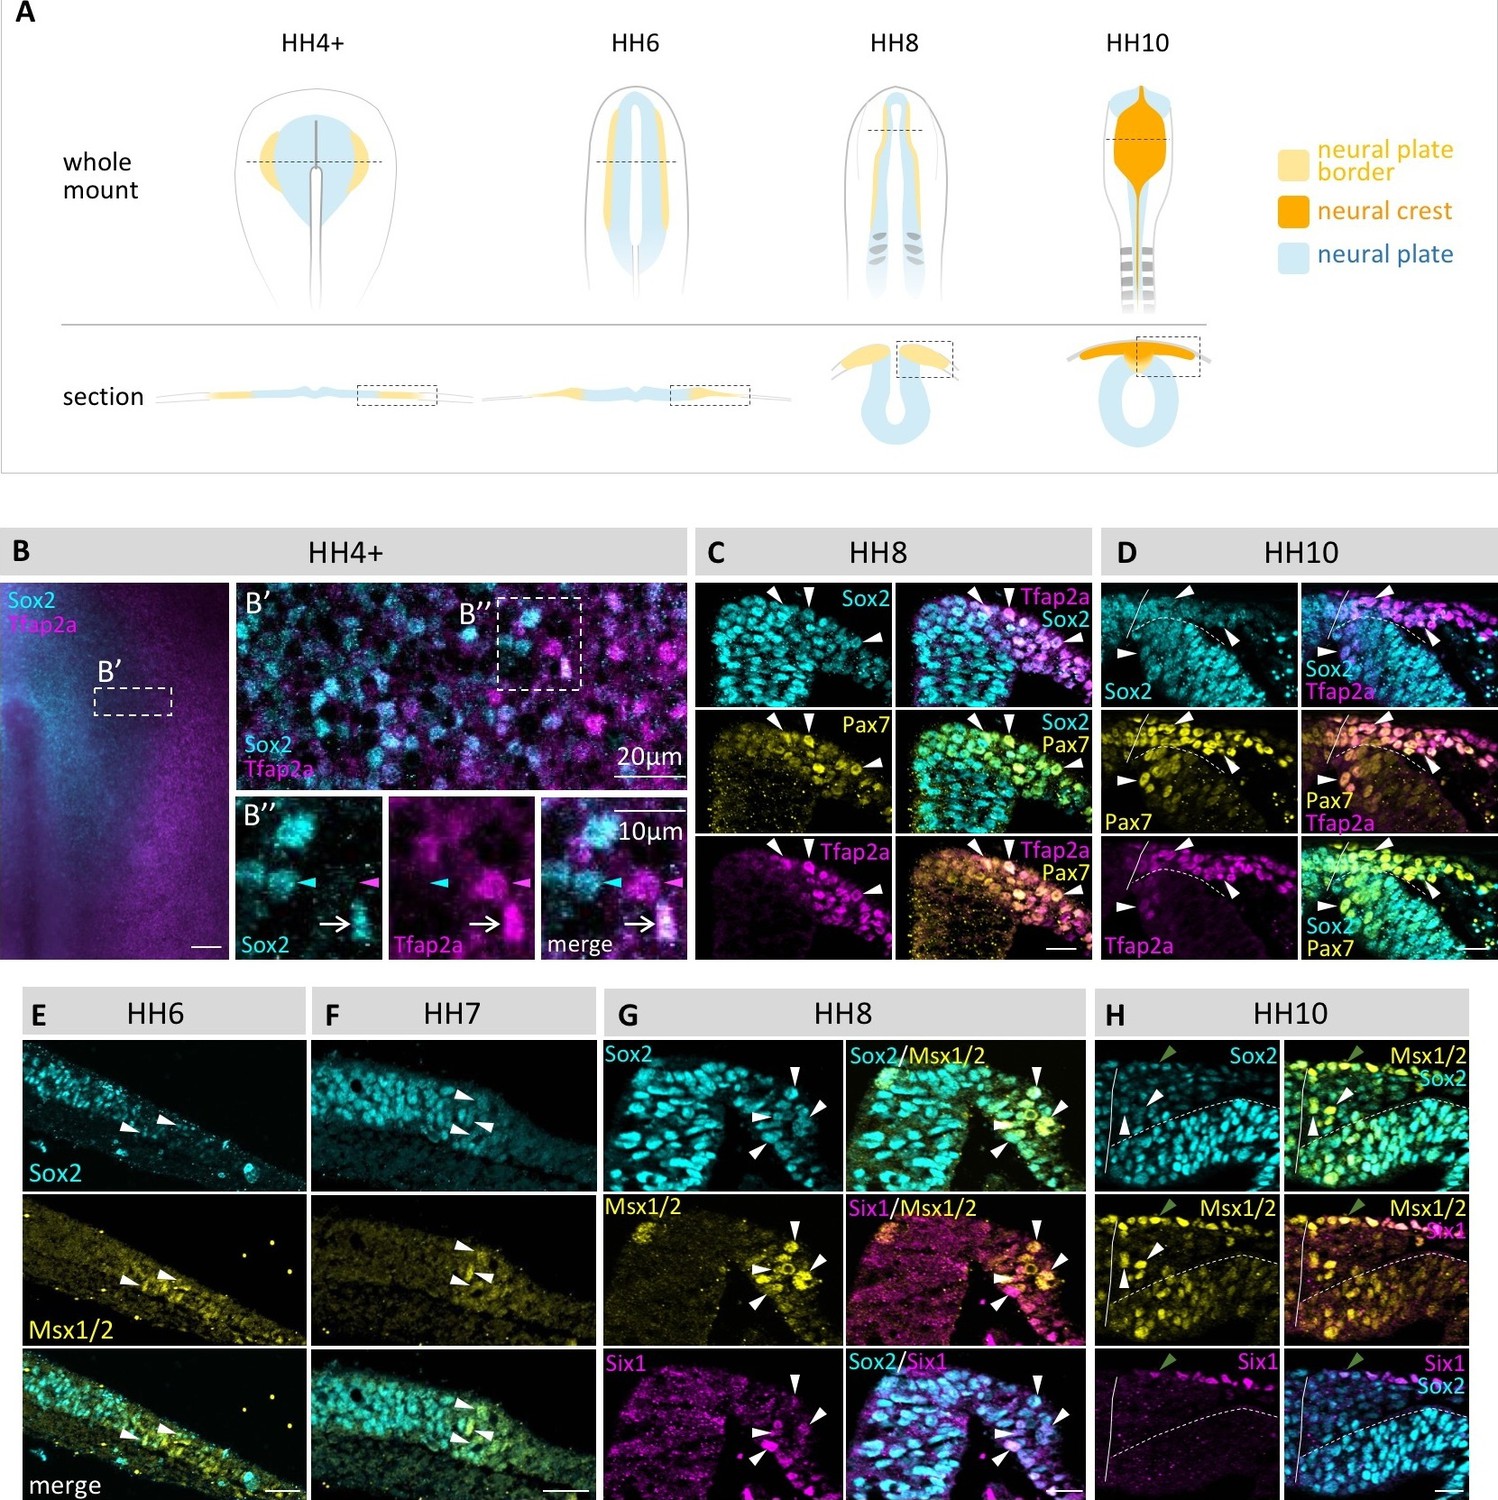
Coexpression of multiple transcription factor proteins in individual chick neural plate border (npb) cells as assayed by immunostaining at different developmental stages.
(A) Schematic diagrams of chicken embryos at different developmental stages from gastrulation to neurulation. Dashed line in whole mount indicates level of section. Dashed boxes indicate area displayed in (B–H). (B–B’’) Sox2 and Tfap2a in whole mount embryo at HH4+. (B’) Confocal image of npb (white box in B) shows Sox2 (blue) on medial (left) side and Tfap2a (magenta) on lateral (right) side of npb. B’’ zoom of box in B’ shows an example of a cell coexpressing Sox2 and Tfap2a (arrow) as well as a cell expressing either Sox2 (blue arrowhead) or Tfap2a (magenta arrowhead) only. (C–D) Transverse sections of embryos at HH8 to HH10 with co-immunostaining for Sox2 (blue), Tfp2a (magenta) and Pax7 (yellow). Arrowheads indicate examples of cells coexpressing all three markers. (E–F) Transverse sections of embryos at HH6 to HH7 with co-immunostaining for Sox2 (blue) and Msx1/2 (yellow). Arrowheads indicate examples of cells coexpressing both markers. (G–H) Transverse sections of embryos at HH8 and HH10 with co-immunostaining for Sox2 (blue) and Msx1/2 (yellow) and Six1 (magenta). Arrowheads in (G) indicate examples of cells coexpressing all three markers. White arrowheads in (H) indicate cells coexpressing Sox2 and Msx1/2 and green arrowhead indicates cell in epidermis co-expressing all three markers. All sections are oriented with medial to left and lateral to right side. Scale bars in wholemounts = 100 µm in sections = 20 µm (except 1B’’ = 10 µm).
Figure 2 with 3 supplements
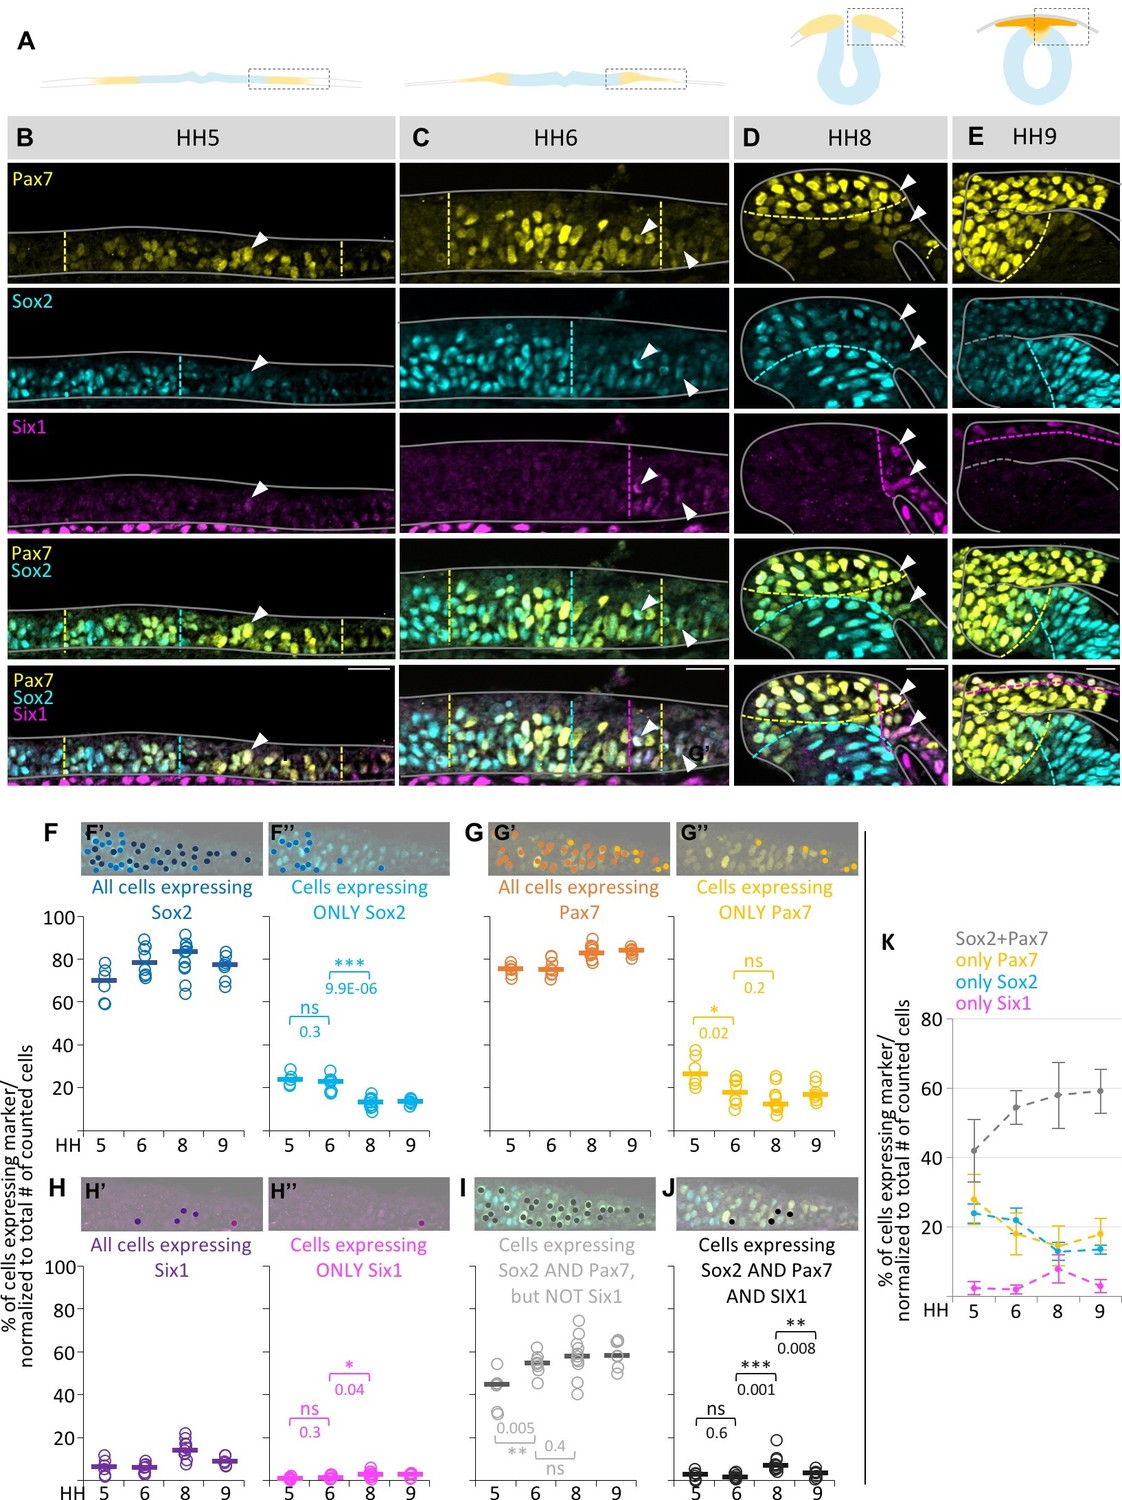
Quantification of marker (co-) expression in single cells.
(A) Schematic diagrams of sections staged accordingly to those used in (B–E). Box indicates area that was imaged in (B–E). (B–E) Transverse sections immunostained for Pax7 (yellow), Sox2 (blue) and Six1 (magenta) at HH5 (B), HH6 (C), HH8 (D) and HH9 (E). Grey lines outline the embryo borders. Dashed colored lines indicate borders between strong and weak/no expression of corresponding markers. Sections are oriented medial (left) to lateral (right). See also Figure 2—figure supplement 1. (F–H) Scatterplots of quantification of all cells that express Sox2 (F’), Pax7 (G’) and Six1 (H’) and the fraction of cells expressing only Sox2 (F’’), Pax7 (G’’) or Six1 (H’’) at HH5 to HH9. (I) Scatterplots representing the fraction of cells that coexpress Sox2 and Pax7, but not Six1 or (J) Sox2, Pax7 and Six1 at HH5 to HH9. See also Figure 2—source data 1. On top of scatterplots are sample images of a HH6 section with dots indicating cells expressing the corresponding marker. (K) Combination of medians of F’’, G’’, H’’ and I to illustrate difference of single (Sox2-blue, Pax7-yellow) or coexpressing cells (Sox2/Pax7-grey) at different stages. Scale bars = 20 µm. Asterisks indicate significance as calculated using a Student’s t-test with p-values displayed. Error bars indicate standard deviation.
-
Figure 2—source data 1
Quantification of marker coexpression in single cells.
- https://doi.org/10.7554/eLife.21620.004
Figure 2—figure supplement 1
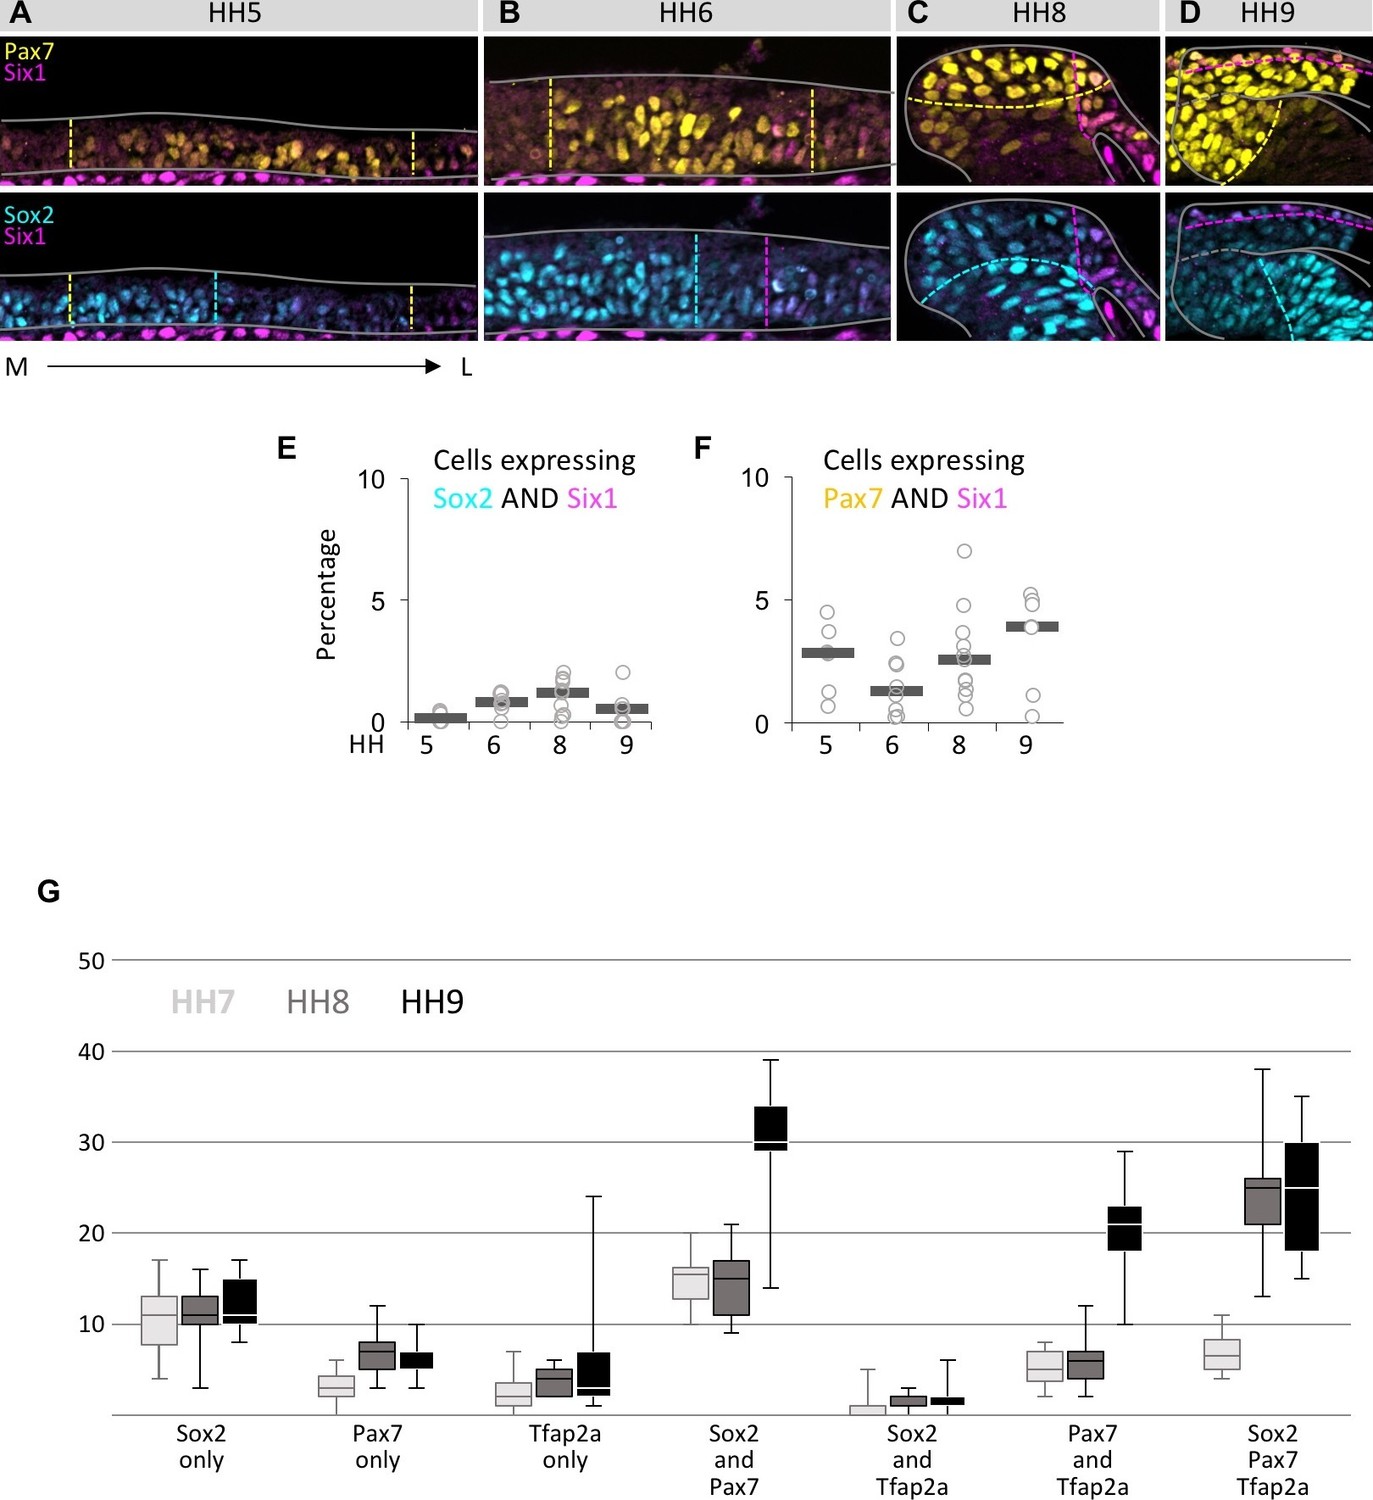
Coexpression of markers in single neural plate border cells.
(A–D) Transverse sections immunostained for Pax7 (yellow)/Six1 (magenta) or Sox2 (blue)/Six1 (magenta) at HH5 (A), HH6 (B), HH8 (C) and HH9 (D). Grey lines outline the embryo borders. Dashed colored lines indicate borders of strong and weak/no expression of corresponding markers. Sections are oriented medial (left) to lateral (right). (E) Scatterplot of quantification of cells coexpressing Sox2 and Six1, but not Pax7 at HH5 to HH9. (F) Scatterplot of quantification of cells coexpressing Pax7 and Six1, but not Sox2 at HH5 to HH9. (G) Boxplot showing quantification of cells in the neural plate border/dorsal neural fold expressing only one of the markers examined (Sox2 only, Pax7 only, Tfap2a only) or a combination of two (Sox2/Pax7, Sox2/Tfap2a, Pax7/Tfap2a) or three markers (Sox2/Pax7/Tfap2a) at HH7 (light grey), HH8 (medium grey) to HH9 (black). For quantification, non-consecutive sections from a representative embryo were used for each stage (HH7, n = 12 sections; HH8, n = 9 sections; HH9, n = 5 sections).
Figure 2—figure supplement 2
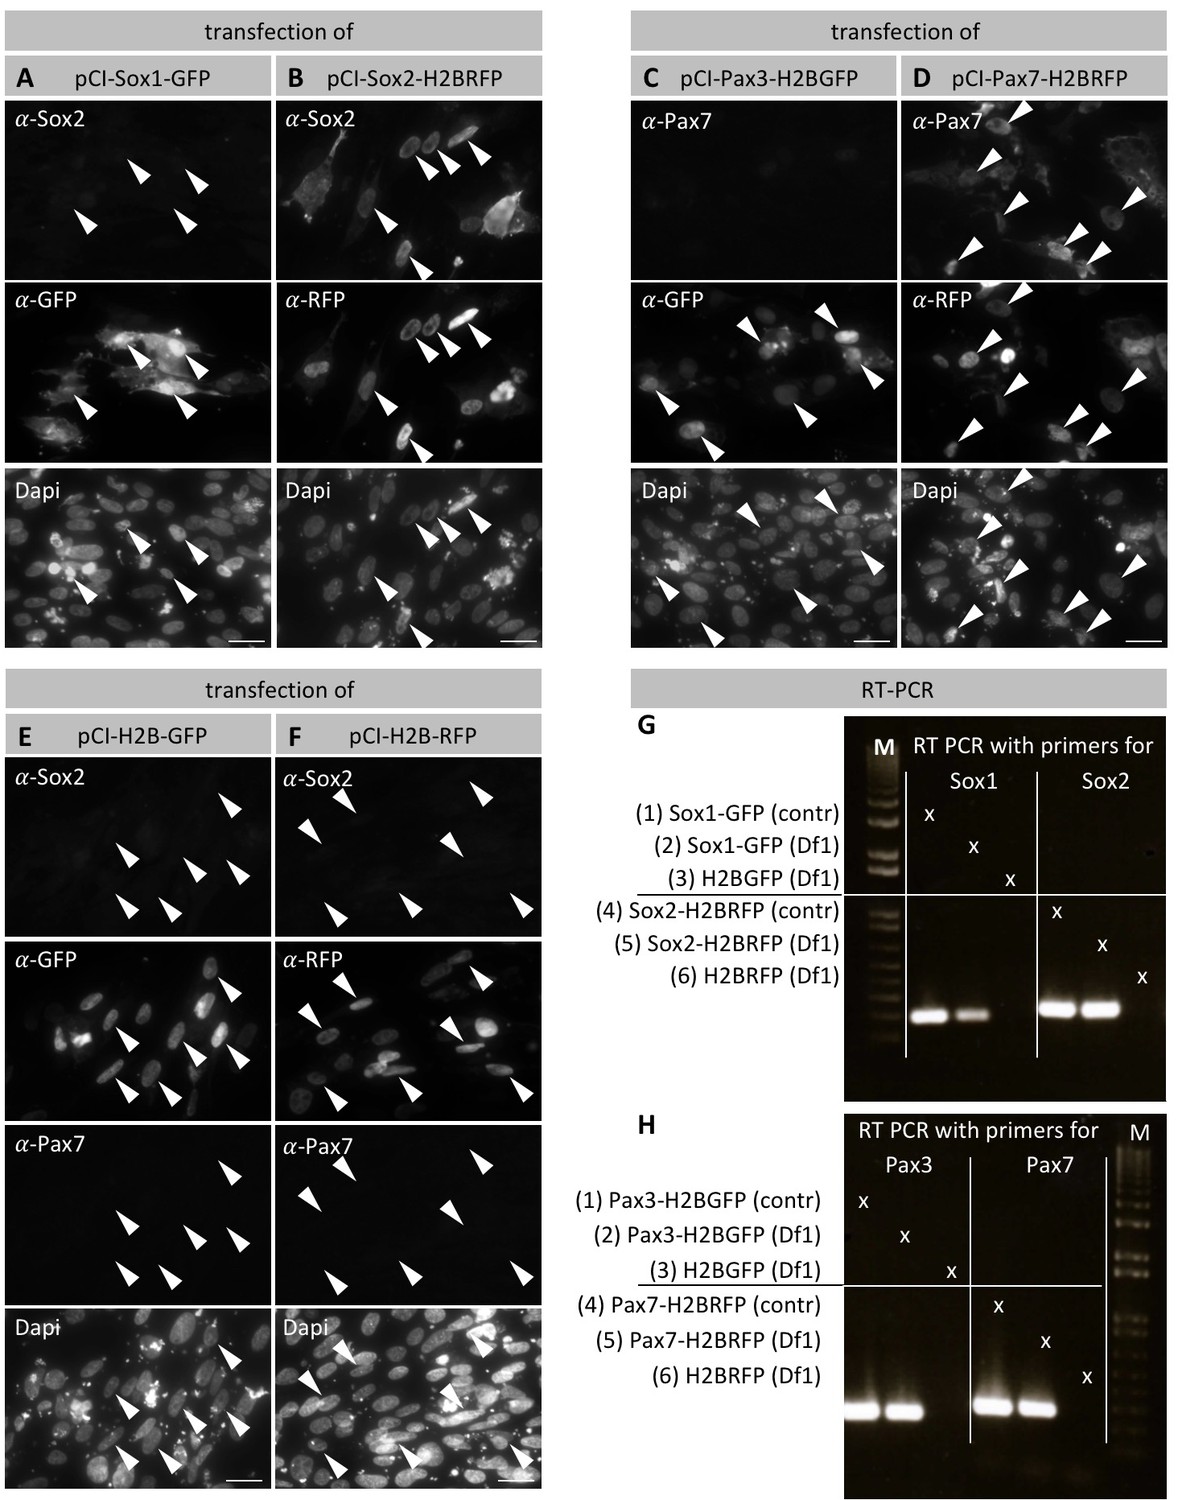
Specificity of Sox2 and Pax7 antibodies.
(A–B) Chicken Df1 fibroblasts were transfected with pCI-Sox1-GFP (A) or pCI-Sox2H2BRFP (B) and immunostained against GFP or RFP respectively, as well as against Sox2. (A) Arrowheads point to Sox1-GFP transfected cells/nuclei that express GFP, but not Sox2. (B) Arrowheads point to Sox2-H2BRFP transfected cells that express nuclear RFP as well as Sox2. (C–D) Df1 cells transfected with pCI-Pax3-H2BGFP (C) or pCI-Pax7-H2BRFP (D), and immunostained against GFP or RFP respectively, as well as against Pax7. (C) Arrowheads point to Pax3-H2BGFP transfected cells that express nuclear GFP, but not Pax7. (D) Arrowheads point to Pax7-H2BRFP transfected cells that express nuclear RFP as well as Pax7. (E–F) Df1 cells transfected with either pCI-H2B-GFP or pCI-H2B-RFP as negative control with subsequent immunostaining against GFP/RFP respectively as well as Sox2 and Pax7. Cells transfected with either construct show strong GFP or RFP expression, but lack Sox2 and Pax7 expression. Dapi was used to visualize the cell nuclei. Scale bars equal 20 µm. (G) RT-PCR of cDNA reverse transcribed from RNA from cells transfected with either Sox1-GFP or Sox2-H2B-RFP (Line 2 and 5, respectively). As positive control plasmid DNA of pCI-Sox1-GFP (line 1) and pCI-Sox2-H2B-RFP (line 4) was used. As negative control cDNA reverse transcribed from RNA from cells transfected with either pCI-H2B-GFP (line 3) or pCI-H2B-RFP (Line 6) was used. (H) RT-PCR of cDNA reverse transcribed from RNA from cells transfected with either Pax3-H2B-GFP or Pax7-H2B-RFP (Line 2 and 5, respectively). Plasmid DNA of pCI-Pax3-H2B-GFP (line 1) and pCI-Pax7-H2B-RFP (line 4) were used as positive controls. Negative control as in (G).
Figure 2—figure supplement 3
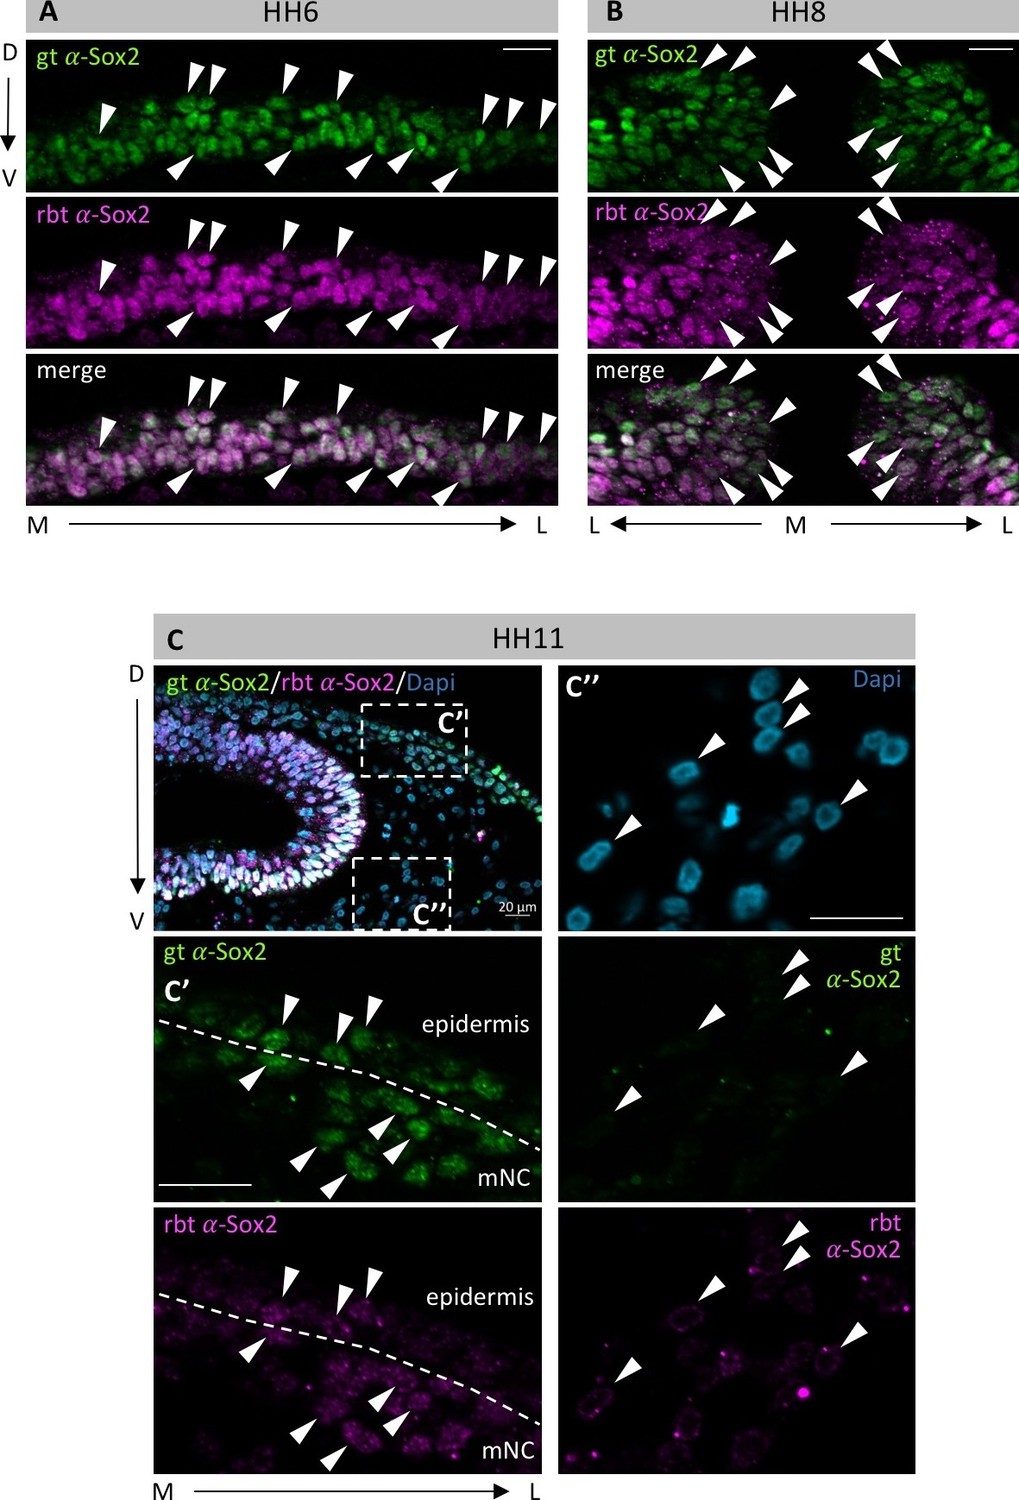
Different Sox2 antibodies exhibit identical staining patterns.
Embryos at HH6 (A), HH8 (B) and HH11 (C) were co-immunostained with a goat-α-Sox2 (gt-α-Sox2, green) and a rabbit-α-Sox2 (rbt-α-Sox2, magenta) antibody in whole mount, and then sectioned. (A, B) Arrowheads point to examples of nuclei that are co-stained for both antibodies. M-medial, L-lateral, D-dorsal, V-ventral. (C) white boxes indicate enlargements on (C’) and (C’’) Nuclei were counterstained with Dapi (blue). (C’) enlarged area at interface of neural crest and epidermis shows co-stained nuclei within epidermis and neural crest. (C’’) Enlarged area in mesoderm. As expected, neither goat-α-Sox2 nor rbt-α-Sox2 stain mesodermal nuclei. Scale bars = 20 µm.
Figure 3 with 1 supplement

Spatial distribution of transcription factor expression at the neural plate border and dorsal neural fold/tube.
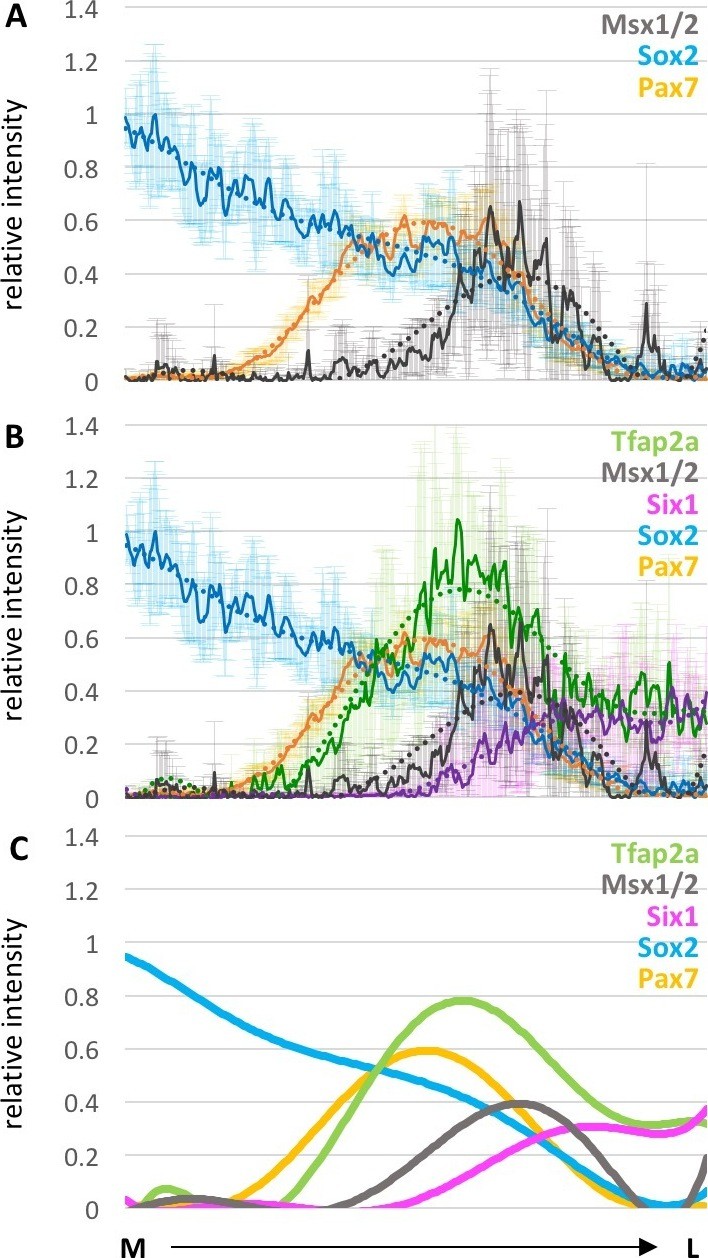
(A–C) Images of Pax7 immunostaining (yellow) in representative embryos used to measure intensity profiles across the neural plate border at HH5 (A), HH6 (B) and the dorsal neural fold at HH8 (C). Scale bar = 20 µm. (D–F) A line (yellow), as illustrated in this example, was drawn across the neural plate border/neural fold to measure intensity. (G–I) Intensity profiles of Sox2 (blue) and Pax7 (yellow) protein expression across the neural plate border from medial to lateral. Grey bars indicate extent of Pax7 expression at the neural plate border/dorsal neural fold. See also Figure 3—source data 1–3. (J) Box plot of intensity of Sox2 (blue) and Pax7 (yellow) protein expression in dorsal neural fold (dNF) at HH8 compared to dorsal neural tube (dNT) and migrating neural crest (mNC) at HH9. Asterisks indicate significance as calculated using a Student’s t-test with p-values displayed. Error bars indicate standard deviation. See also Figure 3—source data 4. (K–L) Line plots of relative intensity of certain markers in combination with Sox2 (blue) and Pax7 (yellow) at HH8: (K) Tfap2a (green) (2–8 sections per embryo, n = 4 embryos) (L) Six1 (magenta) (5–8 sections per embryo, n = 5 embryos). (M) Combination of all markers Tfapa2 (green), Six1 (magenta) Sox2 (blue) and Pax7 (yellow). See also Figure 3—figure supplement 1 and Figure 3—source data 5 and 6. (A–D) Dark line indicates average across all embryos, with standard deviation indicated by shaded region. Dotted line is polynomial trend line (order 6). M-medial, L-lateral. Intensities are displayed as grey values as measured by Fiji.
-
Figure 3—source data 1
Spatial distribution of transcription factor expression at the neural plate border at HH5.
- https://doi.org/10.7554/eLife.21620.009
-
Figure 3—source data 2
Spatial distribution of transcription factor expression at the neural plate border at HH6.
- https://doi.org/10.7554/eLife.21620.010
-
Figure 3—source data 3
Spatial distribution of transcription factor expression at dorsal neural fold at HH8.
- https://doi.org/10.7554/eLife.21620.011
-
Figure 3—source data 4
Comparison of Sox2 and Pax7 protein expression at HH8 vs HH9.
- https://doi.org/10.7554/eLife.21620.012
-
Figure 3—source data 5
Spatial distribution of Tfap2a expression at the neural plate border at HH8.
- https://doi.org/10.7554/eLife.21620.013
-
Figure 3—source data 6
Spatial distribution of Six1 expression at the neural plate border at HH8.
- https://doi.org/10.7554/eLife.21620.014
Figure 3—figure supplement 1
Spatial distribution of expression of different markers across dorsal neural fold at HH8.
(A) Line plots of relative intensity of Msx1/2 (grey) (7 sections of one embryo) in combination with Sox2 (blue) and Pax7 (yellow) (see also Figure 3): (B) Combination of all measured markers: Tfap2a (green), Msx1/2 (grey), Six1 (magenta) Sox2 (blue) and Pax7 (yellow). (A, B) Dark line indicates average across all embryos, with standard deviation indicated by shaded region. Dotted line is polynomial trend line (order 6). (C) Simplified version of (B) with only trendline of the corresponding markers. M-medial, L-lateral.
Figure 4
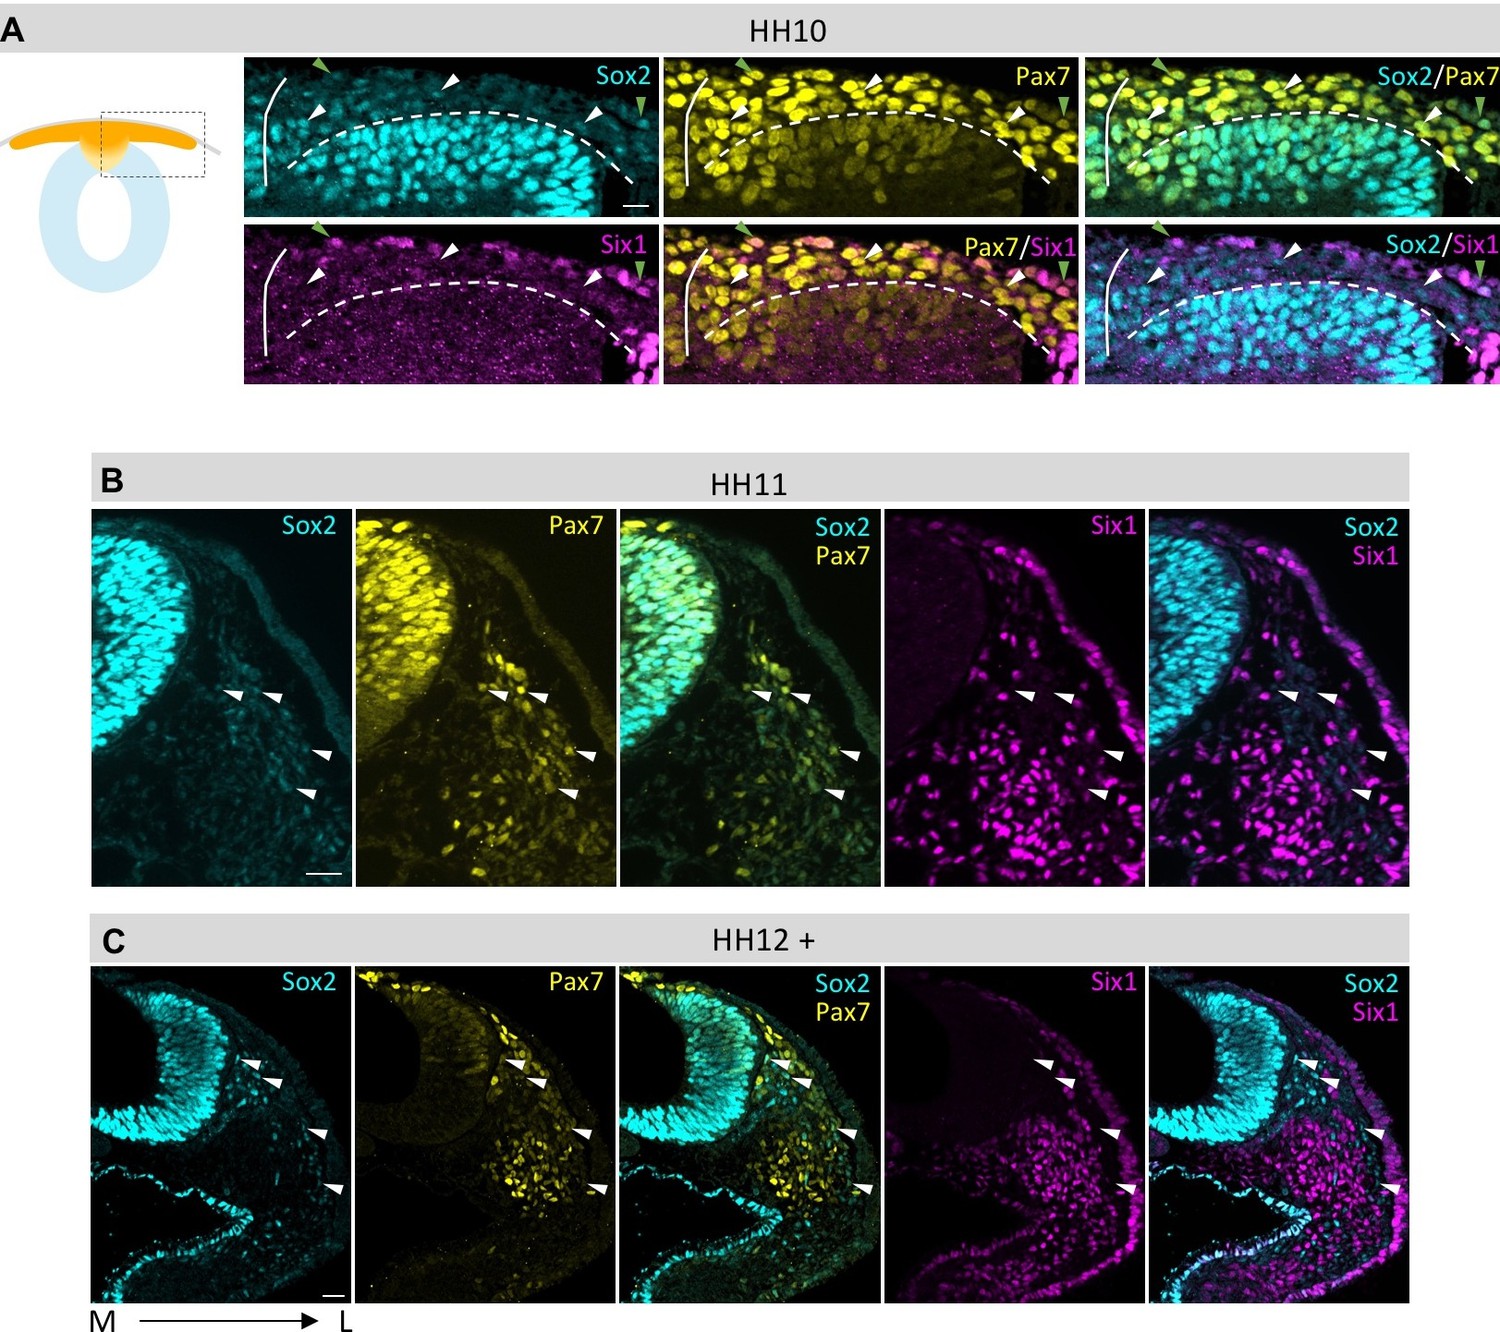
Comparison of Sox2, Pax7 and Six1 protein expression in dorsal neural tube and migrating neural crest.
(A–C) Sox2 protein expression compared to Pax7 and Six1. Low Sox2 levels are detectable in early (A, HH10) and late (B, HH11; C, HH12) migrating neural crest. All sections are oriented medial (left) to lateral (right). White arrowheads indicate delaminated neural crest cells that coexpress Pax7 and Sox2, but not Six1. Green arrowheads (in A) indicate epidermal cells that coexpress Pax7 and Sox2 and Six1. White line in (A) demarcates the embryonic midline and dashed line represents the border between neural tube and migrating neural crest. Scale bars = 20 µm.
Figure 5
Using the Sox2-reporter to follow the fate of neural plate border cells.
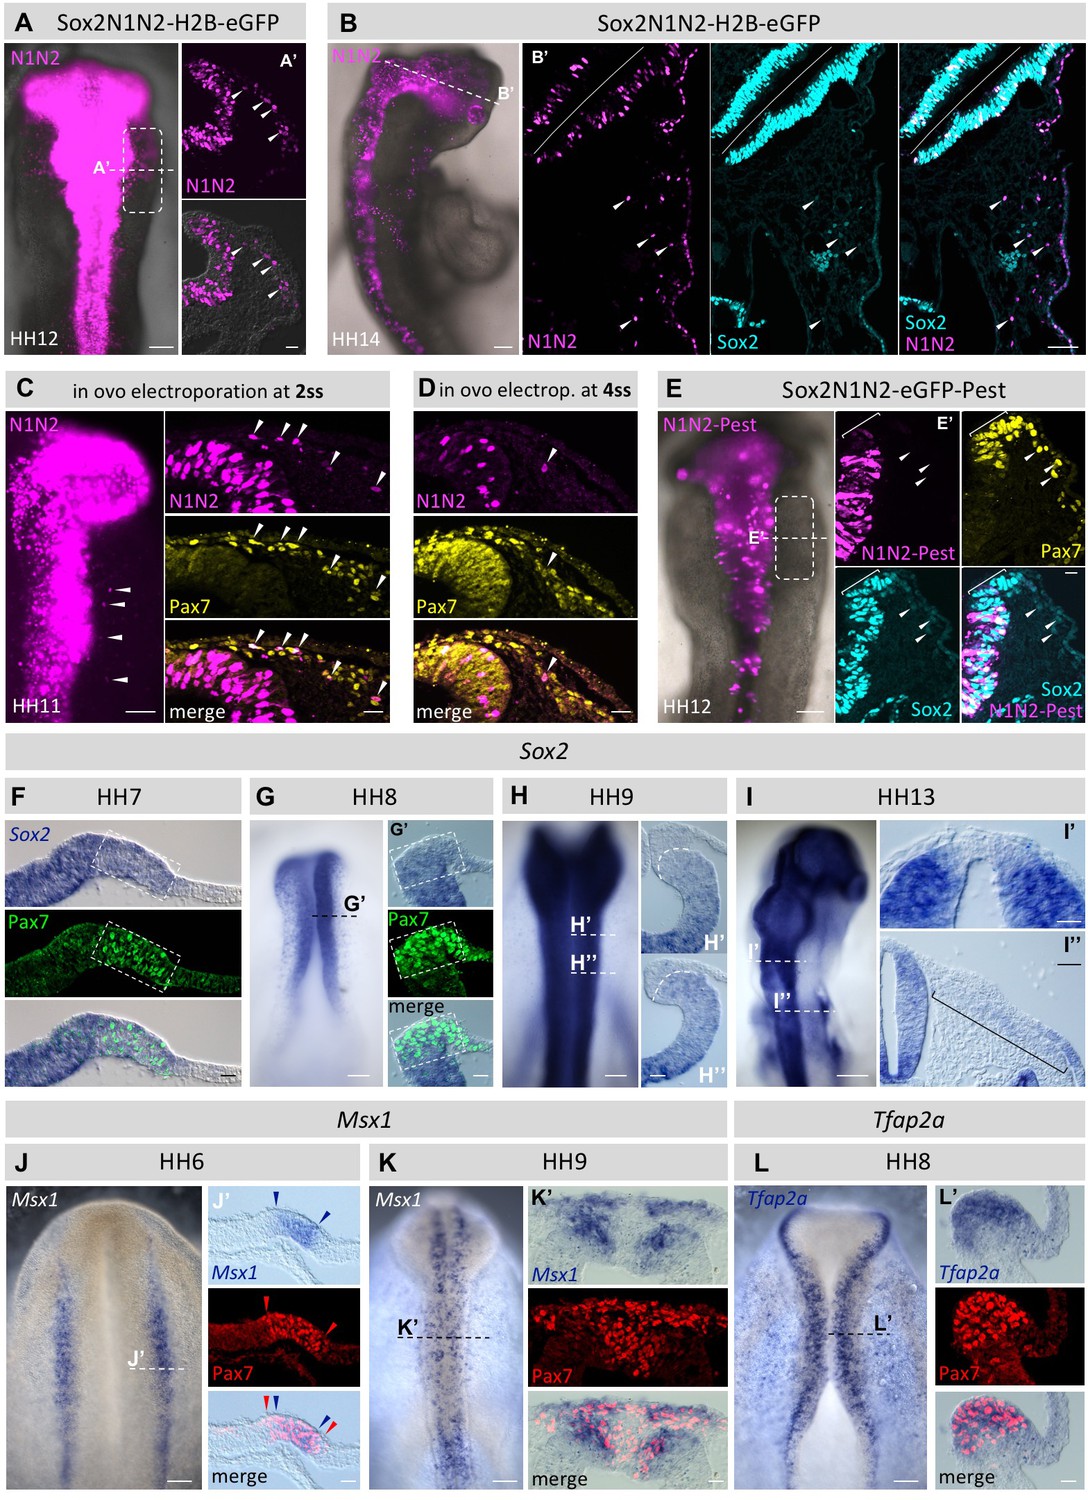
(A) Sox2N1N2-H2B-eGFP construct was electroporated in HH4 chicken embryos. At HH12, eGFP reporter expression is visible not only in the neural tube, but also in migrating neural crest cells (box). Dashed line indicates level of transversal section in (A’). Arrowheads indicate N1N2-reporter positive migrating neural crest cells. (B) N1N2-reporter expression is maintained in HH14 cranial crest. Dashed line indicates level of section (B’). Arrowheads indicate cells positive for N1N2-reporter and endogenous Sox2 protein. (C, D) In ovo electroporation of Sox2-N1N2-H2B-GFP 2ss (C) and 4ss (D). Note that the number of electroporated cells decreases at progressively later stages. Arrowheads indicate migrating neural crest cells positive for reporter expression. (E) N1N2-eGFP-PEST was electroprated into HH4 embryos. At HH12, N1N2-eGFP-PEST-reporter is expressed in neural tube, but barely visible in its dorsal most portion (bracket in E’), although endogenous Sox2 protein expression is maintained as visualized by immunostaining (blue). Arrowheads indicate migrating neural crest that express low levels of endogenous Sox2 protein but lack the N1N2-destabilized reporter expression. (F–I) Sox2 mRNA expression. Dashed lines indicate levels of transverse sections (G’, H’, H’’, I’, I’’). Transverse sections of (F) HH7 and (G) HH8 embryos showing strong Sox2 mRNA expression in the dorsal neural fold that overlaps with Pax7 protein expression (box). (H) At HH9 Sox2 mRNA is barely detectable in the dorsal neural tube and premigratory crest (H’, H’’). Dashed line in H’ and H’’ demarcates boundary of dorsal neural tube and pre-migratory neural crest. (I) At HH13 Sox2 mRNA is barely detectable in the dorsal neural tube (I’), but seen at very low levels in the rhombomere 4 neural crest stream (bracket in I’’). (J, K) mRNA expression of Msx1 in wholemounts. Dashed lines indicate levels of sections (J’ and K’). (J’) HH7 embryo showing strong Msx1 mRNA expression (blue arrowheads) in the dorsal neural fold that is nested within the Pax7 protein domain (red arrowheads). (K) HH9 embryo with overlapping Msx1 mRNA expression and Pax7 protein expression in the dorsal neural tube and the delaminated neural crest. (L) mRNA expression of Tfap2a in wholemount at HH8 with dashed line indicating approximate level of section (L’). Scale bars on whole mounts = 100 µm; on sections = 20 µm, except (2B’ = 100 µm; F’’ = 40 µm).
Figure 6 with 2 supplements
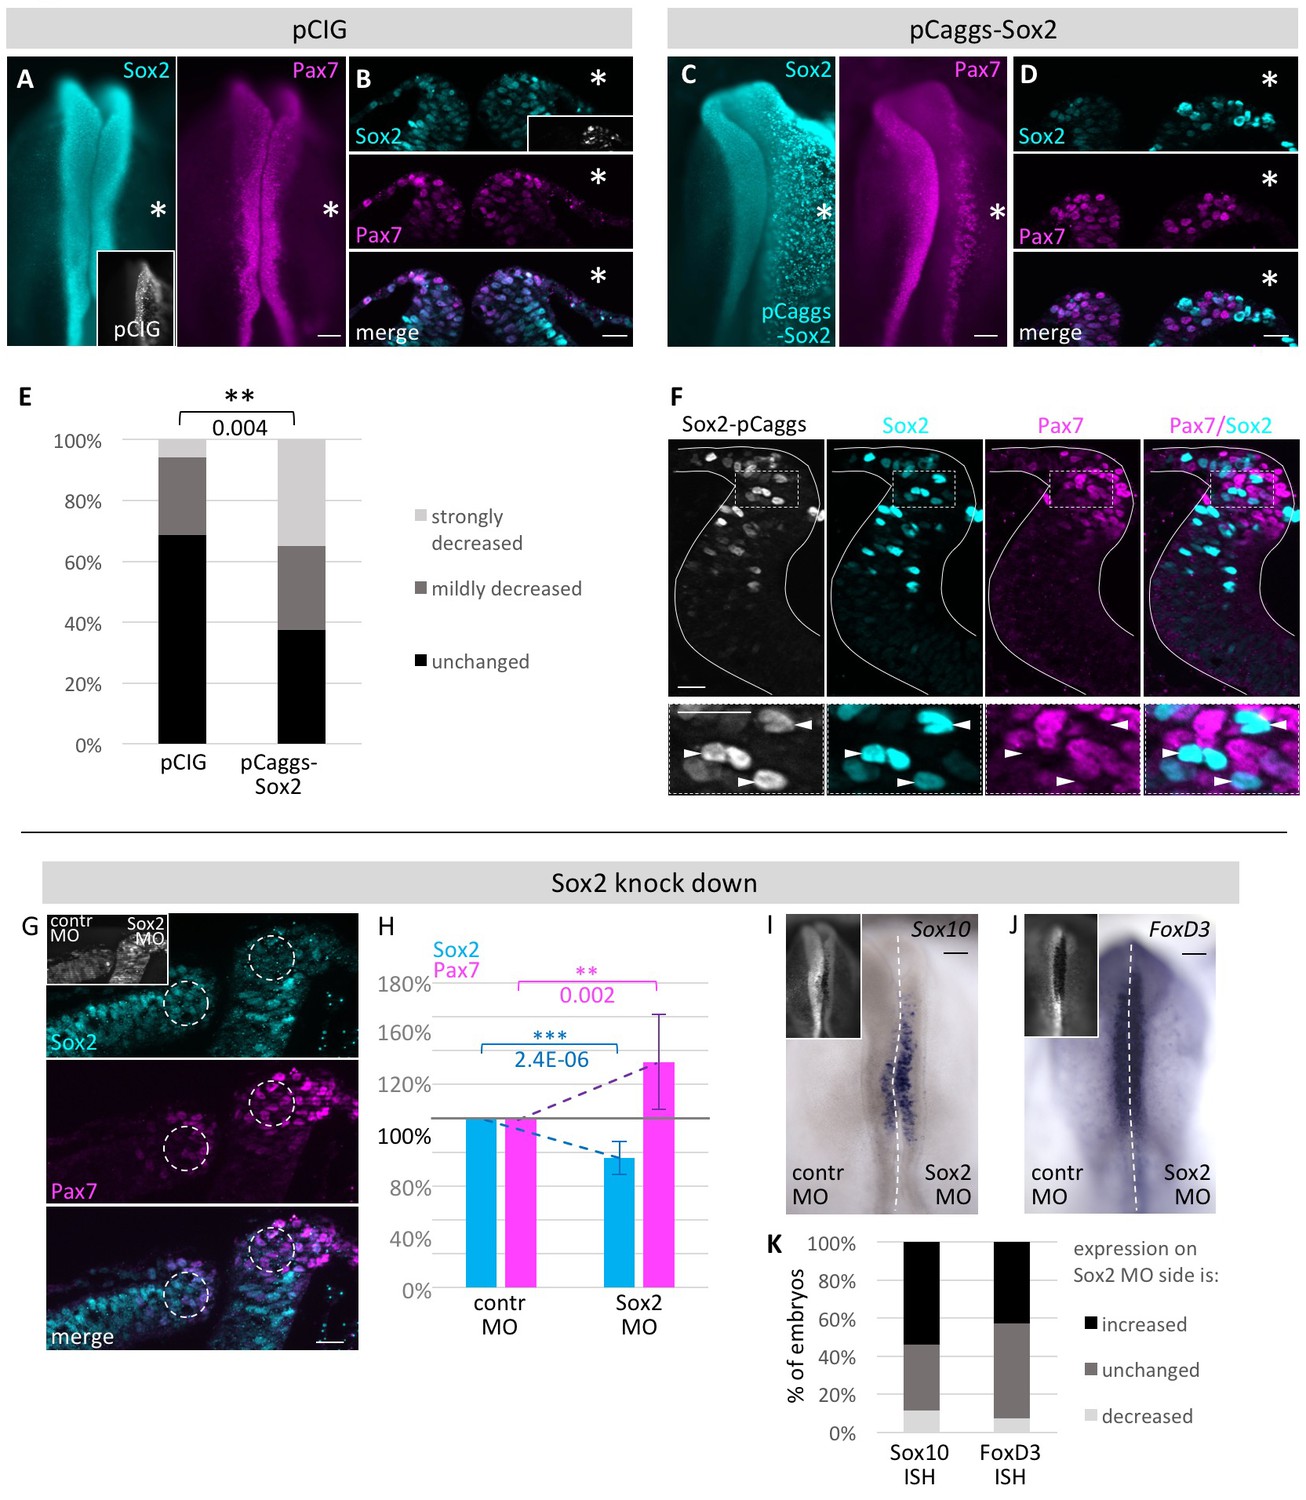
Functional analysis of modulating Sox2 levels.
HH4 embryos were electroporated with (A, B) control vector pCIG or (C, D) pCAGGS-cSox2 on right side of embryo and immunostained for Sox2 (blue) and Pax7 (magenta). Embryos displayed as whole mount (A, C) or transversal sections (B, D). (E) Quantification of numbers of pCIG or pCaggs-Sox2 treated embryos with a strong or mild loss or unchanged expression of Pax7 versus control side of same embryo. Asterisk indicates significant difference as calculated by contingency table followed by Chi-Square test. Scale bar = 100 µm in whole mount and 20 µm in sections. See also Figure 6—source data 1. (F) Transversal sections of embryos overexpressing Sox2 at HH8. White lines outline neural tube. Box indicates area of enlarged inset. Cells with strong Sox2 (blue) overexpression (arrowheads) in dorsal neural fold show very low levels of Pax7 (magenta). (G) Sections of embryo where Sox2 was knocked down with 0.5 mM Fitc-labeled Sox2 MO on right side and control MO on left side of HH4 embryo (inset). Immunostaining for Sox2 (blue) and Pax7 (magenta). Circles in dorsal neural fold indicate area of measurement for (H). (H) Quantification of Sox2 and Pax7 protein expression in dorsal neural fold upon Sox2 knockdown. Sox2 is reduced by 23.4 ± 9.9% when comparing control to experimental side. This causes increase of Pax7 expression of 33.3 ± 28.0%. Asterisks indicate significance as calculated using a Student’s t-test. p-values are indicated in graphs. Error bars signify standard deviation. See also Figure 6—source data 2. (I, J) Sox2 knock down with 0.5 mM Fitc-labeled Sox2 MO on right side or 0.5 mM Fitc-labeled control MO on left side of HH4 embryo (inset) with subsequent ISH for (I) Sox10 mRNA or for (J) FoxD3 mRNA at HH9. (K) Quantification of Sox10 and FoxD3 mRNA expression level changes upon Sox2 knockdown. Scale bar = 100 µm. See also Figure 6—source data 3.
-
Figure 6—source data 1
Quantification/Analysis of Sox2 overexpression experiments.
- https://doi.org/10.7554/eLife.21620.020
-
Figure 6—source data 2
Quantification/Analysis of Sox2 knock down experiments.
- https://doi.org/10.7554/eLife.21620.021
-
Figure 6—source data 3
Quantification of Sox10 and FoxD3 mRNA expression upon Sox2 knock down.
- https://doi.org/10.7554/eLife.21620.022
Figure 6—figure supplement 1
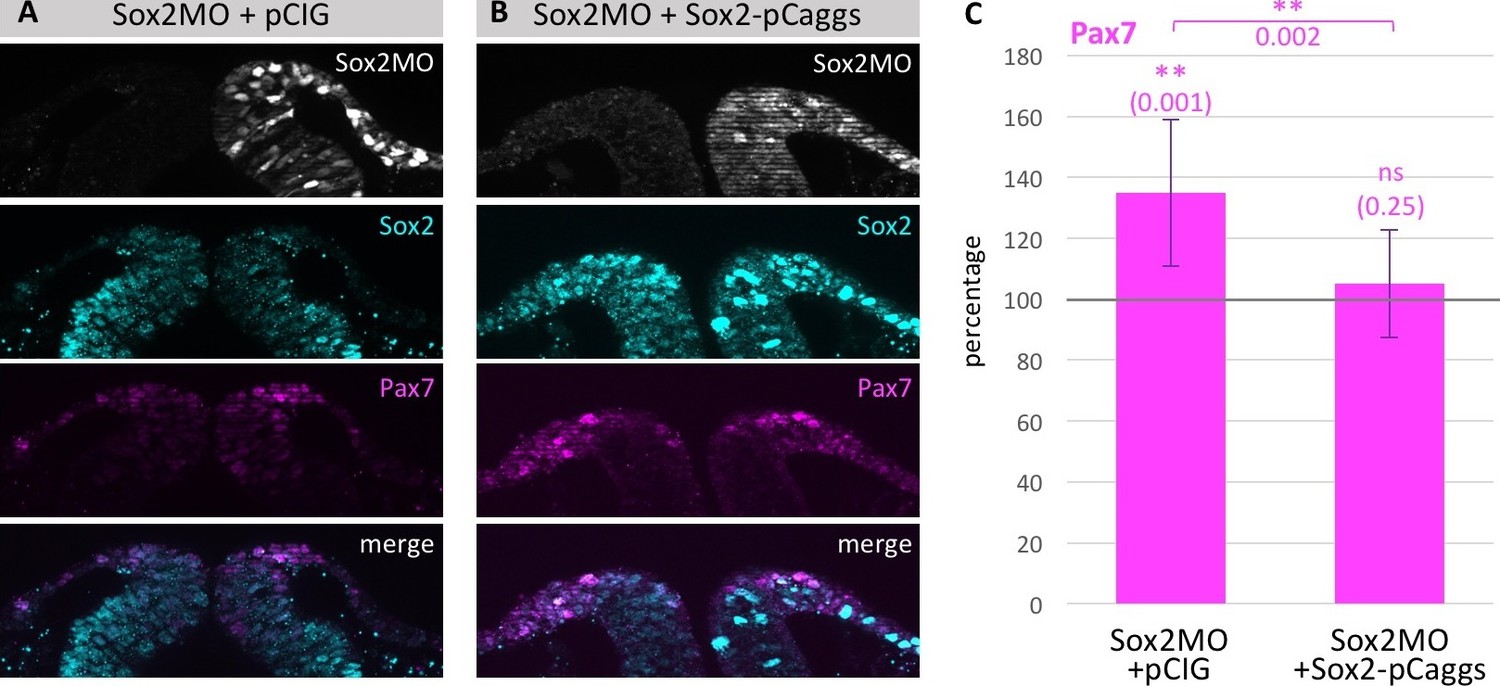
Loss of Pax7 expression is rescued by exogenous Sox2 protein.
(A) Section of embryo electroporated with Sox2 MO in combination with (A) empty vector pCIG or (B) with pCaggs-Sox2 expression construct. (C) Quantification of embryos with upregulation of Pax7 expression upon Sox2 MO knock down (5–8 sections/embryo, n = 8 embryos) compared to rescue experiment (4–7 sections/embryo, n = 16 embryos). Asterisks indicate significance as calculated using a Student’s t-test. p-values are indicated in graphs. Error bars signify standard deviation. Scale bar = 20 µm.
Figure 6—figure supplement 2

Validation of Morpholino knockdown specificity and efficiency.
(A) Schematic representation of expression constructs used to test MO specificity and efficiency. The MO target side containing 5’UTR and first 10 amino acids (10AA) were cloned in frame with H2B-RFP into a construct driven by the pCaggs promoter. (B) Representation of electroporation scheme. Targeted MO or control MO (both green) were electroporated to left and right side of same embryo, respectively, together with the corresponding expression constructs. (C, C’, D, D’) Dorsal view of embryos electroporated with Sox2 MO, left side, and control MO (contr MO), right side. (C’) Embryo co-electroporated with pCaggs-Sox2-UTR-10AA-H2B-RFP shows downregulation on Sox2 MO electroporated side but not control MO side. (D’) Embryo co-electroporated with pCaggs-Sox3-UTR-10AA-H2B-RFP shows same expression level on Sox2 MO and control MO side. (E, E’, F, F’, G, G’) Dorsal view of embryos electroporated with Pax7 MO, left side, and control MO (contr MO), right side. (E’, F’) Embryos co-electroporated with (E’) pCaggs-Pax7-UTR-10AA-H2B-RFP or (F’) pCaggs-Pax7-UTR+C-10AA-H2B-RFP show downregulation on Pax7 MO electroporated side but not control MO side. (G’) Embryo co-electroporated with pCaggs-Pax3-UTR-10AA-H2B-RFP shows same expression level on Pax7 MO and control MO side. Scale bar = 20 µm. (H, I) Quantification (staggered column plots) of MO-validation experiments with the four categories strongly decreased (dark grey), mildly decreased (light grey), unchanged (light blue) or increased (dark blue) expression of UTR-H2BRFP construct on targeted MO electroporated side. (H) Left column: Sox2 MO + pCaggs-Sox2-UTR-10AA-H2B-RFP electroporated embryos (Sox2MO Sox2UTR; n = 26 embryos) versus right column: Sox2 MO + pCaggs-Sox3-UTR-10AA-H2B-RFP electroporated embryos (Sox2MO Sox3UTR; n = 27 embryos). (I) Left column: Pax7 MO + pCaggs-Pax7-UTR-10AA-H2B-RFP electroporated embryos (Pax7MO Pax7UTR; n = 24 embryos) and middle column: Pax7 MO + pCaggs-Pax7-UTR-10AA-H2B-RFP electroporated embryos (Pax7MO Pax7UTR+C; n = 38 embryos) versus right column: Pax7 MO + pCaggs-Pax3-UTR-10AA-H2B-RFP electroporated embryos (Pax7MO Pax3UTR; n = 22 embryos).
Figure 7

Functional analysis of modulating Pax7 levels.
HH4 embryos were electroporated with (A) control vector pCI-H2B-RFP or (B) pCI-Pax7-H2B-RFP on right side of embryo, then immunostained for Pax7 (magenta) and Sox2 (blue) at HH8 and transverely sectioned. Circles in dorsal neural fold indicate area of measurement for C and D. (C) Quantification of Pax7 and (D) Sox2 protein expression in dorsal neural fold after pCI-H2B-RFP or pCI-Pax7-H2B-RFP overexpression. Pax7 is increased by 115.4 ± 99.3%. Sox2 is reduced by 11.7 ± 11.2% when comparing experimental to control side. Sox2 expression in embryos with Pax7-H2B-RFP treatment on right side versus embryos with H2B-RFP treatment on right side was reduced but not to a level of statistical significance. See also Figure 7—source data 1. (E) Transversal sections of embryos electroporated with H2B-RFP on left side and Pax7-H2B-RFP on right side for single cell analysis. Quantification of (F) Pax7 and (G) Sox2 expression in single cells with very high levels of RFP expression on H2B-RFP treated side to Pax7-H2B-RFP treated side. See also Figure 7—source data 2. (H) Transversal sections of embryo electroporated with 0.5 mM Fitc-labeled Pax7 MO on right side and control MO on left side at HH4. Immunostaining for Pax7 (magenta) and Sox2 (blue). Circles in dorsal neural fold indicate area of measurement for (I). (I) Quantification of Pax7 and Sox2 protein expression in dorsal neural fold upon Pax7 knockdown. Pax7 is reduced by 16.6 ± 11.8% when comparing control to experimental side. This causes an increase of Sox2 expression by 28.6 ± 24.1%. See also Figure 7—source data 3. (J) Pax7 knock down with 0.5 mM Fitc-labeled Pax7 MO on left side or 0.5 mM Fitc-labeled control MO on right side of HH4 embryo with (G) subsequent ISH for Sox10 mRNA at HH9. Scale bar = 100 µm. (L) Quantification of decreased (dark grey), unchanged (medium grey) or increased (light grey) Sox10 mRNA expression level upon Pax7 knockdown versus control side of same embryo. See also Figure 7—source data 4. Asterisks indicate significance as calculated using a Student’s t-test. p-values are indicated in graphs. Error bars signify standard deviation.
-
Figure 7—source data 1
Quantification/Analysis of Pax7 overexpression experiments.
- https://doi.org/10.7554/eLife.21620.026
-
Figure 7—source data 2
Quantification/Analysis of Pax7 overexpression experiments in single cells.
- https://doi.org/10.7554/eLife.21620.027
-
Figure 7—source data 3
Quantification/Analysis of Pax7 knock down experiments.
- https://doi.org/10.7554/eLife.21620.028
-
Figure 7—source data 4
Quantification of Sox10 and FoxD3 mRNA expression upon Pax7 knock down.
- https://doi.org/10.7554/eLife.21620.029
Figure 8

Model of fate decisions in the dorsal neural folds.
We propose that, within the neural folds, mutual repression can lead to a bistable switch with three possible solutions: an unstable state occurs when the concentration of two cross-repressing factors is similar. At a certain concentration, two different stable states are achieved. When Sox2 expression reaches a certain threshold, it causes reduction of Pax7 and induction of neural fate. When Pax7 concentration increases to a certain level, it causes reduction of Sox2 and induction of neural crest fate.
Videos
Video 1
Using the Sox2-reporter to follow the fate of cells in neural plate border.
4.6 µg/µl Sox2-N1N2-H2B-mEOS3.2 (green fluorescent) was electroporated in HH4- embryos. Maximum projection of 21 z-stacks (24 µm sections, 16 µm interval). 74 timepoints with 15 min time interval (total 18.5 hr). 2 × 3 tiles with 10% overlap. Video runs form stage HH8- to HH11. GFP positive neural crest cells stream away from the neural tube during the last third of the video.
Download links
A two-part list of links to download the article, or parts of the article, in various formats.
Downloads (link to download the article as PDF)
Open citations (links to open the citations from this article in various online reference manager services)
Cite this article (links to download the citations from this article in formats compatible with various reference manager tools)
Dynamic transcriptional signature and cell fate analysis reveals plasticity of individual neural plate border cells
eLife 6:e21620.
https://doi.org/10.7554/eLife.21620


