Binocular matching of thalamocortical and intracortical circuits in the mouse visual cortex
- Northwestern University, United States
Figures
Figure 1
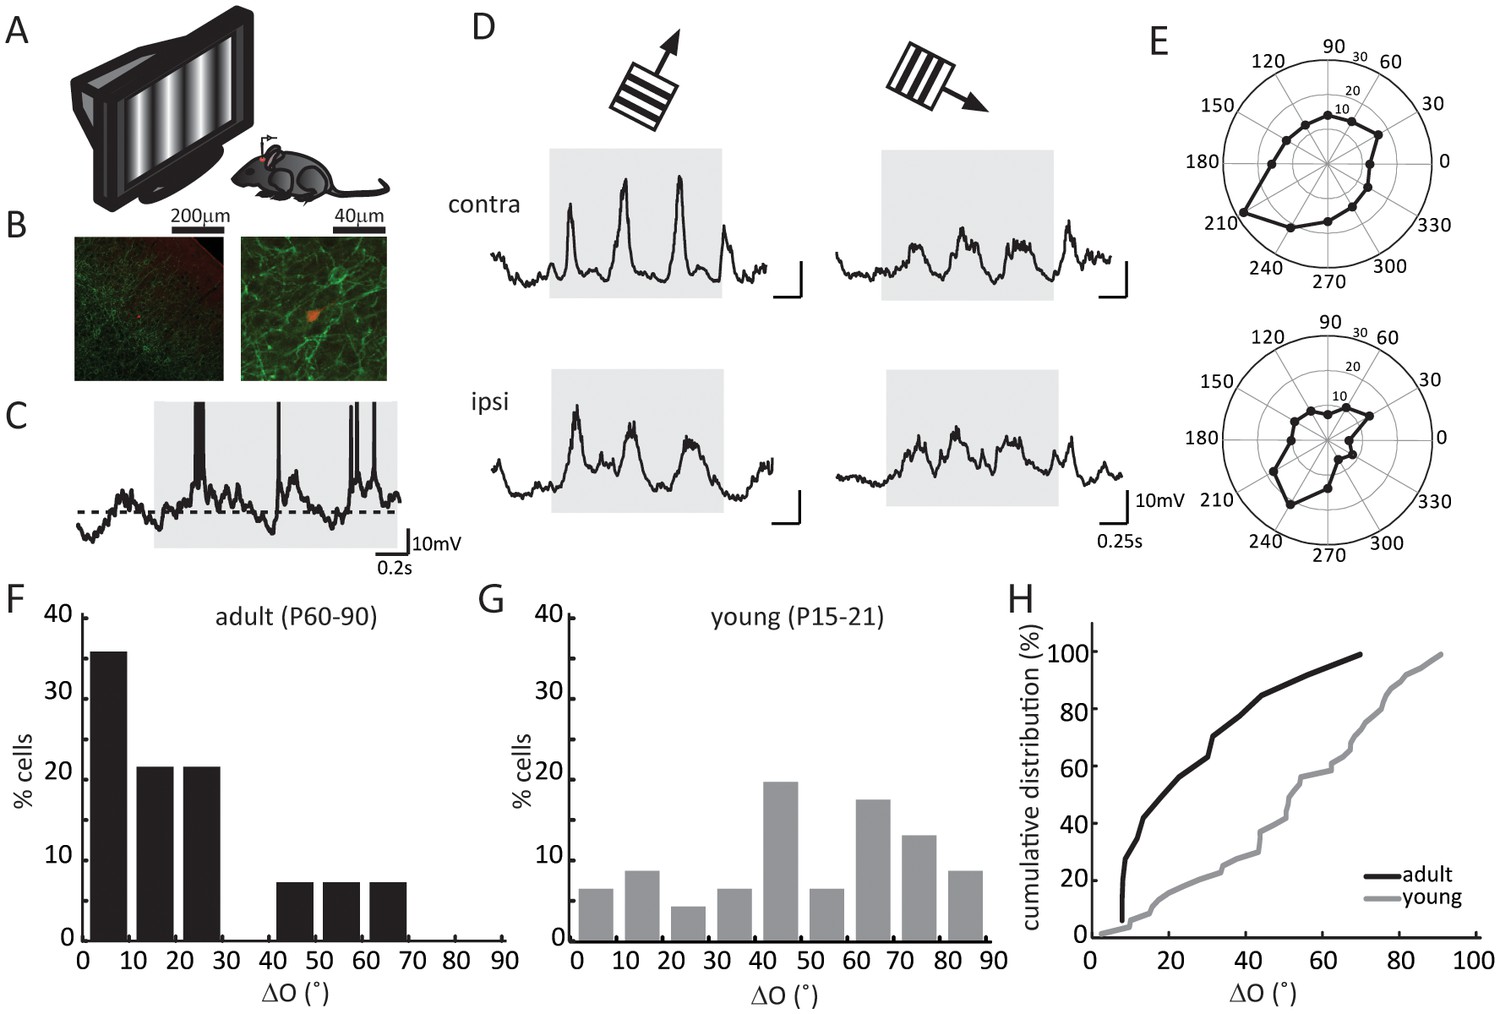
Binocular matching of subthreshold membrane potential responses in layer 4 neurons.
(A) A schematic of the experimental setup. (B) Histology of a recorded neuron. Red is the neuron stained with Streptavidin-Alex Fluor 547; green is ChR2 conjugated with YFP. Left, low magnification showing the neuron’s depth. Cortical surface is to the top right of the image. Right, high magnification showing the neuron’s morphology. (C) An example of membrane potential (Vm) trace in response to drifting gratings. The gray shadow indicates the period of visual stimulation (same below in all figures). The dashed line is − 60 mV. Action potential traces are truncated at − 10 mV. (D) Subthreshold Vm traces in response to the preferred (left) and orthogonal (right) directions. Top, stimulating contralateral eye only (‘contra’, same below); bottom, stimulating ipsilateral eye only (‘ipsi’). (E) Polar plots of Vm tuning curves. (F–G) Distribution of the inter-ocular difference of Vm’s preferred orientations (ΔO) in adult (F) and young (G) mice. (H) Cumulative distribution of ΔO between adult (black, n = 14) and young (gray, n = 25) mice (p = 0.003, K-S test).
Figure 2 with 2 supplements
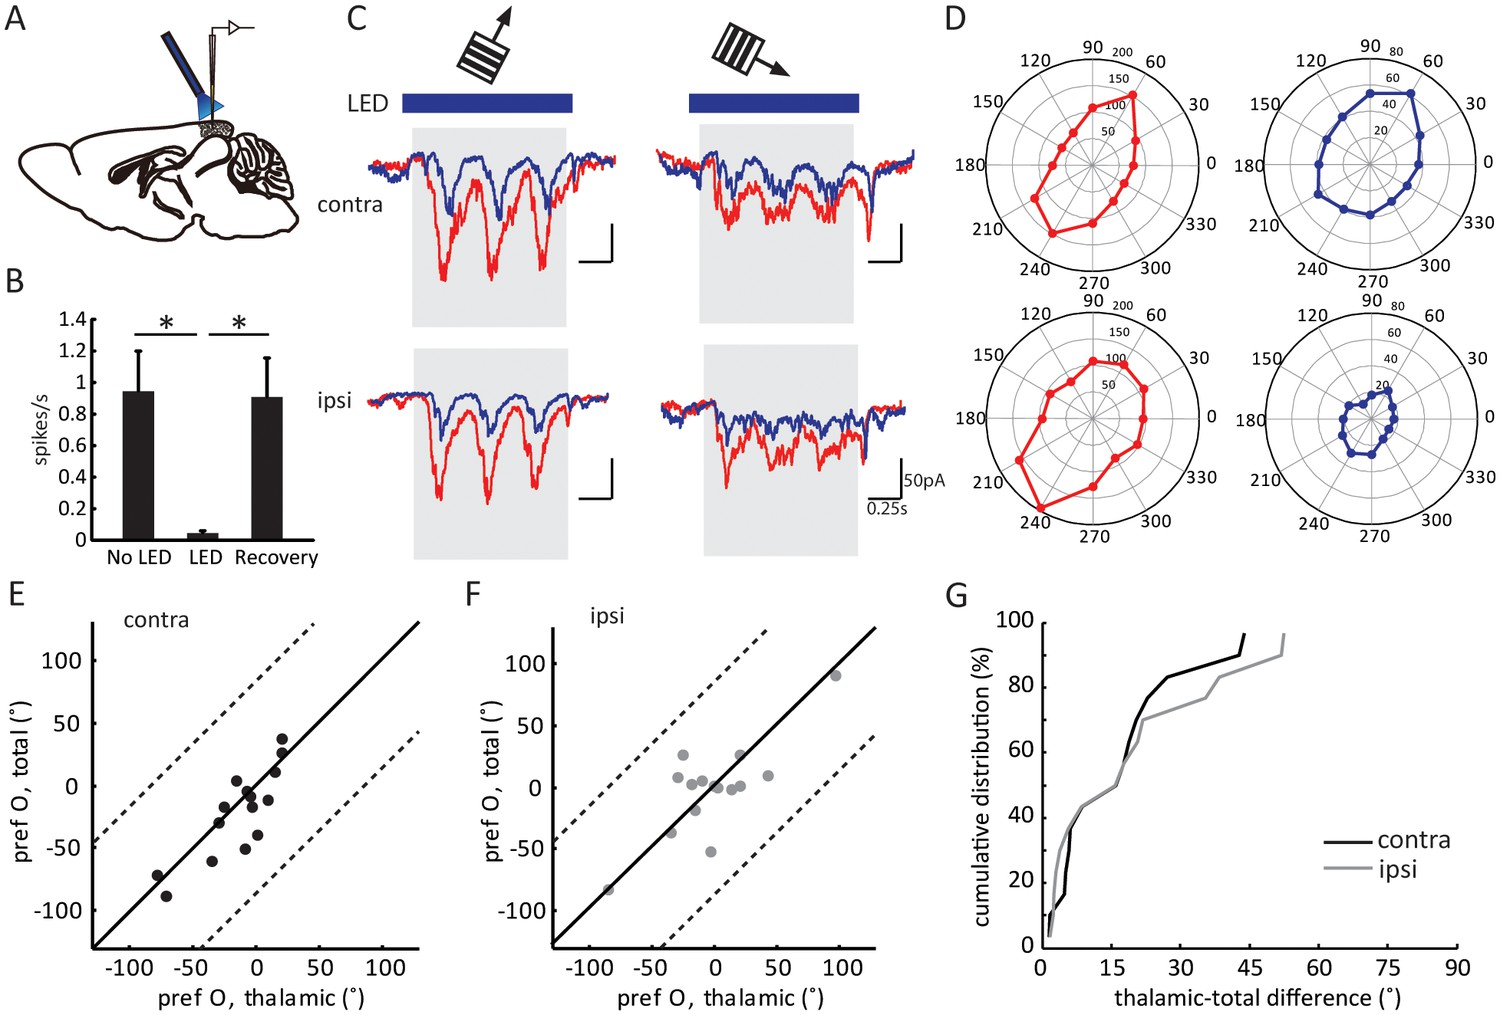
Optogenetic isolation of thalamic inputs to layer 4 neurons in binocular V1.
(A) A schematic of optogenetic photostimulation and recording in V1. (B) Summary plot of average spike rate of deep-layer neurons before, during and after LED activation. The spike rate was calculated by averaging responses across all 12 directions of gratings, and then averaged for all the neurons (p = 0.0007, paired t-test between No LED and LED; and p = 0.0003, paired t-test between LED and recovery, n = 8). (C) Average EPSC traces in response to the preferred (left) and orthogonal (right) orientations of an example neuron. Top, stimulating contralateral eye; bottom, ipsilateral eye. Shadows indicate visual stimulation, blue bars indicate LED on. Red traces are responses without LED (‘total EPSCs’) and blue traces are responses with LED (‘thalamic EPSCs’). (D) EPSC tuning curves for contralateral (top) and ipsilateral eye. Left, total EPSCs; right, thalamic EPSCs. (E–F) Correlation of orientation preference (‘pref O’, same below in similar figures) between thalamic and total EPSCs in adult mice. The dotted lines bound the region in which the data points can lie, i.e., 90° largest possible difference (same below in similar plots). (E) contralateral, (F) ipsilateral. (G) Cumulative distribution of orientation difference between thalamic and total EPSCs. No significant difference between contralateral (black) and ipsilateral (gray) responses (p = 0.89, K-S test, n = 15).
Figure 2—figure supplement 1
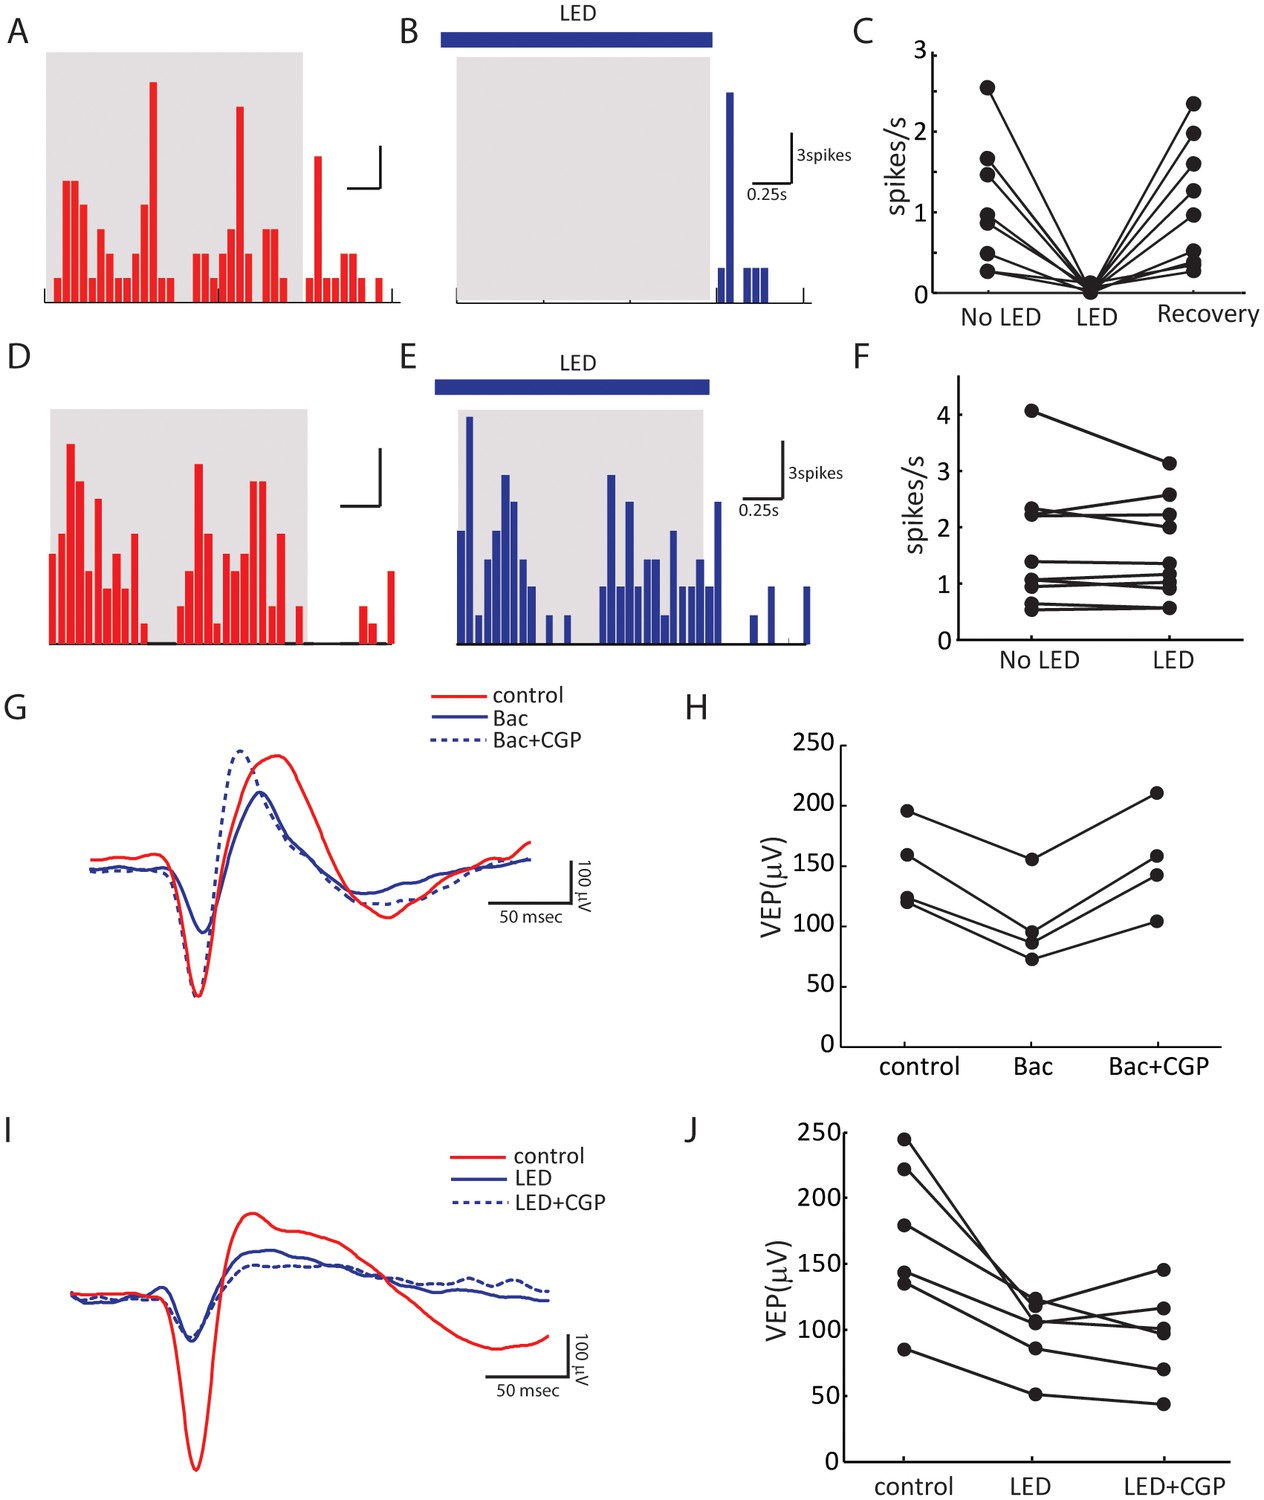
Control experiments to validate optogenetic silencing of visual cortex.
(A–C) Extracellular recording showing complete optogenetic silencing of the visual cortex. Shown are a deep-layer neuron’s peri-stimulus timing histogram (PSTH) of spiking response to grating at the preferred direction in the absence (A) or presence (B) of LED illumination. Blue bar indicates LED illumination, and the gray shadow indicates period of visual stimulation. (C) Summary plot of spike rate before, during and after LED activation (same data as Figure 2B ). Note that the spike rate was calculated by averaging across all 12 directions of the drifting gratings, many of which did not evoke responses due to the neurons’ selectivity. LED activation was able to silence all the recorded neurons at all directions (p = 0.0007, paired t-test between No LED and LED; and p = 0.0003, paired t-test between LED and recovery, n = 8). Extracellular recording showing layer 4 neurons do not receive callosal inputs. Shown are a layer 4 neuron’s PSTHs to grating at the preferred direction in the absence (D) or presence (E) of LED illumination of the visual cortex in other hemisphere. (F) Summary plot of spike rate before and during LED activation. No change of visually evoked spiking response was seen (p = 0.37, paired t-test, n = 9). (G–J) Field potential recording showing optogenetic silencing of the visual cortex does not affect thalamocortical transmission by activating GABAB receptors. (G) Example traces of visually evoked potential (VEP) in control (red), with GABAB receptor agonist Baclofen (10 μM, Tocris, solid blue), and with Baclofen + CGP54626, a GABAB receptor antagonist (10 μM, Tocris, dashed blue). (H) Summary plots of VEP amplitudes. The decrease of VEP amplitude by Baclofen was reversed by CGP (p = 0.002, paired t-test, n = 4). (I) Example traces of VEP in control (red), with LED illumination (solid blue), and with LED and 15 – 45 min after (dashed blue) CGP54626 application. (J) Summary plots of VEP amplitudes. No difference is seen between LED and LED+CGP conditions (p = 0.73, paired t-test, n = 6).
Figure 2—figure supplement 2
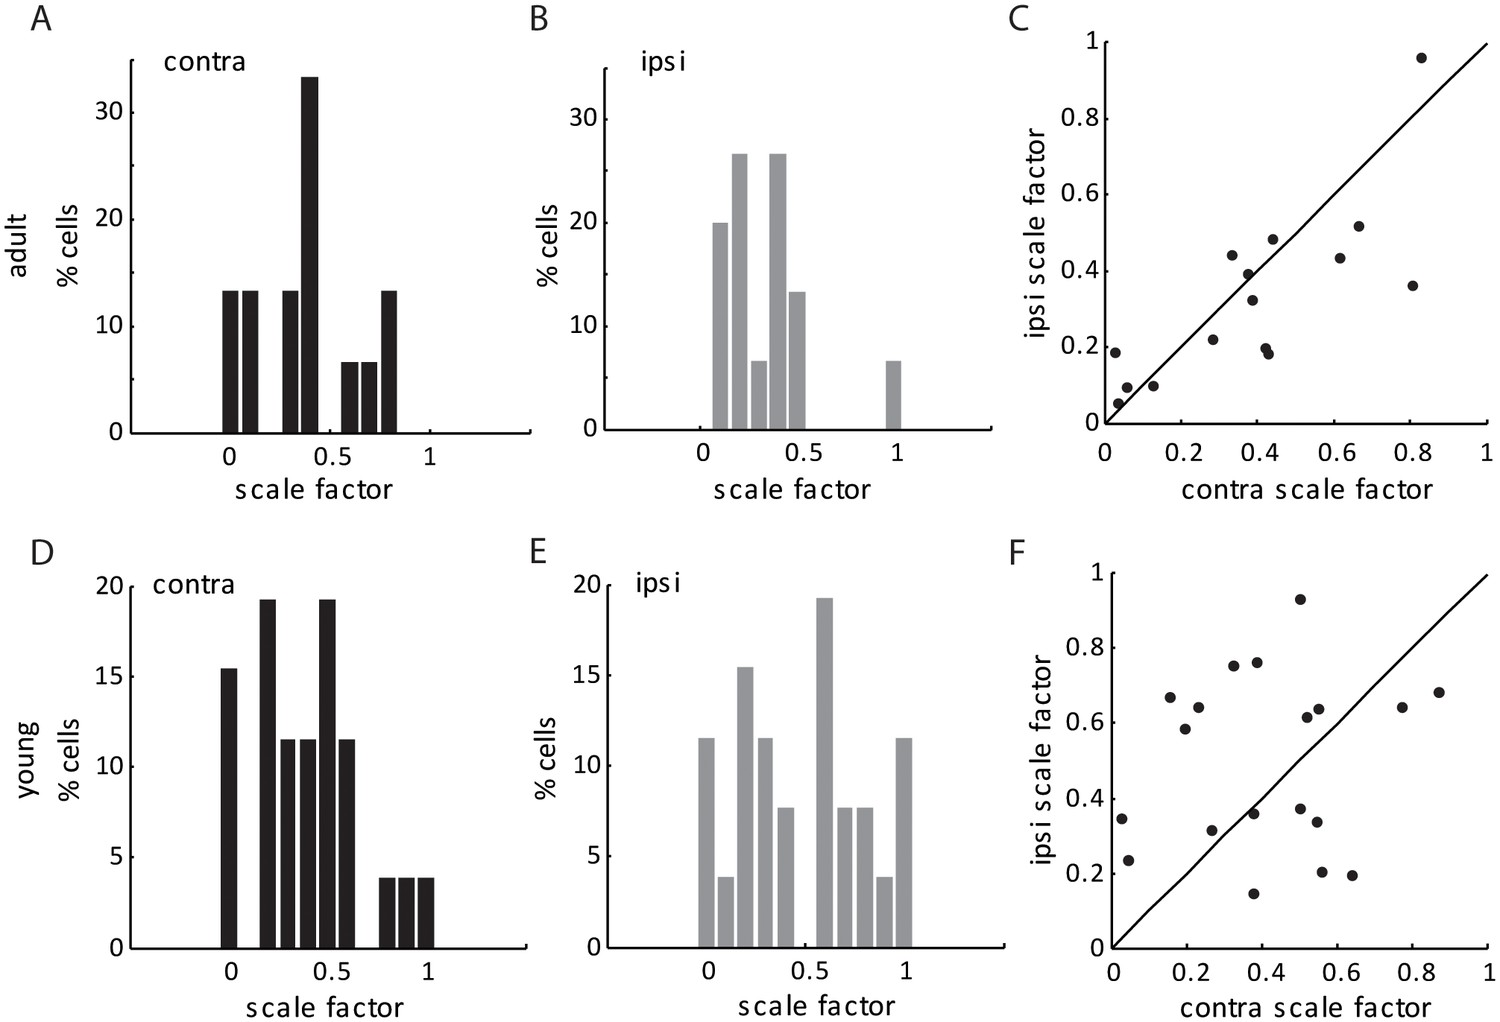
Scale factors for thalamo-cortical transformation in adult and young mice.
(A–B) Scale factor for thalamo-cortical transformation from contralateral (A) and ipsilateral (B) inputs in adult mice. (C) Correlation of contralateral and ipsilateral scale factor in adult mice. (D–F) Same plots as (A–C), but in young mice between P15-21. Note that the scale factor was slightly higher (0.43 ± 0.05 for contralateral pathway and 0.52 ± 0.08 for ipsilateral, compared to 0.32 ± 0.05 and 0.32 ± 0.07, respectively), and less matched binocularly in the young mice, reflecting the immaturity of thalamocortical transformation at this age.
Figure 3 with 2 supplements
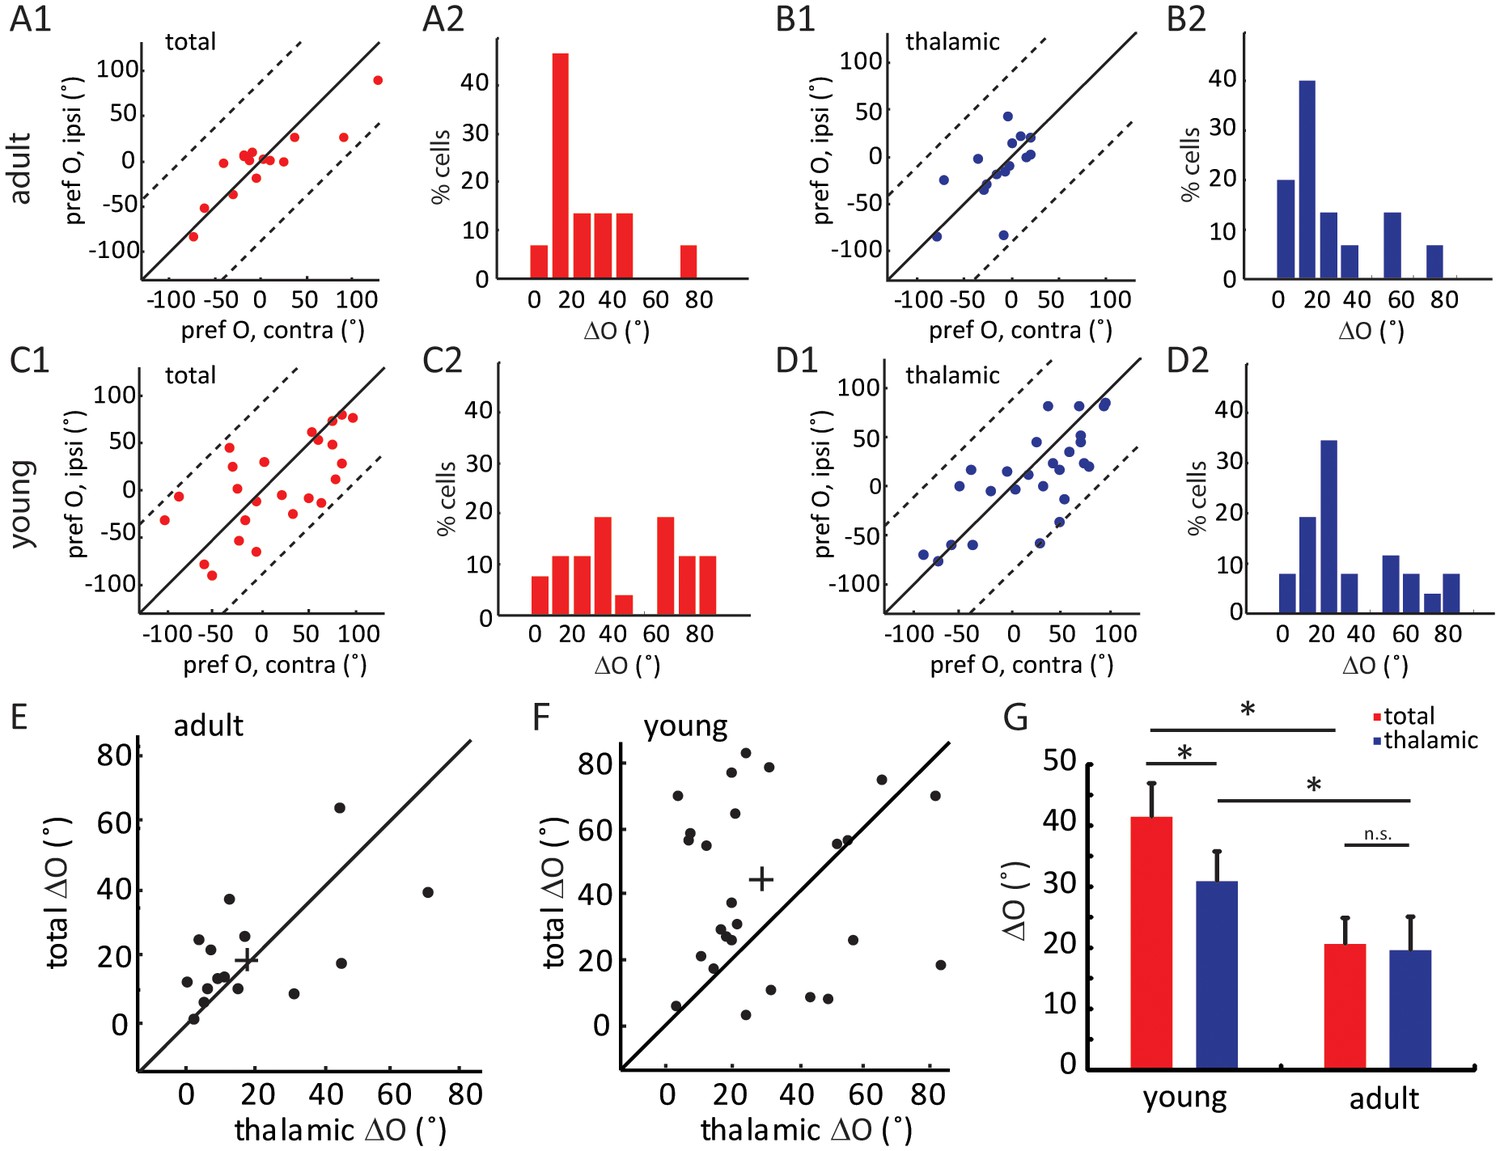
Binocular matching of thalamic input precedes that of intracortical input.
(A–B) Binocular matching of total (A1 and A2, red) and thalamic (B1 and B2, blue) EPSCs in adult mice. (A1) and (B1) show correlations of the preferred orientation between the two eyes. (A2) and (B2) are the distributions of the inter-ocular difference (ΔO). (C–D) Same plots as (A–B), but in young mice between P15-P21. (E–F) Correlation of ‘thalamic ΔO’ and ‘total ΔO’ of individual cells in adult (E) and young mice (F). Cross indicates means of the data for the two axes. (G) Mean ΔO of the total (red) and thalamic (blue) EPSCs from young and adult mice. Significant differences are seen between the two age groups and between the total and thalamic ΔO in the young mice. p = 0.038, paired t-test between total and thalamic ΔO in young mice, n = 26; p = 0.83, paired t-test between total and thalamic ΔO in adult mice, n = 15; and p = 0.023, K-S test between young and adult mice for total ΔO; p = 0.037, K-S test between young and adult mice for thalamic ΔO. Error bars are S.E.M.
Figure 3—figure supplement 1
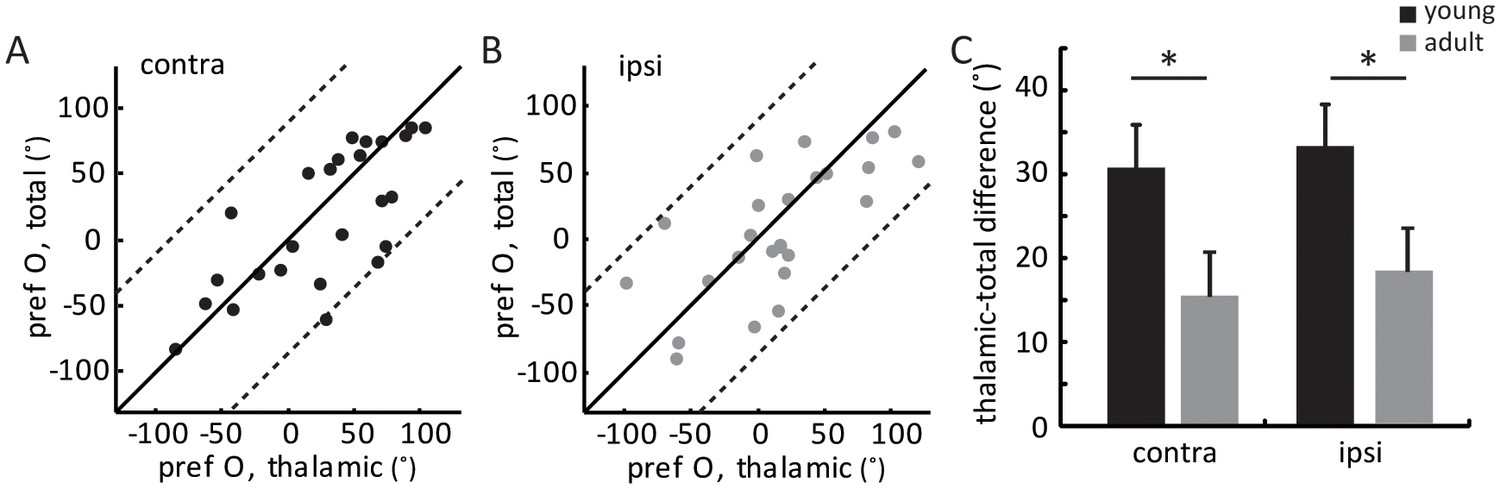
Orientation difference between thalamic and total EPSCs in young mice.
(A–B) Correlation of orientation preference between thalamic and total EPSCs in young mice. (A) for contralateral and (B) for ipsilateral eye response. (C) Mean orientation difference between thalamic and total EPSCs from each eye in young and adult mice. The mean ‘thalamic-total difference’ in young mice is 30.8 ± 5.1° for contralateral pathway and 33.4 ± 5.0° for ipsilateral; compared to 15.2 ± 3.4° and 17.7 ± 4.5° in adults. Significant differences are seen between young (black, n = 26) and adult (gray, n = 15) mice for both eyes. p = 0.04, K-S test between young and adult for contralateral eye; p = 0.043, K-S test between young and adult for ipsilateral eye. Error bars are S.E.M.
Figure 3—figure supplement 2
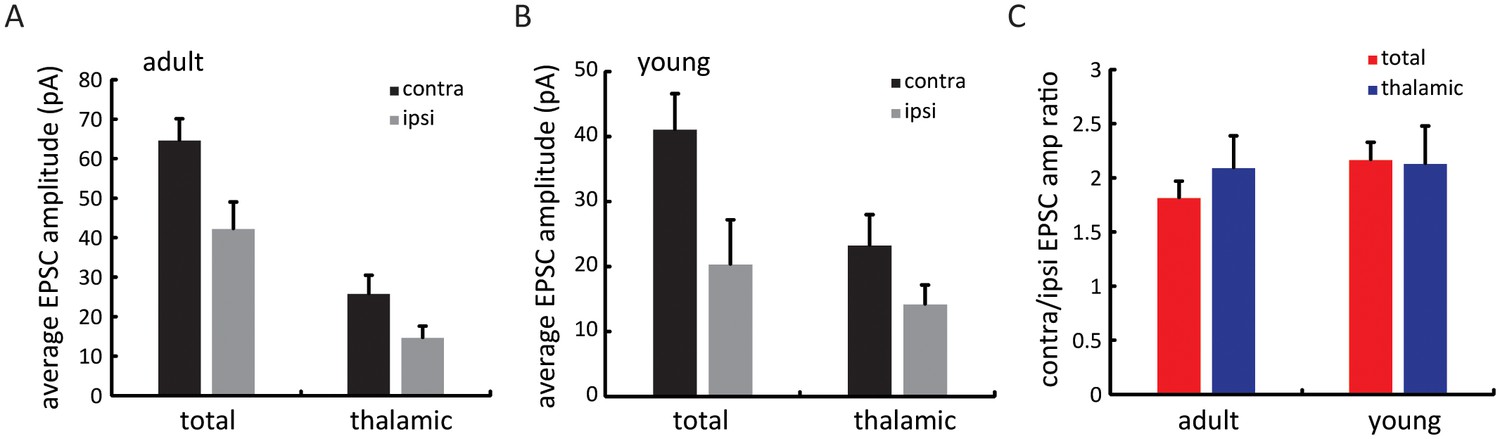
Relative amplitude of thalamic and total EPSCs between the two eyes over development.
(A) Mean EPSC amplitude for total and thalamic input through contralateral (black) or ipsilateral eye (grey) in adult mice. (B) Same plot as (A), in young mice between P15 and P21. (C) Contralateral/ipsilateral EPSC ratio for total (red) and thalamic (blue) inputs in adult and young mice. Note that all values were close to 2.0, indicating no gross changes in the ocular dominance of total and thalamic EPSCs during development.
Figure 4 with 1 supplement
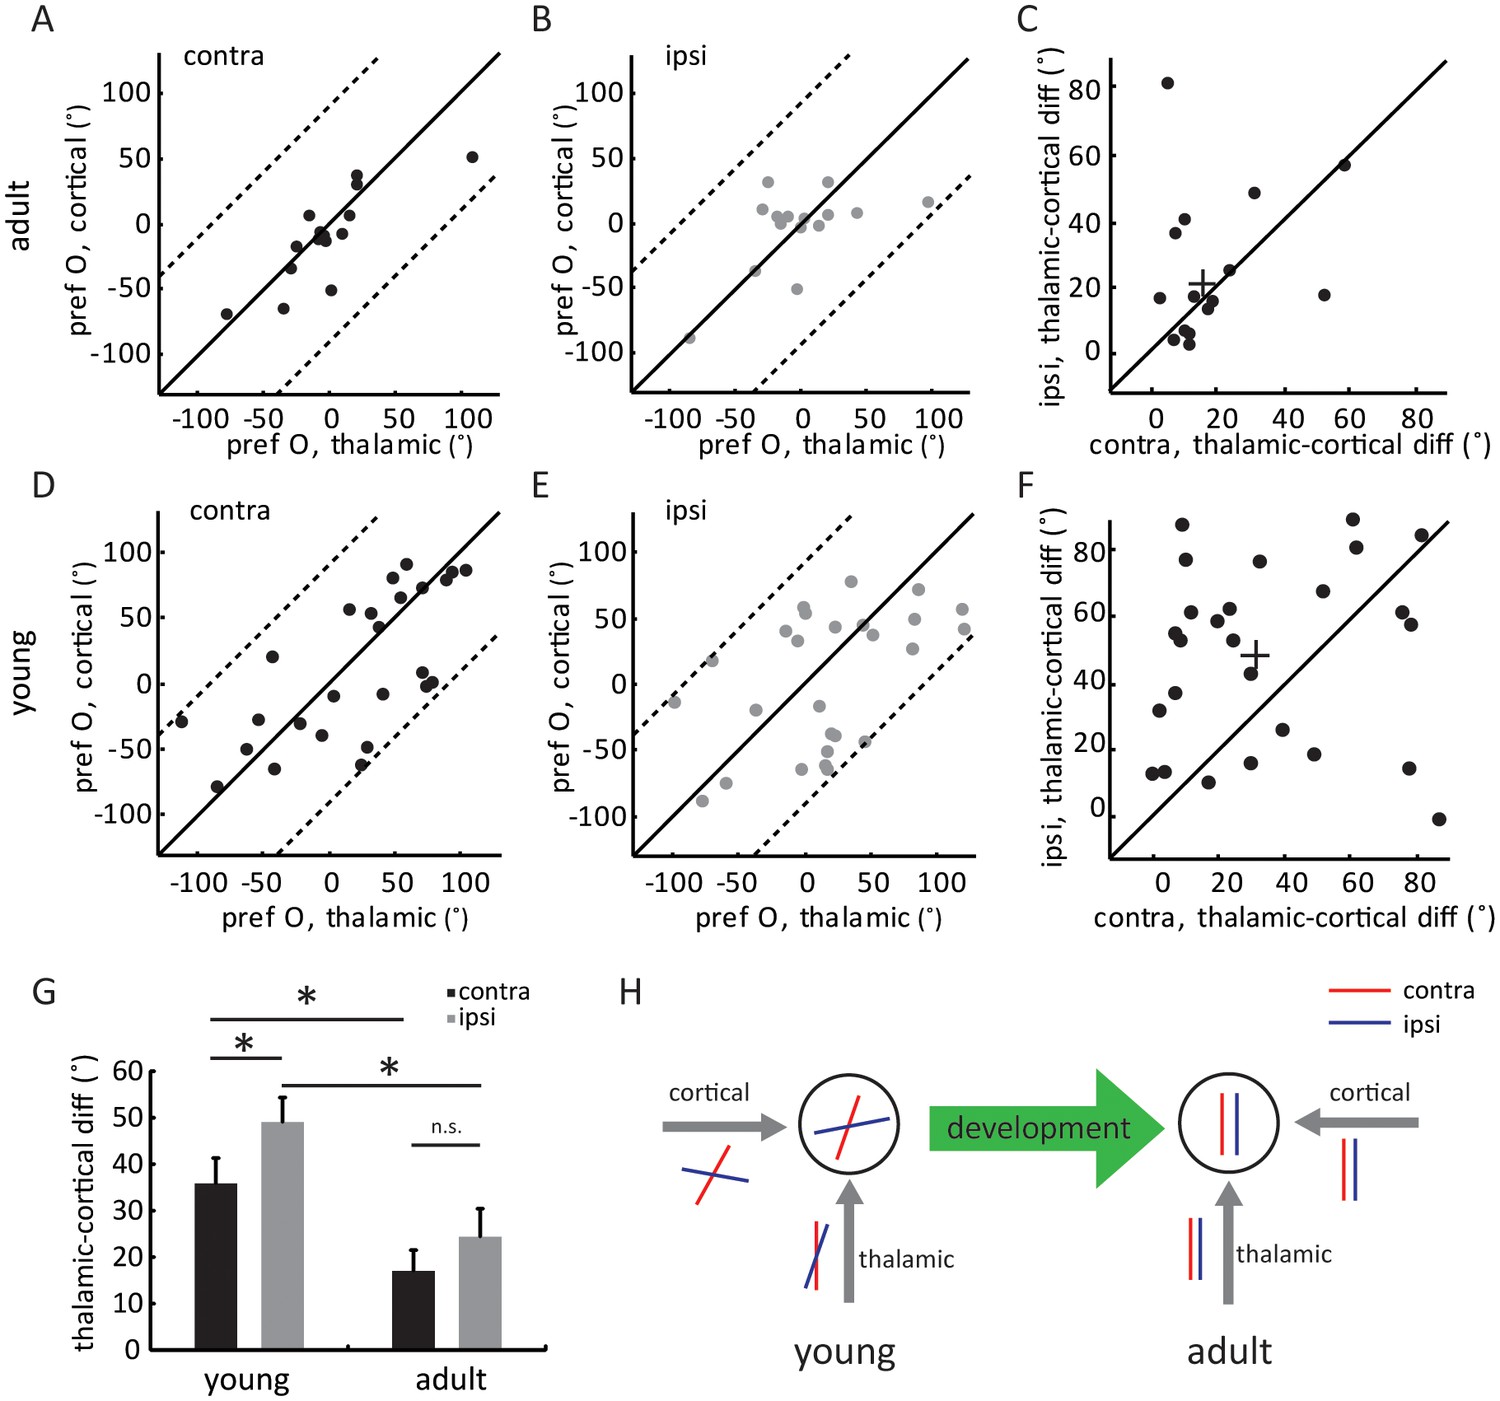
Development of eye-specific thalamocortical transformation.
(A–B) Correlation of orientation preference between thalamic and cortical EPSCs in adult mice. (A) for contralateral and (B) for ipsilateral pathway. (C) Scatter plots of thalamic-cortical difference in orientation preference for the two eyes in adult mice. The cross indicates the mean of the distribution along the two axes. (D–F) Same plots as (A–C), but in young mice between P15 and P21. (G) Mean thalamic-cortical difference in orientation preference from each eye in young and adult mice. Significant differences are seen between the two age groups and between the contralateral (black) and ipsilateral (gray) eyes in the young mice. p = 0.041, paired t-test between the eyes in young mice, n = 26; p = 0.29, paired t-test between the eyes in adult mice, n = 15; and p = 0.043, K-S test between young and adult for contralateral eye; p = 0.016, K-S test between young and adult for ipsilateral eye. Error bars are S.E.M. (H) A summary schematic of thalamic and cortical binocular matching and thalamo-cortical transformation over development. In mice before the critical period (left), the orientation tuning of the two eyes’ thalamic inputs to layer 4 neurons are already slightly matched (represented by the red and blue oriented bars). The slight matching is not manifested in the cell’s tuning due to mismatched intracortical inputs. Further improvement of thalamic matching and rewiring of the intracortical circuits to follow the thalamic tuning give rise to binocularly matched tuning in adult mice (right).
Figure 4—figure supplement 1
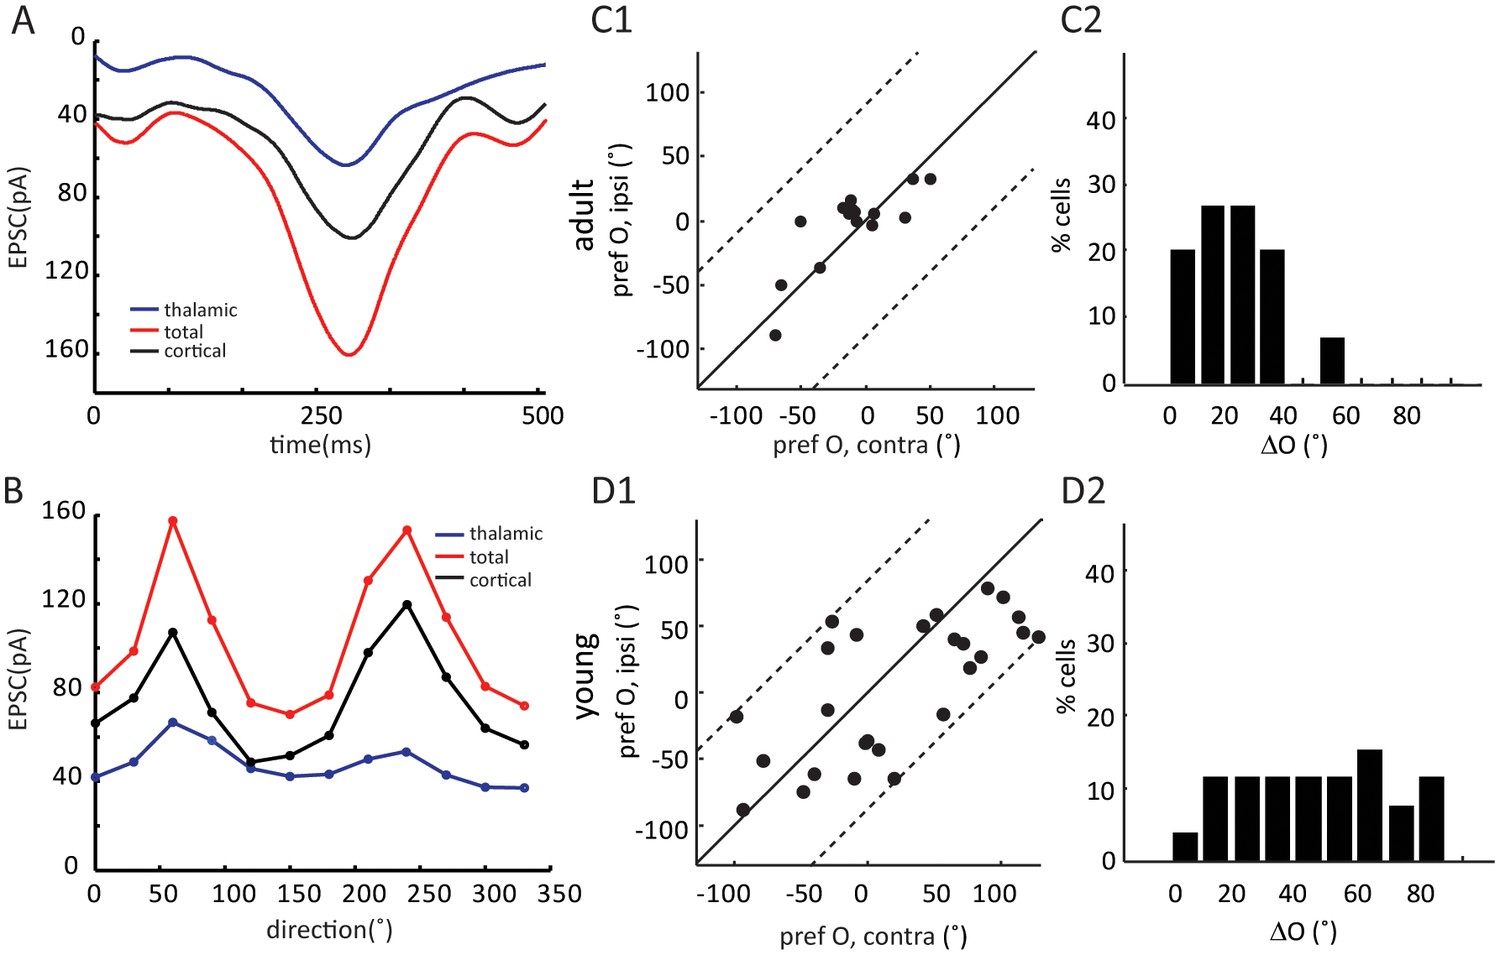
Binocular matching of intracortical EPSCs in layer 4 neurons.
(A–B) Example of cortical EPSC traces and tuning curves. (A) Example traces of cycle-averaged thalamic (blue) and total (red) EPSCs and their point-by-point subtraction (cortical). (B) This cell’s tuning curves for thalamic (blue), total (red) and cortical (black) EPSCs. (C–D) Binocular matching of cortical EPSCs in adult (C) and young (D) mice. (C1) and (D1) Correlations of the preferred orientation between the two eyes. (C2) and (D2) The distributions of intracortical ΔO, with mean of 17.2 ± 3.2° in adult (n = 15), and 44.9 ± 5.1° in young (n = 26) mice (p = 0.0005, K-S test).
Download links
A two-part list of links to download the article, or parts of the article, in various formats.
Downloads (link to download the article as PDF)
Open citations (links to open the citations from this article in various online reference manager services)
Cite this article (links to download the citations from this article in formats compatible with various reference manager tools)
Binocular matching of thalamocortical and intracortical circuits in the mouse visual cortex
eLife 5:e22032.
https://doi.org/10.7554/eLife.22032


