Catecholaminergic challenge uncovers distinct Pavlovian and instrumental mechanisms of motivated (in)action
- Radboud University, The Netherlands
- University of Birmingham, United Kingdom
- Radboud University Medical Center, The Netherlands
- Linguistic and Psychological Sciences, Brown University, United States
- Brown University, United States
Figures
Figure 1
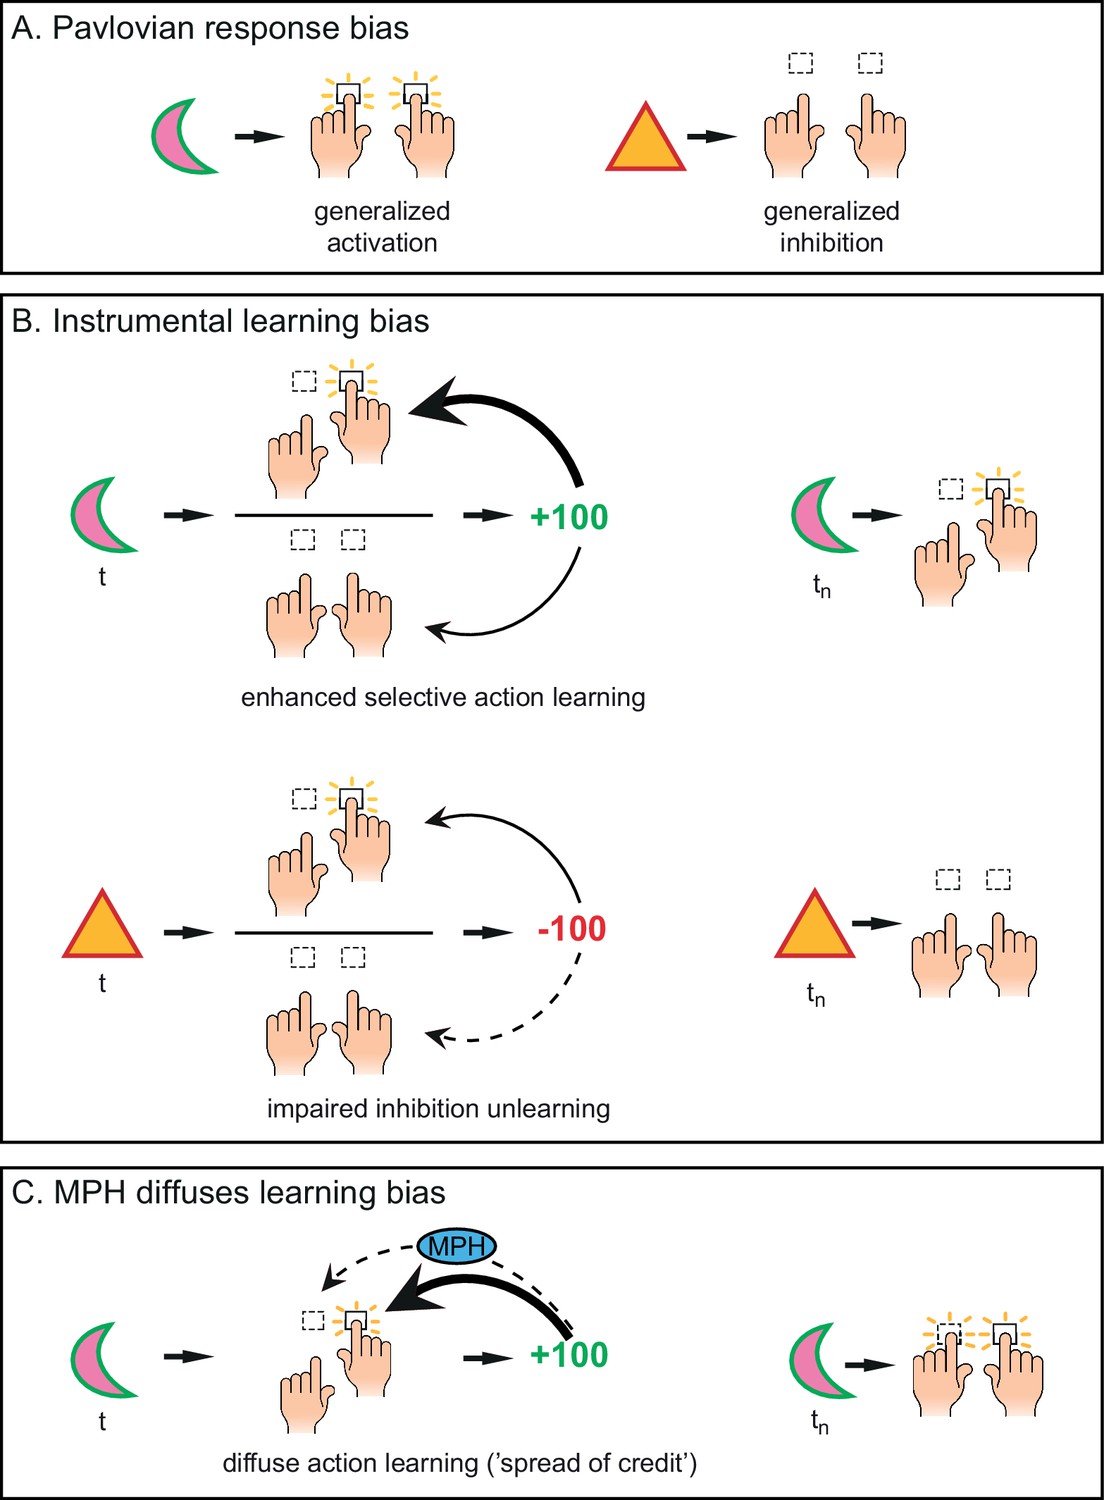
Distinct mechanisms by which motivational valence may bias behavioural activation.
(A) Pavlovian response bias: appetitive cues (green edge) elicit generalized behavioural activation (‘Go’), whereas aversive cues (red edge) elicit behavioural inhibition (‘NoGo’). This Pavlovian response bias is introduced in model M3a as the parameter π (c.f. Figure 3). (B) Instrumental learning bias: rewarding outcomes (upper panel) facilitate learning of action (‘Go’, thick arrow) relative to inaction (‘NoGo’, thin arrow). Thus, learning effects at the individual trials t will result in a cumulative selective increase of the rewarded action on later trials tn. Punishment outcomes (lower panel) hamper the unlearning of inaction (‘NoGo’, dashed arrow) relative to action (‘Go’, solid arrow), resulting in sustained inaction. Neutral outcomes are equally well associated with actions and inactions, and are not illustrated here. The instrumental learning bias is introduced as the parameter κ in model M3b (c.f. Figure 3). We assess whether these two mechanisms (i) act in parallel, and (ii) are modulated by the catecholamine system. To test the latter, we administered methylphenidate (MPH), which prolongs the effects of catecholamine release via blockade of the catecholamine receptors. We first assess whether MPH affects the strength of the Pavlovian response bias, introduced as the parameter πMPH in model M5a, and instrumental learning bias, implemented as the parameter κMPH-selective in model M5b (c.f. Figure 5). (C) We hypothesise that prolonged effects of dopamine release following reward outcomes will reduce (temporal) specificity, leading to spread of credit: Credit is assigned to other recent actions (thin arrow), in addition to the performed (and rewarded) Go response (thick arrow), resulting in additional learning of the alternative (not-performed) Go response. This MPH-induced diffuse learning bias is implemented by the parameter κMPH-diffuse in model M5c (c.f. Figure 5).
Figure 2 with 1 supplement

Motivational Go/NoGo learning task and performance.
(A) On each trial, a Win or Avoid cue appears on screen. Subjects can respond during cue presentation. Response-dependent feedback follows. (B) In total eight cues are presented for which the correct response needs to be learned. (C) Each cue has only one correct response (Go-left, Go-right, or NoGo), which subjects can learn from the feedback. (D) Feedback is probabilistic. Correct responses are followed by reward (Win cues) or a neutral outcome (Avoid cues) in 80% of the time and by a neutral outcome (Win cues) or punishment (Avoid cues) otherwise. For incorrect responses, these probabilities are reversed. (E) Trial-by-trial proportion of Go responses (±SEM) for Go cues (solid lines) and NoGo cues (dashed lines), collapsed over Placebo and MPH. Left: All cue types. From the first trial onwards, subjects made more Go responses to Win vs. Avoid cues (i.e. green lines are above red lines), reflecting the motivational bias. Additionally, subjects clearly learn whether to make a Go response or not (proportion of Go responses increases for Go cues and decreases for NoGo cues). Right: Go cues only. For the Go cues, a Go response could be either correct or incorrect. The motivational bias is present in both correct and incorrect Go responses, but incorrect Go responses are unlearnt. Note that the total p(Go) in this plot sums up to the solid lines in the left plot. (F) Mean (±SED) proportion Go responses. Proportion Go responses is higher for Go vs. NoGo cues, indicative of task learning. Additionally, subjects made more correct and incorrect Go responses to Win vs. Avoid cues. Source data of task performance are available in Figure 2—source data 1.
-
Figure 2—source data 1
Source data for task performance under MPH and placebo.
This matlab datafile contains choice data (subject x drug (MPH/Placebo) x trial) for the Go-to-Win, Go-to-Avoid, NoGo-to-Win, and NoGo-to-Avoid cues. Go (NoGo) responses are coded as 1 (0) and choices are collapsed over the two cues of each category. Additionally, accuracy is provided for the Go cues, where correct (incorrect) responses are coded as 1 (0).
- https://doi.org/10.7554/eLife.22169.005
Figure 2—figure supplement 1
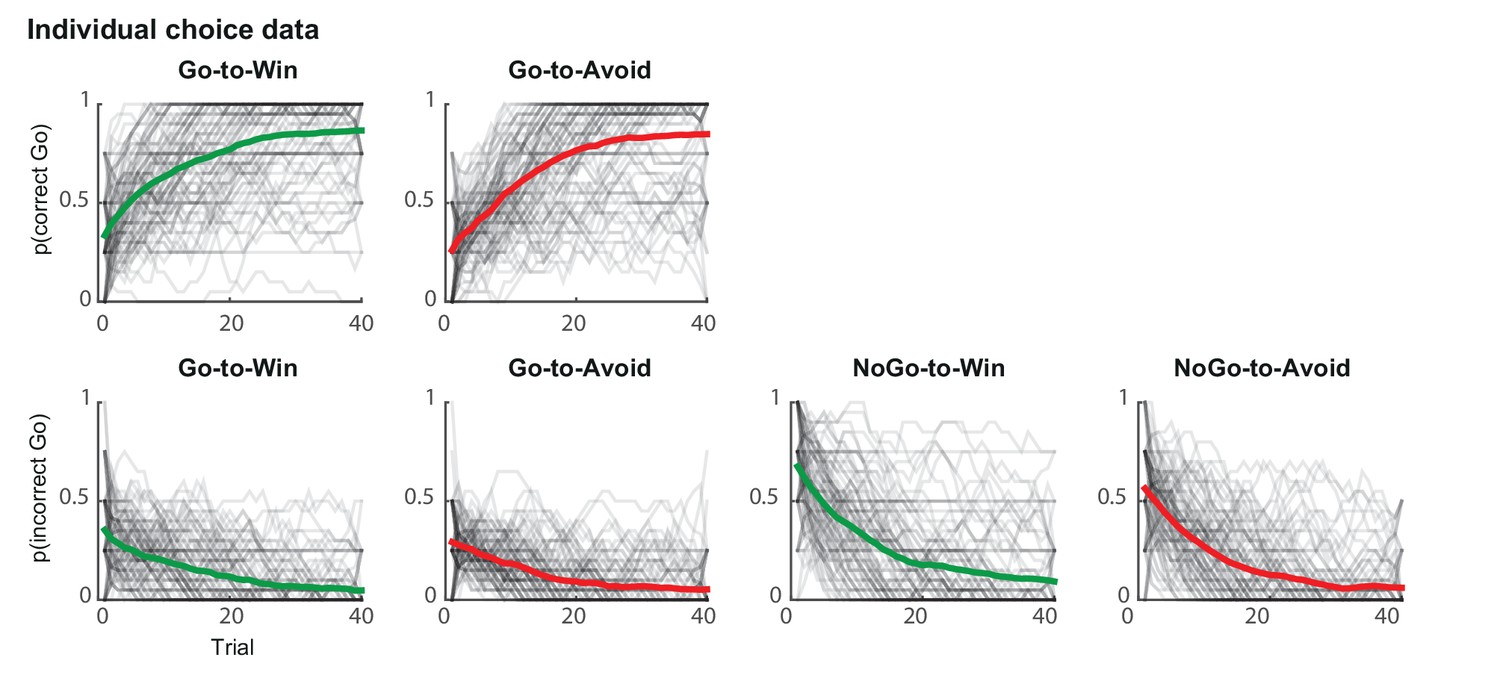
Individual traces (black lines) and group average (coloured lines) of correct and incorrect Go responses using a sliding average of 5 trials.
Traces are averaged within cue types and over sessions. Individual traces are semi-transparant, so that darker areas reflect more overlaying subjects. Across trials, subjects increased correct Go responses (top) and decreased incorrect Go responses (bottom). Subjects performed at ceiling level more rapidly for the Go-to-Win cues (top-left) than Go-to-Avoid cues (top-right).
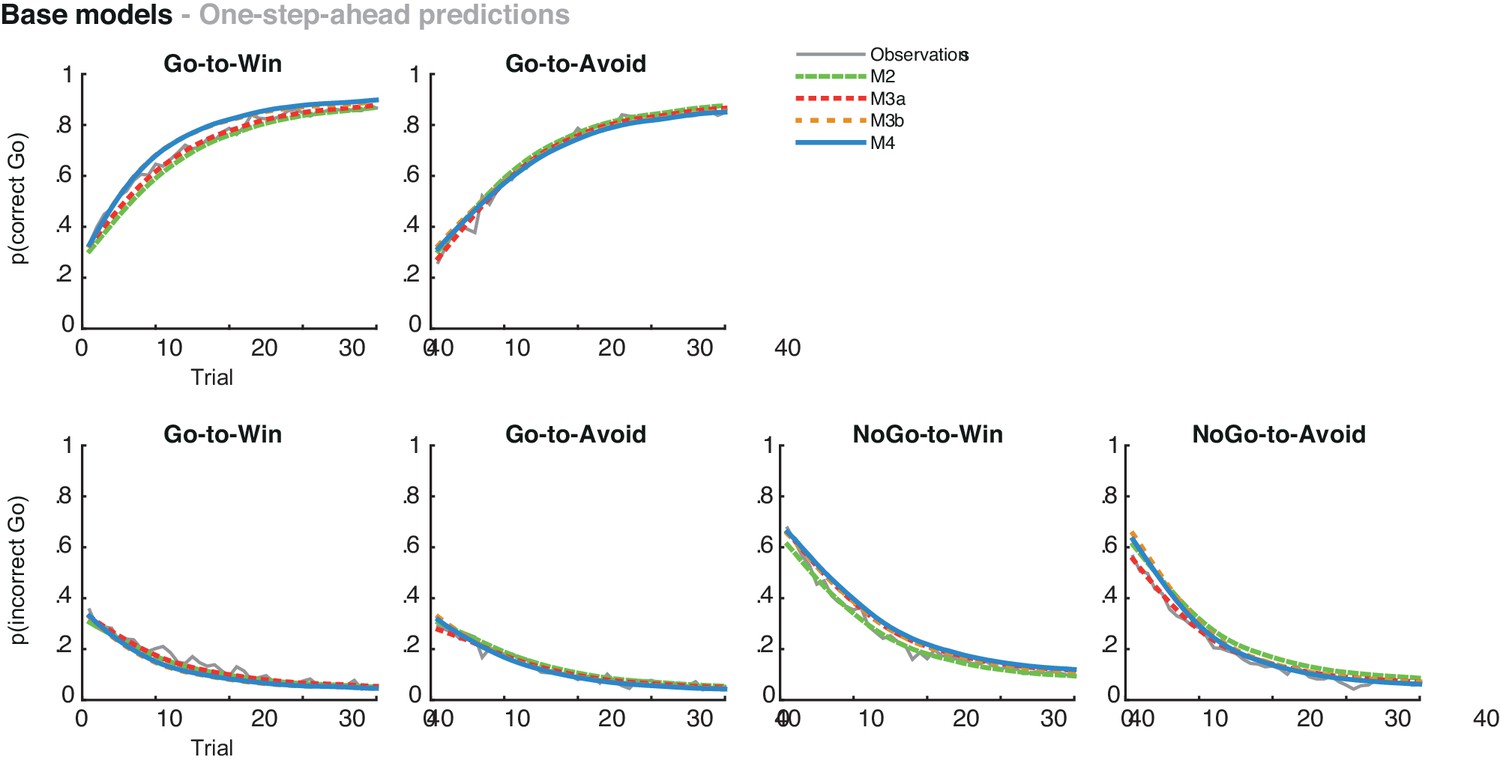
Figure 3 with 3 supplements
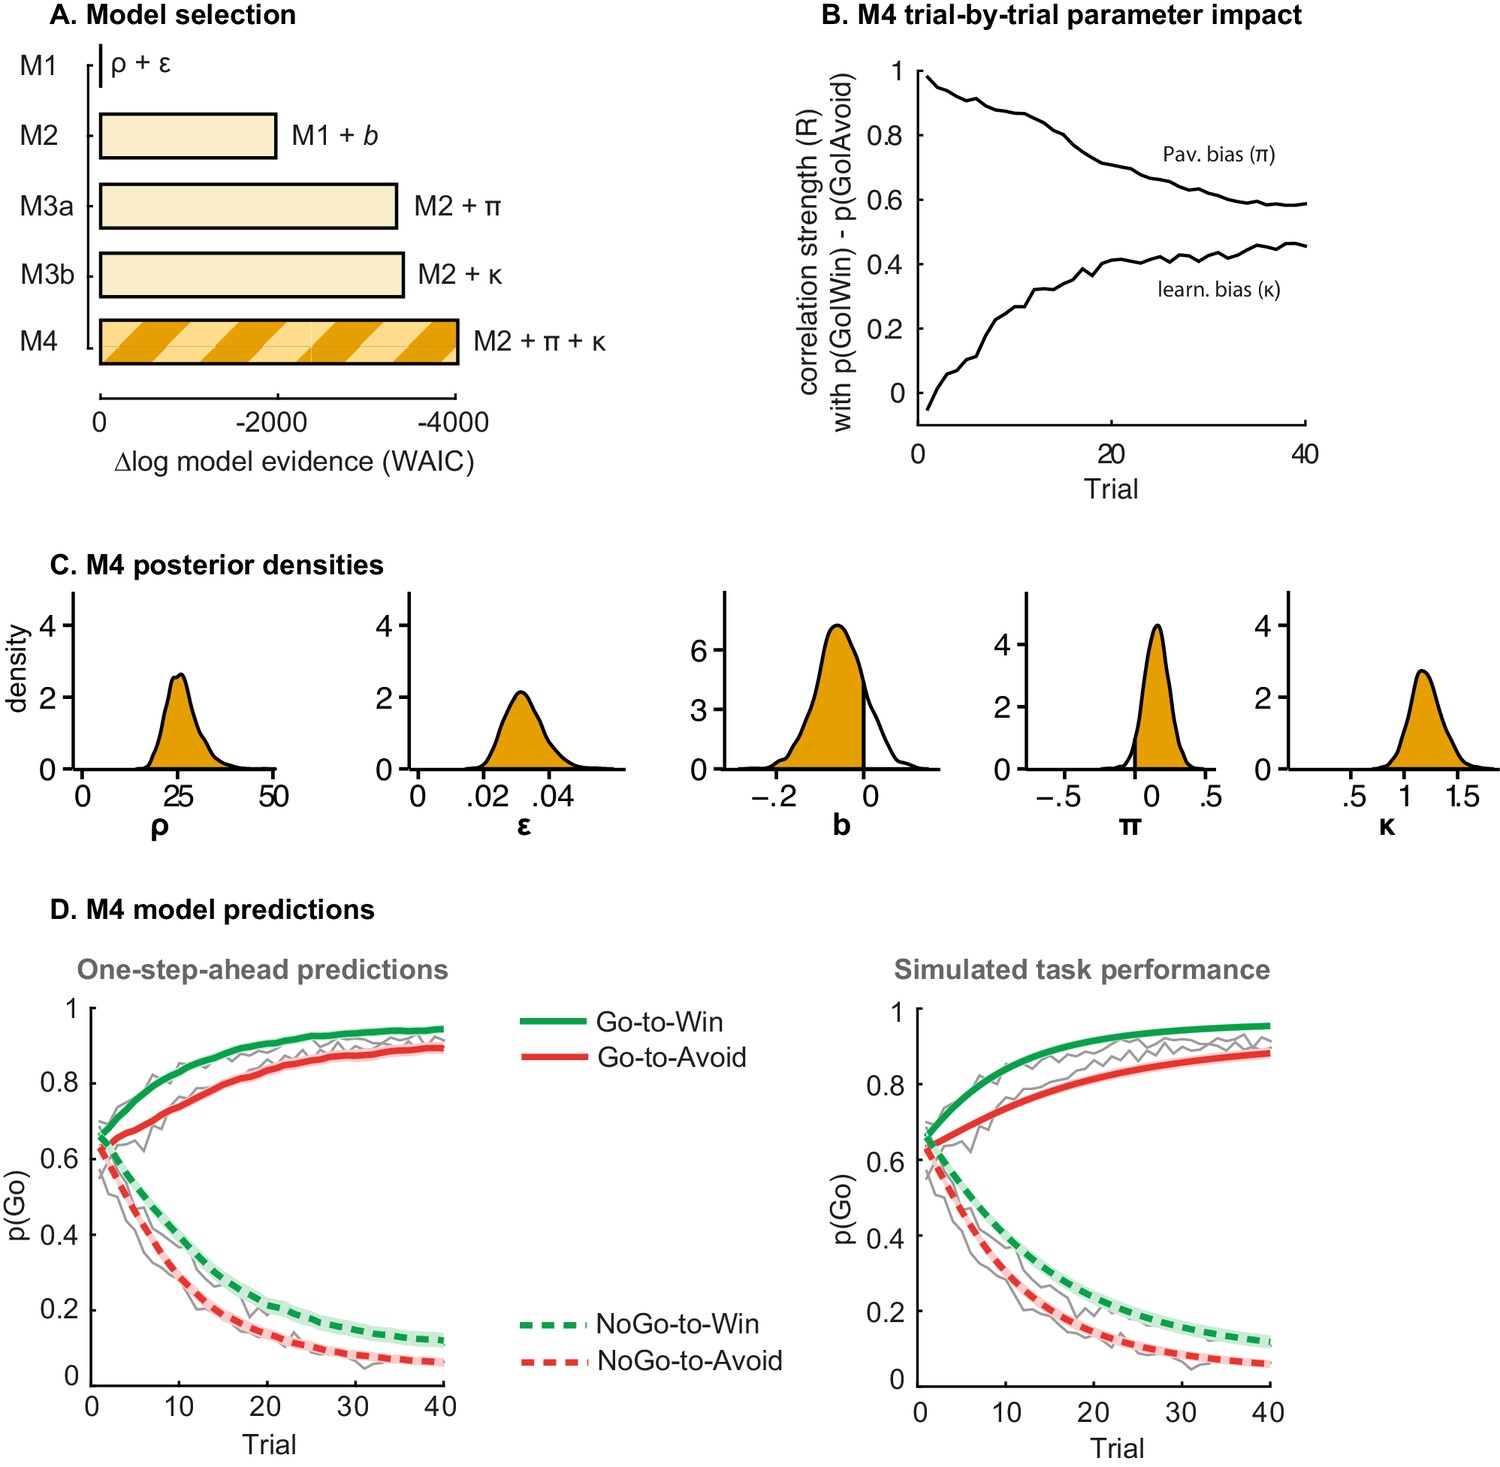
Model evidence and parameter inference of base models.
(A) Model evidence, relative to simplest model M1, clearly favours M4. The simplest model M1 contains a feedback sensitivity (ρ) and learning rate (ε) parameter. Stepwise addition of the go bias (b), Pavlovian bias (π; Figure 1A), and instrumental learning bias (κ; Figure 1B) parameter improves model fit, quantified by WAIC (estimated log model evidence). Lower (i.e. more negative) WAIC indicates better model fit. (B) Temporal dynamics of the correlation between the motivational bias parameters (M4) and the predicted motivational bias, i.e. probability to make a Go response to Win relative to Avoid cues. The impact of the Pavlovian bias (π) on choice decreases over time (although, importantly, the parameter itself remains constant). This is because the instrumental values of the actions are learnt and thus will increasingly diverge. As a result, π is less and less 'able' to tip the balance in favour of the responses in direction of the motivational bias (i.e. it can no longer overcome the difference in instrumental action values). In contrast, the impact of κ on choice increases over time, reflecting the cumulative impact of biased learning (also Figure 3—figure supplement 2). (C) Posterior densities of the winning base model M4. Appendix 5 shows posterior densities for all models. (D) One-step-ahead predictions and posterior predictive model simulations of winning base model M4 (coloured lines), to assess whether the winning model captures the behavioural data (grey lines). Both absolute model fit methods use the fitted parameters to compute the choice probabilities according to the model. The one-step-ahead predictions compute probabilities based on the history of each subject's actual choices and outcomes, whereas the simulation method generates new choices and outcomes based on the response probabilities (see Materials and methods for details). Both methods capture the key features of the data, i.e. responses are learnt (more 'Go' responding for 'Go' cues relative to 'NoGo' cues) and a motivational bias (more Go responding for Win relative to Avoid cues). We note that the model somewhat underestimates the initial Pavlovian bias (i.e. difference in Go responding between Win and Avoid trials is, particularly trial 1–2), while it overestimates the Pavlovian bias on later trials. This is likely the result from the fact that while the modelled Pavlovian bias parameter (π) is constant over time, the impact of the Pavlovian stimulus values weakens over time, as the subjects’ confidence in the instrumental action values increases. Interestingly, notwithstanding the constancy of the Pavlovian bias parameter, we do capture some of these dynamics as Figure 3B shows that the impact of the Pavlovian bias on choice decreases over time. Source data of M4 simulated task performance are available in Figure 3—source data 1.
-
Figure 3—source data 1
Source data for model M4 simulated task performance.
This matlab datafile contains the probability of Go responses (subject x trial) for the Go-to-Win, Go-to-Avoid, NoGo-to-Win, and NoGo-to-Avoid cues, as simulated by model M4. Posterior predictive model simulations used the M4 sampled parameter combinations of each subject. Simulations were repeated for each sampled parameter combination (4000 times), in line with the Bayesian nature of the sampling procedure and to minimize randomness, and choice probabilities were averaged over simulations.
- https://doi.org/10.7554/eLife.22169.008
Figure 3—figure supplement 1
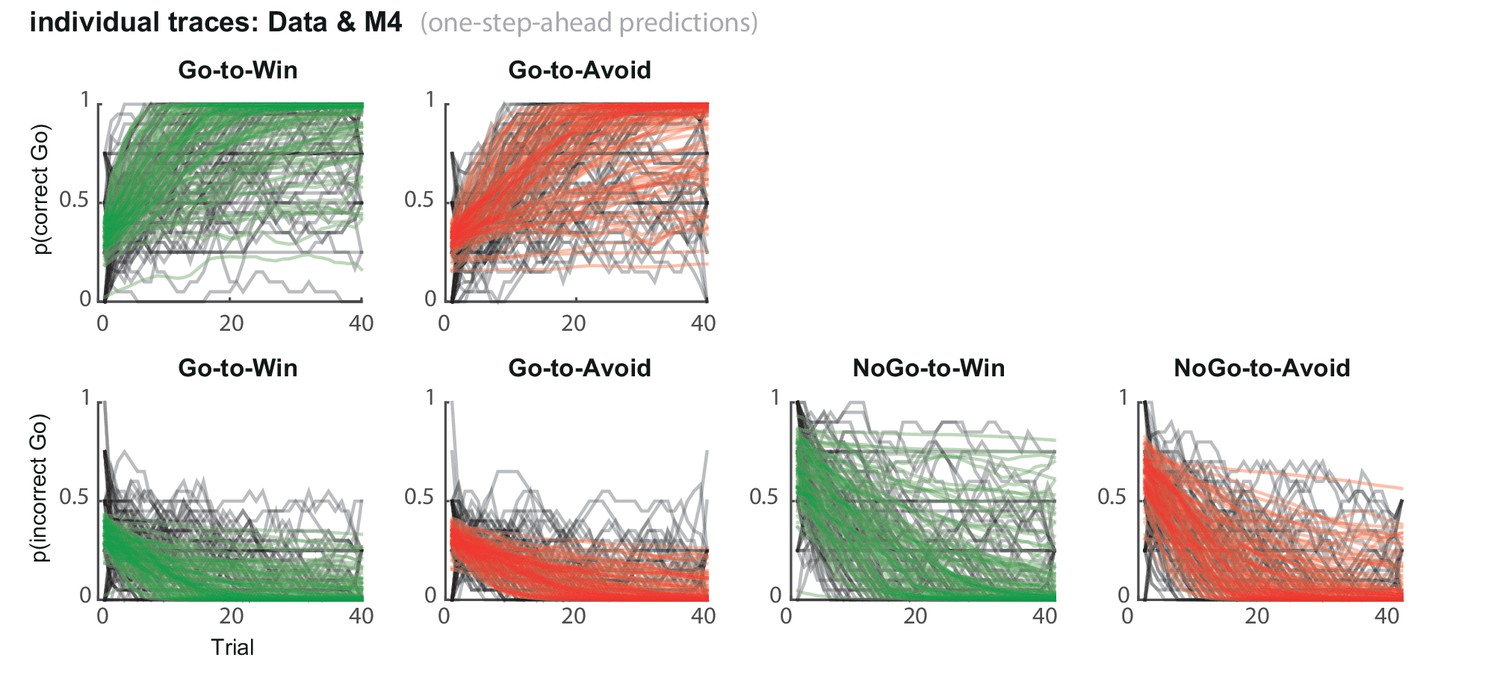
Subject traces of model M4 (green/red) overlaid on observed behavior (black).
M4 one-step-ahead predictions capture the individual variability in task performance.
Figure 3—figure supplement 2
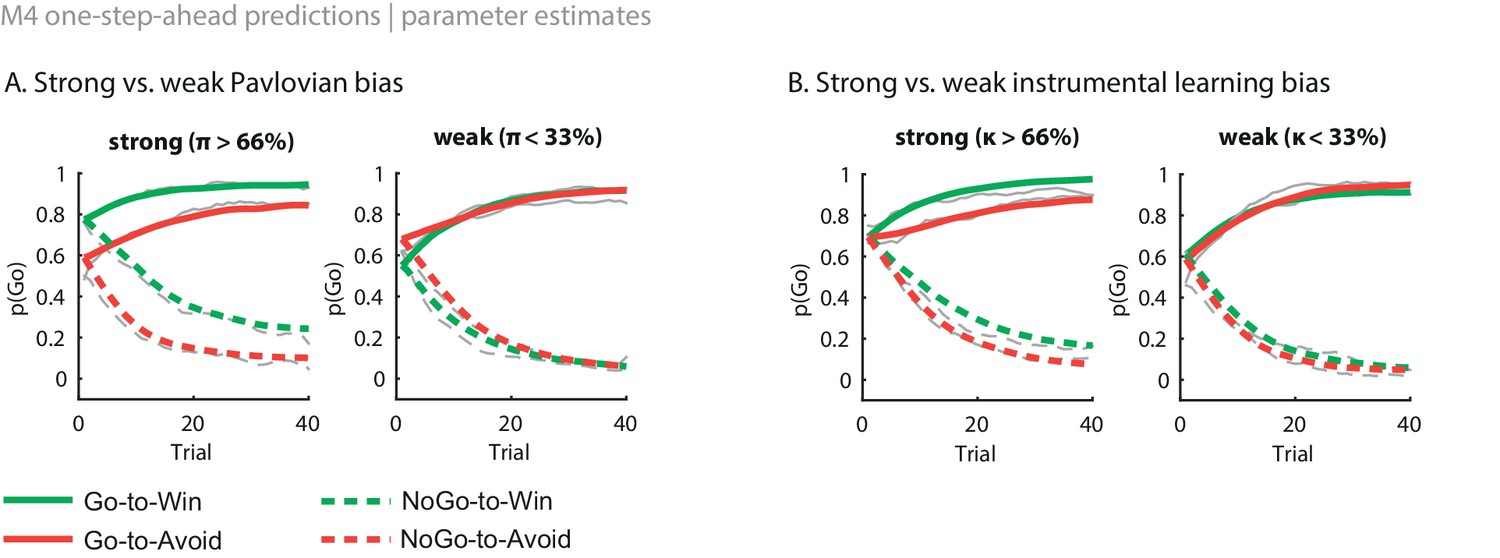
Illustration of the behavioural effects associated with the Pavlovian bias and instrumental learning bias parameters.
Model M4 one-step-ahead predictions (coloured) overlaid on real data (grey) for the subjects with the upper versus lower tertile of parameter estimates. (A) Effects of Pavlovian bias (π). A strong Pavlovian bias (top 33% of π estimates) predicts higher Go responding for the Win than Avoid cues from the first trial onward, vice versa for a weak Pavlovian bias (33% lowest π estimates). (B) Effects of instrumental learning bias (κ). A strong instrumental learning bias (33% highest κ estimates) predicts steeper Go-to-Win learning and shallower Go-to-Avoid learning, vice versa for a weak instrumental learning bias (33% lowest κ estimates). See also Figure 3B for the temporal dynamics of the parameter-behaviour correlations.
Figure 3—figure supplement 3
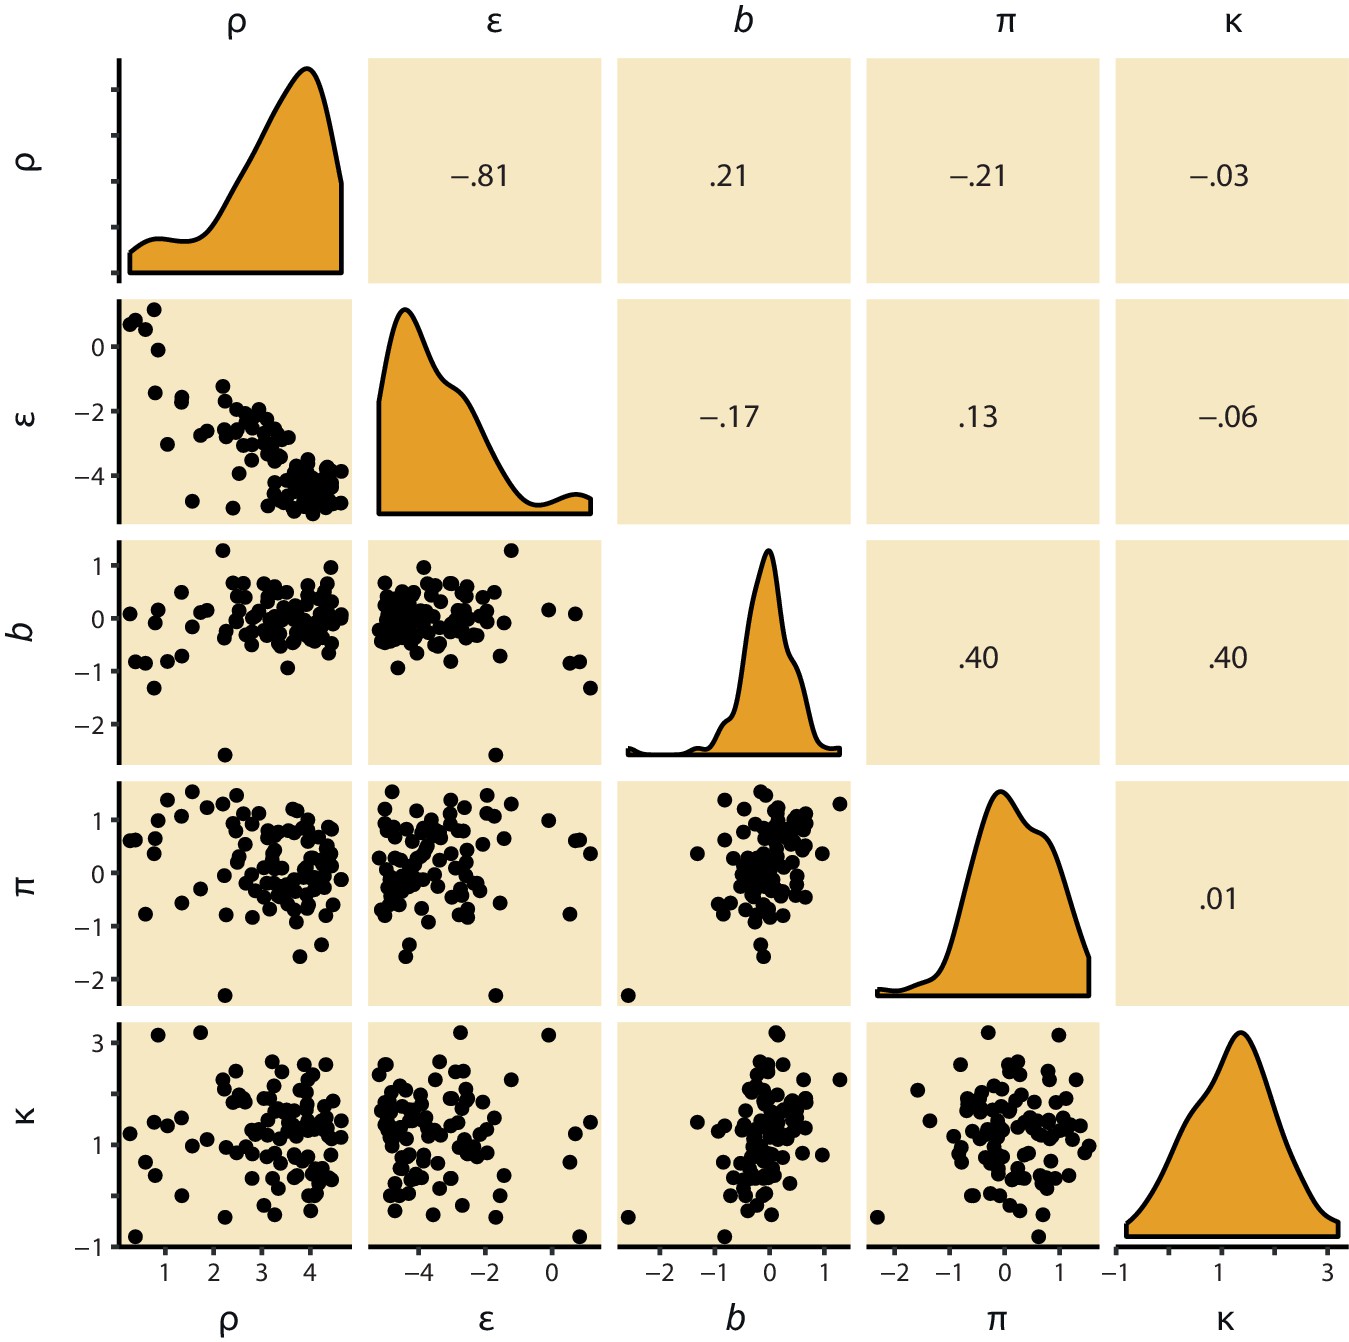
M4 subject-level parameters in model space (i.e. untransformed).
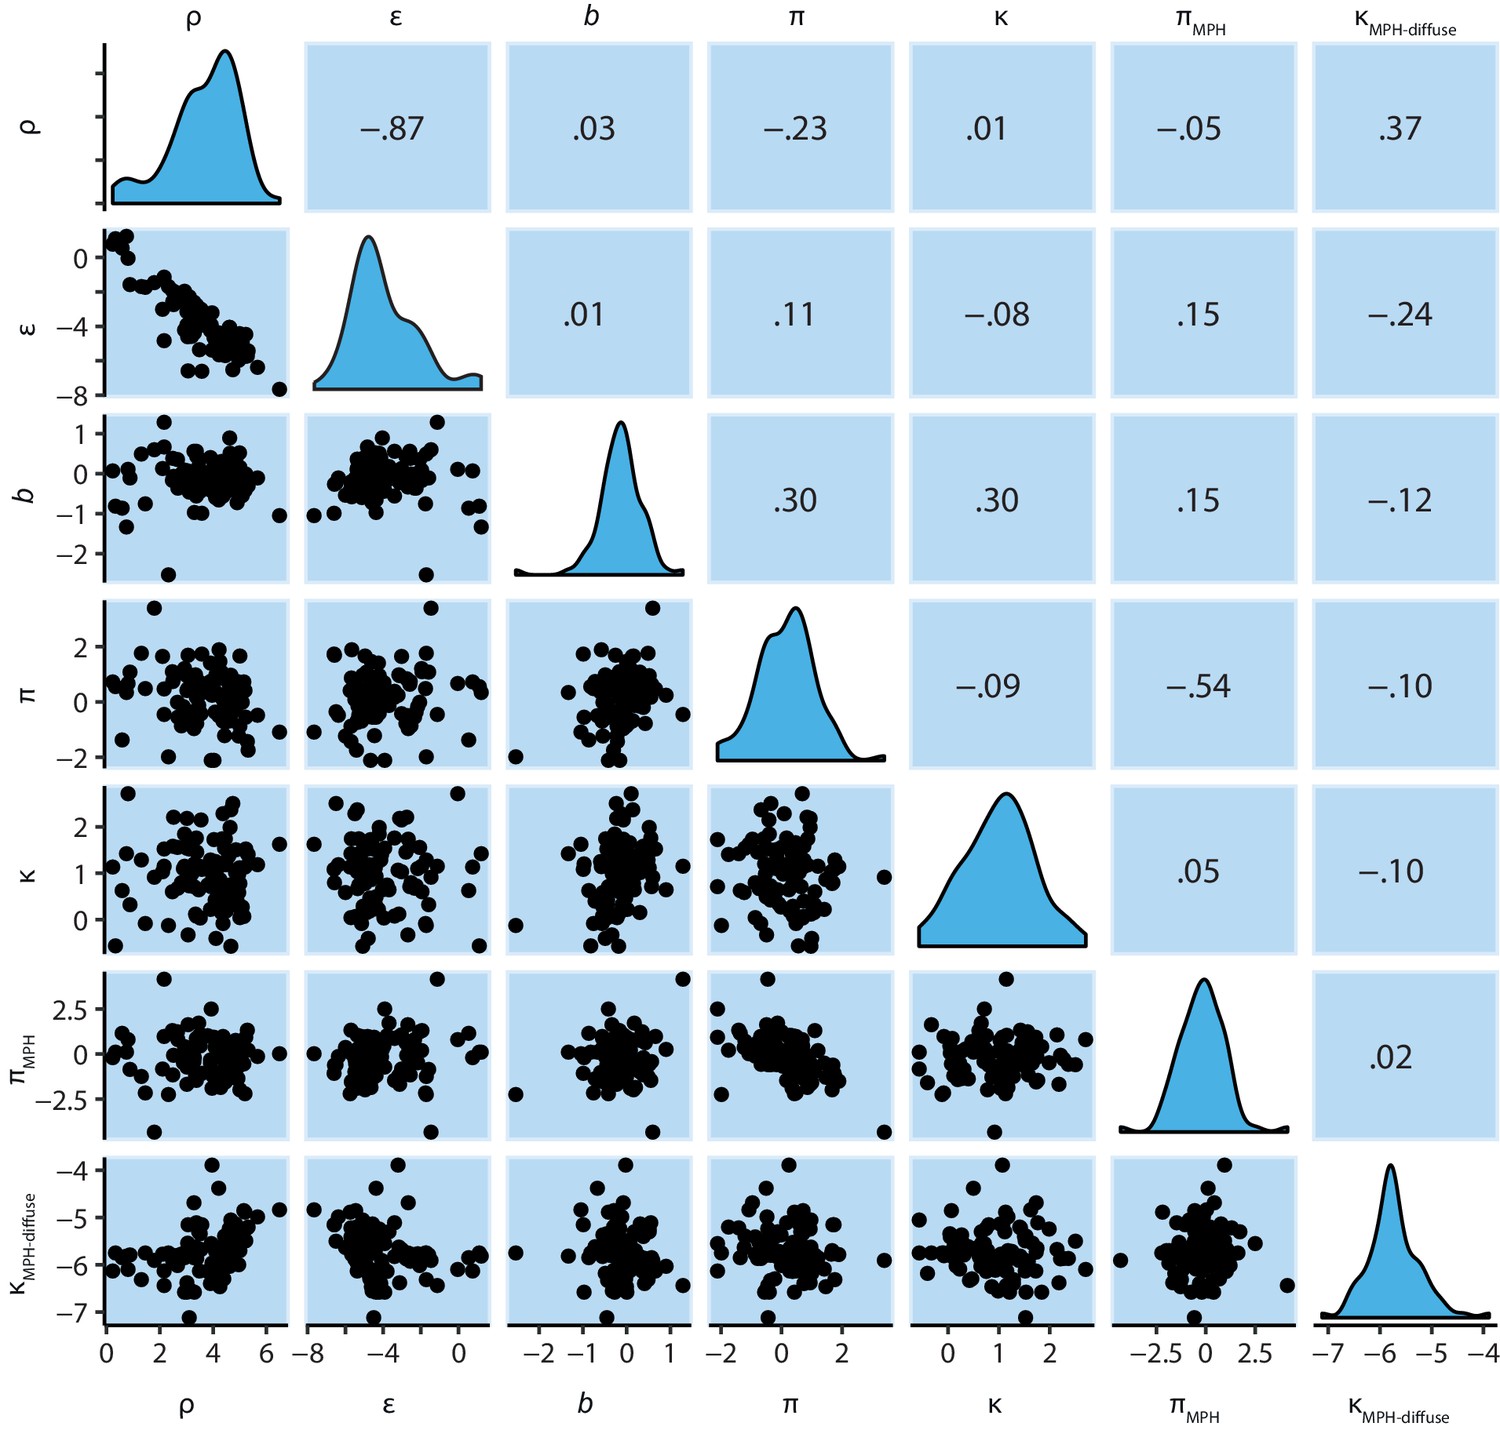
The diagonal panels contain the posterior densities for the subject-level parameter means. The off-diagonal panels show the correlation over subjects in mean parameter estimates. Importantly, the two key parameters, Pavlovian bias (π) and instrumental learning bias (κ) are not correlated to any of the other parameters. We do note that the feedback sensitivity parameter (ρ) is anti-correlated with the learning rate (ε), such that the impact of high feedback sensitivity estimates is restricted by low learning rates. This correlation is not problematic, because independent estimation of learning rate and feedback sensitivity is no direct interest to the questions we ask.
Figure 4 with 1 supplement

MPH-induced changes in motivational bias (i.e. proportion of Go responses to Win relative to Avoid cues).
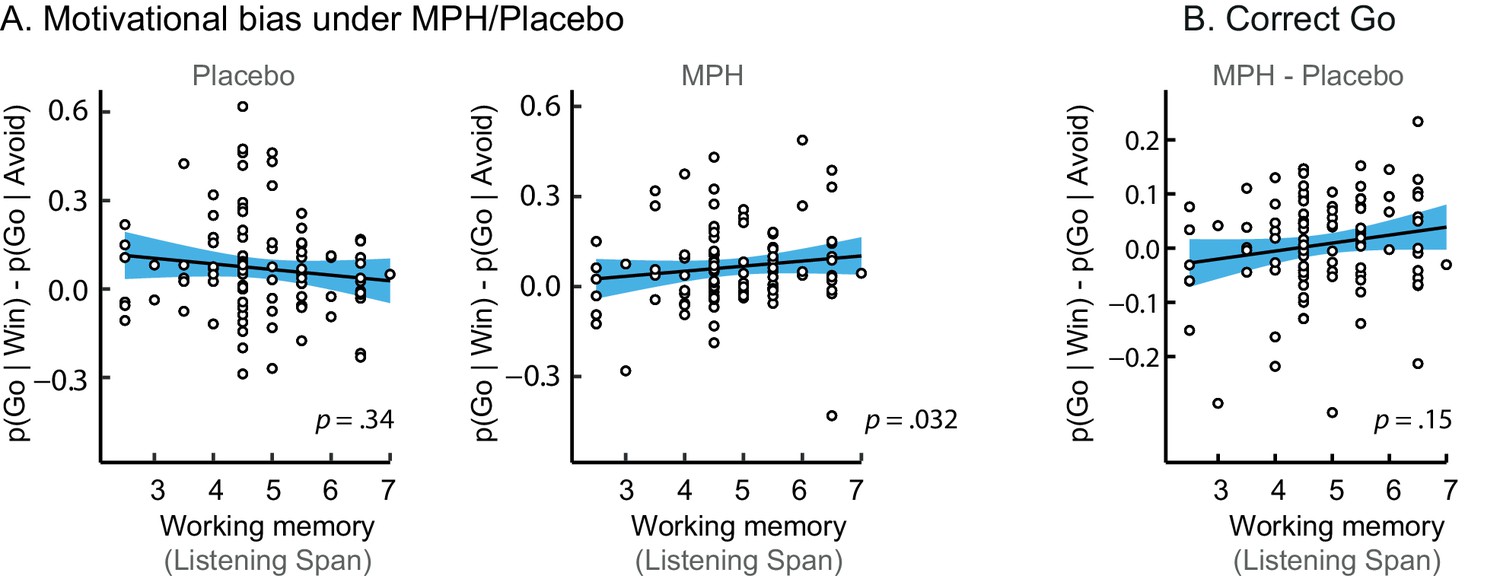
(A) Mean (±SED) proportion Go responses under MPH relative to Placebo. MPH did not significantly alter the motivational bias across the group (p=0.22; ns indicates p>0.05). (B) MPH increased the motivational bias in high span subjects, yet decreased it in low span subjects (R = 0.21; p=0.016). (C) MPH altered the motivational bias particularly for incorrect Go proportional to working memory span (incorrect Go: p<0.001; correct Go: p=0.152).
Figure 4—figure supplement 1
Simple effects of MPH-induced changes in motivational bias.
(A) The span-dependent motivational bias emerged under MPH (right; p=0.032), and was not significant under placebo (left; p=0.34). (B) MPH did not significantly alter the motivational bias proportional to working memory span for correct Go responses (correct Go: p=0.15).
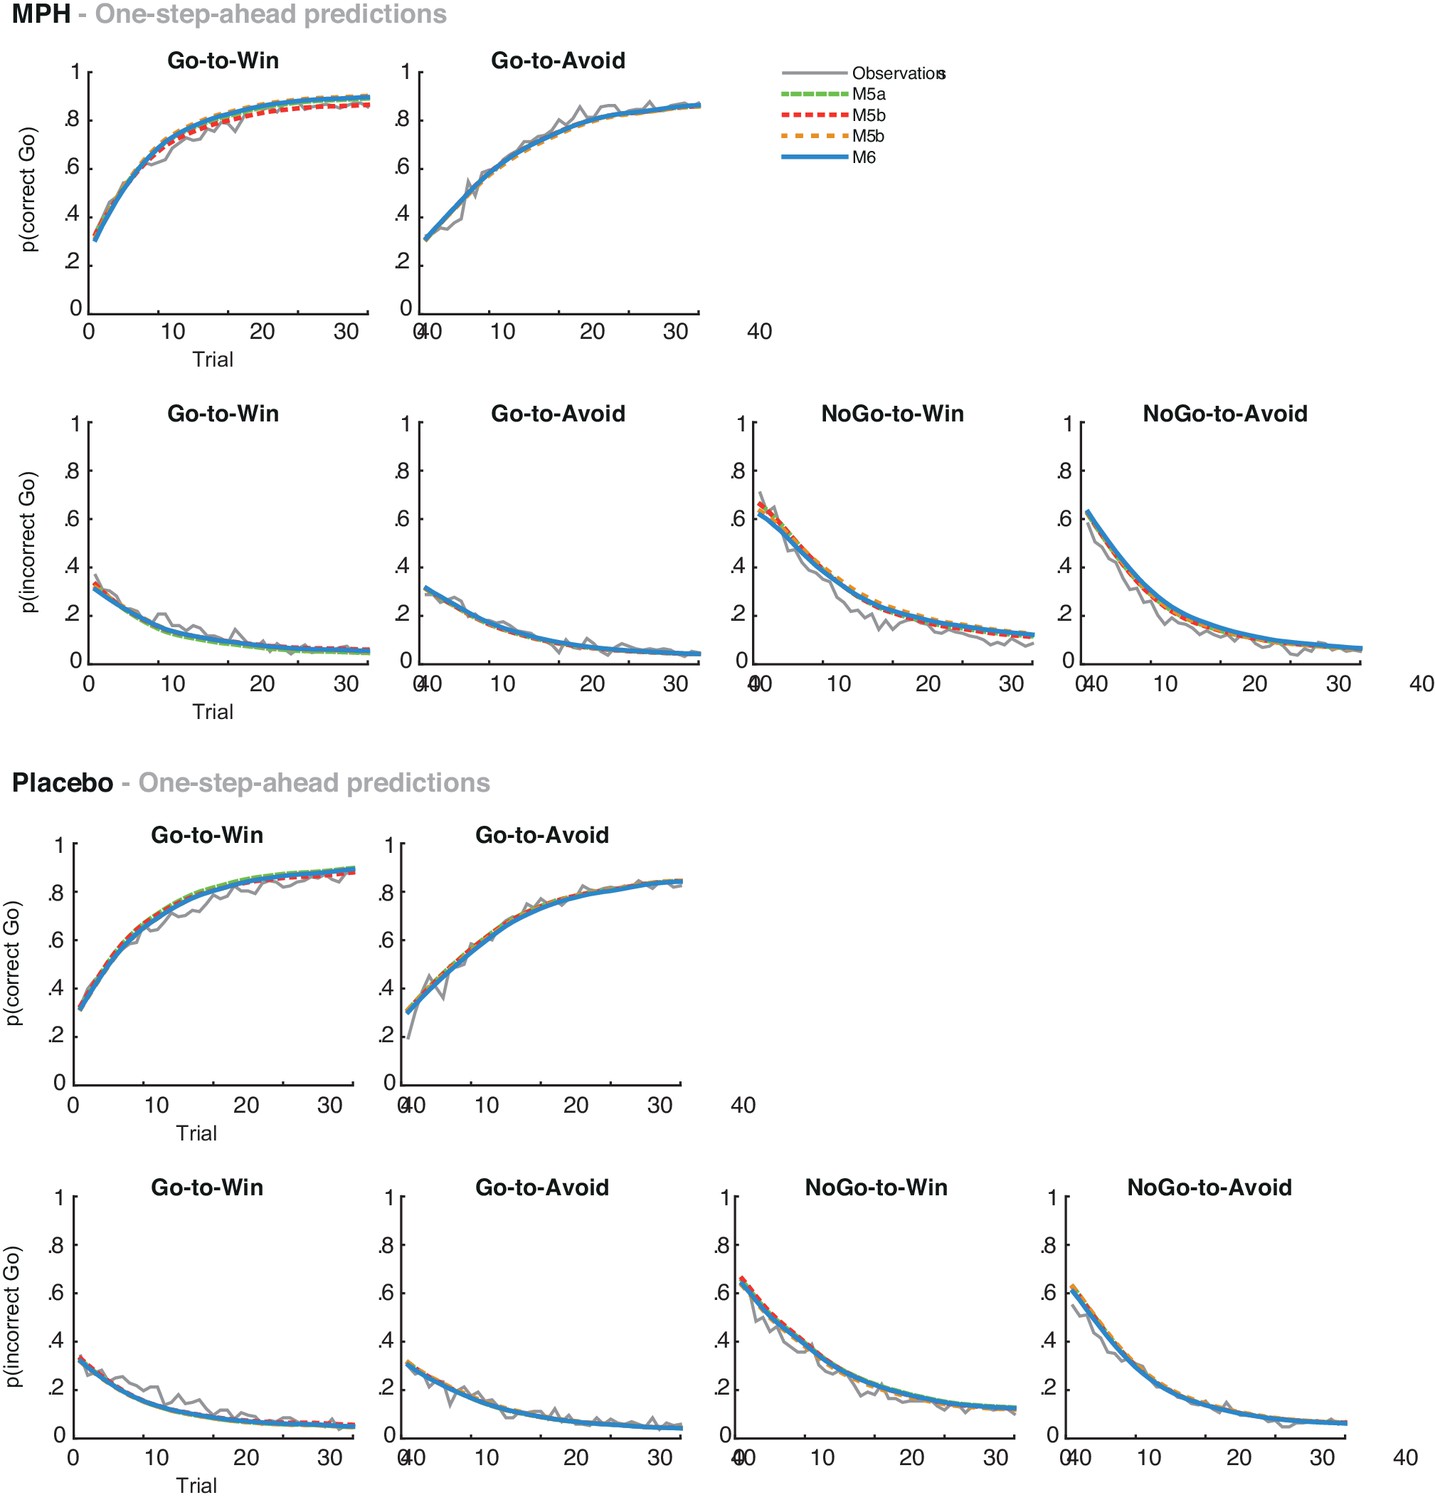
Figure 5 with 2 supplements
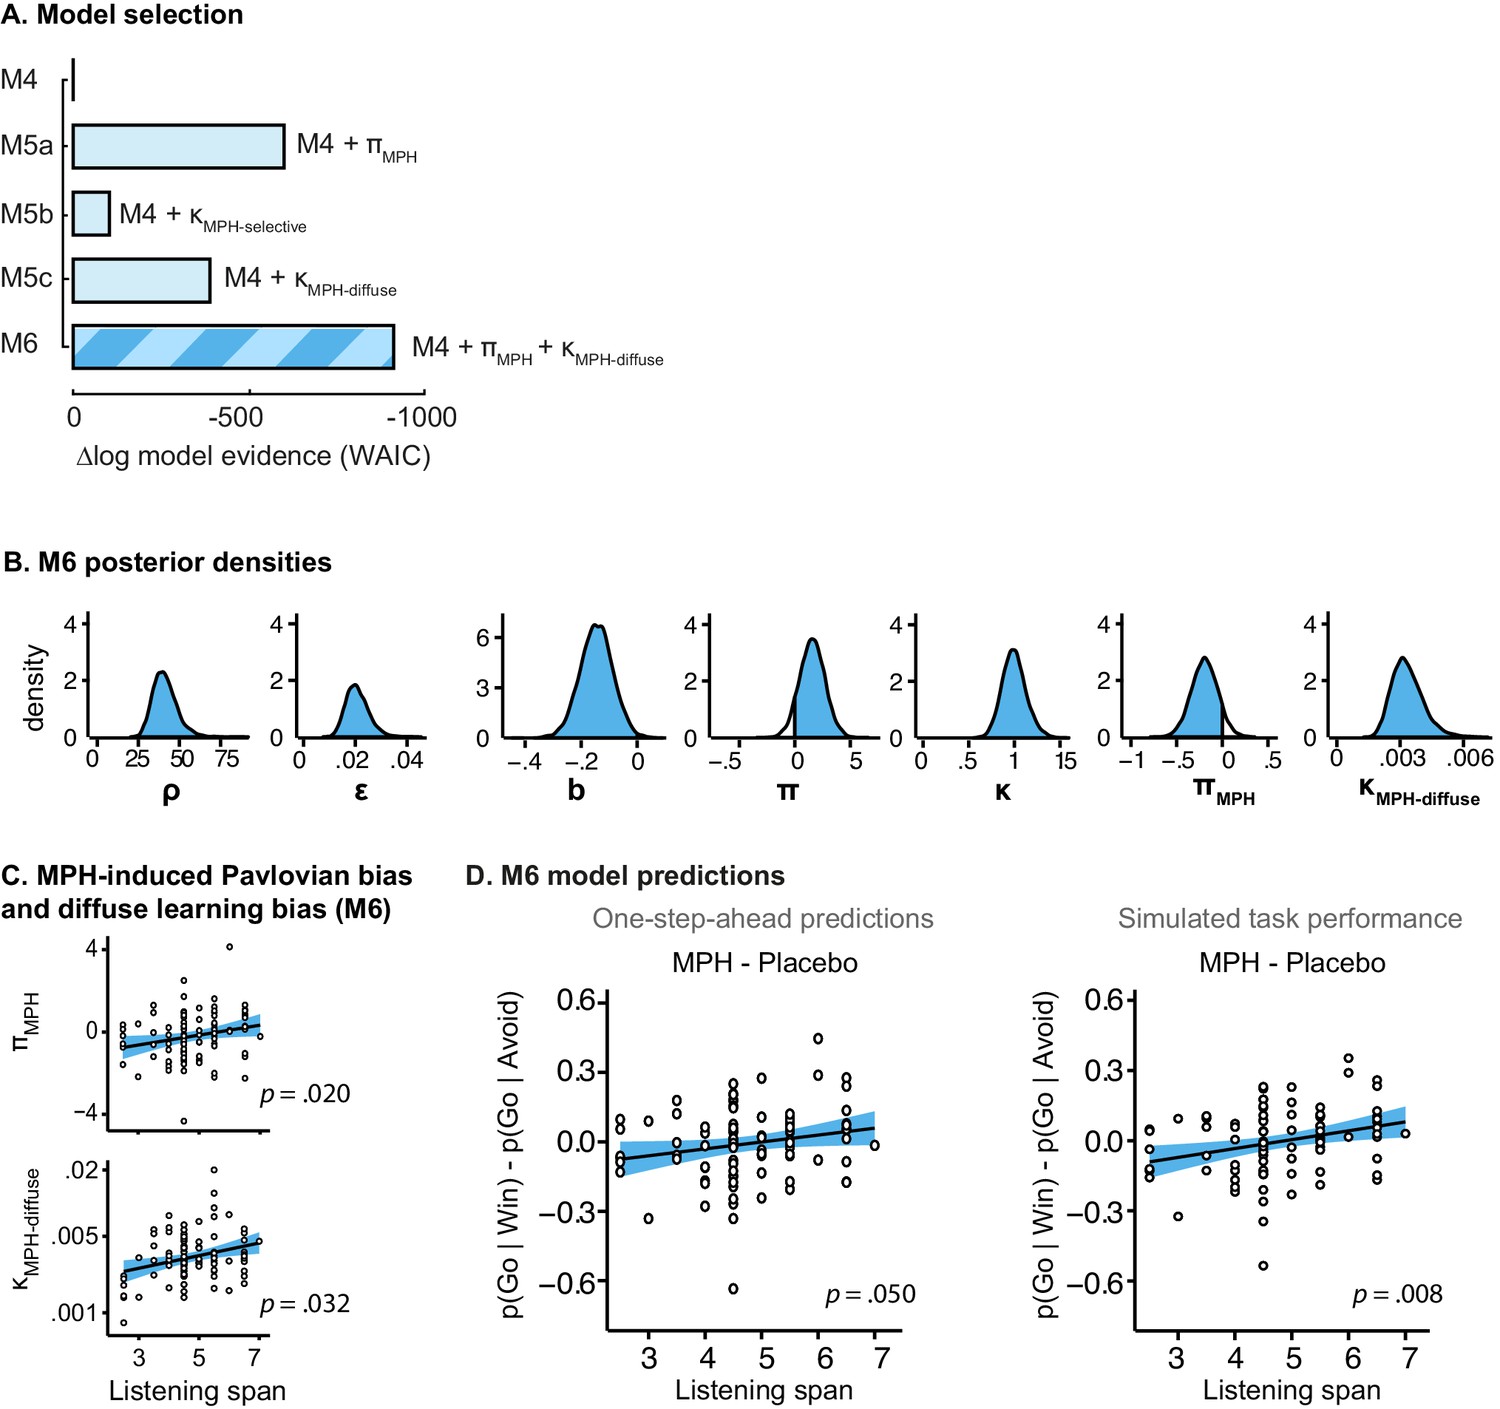
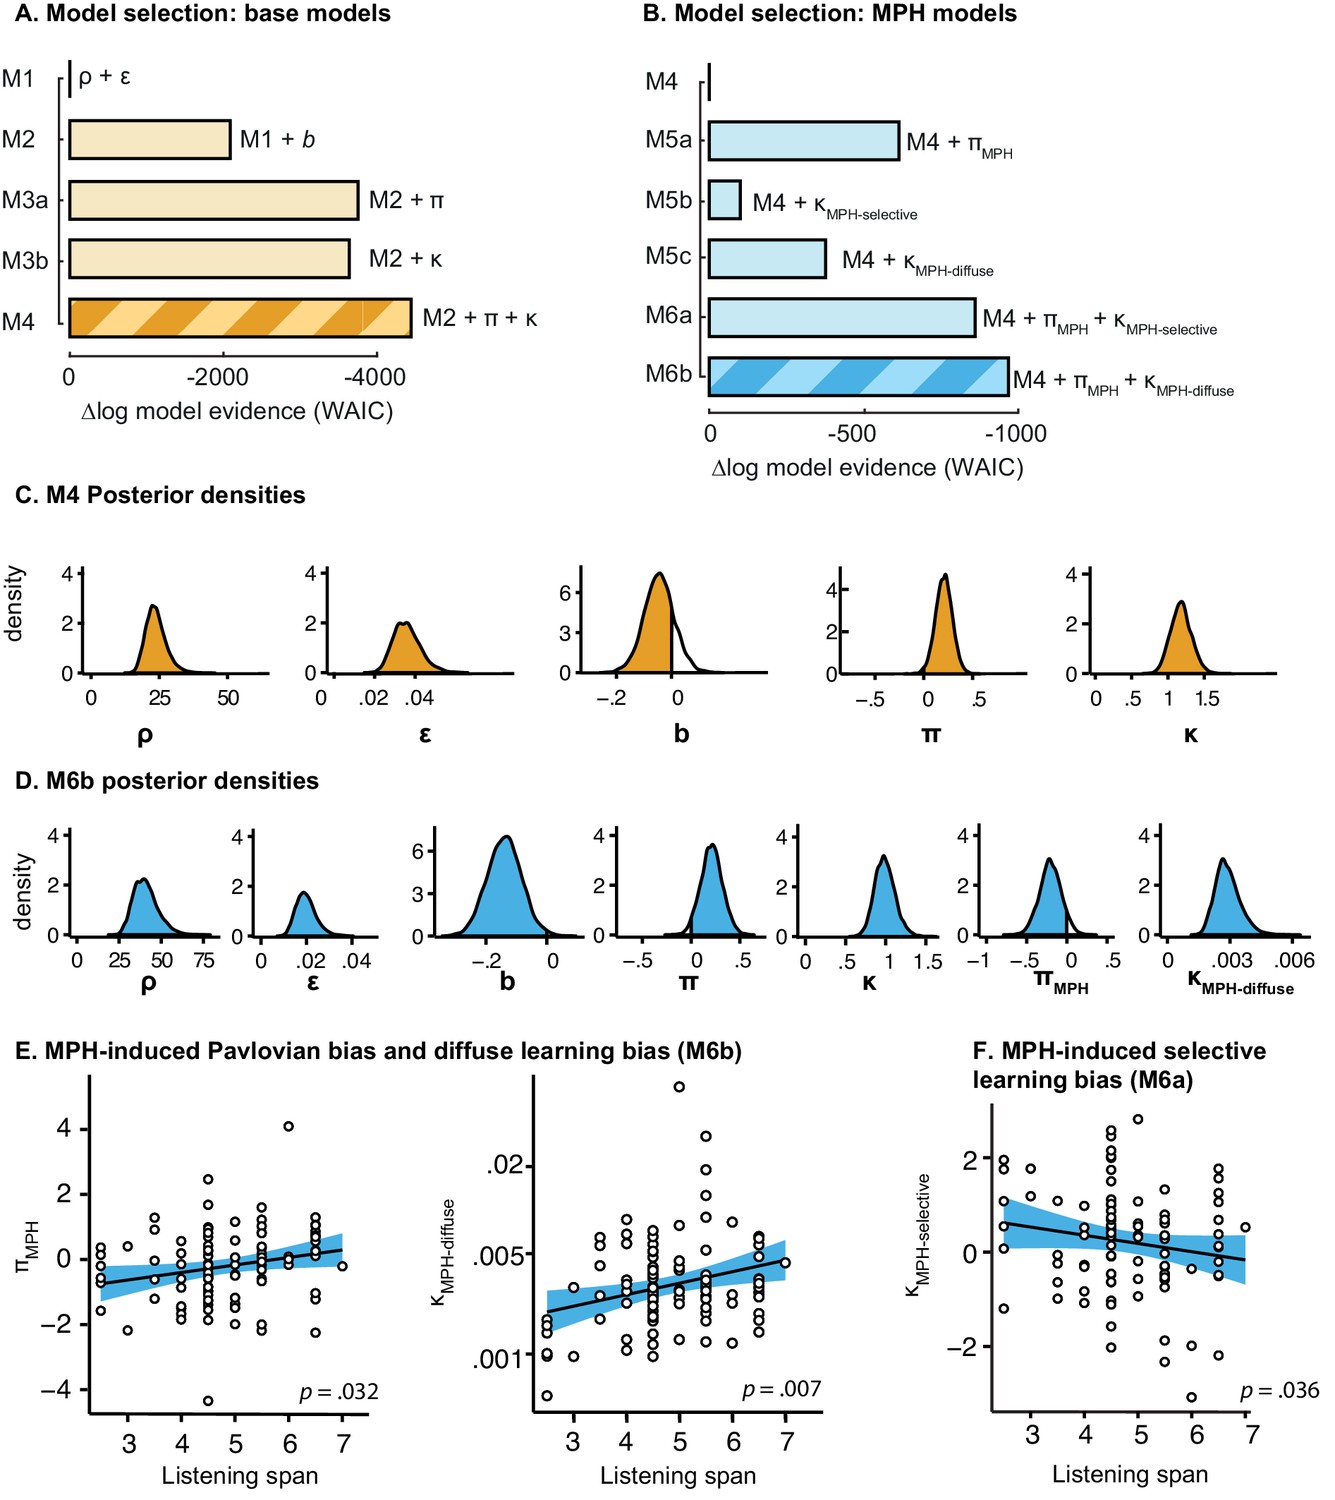
Model evidence and parameter inference of extended MPH models.
(A) Model evidence (WAIC) relative to winning base model M4. We tested whether MPH alters the strength of the Pavlovian response bias (πMPH; M5a), the instrumental learning bias (κMPH-selective; M5b), or has a diffuse effect on the learning bias (κMPH-diffuse; M5c; Figure 1C). Model selection favoured the composite model M6, including the πMPH and κMPH-diffuse parameters. (B) Posterior densities of the top-level parameters of M6. (C) Subject-level estimates of MPH-induced Pavlovian bias parameter (upper) and the MPH-induced diffuse learning bias parameter (lower; logistic scale) correlated significantly with Listening Span. (D) One-step-ahead model predictions and posterior predictive model simulations of M6 using subject-level parameter estimates. The model predictions and simulations echo the observed data, i.e. that the motivational bias correlates positively with working memory span (Figure 4B), confirming the winning model M6 captures the MPH-induced increase in Go responses to Win vs. Avoid cues.
Figure 5—figure supplement 1
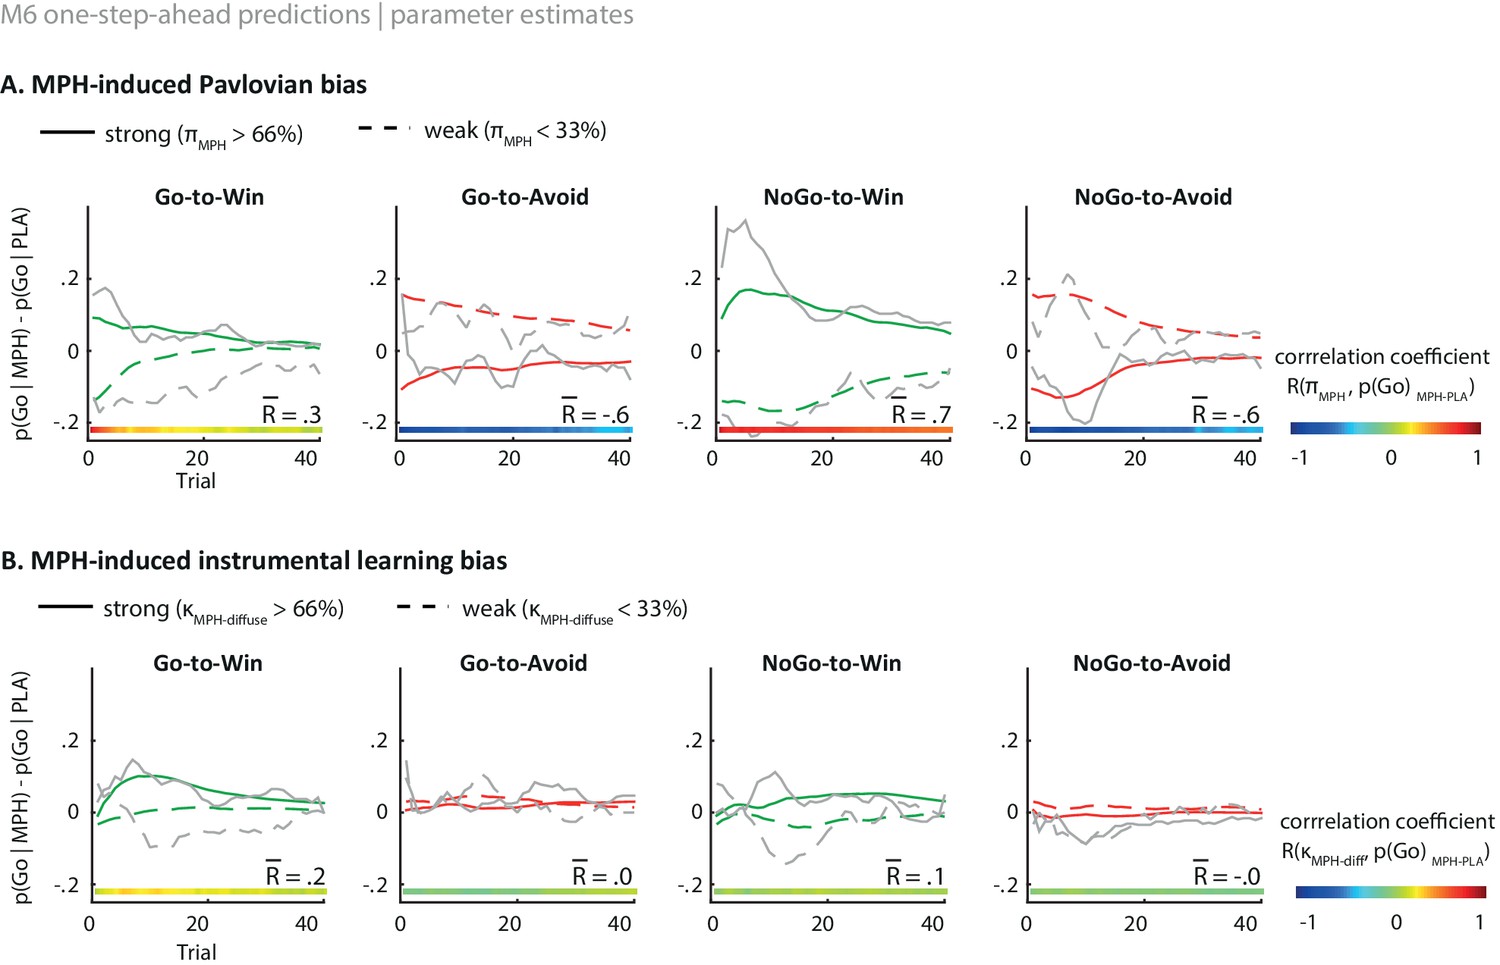
Illustration of the behavioural effects of MPH related to the Pavlovian bias and diffuse learning bias parameters.
Model M6 one-step-ahead predictions (coloured) overlaid on real data (grey) for the subjects with the 33% strongest vs. weakest parameter estimates. The coloured bars at the bottom indicate the trial-by-trial correlation across all subjects, of the parameter estimate with the effect of MPH on Go responding per cue. The R value indicates the average correlation. (A) The effect of MPH on Pavlovian bias (πMPH). Strong πMPH estimates predict that MPH increases the motivational bias (increased Go to Win cues and decreased Go to Avoid cues), and vice versa for weak πMPH estimates. The influence of πMPH is present from the first trial onward and decreases over time as indicated by the correlation coefficients. (B) Effect of MPH on diffuse learning bias (κMPH-diffuse). Strong κMPH-diffuse estimates predict that MPH increases the motivational bias for Win cues specifically, whereas this effect is diminished for subjects with relatively weak κMPH-diffuse estimates. The effect of κMPH-diffuse is experience-dependent and evolves over time. These one-step-ahead predictions illustrate how each parameter results in an increased motivational bias under MPH, but with unique temporal dynamics, even though the parameter themselves are constant.
Figure 5—figure supplement 2
M6 subject-level parameters in model space (i.e. untransformed).
The diagonal panels contain the posterior densities for the subject-level parameter means. The off-diagonal panels contain the parameter correlations over subjects. Importantly, the parameters estimating the effects of MPH on Pavlovian bias (πMPH) and diffuse learning bias (κMPH-diffuse) are not correlated any of the other parameters.
Appendix 3—figure 1
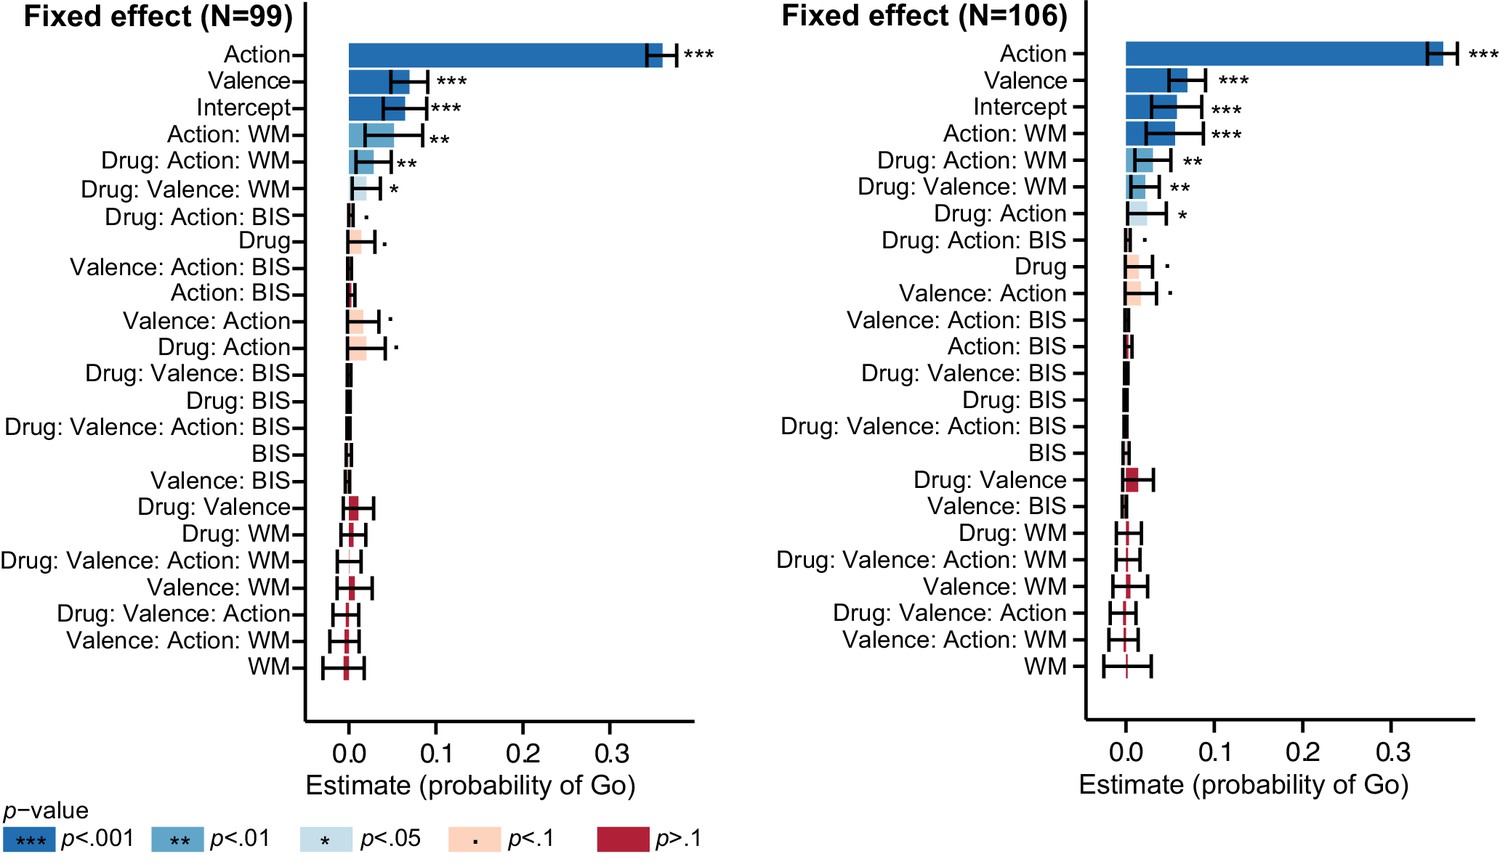
Logistic mixed model estimates of the probability of Go responses to verify that exclusion of a subset of subjects (7) did not affect our inference.
Left: N = 99; Right: N = 106. Fixed effect estimates and 95% confidence interval (CI) are plotted on probability scale. Effects are sorted by lower bound of the CI. The results including all 106 subjects replicate the findings when discarding the subset of subjects (four subjects dropped out after the first test day, two subjects dissolved the capsules before swallowing, one subject did not sufficiently engage in the task).
Appendix 5—figure 1
Model selection and parameter inference for base models and extended MPH models including all subjects (N = 99).
(A–B) Model selection favours M4 of the base models and M6b of the extended MPH models as reported in the main article. Note that M6b in this figure corresponds to M6 in the main manuscript. (C-D) Posterior densities of top-level parameters of the winning base and MPH model, in model space (i.e. transformed). Only κ is presented untransformed (i.e. in sample space), as it is added to ε0 prior to transformation. (E) As reported in the main article, πMPH and κMPH-diffuse of M6b positively correlate with Listening Span. (F) In the composite model M6a, κMPH-selective correlates negatively with Listening Span (N = 94; Rho = −0.22, p=0.036), which further supports that this parameter cannot capture the positive relation between listening span and the effect of MPH on motivational bias. Note that we report the correlation here for the 94 subjects for whom the parameters were reliably estimated, i.e. model convergence was reached.
Appendix 5—figure 2
Average one-step-ahead predictions for the base models M2-4 overlaid on the observations in grey.
The one-step-ahead predictions indicate the action probabilities as predicted by the model, using each subject’s actual choices and outcomes.
Appendix 5—figure 3
Average one-step-ahead predictions for the extended MPH models M5-6 overlaid on the observations in grey.
The one-step-ahead predictions generate the action probability of each choice, based on the history of the subject’s actual choices and outcomes preceding the choice. The predictions are separately plotted for MPH (top) and placebo (bottom). We observed no main effect of MPH on the motivational bias (i.e. more Go to Win cues relative to Avoid cues). Accordingly, all models make highly similar predictions under MPH and placebo across the group.
Author response image 1
Author response image 2
Author response image 3
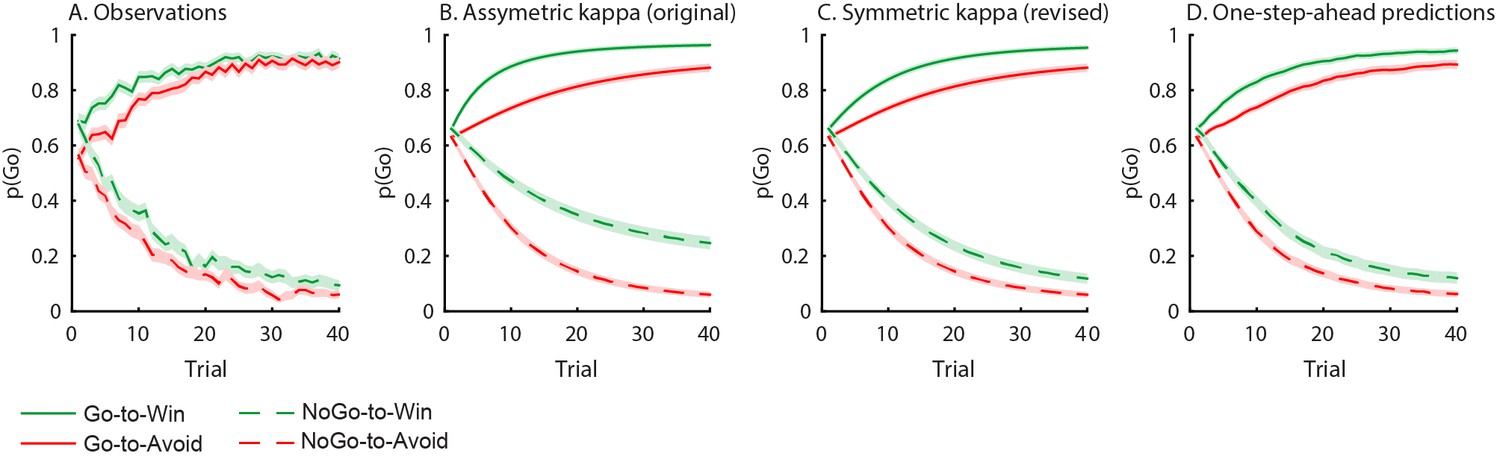
Behavioural observations and model predictions of winning base model M4.
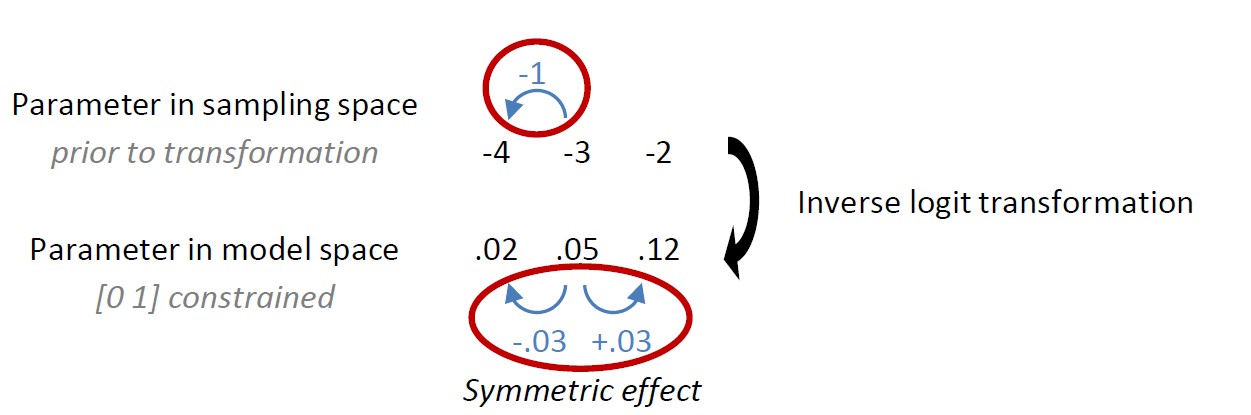
(A) Data averaged over placebo and MPH. Go responding is higher for Win than Avoid cues, independent of the action requirements. (B) Model M4 simulations from the original manuscript; the instrumental learning bias (κ) was symmetrical prior to [0 1] constraint, resulting in disproportionally strong Go-to-Win learning. (C) Revised model M4 simulations with effects of κ symmetrical in the reward and punishment domain better match the data. (D) One-step-ahead predictions for the revised model M4. The one-step-ahead predictions, which take into account all preceding choices and outcomes for predicting each, match the data even closer than the model simulations.
Author response image 4

Observed behavior and one-step-ahead predictions excluding trials 1-2.
The model predictions show more pronounced p(Go)Win-Avoid on the first trials than the observations (Author response image 3A,D). This discrepancy is largely constrained to the first two trials and is absent in later trials, as can be seen more easily when omitting the first 2 trials for illustration.
Author response image 5
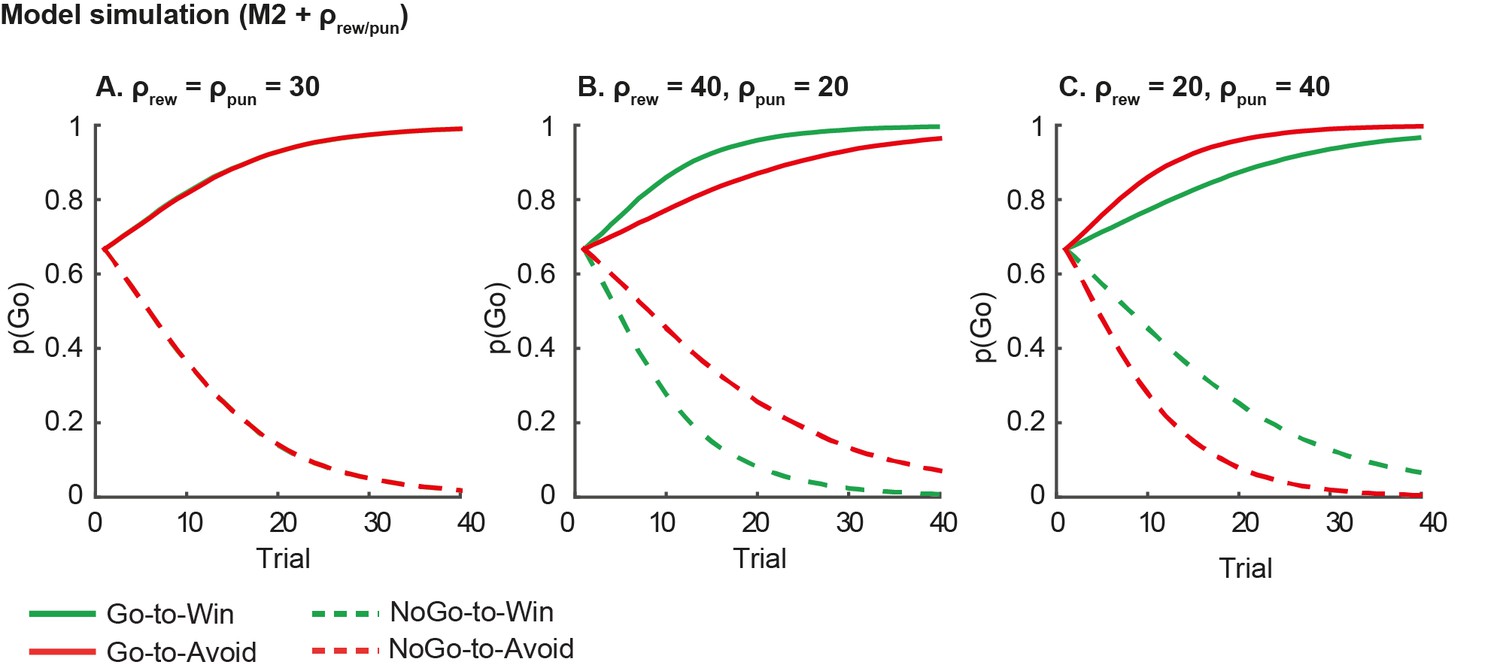
Model predictions of asymmetrical reward/punishment sensitivity (ρrew/pun).
Here we simulate data using model M2, which consists of a simple reinforcement learning model and a go bias parameter. We used the fitted group-level parameters (learning rate=.024; feedback sensitivity= 30; go bias = -.2) and averaged over 1000 simulations. A. Model predictions of model M2 without asymmetric sensitivity. The model predicts no differences between Win and Avoid cues, i.e. Go responding matches for Win and Avoid cues. B. Model predictions of model M2 + higher reward sensitivity (reward sensitivity = 40; punishment sensitivity= 20). Stronger reward sensitivity predicts incorrectly that subjects make more NoGo responses for the NoGo-to-Win than NoGo-to-Avoid cues. C. Model predictions of model M2 + higher punishment sensitivity (reward sensitivity = 20; punishment sensitivity= 40). Stronger punishment sensitivity predicts incorrectly that subjects make more Go responses Go-to-Avoid than Go-to-Win cues.
Tables
Table 1
Base models. Median [25–75 percentile] of subject-level parameter estimates in model space. See Appendix 5 for subject-level / top-level parameters in sampling space (i.e. untransformed). Absolute WAIC is reported at the top as the estimate of model evidence, where a smaller WAIC indicates higher evidence.
| Base models | |||||
|---|---|---|---|---|---|
| M1 | M2 | M3a | M3b | M4 | |
| WAIC | 71014 | 69038 | 67678 | 67602 | 66987 |
| ρ | 42.7 [19.3 79.8] | 41.6 [18.7 72.4] | 35.2 [15.8 66.4] | 33.4 [13.9 59.8] | 32.5 [14.9 56.4] |
| ε0 | 0.013 [0.008 0.059] | 0.015 [0.008 0.054] | 0.017 [0.009 0.064] | 0.022 [0.010 0.070] | 0.021 [0.010 0.063] |
| b | −0.25 [−0.45 0.04] | −0.25 [−0.46 0.04] | .01 [−0.33 0.27] | −0.03 [−0.29 0.19] | |
| π | 0.47 [0.02 1.00] | 0.12 [−0.29 0.70] | |||
| ε rewarded Go(ε0+κ) | 0.037 [0.016 0.122] | 0.034 [0.016 0.109] | |||
| ε punished NoGo(ε0-κ) | 0.006 [0.002 0.014] | 0.008 [0.003 0.022] | |||
Table 2
MPH models. Median [25–75 percentile] of subject-level parameter estimates in model space. Absolute WAIC is reported as the estimate of model evidence, where a smaller WAIC indicates higher evidence. Biased instrumental learning rate for rewarded Go and punished NoGo responses as computed by ε0±κ under placebo and by ε0±(κ+κMPH) under MPH. (MPH) indicates the value of that parameter under MPH.
| Extended MPH models | ||||
|---|---|---|---|---|
| M5a | M5b | M5c | M6 | |
| WAIC | 66383 | 66883 | 66595 | 66069 |
| ρ | 31.2 [14.7 53.6] | 31.6 [15.6 57.0] | 55.8 [19.6 104.8] | 51.9 [20.6 98.7] |
| ε0 | 0.022 [0.010 0.067] | 0.021 [0.011 0.061] | 0.011 [0.006 0.051] | 0.012 [0.006 0.055] |
| b | −0.04 [−0.33 0.18] | −0.05 [−0.34] | −0.10 [−0.37 0.13] | −0.14 [−0.42 0.10] |
| π π (MPH) | 0.27 [−0.50. 71] 0.20 [−0.38. 71] | 0.15 [−0.28. 70] | 0.05 [−0.46. 61] | 0.27 [−0.47. 74] −0.05 [−0.70. 50] |
| ε rewarded Go ε rewarded Go (MPH) | 0.037 [.017. 116] | 0.030 [.018. 103] 0.031 [.016. 104] | 0.018 [.009. 082] | 0.019 [.009. 085] |
| ε punished NoGo ε punished NoGo (MPH) | 0.009 [.004. 030] | 0.009 [.003. 021] 0.008 [.002. 021] | 0.004 [.002. 013] | 0.005 [.002. 017] |
| ε diffuse (MPH) | 0.002 [.002. 004] | 0.003 [.002. 004] | ||
Appendix 2—table 1
Mean(SD) scores for neuropsychological tests and self-report questionnaires for the group that received placebo and MPH on day 1. Significance levels for the between group differences are reported. Self-report questionnaires include the Barratt Impulsiveness Scale (BIS-11; Patton et al., 1995), the Behavioural Inhibition Scale/Behavioural Activation Scale (BISBAS; Carver and White, 1994), Need for Cognition Scale (NCS, Cacioppo et al., 1984), Multidimensional Scale of Perceived Social Support (MSPSS, Zimet et al., 1988), Barratt Simplified Measure of Social Status (BSMSS, Barratt, 2006), Sociable and Aggressive Dominance Questionnaire (SADQ, Kalma et al., 1993), Beck Depression Inventory II (BDI-II; Beck et al., 1996), Spielberger Trait Anxiety Inventory (STAI; Spielberger et al., 1983).
| Group 1 Placebo Day 1 | Group 2 MPH Day 1 | |||
|---|---|---|---|---|
| Neuropsychological tests | Listening span | 5.0 (0.9) | 4.6 (1.2) | p=0.16 |
| NLV | 94.4 (7.6) | 92.6 (7.6) | p=0.23 | |
| Digit span – forward | 17.2 (3.7) | 16.2 (3.6) | p=0.16 | |
| Digit Span - backward | 14.7 (3.4) | 13.9 (2.7) | p=0.22 | |
| Self-report questionnaires | Impulsivity (BIS-11) | 63.5 (8.9) | 60.2 (7.9) | p=0.052* |
| Behavioural inhibition (BIS) | 16.4 (3.7) | 16.3 (3.5) | p=0.90 | |
| Behavioural activation (BAS) | 22.8 (3.9) | 23.9 (4.0) | p=0.17 | |
| Need for cognition (NCS) | 64.5 (10.5) | 62.2 (10.5) | p=0.26 | |
| Social support (MSPSS) | 71.1 (10.1) | 69.3 (9.6) | p=0.35 | |
| Social status (BSMSS) | 49.8 (12.1) | 45.9 (12.7) | p=0.11 | |
| Social dominance (SADQ) | 4.1 (0.9) | 4.1 (0.8) | p=0.82 | |
| Aggressive dominance (SADQ) | 2.6 (0.6) | 2.6 (0.6) | p=0.69 | |
| Depressive symptoms (BDI-II) | 3.5 (3.7) | 3.6 (3.9) | p=0.97 | |
| Anxiety symptoms (STAI) | 32.4 (6.6) | 32.4 (7.2) | p=1.0 |
-
*One subject had an outlying score on the BIS-11. Without outlier: p=0.09.
Appendix 5—table 1
Untransformed subject-level parameter means (SD).
| Base models | Extended MPH models | |||||||||
|---|---|---|---|---|---|---|---|---|---|---|
| M1 | M2 | M3a | M3b | M4 | M5a | M5b | M5c | M6a | M6b | |
| ρ | 3.4 (1.2) | 3.4 (1.2) | 3.3 (1.2) | 3.2 (1.1) | 3.2 (1.1) | 3.2 (1.1) | 3.2 (1.1) | 3.7 (1.3) | 3.2 (1.1) | 3.7 (1.3) |
| ε | −3.7 (1.6) | −3.7 (1.5) | −3.6 (1.5) | −3.4 (1.5) | −3.5 (1.4) | −3.4 (1.4) | −3.5 (1.4) | −4.0 (1.7) | −3.4 (1.3) | −4.0 (1.7) |
| b | −0.2 (0.5) | −0.2 (0.5) | −0.04 (0.6) | −0.05 (0.5) | −0.06 (0.5) | −0.07 (0.5) | −0.13 (0.5) | −0.08 (0.5) | −0.15 (0.5) | |
| π | 0.5 (0.8) | 0.15 (0.7) | 0.13 (1.0) | 0.18 (0.7) | 0.04 (0.7) | 0.17 (1.1) | 0.16 (0.9) | |||
| κ | 1.7 (1.3) | 1.2 (0.8) | 1.1 (0.7) | 1.1 (0.8) | 1.2 (0.8) | 1.1 (1.0) | 1.0 (0.7) | |||
| πMPH | 0.08 (1.2) | 0.09 (1.5) | −0.19 (1.2) | |||||||
| κ MPH-selective | 0.09 (0.8) | 0.22 (1.1) | ||||||||
| κ MPH-diffuse | −5.9 (0.7) | −5.7 (0.5) | ||||||||
Appendix 5—table 2
Untransformed top-level parameter means (SD).
| Base models | Extended MPH models | |||||||||
|---|---|---|---|---|---|---|---|---|---|---|
| M1 | M2 | M3a | M3b | M4 | M5a | M5b | M5c | M6a | M6b | |
| ρ | 3.4 (0.2) | 3.4 (0.2) | 3.3 (0.2) | 3.2 (0.16) | 3.2 (0.15) | 3.2 (0.15) | 3.2 (0.15) | 3.7 (0.18) | 3.2 (0.15) | 3.7 (0.17) |
| ε | −3.7 (0.2) | −3.7 (0.2) | −3.5 (0.2) | −3.4 (0.19) | −3.4 (0.19) | −3.4 (0.19) | −3.4 (0.19) | −4.0 (0.22) | −3.3 (0.18) | −3.9 (0.22) |
| b | −0.2 (0.1) | −0.2 (0.1) | −0.04 (0.07) | −0.05 (0.06) | −0.06 (0.06) | −0.07 (0.06) | −0.13 (0.06) | −0.08 (0.06) | −0.15 (0.06) | |
| π | 0.5 (0.1) | 0.15 (0.09) | 0.13 (0.12) | 0.18 (0.09) | 0.04 (0.09) | 0.17 (0.13) | 0.16 (0.11) | |||
| κ | 1.65 (0.21) | 1.2(0.15) | 1.1 (0.14) | 1.1 (0.17) | 1.16 (0.15) | 1.09 (0.18) | 1.00 (0.13) | |||
| πMPH | 0.08 (0.14) | 0.09 (0.17) | −0.19 (0.14) | |||||||
| κ MPH-selective | 0.09 (0.19) | 0.22 (0.25) | ||||||||
| κ MPH-diffuse | −5.9 (0.24) | −5.7 (0.21) | ||||||||
Appendix 5—table 3
Confidence/probability that top-level parameter is larger than 0.
| Base models | Extended MPH models | |||||||||
|---|---|---|---|---|---|---|---|---|---|---|
| M1 | M2 | M3a | M3b | M4 | M5a | M5b | M5c | M6a | M6b | |
| ρ | 1.00 | 1.00 | 1.00 | 1.00 | 1.00 | 1.00 | 1.00 | 1.00 | 1.00 | 1.00 |
| ε | 0.00 | 0.00 | 0.00 | 0.00 | 0.00 | 0.00 | 0.00 | 0.00 | 0.00 | 0.00 |
| b | 0.00 | 0.00 | 0.29 | 0.17 | 0.13 | 0.12 | 0.01 | 0.09 | 0.01 | |
| π | 1.00 | 0.96 | 0.87 | 0.98 | 0.70 | 0.91 | 0.91 | |||
| κ | 1.00 | 1.00 | 1.00 | 1.00 | 1.00 | 1.00 | 1.00 | |||
| πMPH | 0.72 | 0.71 | 0.09 | |||||||
| κ MPH-selective | 0.67 | 0.81 | ||||||||
| κ MPH-diffuse | 0.00 | 0.00 | ||||||||
Additional files
-
Source code 1
Source code for behavioural analysis.
This zip-file contains source code for (1) deblinding, (2) descriptives & demographics, (3) mood ratings, (4) motivational Go-NoGo task, and a README.txt file with description of the source code and code structure.
- https://doi.org/10.7554/eLife.22169.019
Download links
A two-part list of links to download the article, or parts of the article, in various formats.
Downloads (link to download the article as PDF)
Open citations (links to open the citations from this article in various online reference manager services)
Cite this article (links to download the citations from this article in formats compatible with various reference manager tools)
Catecholaminergic challenge uncovers distinct Pavlovian and instrumental mechanisms of motivated (in)action
eLife 6:e22169.
https://doi.org/10.7554/eLife.22169


