Young adult born neurons enhance hippocampal dependent performance via influences on bilateral networks
- Boston University, United States
- McGovern Institute, United States
- Massachusetts Institute of Technology, United States
Figures
Figure 1
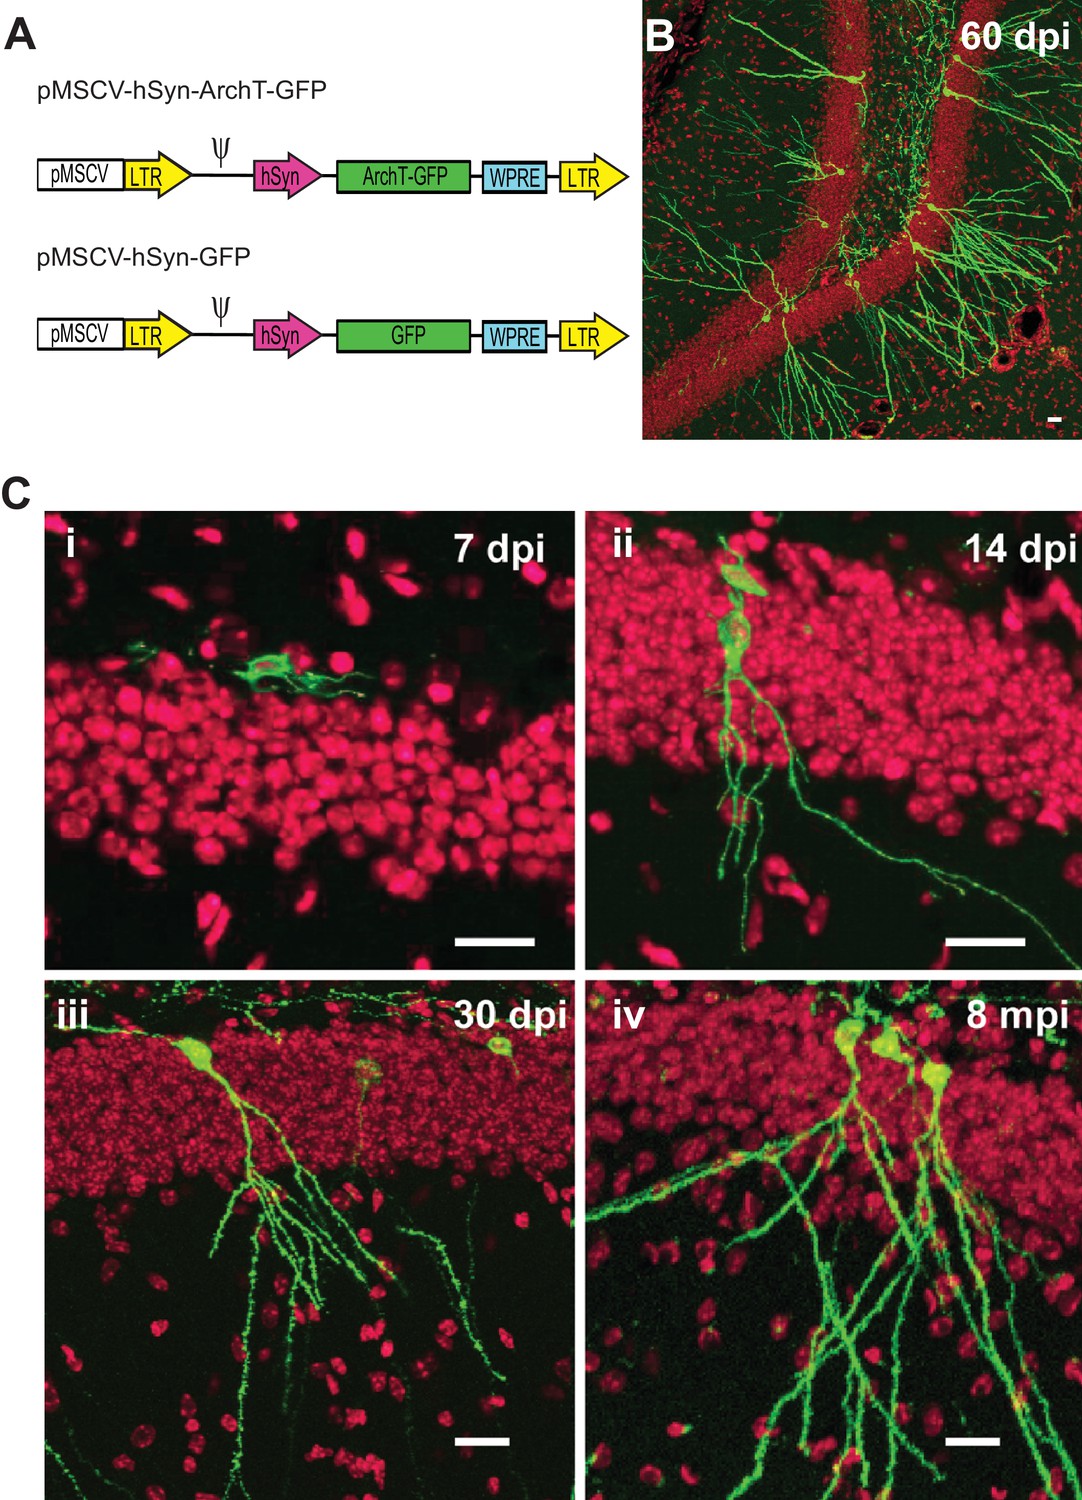
Selective labeling of age-defined abDGCs with the optogenetic silencer ArchT using retrovirus.
(A) The schematics of the retroviral vectors (LTR: long terminal repeats; ψ: psi virus packaging sequence). (B) ArchT-GFP fluorescence in labeled abDGCs in the DG of an adult mouse, examined at 60 days post-injection (dpi). (C) ArchT-GFP fluorescence in labeled abDGCs examined at (i) seven dpi, (ii) 14 dpi, (iii) 30 dpi, and (iv) eight months post-injection. (Scale bar, 20 µm; green: ArchT-GFP fluorescence; red: TO-PRO-3 nuclei stain.).
Figure 2
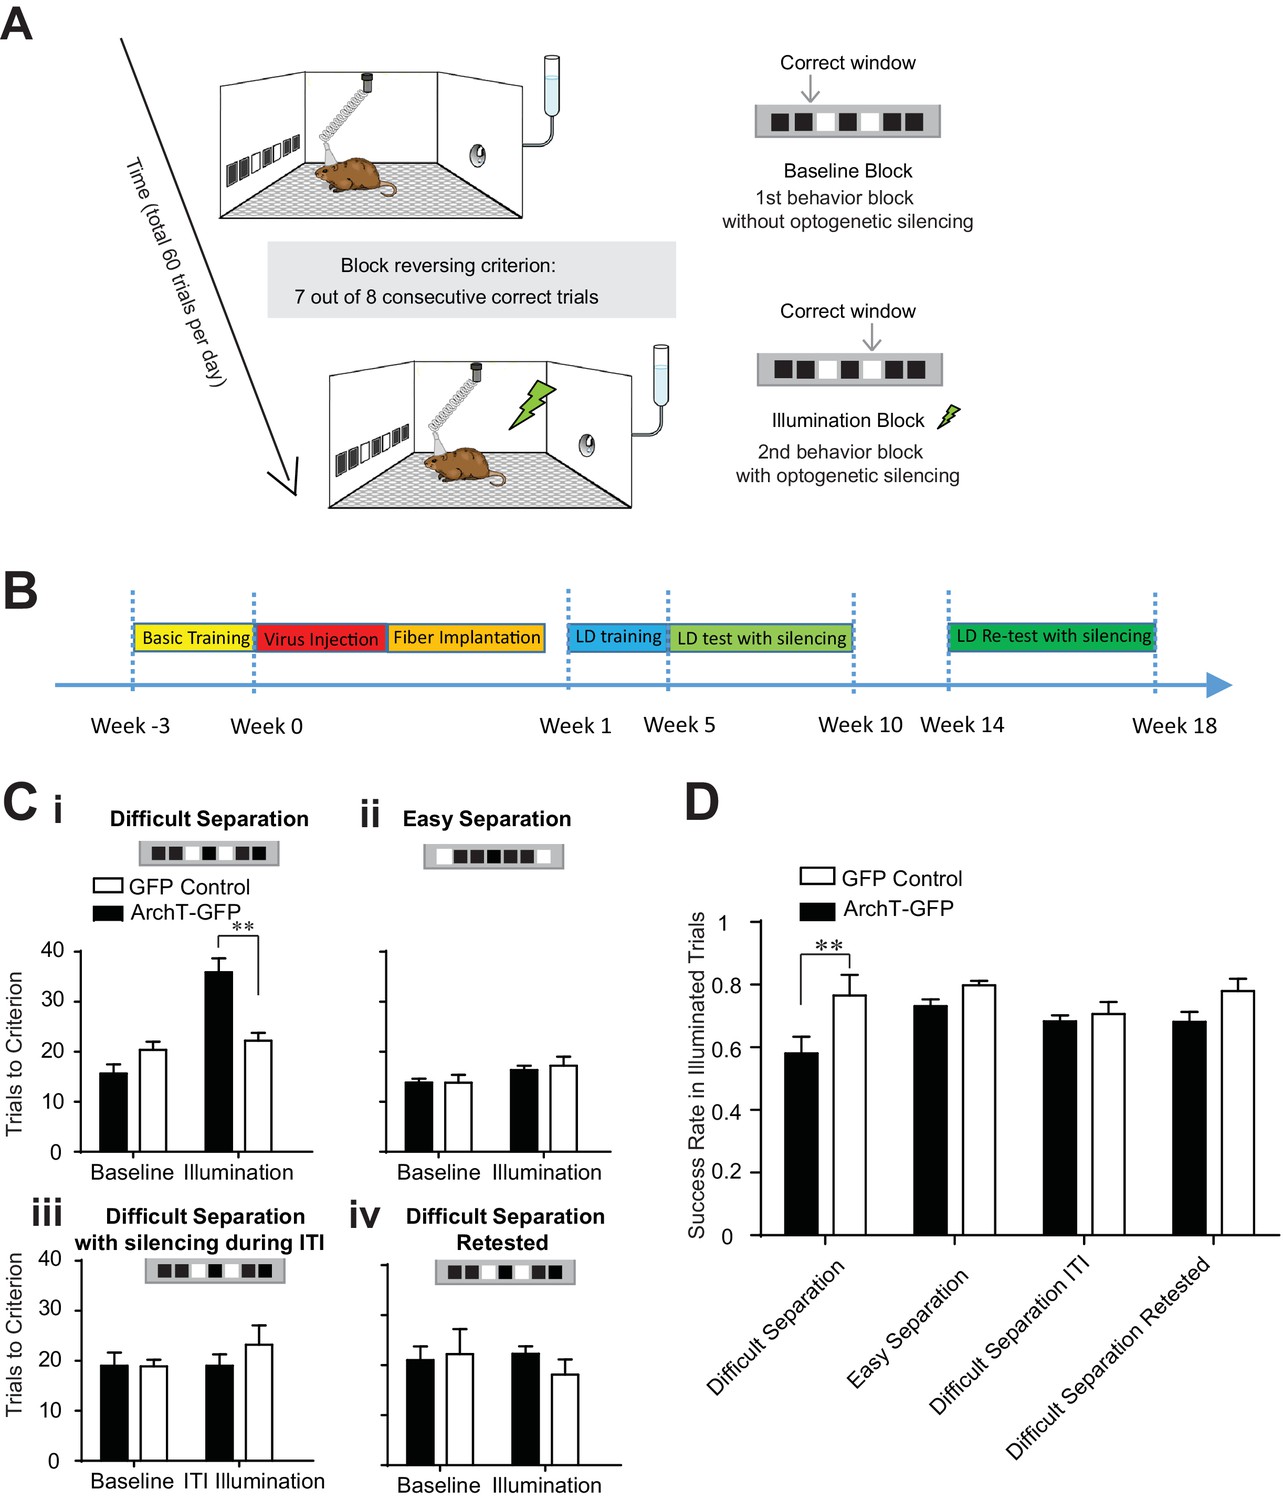
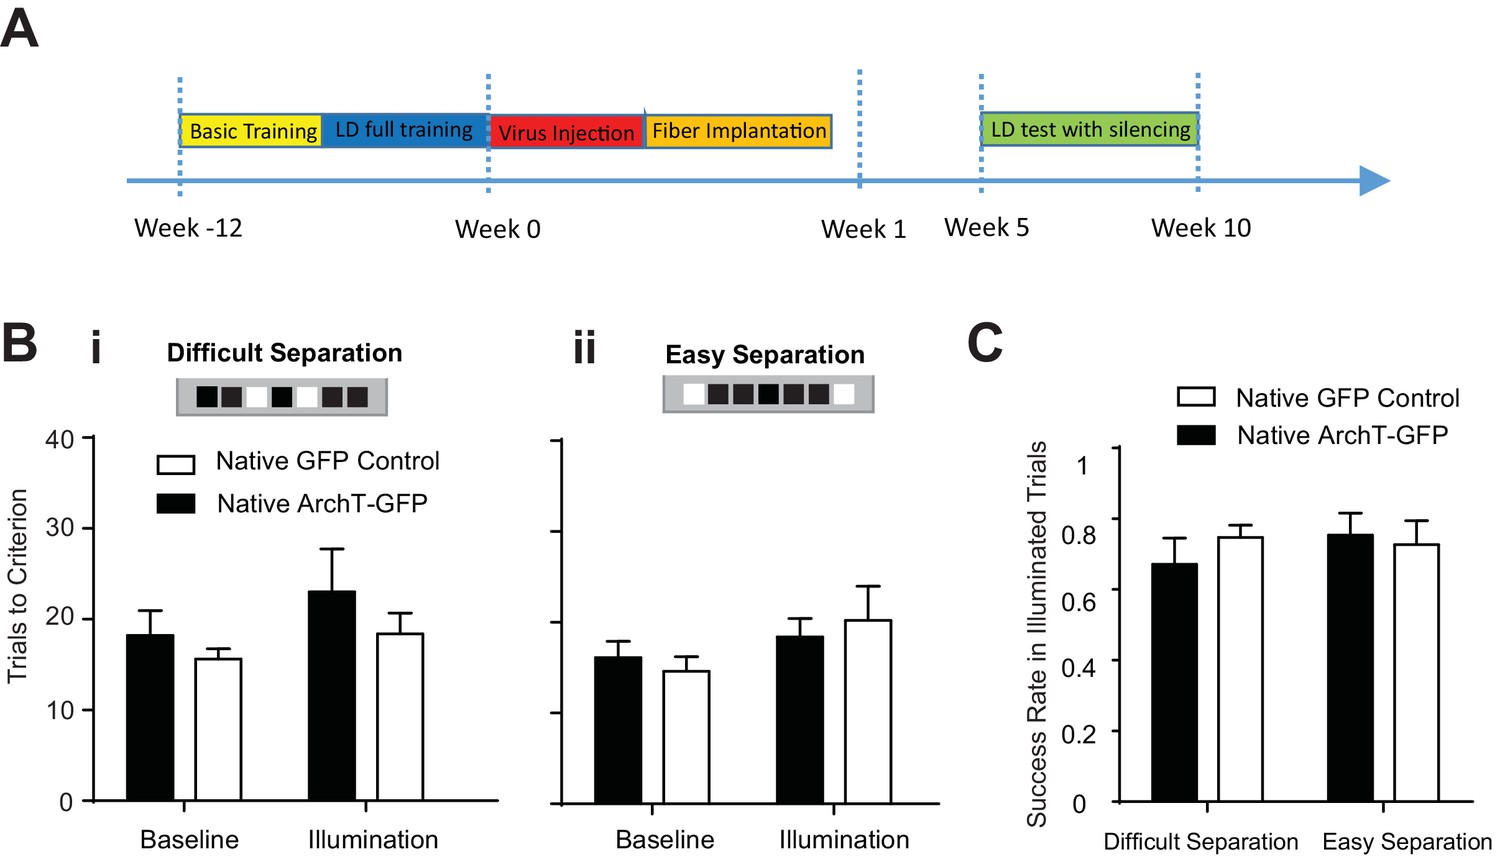
Transient optogenetic silencing of young abDGCs impaired behavioral performance and online information processing during location discrimination (LD).
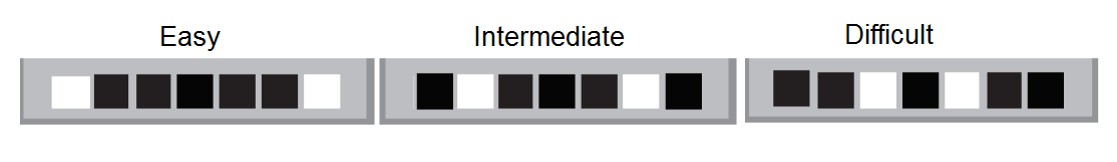
(A) Illustration of the LD task. The rewarded window was reversed when a mouse reached criterion performance in a given block. (B) Experimental timeline. (C) Behavioral performance measured as the number of trials to reach criterion in the baseline blocks and the laser illumination blocks, in the ArchT-GFP group and the GFP-control group, performing the difficult separation condition (i): [repeated measures two-way ANOVA, significant illumination effect: F1,10 = 18.76, p<0.01; significant group effect F1,10 = 6.28, p<0.05; significant mice group × illumination interaction: F1,10 = 13.14, p<0.01; Post hoc Bonferroni tests: ArchT-GFP vs. GFP-control groups for illumination blocks: p<0.01; for baseline blocks: p>0.05], (ii) the easy separation condition, (iii) the difficult separation condition with optogenetic silencing during ITI, and (iv) the difficult separation condition during retest. Only the ArchT-GFP group’s performance was impaired coincident with optogenetic silencing, and only in the difficult separation condition during the 5–10 week window. (D) The success rate achieved by various experimental conditions, calculated for trials where laser illumination was delivered. The success rate was significantly decreased in the ArchT-GFP group performing the difficult separation compared to the control group. [Repeated measure two-way ANOVA, significant group effect: F1,8 = 11.50, p<0.01; Post hoc Bonferroni tests: ArchT-GFP vs. GFP-control groups for initial difficult separation: p<0.01; for the re-test: p>0.05]. **p<0.01. Error bars indicate.
Figure 3
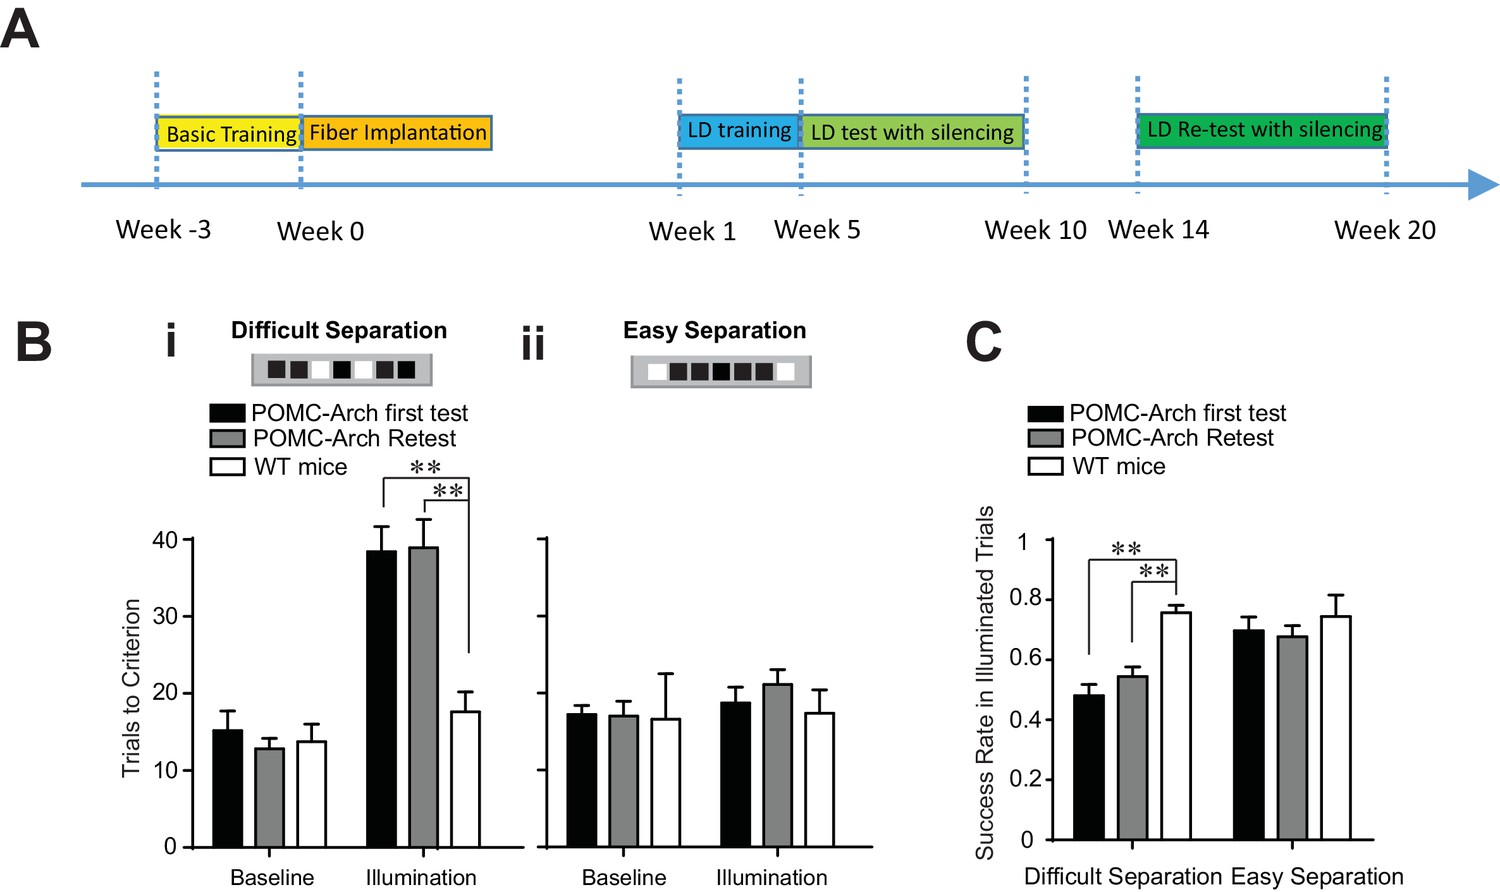
Optogenetic silencing of the DG in POMC-Arch transgenic mice impaired behavioral performance in the location discrimination task.
(A) Experiment timeline (B) Behavioral performance measured in the POMC-Arch transgenic group (n = 5) and the WT control group (n = 4), in the baseline blocks and the laser illumination blocks, for the difficult separation condition (i) and the easy separation condition (ii) [Two-way ANOVA, significant illumination effect: F2,11 = 46.05, p<0.001; significant group effect: F1,11 = 10.30, p<0.01; significant mice group × illumination interaction: F2,11 = 6.63, p<0.05; Post hoc Bonferroni tests for either first test or retest: POMC-Arch vs. control groups for illumination blocks: p<0.01; for baseline blocks: p>0.05, and the easy separation condition, Ps > 0.05]. (C) The success rate for trails with laser illumination was significantly decreased in the difficult separation condition in the POMC-Arch group during both the first test and the retest, compared to the control group [Two-way ANOVA, significant illumination effect: F1,11 = 6.82, p<0.05; significant group effect: F2,11 = 13.39, p<0.01; Post hoc Bonferroni tests for either first test or retest: POMC-Arch vs. control groups for difficult separation: p<0.01; for easy separation: p>0.05]. **p<0.01. Error bars indicate standard errors of mean (S.E.M.).
Figure 4
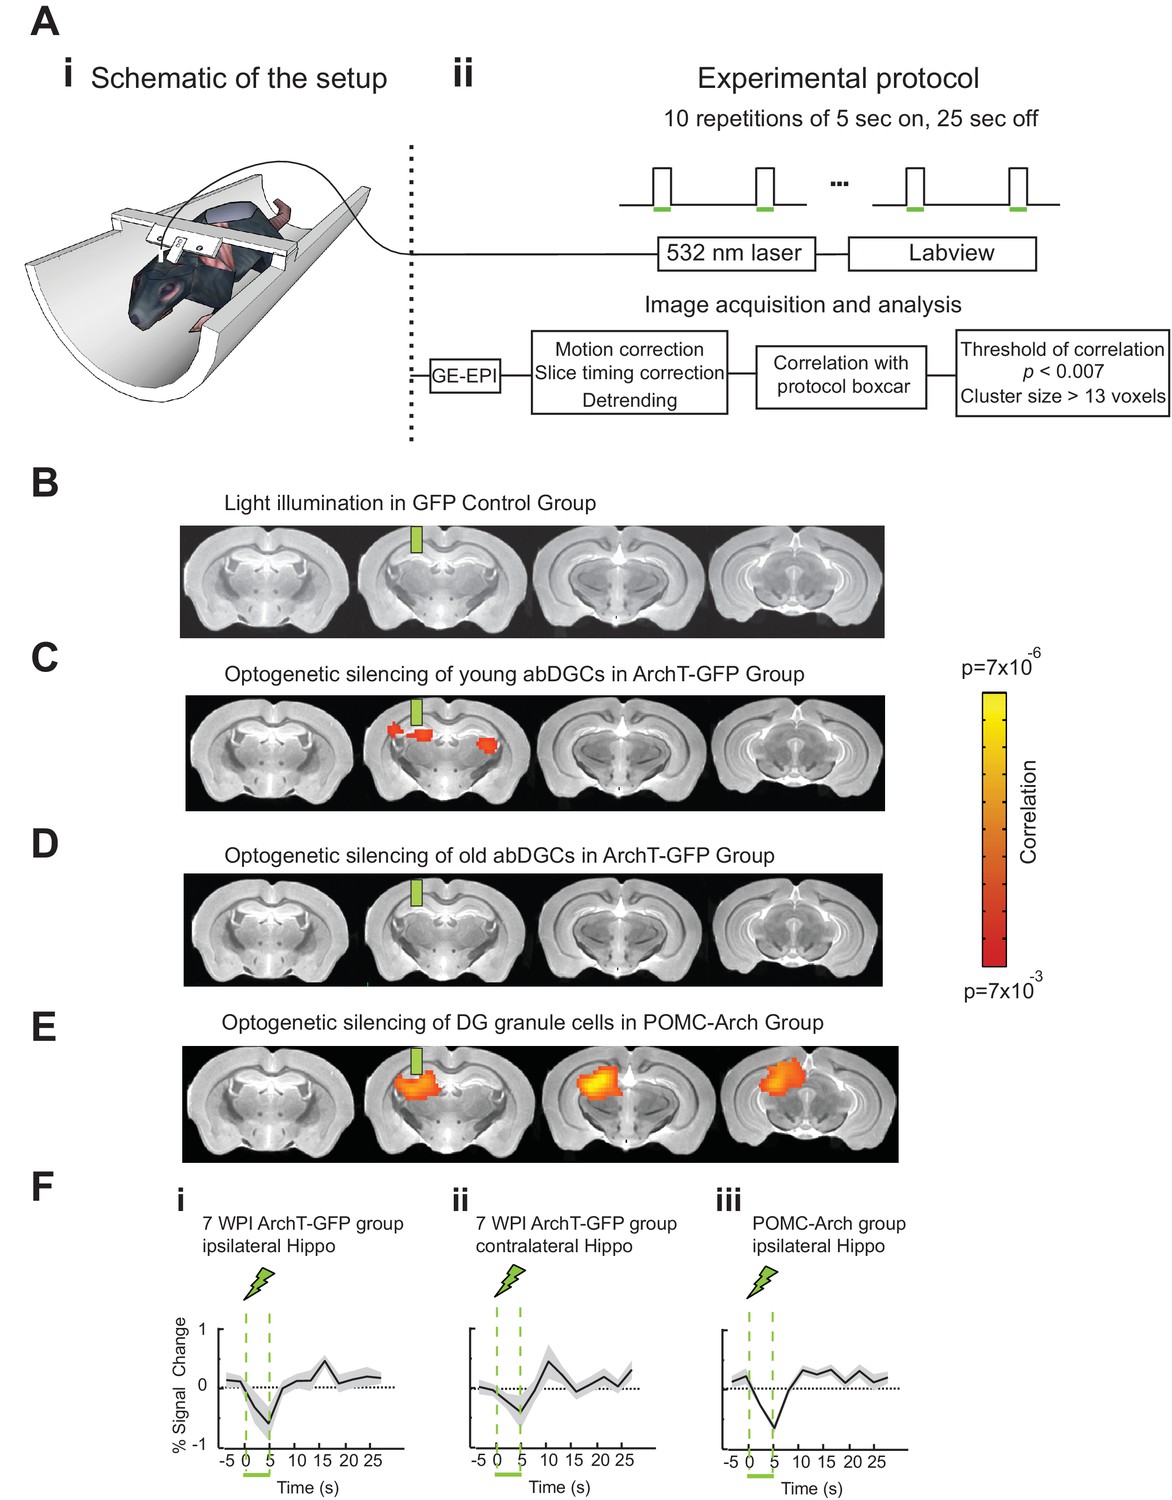
AbDGCs effectively modulated BOLD signals in bilateral hippocampus at seven week maturation.
(A) Opto-fMRI experimental set-up (i) and imaging protocol (ii). (B) No voxels showed changes upon light illumination in the right DG, in GFP-control mice (n = 7 mice). (C) Voxels showed significant BOLD signal changes upon optogenetic silencing of young abDGCs (seven week maturation) in the right DG (n = 8 mice). BOLD signals were aligned to the standard mouse atlas. Color indicates the correlation P value for each voxel. (D) No voxels showed changes upon optogenetic silencing of older abDGCs (16 week maturation, n = 8 mice, same animals as in C). (E) A lager area is affected by optogenetic silencing of the DG in POMC-Arch transgenic mice, including both developmental-born and adult-born DGCs (n = 5 mice). (F) Time courses extracted from the affected voxels of (i) ipsilateral and (ii) contralateral hippocampus of ArchT-GFP group at 7wpi, and (iii) ipsilateral hippocampus of the POMC-Arch group. Green bars indicate the locations of implanted optical fibers.
Figure 5

Silencing of young abDGCs led to LFP changes in the contralateral CA1 region.
(Ai) Experimental set up illustrating an optical fiber (green line, a) positioned in the DG where abDGCs were virally labeled, and a 16-channel electrode probe (b) in the contralateral hippocampus at a 30 degree angle. (Aii) A representative histological image showing the position of the electrode track in the hippocampus (highlighted with the red box). Cell bodies were labeled with Nissl straining. (B) Example LFPs recorded from each of the 16 electrode contacts from the brain surface to the CA3. (C) (D) Normalized spectrograms of the LFPs recorded in a control MSCV-GFP virus injected mouse (Ci) and in a MSCV-ArchT-GFP virus injected mouse (Di), and the averaged LFP powers (Cii, and Dii) before (black trace), and during light stimulation in the cortex (blue), the CA1 (red), and the CA3 (orange).
Figure 6
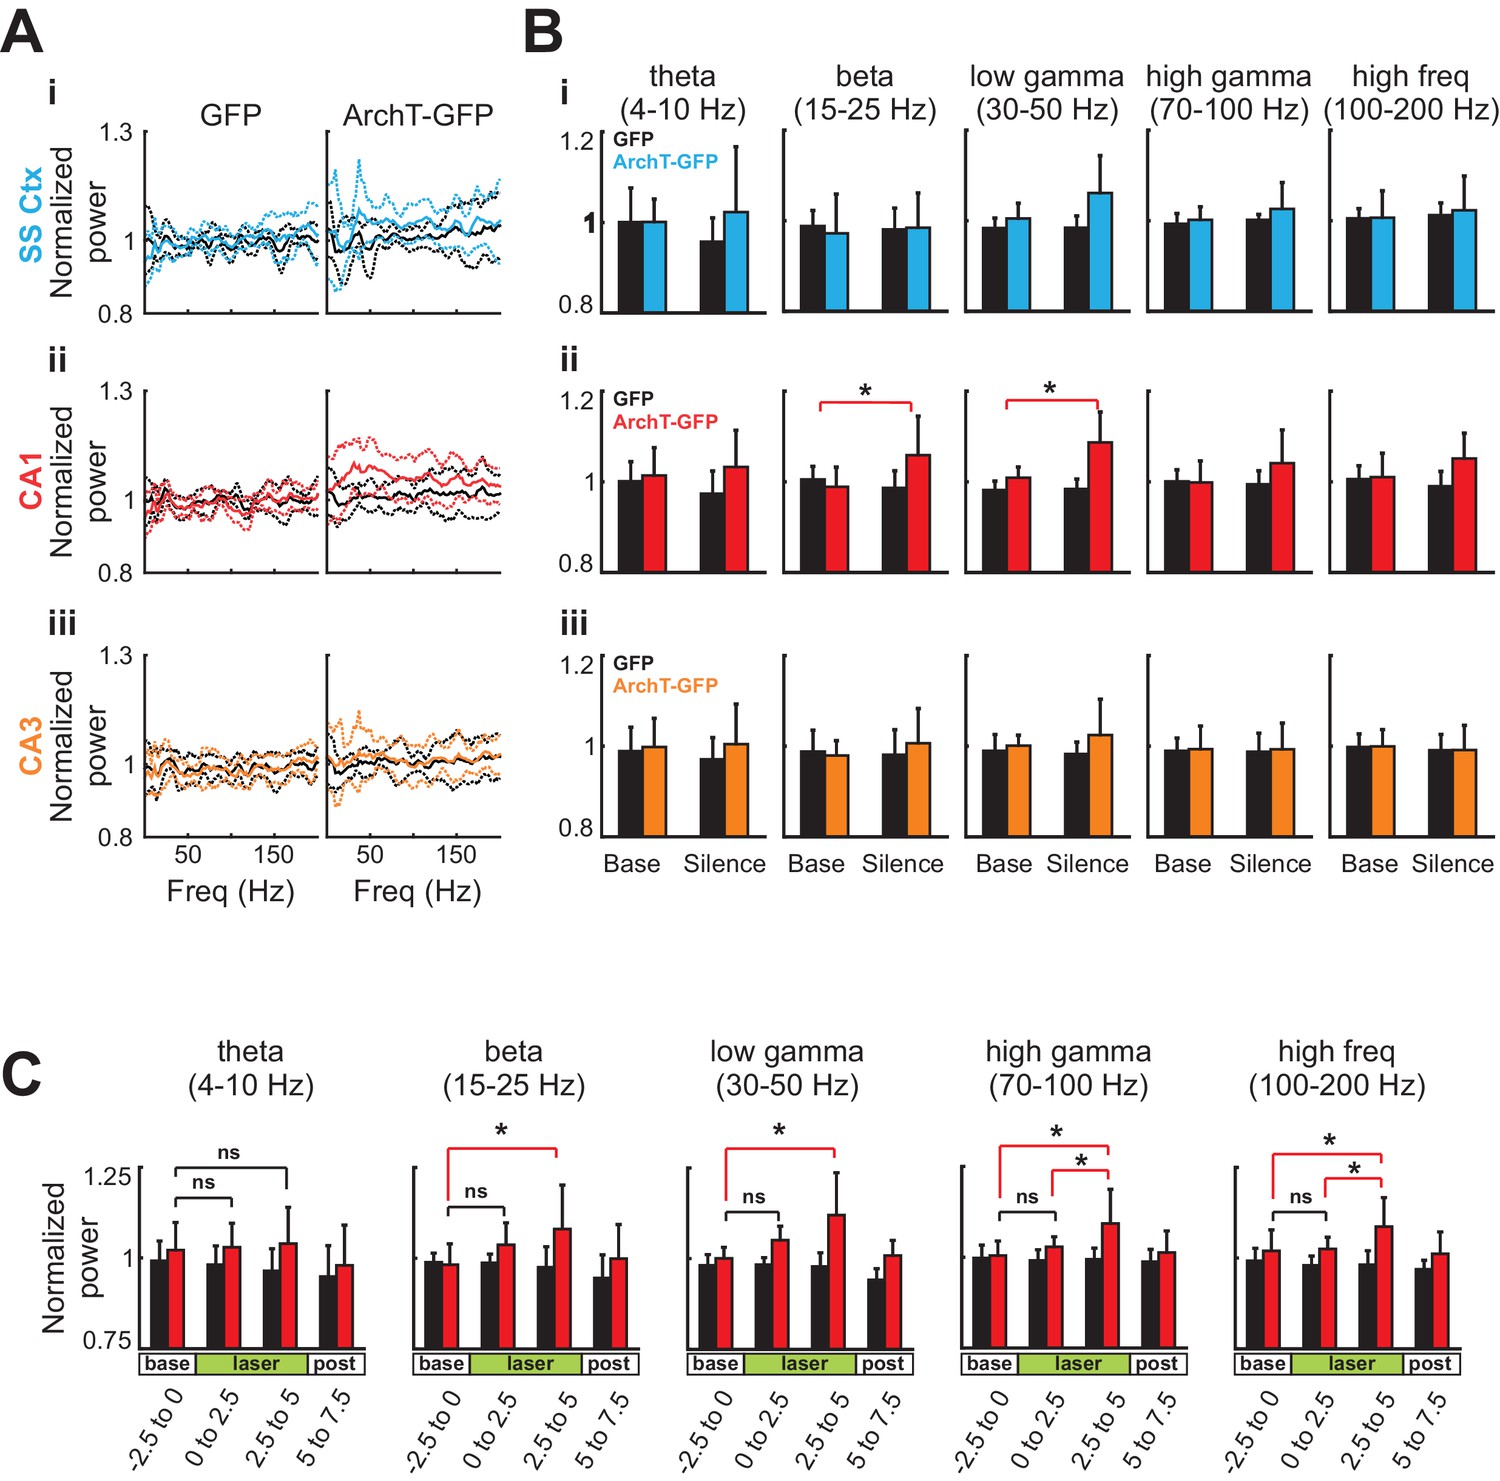
Silencing of young abDGCs produces a slow and gradual increase in LFP power across several frequency bands localized to CA1.
(A) The average normalized power of LFP at different frequencies during the baseline period (black) and during light stimulation in the somatosensory cortex (Ai:blue), the CA1 (Aii:red), and the CA3 (Aiii:orange) in the GFP group (N = 5 mice) and the ArchT-GFP group (N = 8 mice). The solid lines indicate the mean, and the dashed lines are mean ± S.D. (B) Averaged LFP powers at various frequency ranges before and during light stimulation. Light stimulation increased LFP power significantly at beta (15–25 Hz) and low gamma (30–50 Hz) ranges, but only in the CA1 region (Aii:red). Beta: t1,7 = 3.43, p=0.01; low gamma: t1,7 = 3.91, p<0.01; high gamma: t1,7 = 1.97, p=0.09; high frequency: t1,7 = 2.12, p=0.07: (*p<0.05). Error bars are standard deviation (S.D.). (C) Averaged LFP power across frequency bands for CA1 before, during, and following optogenetic silencing. Light stimulation produced no significant increases in LFP power in the first 2.5 s of stimulation (ns). Significant increases in LFP power were present in the final 2.5 s of silencing at beta (15–25 Hz) low gamma (30–50 Hz), high gamma, (70–100 Hz), and high frequency (100–200 Hz) ranges: Beta: t1,7 = 3.16, p=0.01; low gamma: t1,7 = 2.90, p=0.02; high gamma: t1,7 = 2.47, p=0.04; and high frequency: t1,7 = 2.78, p=0.03: p<0.05, ns = non-significant. Error bars are standard deviation (S.D.).
Figure 7
Learning influenced abDGCs impact on location discrimination.
(A) Experimental timeline. (B) Behavioral performance measured as trials to criterion in the baseline blocks and the laser illumination blocks, in naïve ArchT-GFP group (n = 6) and naïve GFP-control group (n = 5) performing (i) the difficult separation condition, and (ii) the easy separation condition. No significant difference was detected between groups [Difficult separation: repeated measure two-way ANOVA, illumination effect: F1,8 = 0.74, p=0.41; group effect: F1,8 = 0.31, p=0.60; mice group × illumination interaction: F1,8 = 3.16, p=0.12]. (C) There are no differences in success rates for naïve ArchT-GFP group and naïve GFP-control group performing either difficult separation or easy separation (Repeated measures two-way ANOVA, p>0.05). Error bars represent standard errors of mean (S.E.M.).
Author response image 1
Tables
Table 1
ArchT-GFP cell label counts for abDGCs across different experimental groups.
Group | GFP positive neurons per DG |
|---|---|
Mice analyzed at 10 weeks post ArchT-GFP retroviral injection (n = 5) | 334 ± 43 |
Longitudinal mice group analyzed at 18 weeks post ArchT-GFP retroviral injection (n = 5) | 297 ± 27 |
Naïve mice group analyzed at 10 weeks post ArchT-GFP retroviral injection (n = 5) | 264 ± 40 |
Download links
A two-part list of links to download the article, or parts of the article, in various formats.
Downloads (link to download the article as PDF)
Open citations (links to open the citations from this article in various online reference manager services)
Cite this article (links to download the citations from this article in formats compatible with various reference manager tools)
Young adult born neurons enhance hippocampal dependent performance via influences on bilateral networks
eLife 5:e22429.
https://doi.org/10.7554/eLife.22429


