Transient oxytocin signaling primes the development and function of excitatory hippocampal neurons
- Max Planck Institute of Experimental Medicine, Germany
- University of Milan-Bicocca, Italy
- Institute of Cell Biology and Neurobiology, Charité-Universitätsmedizin, Germany
- NeuroMi - Milan Center for Neuroscience, Italy
- University of Pavia, Italy
- Graduate School of Agricultural Science, Tohoku University, Japan
Figures
Figure 1 with 3 supplements
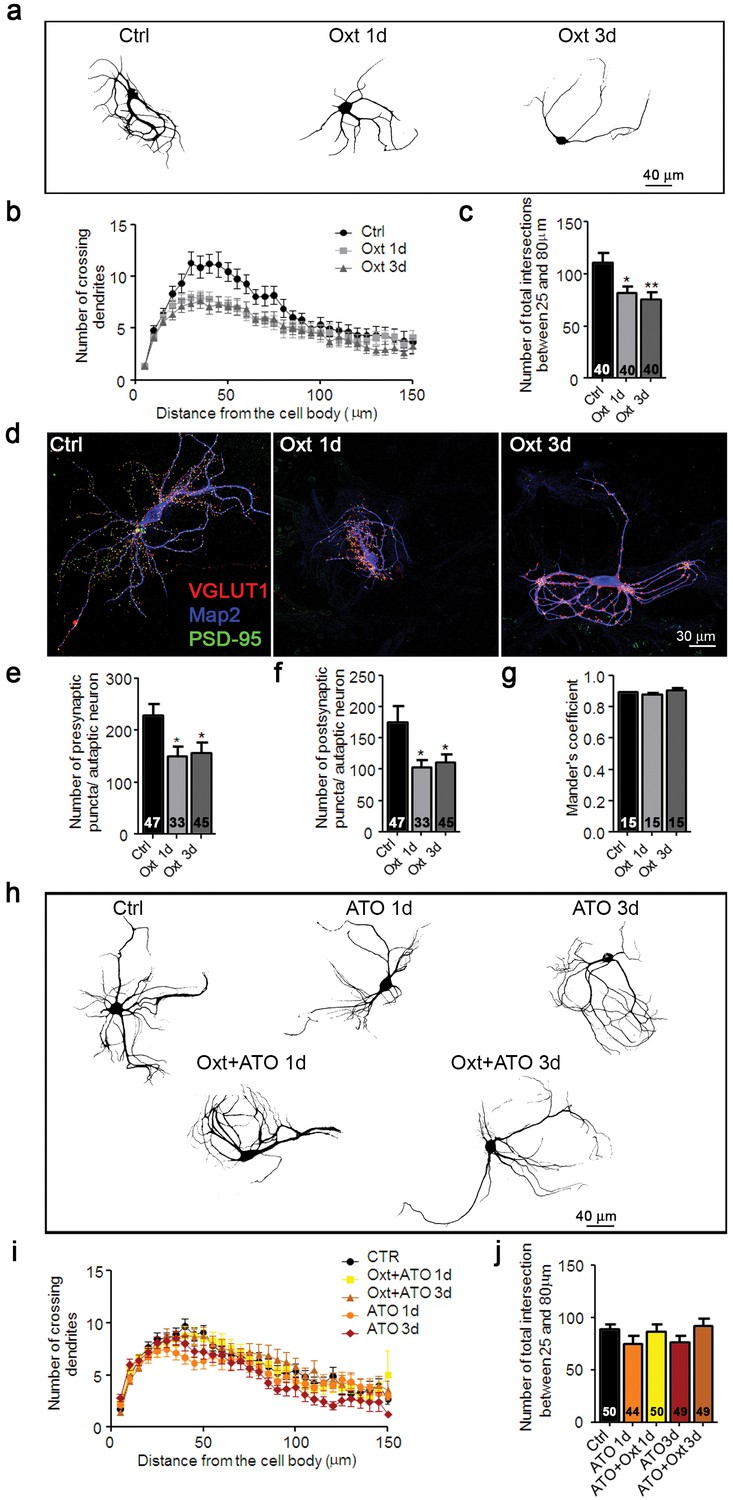
Oxt-treatment impairs dendrite development and reduces synapse numbers in glutamatergic autaptic hippocampal neurons.
(a) Representative binary images of neurons that had been exposed to 100 nM Oxt for 1 (Oxt 1d) or 3 days (Oxt 3d) after plating and immunostained at 14DIV using an anti-Map2 antibody. (b) Sholl analysis of Ctrl neurons and neurons treated with Oxt 1d or Oxt 3d. Numbers of cells for quantification are shown in panel (c). (c) Average numbers of dendrites intersecting Sholl circles at 25–80 μm distance from the cell body in Ctrl neurons and neurons treated with Oxt 1d or Oxt 3d (*p<0.05, Ctrl vs, Oxt 1d; **p<0.01, Ctrl vs. Oxt 3d). (d) Representative images of Ctrl neurons and neurons treated with Oxt 1d or Oxt 3d, fluorescently stained with antibodies directed against VGLUT1, PSD95, and Map2 at 14DIV. (e and f) Average numbers of VGLUT1-positive glutamatergic presynapses (E), and PSD95-positive postsynapses (F) in Ctrl neurons and neurons treated with Oxt 1d or Oxt 3d (*p<0.05, Ctrl vs. Oxt 1d and Oxt3d). (g) Mander's coefficient measures of overlap between VGLUT1 and PSD95 labeling in Ctrl neurons and neurons treated with Oxt 1d or Oxt 3d. (h) Representative binary images of neurons immunofluorescently labeled for Map2 from control cultures (Ctrl) and cultures treated with 100 nM atosiban alone (ATO), or with 100 nM atosiban plus 100 nM Oxt (ATO + Oxt) for 1 day (1d) or 3 days (3d). (i) Sholl analysis of Ctrl neurons and neurons treated with 100 nM ATO, or ATO + Oxt for 1d or 3d. Number of cells are shown in panel (J). (j) Average numbers of dendrites intersecting Sholl circles at 25–80 μm distance from the cell body in Ctrl neurons and neurons treated with 100 nM ATO, or with ATO + Oxt for 1d or 3d. Ctrl, control. Data are shown as mean ± SEM. Numbers of analyzed cells are indicated in the histogram bars. Statistical analyses were performed with one-way ANOVA followed by post-hoc Bonferroni test. See Table in Supplementary file 2.
Figure 1—figure supplement 1
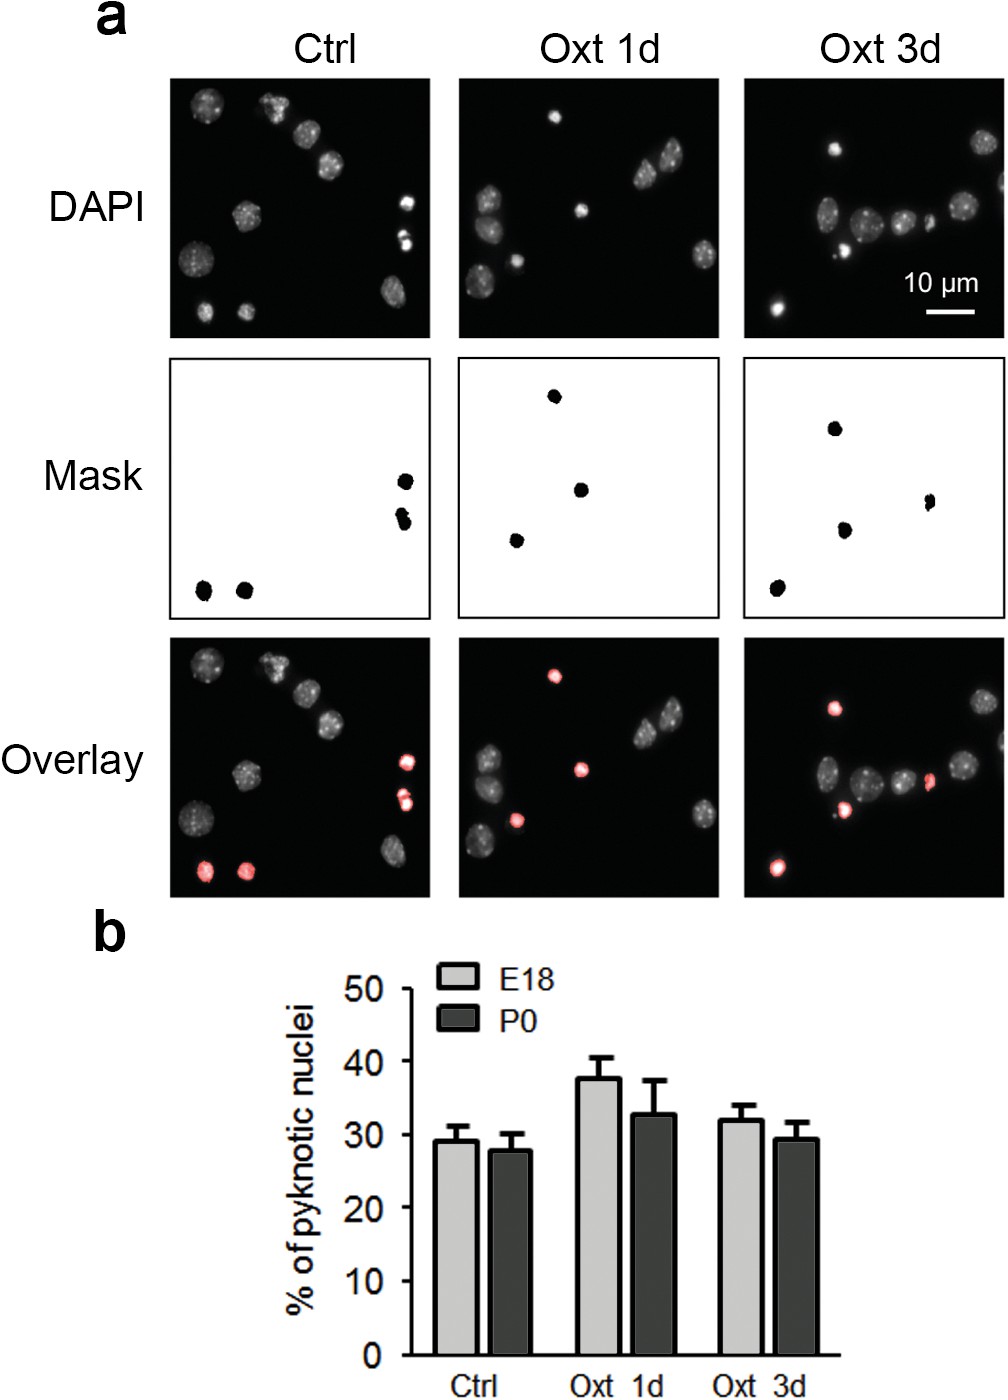
Oxt-treatment does not affect survival of primary hippocampal neurons.
(a) Representative images of DAPI-positive nuclei and binarized pyknotic nuclei (mask) in control (Ctrl) neurons and neurons exposed to Oxt for 1 (Oxt 1d) and 3 days (Oxt 3d). (b) Quantification of the percentage of pyknotic nuclei in control (Ctrl) neurons and neurons exposed to Oxt for 1 (Oxt 1d) and 3 days (Oxt 3d) in hippocampal cultures from E18 and P0 pups. Data are derived from three independent experiments. Each treatment assessed between 4000–5000 cells. Data are shown as means ± SEM. See Table in Supplementary file 2.
Figure 1—figure supplement 2

Oxt-treatment does not alter the dendrite development of GABAergic autaptic hippocampal neurons.
(a) Representative image of an autatic hippocampal GABAergic neuron immunolabled at 14DIV using anti-Map2 (green) and anti-VGAT (red) antibodies. (b) Sholl analysis of control inhibitory neurons (ctrl) and inhibitory neurons treated with Oxt for 1(Oxt 1d) or 3 days (Oxt 3d).
Figure 1—figure supplement 3
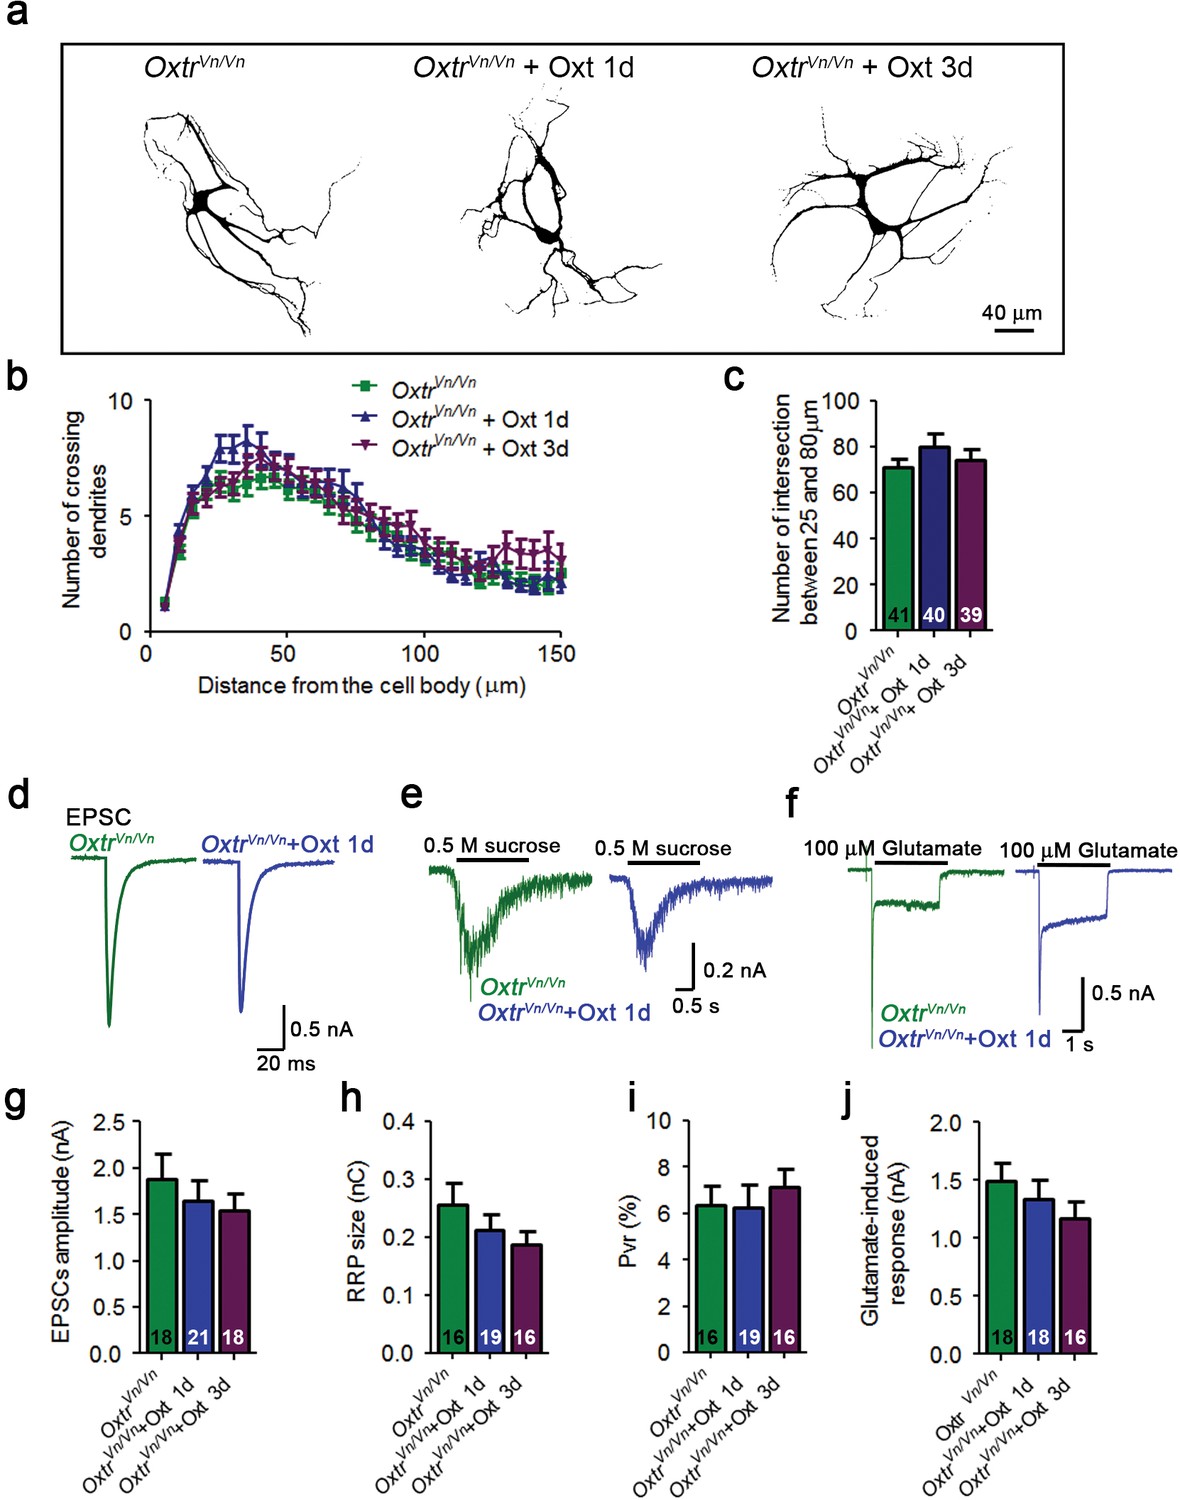
Oxt-treatment does not alter the dendrite development and function of Oxtr- deficient autaptic hippocampal neurons.
(a) Representative binary images of Oxtr-deficient neurons (OxtrVn/Vn) that had been exposed to 100 nM Oxt for 1 (OxtrVn/Vn + Oxt 1d) or 3 days (OxtrVn/Vn + Oxt 3d) after plating and immunostained at 14 DIV using an anti-Map2 antibody. (b) Sholl analysis of control OxtrVn/Vn neurons and OxtrVn/Vn neurons treated with Oxt 1d or Oxt 3d. Numbers of cells used for quantification are shown in panel (c). (c) Average numbers of dendrites intersecting Sholl circles at 25–80 μm distance from the cell body in control OxtrVn/Vn neurons and OxtrVn/Vn neurons treated with Oxt 1d or Oxt 3d. (d–f) Representative traces of evoked EPSCs (d), postsynaptic currents induced by the application of 0.5 M sucrose solution (e) and of responses to exogenous glutamate (100 μM) in glutamatergic autaptic OxtrVn/Vn control neurons and OxtrVn/Vn neurons treated with 100 nM Oxt for 1 day. (g–i) Average values of evoked EPSC amplitudes (g), and RRP size (h) and Pvr (i) in glutamatergic OxtrVn/Vn neurons and OxtrVn/Vn neurons exposed to Oxt for 1 or 3 days. (j) Average amplitudes of EPSCs induced by 100 μM glutamate in glutamatergic autaptic OxtrVn/Vn neurons and OxtrVn/Vn neurons treated with Oxt 1d or Oxt 3d. Data are shown as mean ± SEM.Numbers of analyzed cells are indicated in the histogram bars. See Supplementary file 1 and 2 for further details.
Figure 2 with 5 supplements
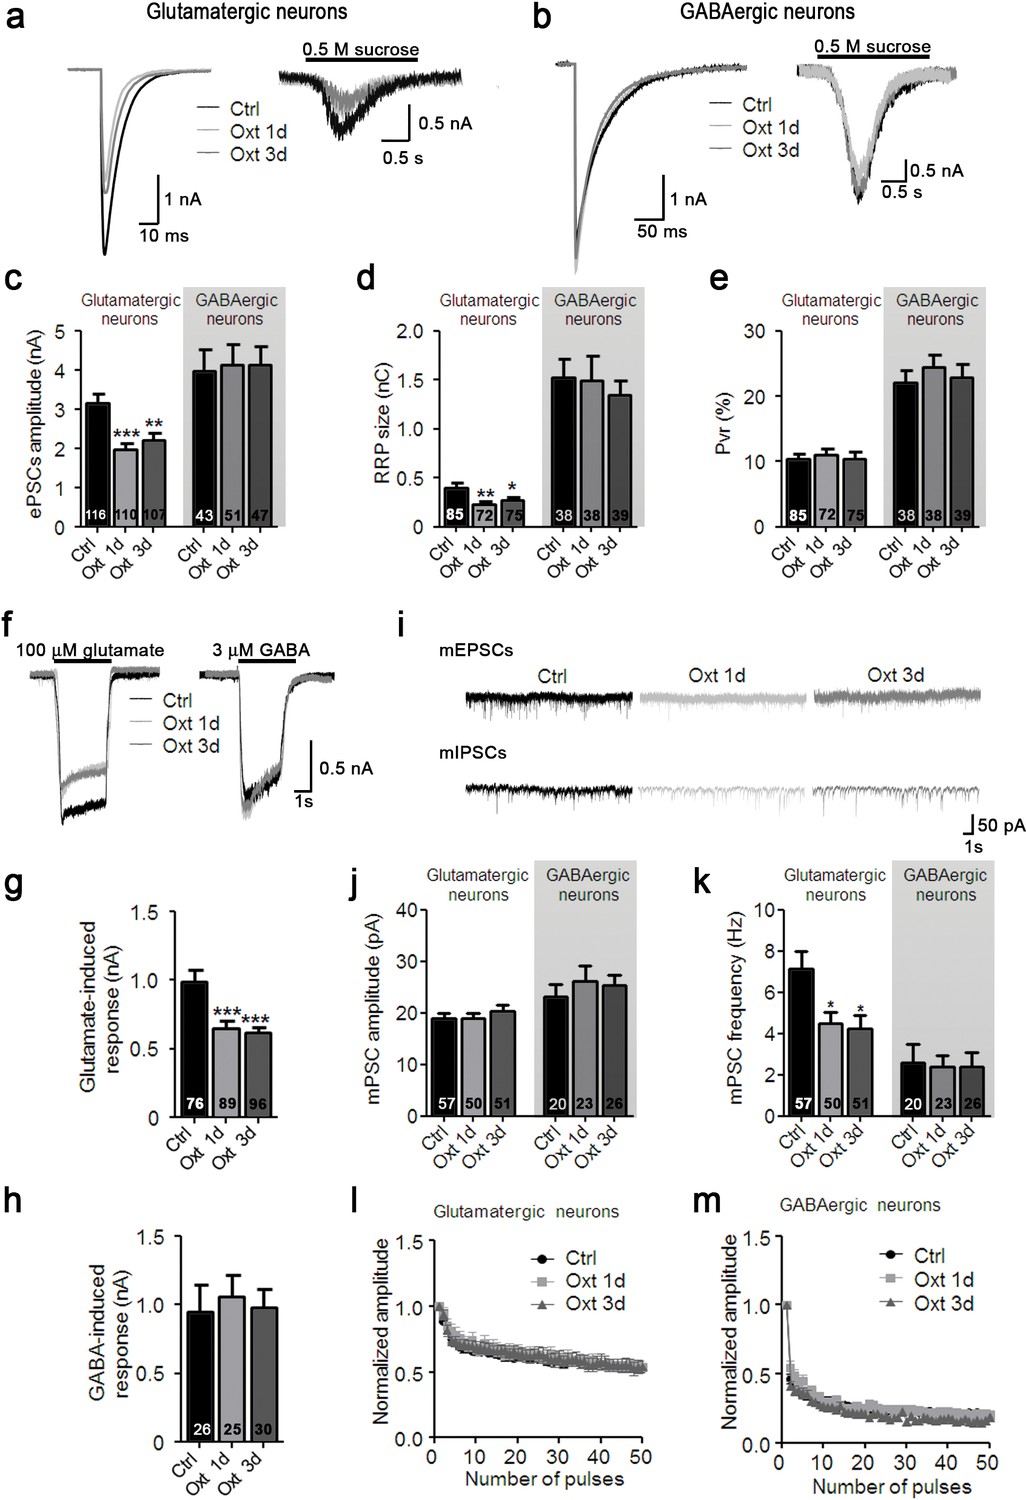
Oxt-treatment reduces evoked and spontaneous glutamatergic synaptic transmission in autaptic hippocampal neurons.
(a) Representative traces of evoked EPSCs (left) and postsynaptic currents evoked by 0.5 M sucrose (right) from control glutamatergic autaptic neurons (Ctrl, black) and from glutamatergic autaptic neurons treated with Oxt for 1 day (Oxt 1d, light grey) or 3 days (Oxt 3d, dark grey). (b) Representative traces of evoked IPSCs (left) and postsynaptic currents evoked by 0.5 M sucrose (right) from control GABAergic autaptic neurons (Ctrl, black) and from GABAergic autaptic neurons treated with Oxt 1d (light grey) or 3d (dark grey). (c–e) Average values of evoked PSC amplitudes (C; **p<0.001, Ctrl vs. Oxt 3d; ***p<0.0001, Ctrl vs. Oxt 1d), (d) apparent readily releasable vesicle pool (RRP) size (**p<0.001, Ctrl vs. Oxt 1d; *p<0.05, Ctrl vs. Oxt 3d), and eE) Pvr in Ctrl neurons and neurons treated with Oxt 1d or Oxt 3d. The RRP was measured as the net charge transferred during application of 0.5 M sucrose solution. (f) Representative traces of responses of glutamatergic neurons to exogenous glutamate (100 μM, left) and of GABAergic neurons to exogenous GABA (3 μM, right). Data are from Ctrl and neurons treated with Oxt 1d or Oxt 3d. (g) Average amplitudes of EPSCs induced by 100 μM glutamate in glutamatergic Ctrl neurons and neurons treated with Oxt 1d or Oxt 3d (***p<0.0001, Ctrl vs. Oxt 1d and Oxt 3d). (h) Average amplitudes of IPSCs induced by 3 μM GABA in GABAergic Ctrl neurons and neurons treated with Oxt 1d or Oxt 3d. (i) Representative traces of mEPSCs (top), and mIPSCs (bottom) from Ctrl neurons and neurons treated with Oxt 1d or Oxt 3d. (j and k) Average mPSC amplitudes (j) and mPSC frequencies (k; *p<0.05, Ctrl vs. Oxt 1d and Oxt 3d) in Ctrl neurons and neurons treated with Oxt 1d or Oxt 3d. (l and m`) Change in EPSC amplitudes (l; Ctrl, n = 49; Oxt 1d, n = 40; Oxt 3d, n = 44) and IPSC amplitudes (m; Ctrl, n = 39; Oxt 1d, n = 35; Oxt 3d, n = 37) during a 10 Hz stimulation train in glutamatergic (l) or GABAergic (m) Ctrl neurons and neurons treated with Oxt 1d or Oxt 3d. Data were normalized to the first response of the respective train. Data are shown as mean ± SEM. Numbers of analyzed cells are indicated in the histogram bars. Statistical analyses were performed with one-way ANOVA followed by post-hoc Bonferroni test. See Table in Supplementary file 1 for further details.
Figure 2—figure supplement 1
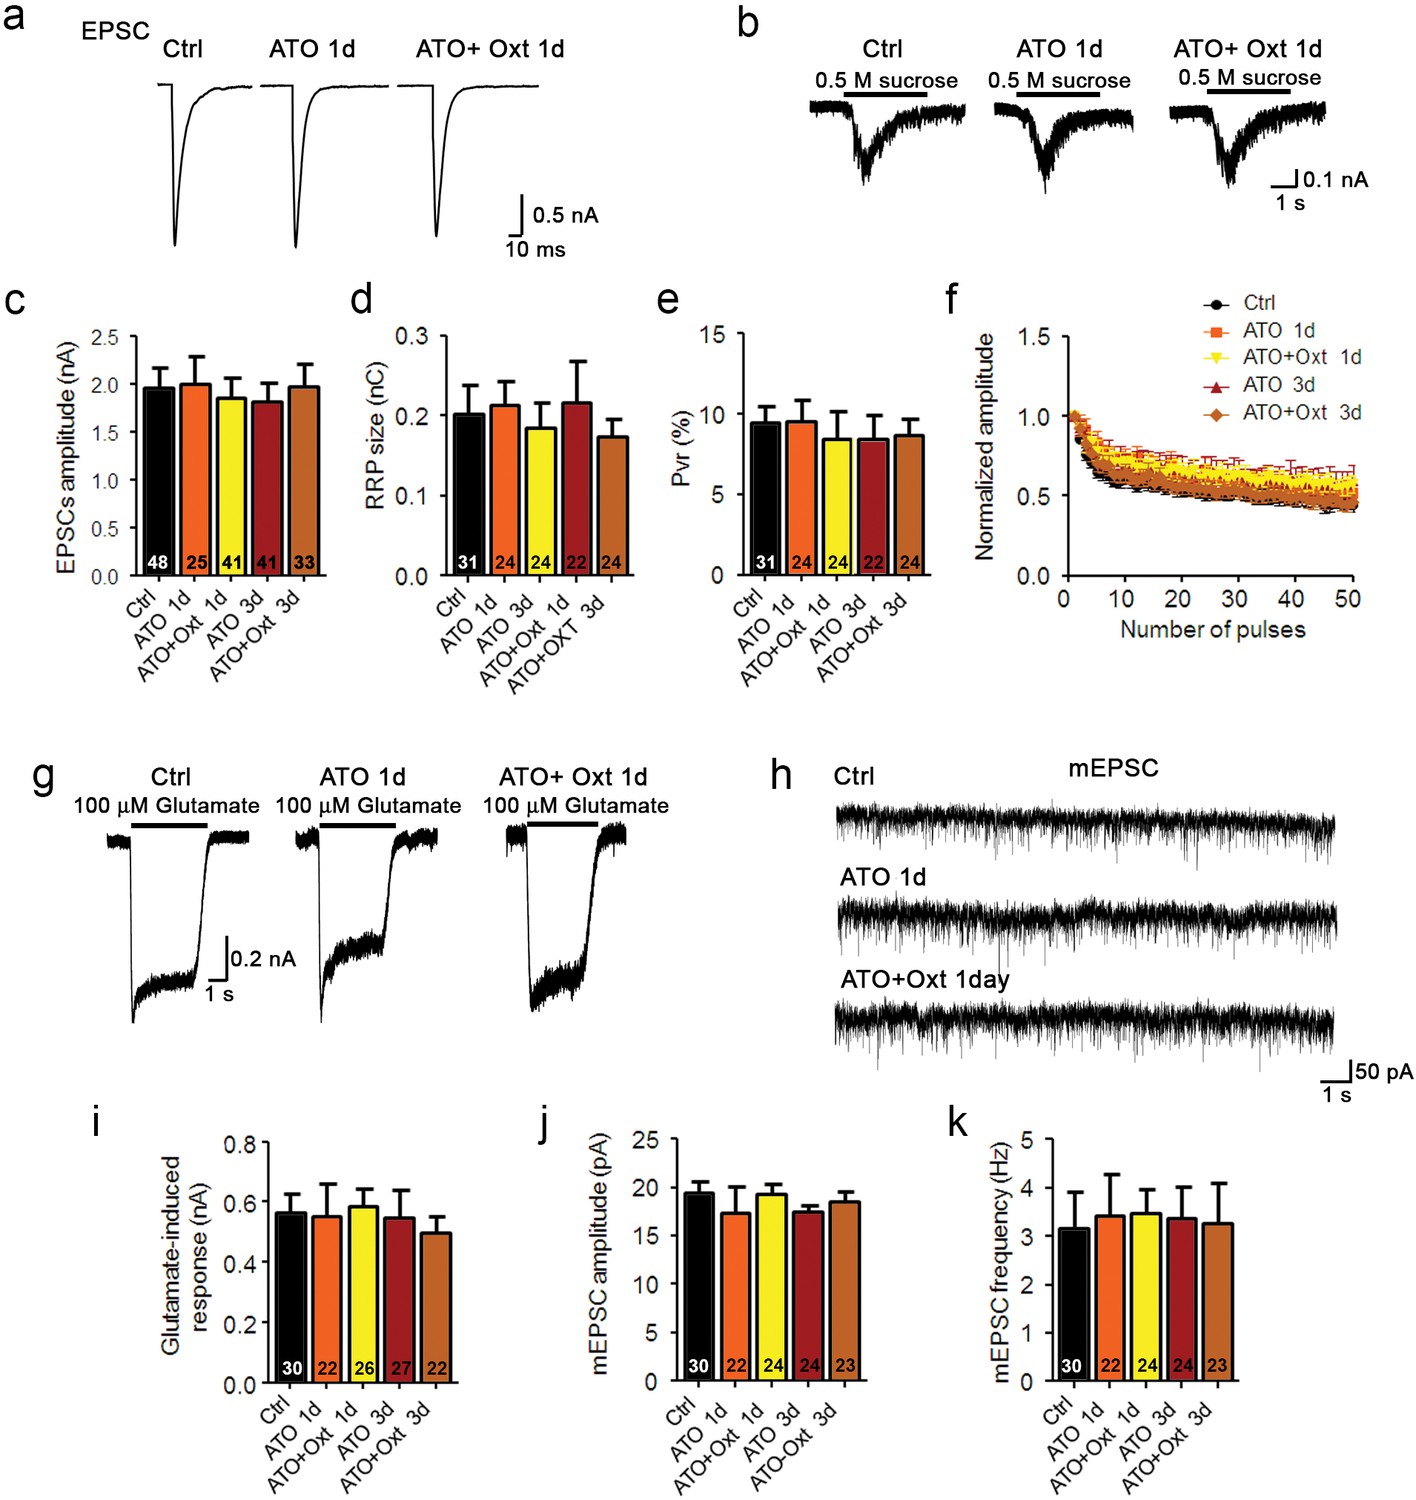
Oxytocin receptor antagonist atosiban abolishes the oxytocin-induced effects on glutamatergic synaptic transmission.
(a and b) Representative traces of evoked EPSCs (a) and postsynaptic currents induced by the application of 0.5 M sucrose solution (b) in glutamatergic autaptic control neurons (Ctrl) and neurons treated with 100 nM atosiban alone (ATO), or with 100 nM atosiban plus 100 nM Oxt (ATO + Oxt) for 1 day (1d) or 3 days (3d). (c–e) Average values of evoked EPSC amplitudes (c), apparent RRP size (d), and Pvr (e). The RRP was measured as the net charge transferred during application of 0.5 M sucrose solution. Pvr was calculated by dividing the charge transferred during the evoked PSC by the charge transferred during sucrose application. (f) Change in EPSC amplitudes during a 10 Hz stimulation train in glutamatergic autaptic control neurons (Ctrl) and neurons treated with 100 nM atosiban alone (ATO), or with 100 nM atosiban plus 100 nM Oxt (ATO + Oxt) for 1 day (1d) or 3 days (3d). Data were normalized to the first response in the respective train (Ctrl, n = 42; ATO 1d, n = 30; ATO+Oxt 1d, n = 38; ATO 3d, n = 37; ATO+Oxt 3d, n = 34). (g) Representative traces of responses to exogenous glutamate (100 μM) in a glutamatergic autaptic control neuron (Ctrl) and neurons treated with 100 nM atosiban alone (ATO), or with 100 nM atosiban plus 100 nM Oxt (ATO + Oxt) for 1 day (1d) or 3 days (3d). (h) Representative traces of mEPSCs in a glutamatergic autaptic control neuron (Ctrl) and neurons treated with 100 nM atosiban alone (ATO), or with 100 nM atosiban plus 100 nM Oxt (ATO + Oxt) for 1 day (1d) or 3 days (3d). (i) Average amplitudes of EPSCs induced by 100 μM glutamate in glutamatergic autaptic control neurons and neurons treated with 100 nM atosiban alone (ATO), or with 100 nM atosiban plus 100 nM Oxt (ATO + Oxt) for 1 day (1d) or 3 days (3d). (j and k) Average mEPSC amplitudes (j) and mEPSC frequencies (k) in glutamatergic autaptic control neurons (Ctrl) and neurons treated with 100 nM atosiban alone (ATO), or with 100 nM atosiban plus 100 nM Oxt (ATO + Oxt) for 1 day (1d) or 3 days (3d). Data are shown as mean ± SEM. Numbers of analyzed cells are indicated in the histogram bars. See also Supplementary file 1.
Figure 2—figure supplement 2
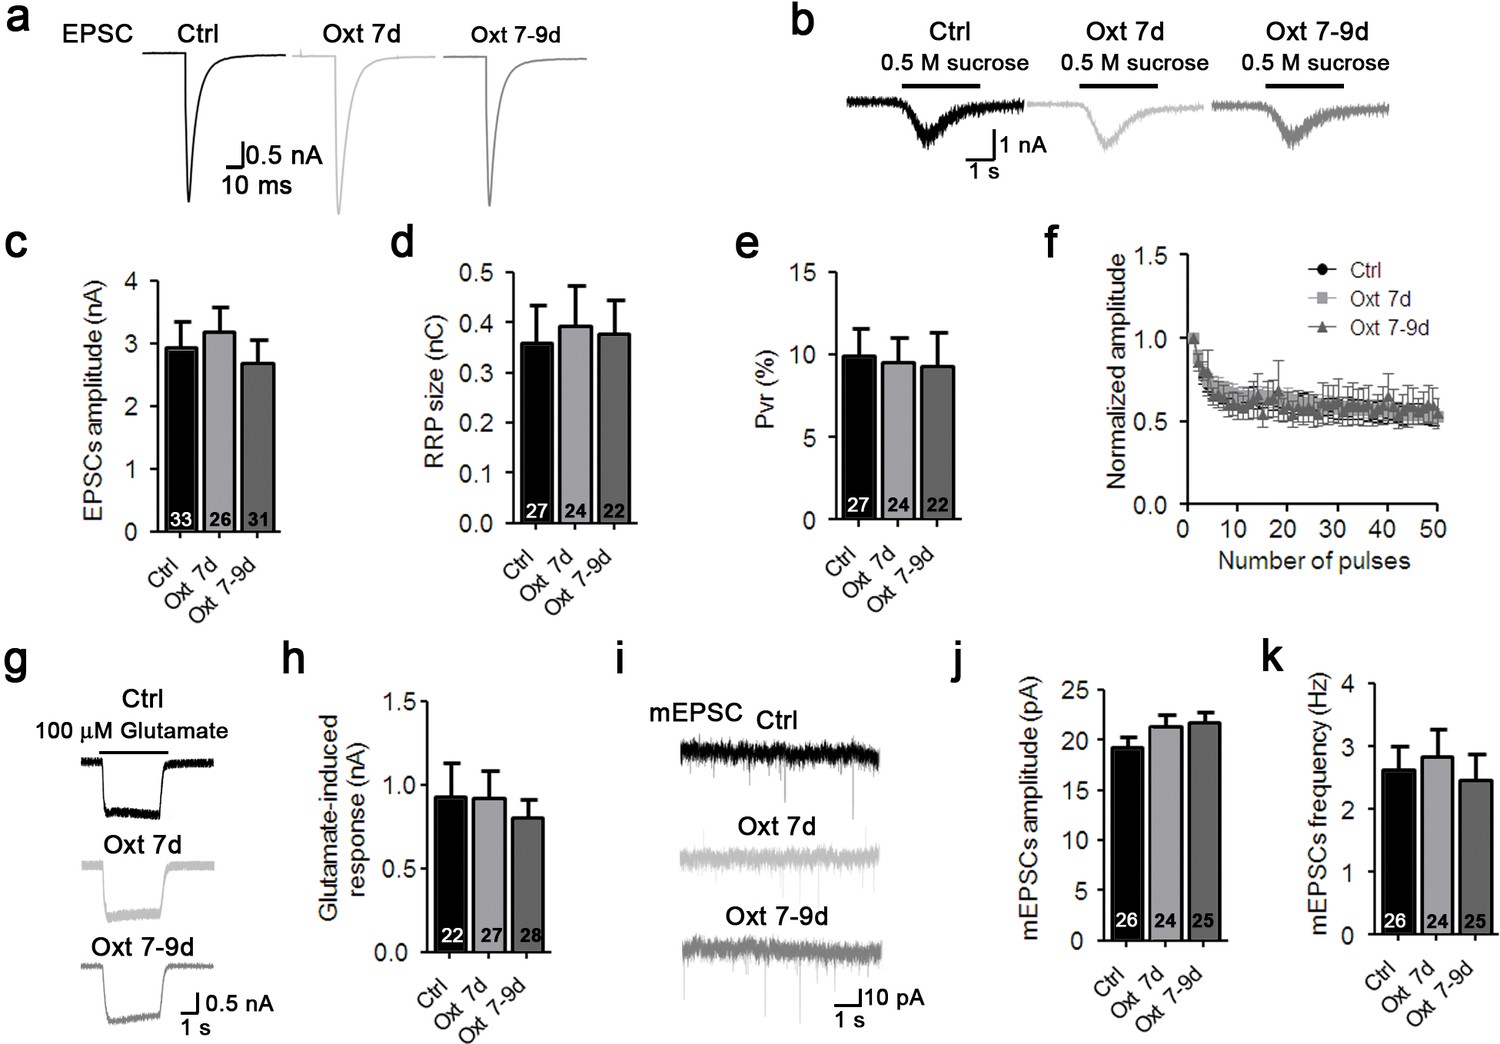
Oxytocin affects early stages of glutamatergic neuron develpment.
(a–b) Representative traces of evoked EPSCs (a) and postsynaptic currents induced by the application of 0.5 M sucrose solution (b) from glutamatergic autaptic control neurons (Ctrl, black) and from glutamatergic autaptic neurons treated with Oxt at 7 day (Oxt 7d, light grey) or 7–9 days (Oxt 7-9d, dark grey). (c–e) Average values of evoked EPSC amplitudes (c), apparent RRP size (d), and Pvr (e). The RRP was measured as the net charge transferred during application of 0.5 M sucrose solution. Pvr was calculated by dividing the charge transferred during the evoked PSC by the charge transferred during sucrose application. (f) Change in EPSC amplitudes during a 10 Hz stimulation train in glutamatergic autaptic control neurons (Ctrl, dark n = 28) glutamatergic autaptic neurons treated with Oxt at 7 day (Oxt 7d, light grey, n = 27) or 7–9 days (Oxt 7-9d, dark grey, n = 30). Data were normalized to the first response in the respective train. (g) Representative traces of EPSCs induced by 100 μM glutamate in a glutamatergic autaptic control neuron (Ctrl, black) and neurons treated with Oxt at 7 day (Oxt 7d, light grey) or 7–9 days (Oxt 7-9d, dark grey). (h) Average amplitudes of EPSCs induced by 100 μM glutamate in glutamatergic autaptic control neurons and neurons and neurons treated with Oxt at 7 day (Oxt 7d) or 7–9 days (Oxt 7-9d). (i) Representative traces of mEPSCs in a glutamatergic autaptic control neuron (Ctrl, black) and neurons treated with Oxt at 7 day (Oxt 7d, light grey) or 7–9 days (Oxt 7-9d, dark grey). (j–k) Average mEPSC amplitudes (J) and mPSC frequencies (K) in glutamatergic autaptic control neurons (Ctrl) and neurons treated with Oxt at 7 day (Oxt 7d) or 7–9 days (Oxt 7-9d). Ctrl, control. Data are shown as mean ± SEM. Numbers of analyzed cells are indicated in the histogram bars. See Supplementary file 1 and 2 for further details.
Figure 2—figure supplement 3

Oxt exposure affects the development and function of glutamatergic autaptic neurons prepared from E18 mouse embryos.
(a) Representative binary images of neurons prepared from E18 mouse embryos immunofluorescently labeled for Map2, from control cultures (Ctrl) and cultures treated with 100 nM Oxt for 1 (Oxt 1d) or 3 days (Oxt 3d). (b) Sholl analysis of Ctrl neurons and neurons treated with Oxt 1d or Oxt 3d. Numbers of cells for quantification are shown in panel (c). (c) Average numbers of dendrites intersecting Sholl circles at 25–80 μm distance from the cell body in Ctrl neurons and neurons treated with Oxt 1d or Oxt 3d (**p<0.01, Ctrl vs, Oxt 1d; ***p<0.001, Ctrl vs. Oxt 3d). (d–f) Representative traces of evoked EPSCs (d), postsynaptic currents induced by the application of 0.5 M sucrose solution (e) and of responses to exogenous glutamate (100 μM) in glutamatergic autaptic control neurons (Ctrl, black) and neurons treated with 100 nM Oxt for 1 day (Oxt 1d; dark grey). (g–i) Average values of evoked EPSC amplitudes (g), Pvr (h) and RRP size (i) in glutamatergic Ctrl neurons and neurons exposed to Oxt for 1 or 3 days (EPSCs: *p<0.05, Ctrl vs, Oxt 1d; **p<0.01, Ctrl vs. Oxt 3d; RRP: *p<0.05, Ctrl vs, Oxt 1d; **p<0.01, Ctrl vs. Oxt 3d). (j) Average amplitudes of EPSCs induced by 100 μM glutamate in glutamatergic autaptic Ctrl neurons and neurons treated with Oxt 1d or Oxt 3d (**p<0.01, Ctrl vs. Oxt 1d; *p<0.05, Ctrl vs, Oxt 3d). Data are shown as mean ± SEM. Statistical analyses were performed with one-way ANOVA followed by post-hoc Bonferroni test. Numbers of analyzed cells are indicated in the histogram bars. See Supplementary file 1 and 2 for further details.
Figure 2—figure supplement 4
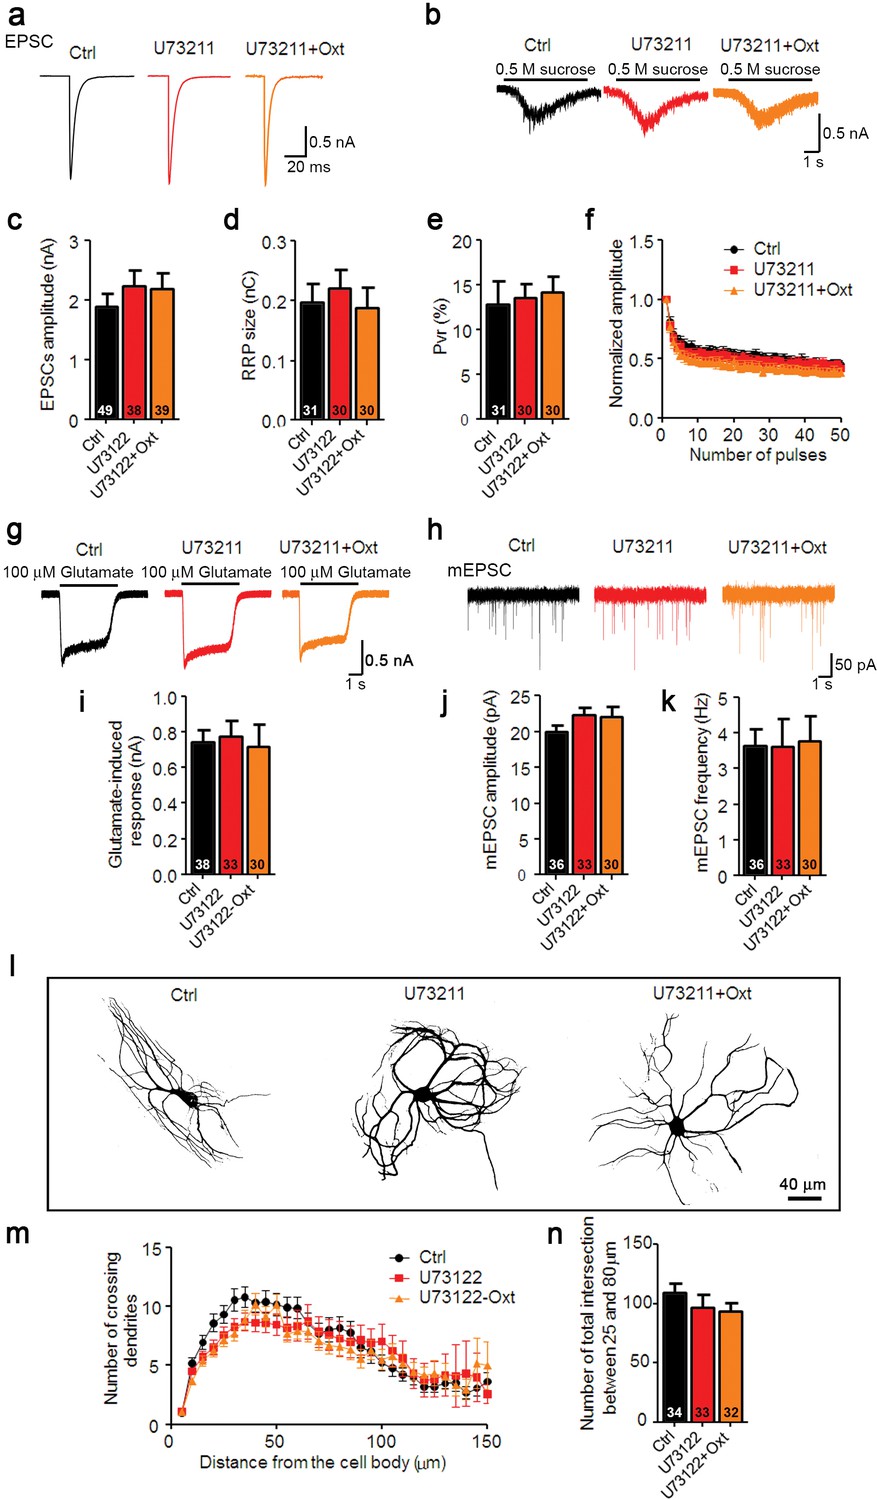
Oxt-induced effects on neuronal function and morphology are mediated by PLCβ.
(a and b) Representative traces of evoked EPSCs (a) and postsynaptic currents induced by the application of 0.5 M sucrose solution (b) in glutamatergic Ctrl (black) and neurons treated with the PLCβ inhibitor U73211(3 μM) alone (red) or in combination with Oxt (orange). (c–e) Average values of evoked EPSC amplitudes (c), apparent RRP size (d), and Pvr (e). (f) Change in EPSC amplitudes during a 10 Hz stimulation train in glutamatergic Ctrl neurons and neurons treated with the PLCβ inhibitor U73211 alone, or in combination with Oxt (Ctrl, n = 45; U73122, n = 31; U73122+Oxt, n = 32). Data were normalized to the first response in the respective train. (g) Representative traces of responses to exogenous glutamate (100 μM) in glutamatergic Ctrl neurons and neurons treated with the PLCβ inhibitor U73211 alone or in combination with Oxt. (h) Representative traces of mEPSCs in glutamatergic Ctrl neurons and neurons treated with the PLCβ inhibitor U73211 alone, or in combination with Oxt. (i) Average amplitudes of EPSCs induced by 100 μM glutamate in glutamatergic Ctrl neurons and neurons treated with the PLCβ inhibitor U73211 alone, or in combination with Oxt. (j and k) Average mEPSC amplitudes (j) and mPSC frequencies (k) in glutamatergic Ctrl neurons and neurons treated with the PLCβ inhibitor U73211 alone or in combination with Oxt. (l) Representative binary images of 14 DIV Map2-labelled Ctrl neurons and neurons treated with the PLCβ inhibitor U73211 alone, or in combination with Oxt. (m) Sholl analysis of Ctrl neurons and neurons treated with the PLCβ inhibitor U73211 alone or in combination with Oxt. Number of cells as represented in panel (n). (n) Average numbers of dendrites intersecting Sholl circles at 25–80 μm distance from the cell body in Ctrl neurons and neurons treated with the PLCβ inhibitor U73211 alone or in combination with Oxt. Ctrl, control. Data are shown as mean ± SEM. Numbers of analyzed cells are indicated in the histogram bars. See Supplementary files 1 and 2 for further details.
Figure 2—figure supplement 5

Oxt-induced effects on neuronal function and morphology are mediated by PLCβ.
(a) Representative traces of evoked EPSCs in a glutamatergic autaptic control neuron (Ctrl, black) and neurons treated for 1 day with pertussis toxin alone (PTX 1d, brown) or in combination with Oxt (PTX+Oxt 1d, light pink). (b) Average value of evoked EPSCs in glutamatergic autaptic control neurons and neurons treated for 1 day with pertussis toxin alone or in combination with Oxt (*p<0.05, Ctrl vs. PTX+Oxt 1d using a two tailed unpaired Student's t-test). Data are shown as relative to control. (c) Representative traces of postsynaptic currents induced by the application of 0.5 M sucrose solution in a glutamatergic autaptic control neuron (Ctrl, black) and neurons treated for 1 day with pertussis toxin alone (PTX 1d, brown) or in combination with Oxt (PTX+Oxt 1d, light pink). (d) Average value of apparent RRP size in glutamatergic autaptic control neurons and neurons treated for 1 day with the pertussis toxin alone or in combination with Oxt (*p<0.05, Ctrl vs PTX+Oxt 1d using a two tailed unpaired Student's t-test). Data are shown as relative to control. (e) Representative traces of EPSCs induced by 100 μM glutamate in a glutamatergic autaptic control neuron (Ctrl, black) and neurons treated for 1 day with pertussis toxin alone (PTX 1d, brown) or in combination with Oxt (PTX+Oxt 1d, light pink). (f) Average amplitude of EPSCs induced by 100 μM glutamate in glutamatergic autaptic control neuron and neurons treated for 1 day with pertussis toxin alone or in combination with Oxt. Data are shown as relative to control. Data are shown as mean ± SEM. Numbers of analyzed cells are indicated in the histogram bars. See also Supplementary file 1.
Figure 3 with 1 supplement

Ectopic Oxtr expression confers Oxt sensitivity in striatal inhibitory autaptic neurons.
(a–c) Sample traces of evoked IPSCs (a), IPSCs triggered by application of 0.5 M sucrose (b), and IPSCs triggered by 3 μM GABA (c) in an untransfected Ctrl (black), an untransfected cell treated with Oxt for 1 day (Oxt 1d, light grey), an EGFP transfected cell treated with Oxt for 1 day (blue, EGFP+Oxt 1d), and an Oxtr-transfected cell treated with Oxt for 1 day (Oxtr+Oxt 1d, light blue). (d–g) Mean evoked IPSC amplitude (d), RRP size (e), Pvr (f), and responses to exogenous 3 μM GABA (g) of untransfected control cell (Ctrl), untransfected cells treated with Oxt for 1 day (Oxt 1d) or 3 days (Oxt 3d), EGFP transfected cells treated with Oxt for 1 day (EGFP+Oxt 1d) or 3 days (EGFP+Oxt 3d), and Oxtr-transfected cells treated with Oxt for 1 day (Oxtr+Oxt 1d) or 3 days (Oxtr+Oxt 3d). The results obtained following lentiviral infection (Oxtr-OE) are highlighted by a light blue background (*p<0.05; **p<0.001 using two-tailed Student’s t test). (h) Representative binary images of 14 DIV Map2-labelled striatal neurons. Shown are an untransfected control cell (Ctrl), an untransfected cell treated with Oxt for 1 day (Oxt 1d) or 3 days (Oxt 3d), an EGFP transfected cell treated with Oxt for 1 day (EGFP+Oxt 1d) or 3 days (EGFP+Oxt 3d) and an Oxtr-transfected cell treated with Oxt for 1 day (Oxtr+Oxt 1d) or 3 days (Oxtr+Oxt 3d). (i) Sholl analysis of untransfected control cells (Ctrl) and of untransfected cells treated with Oxt for 1 day (Oxt 1d) or 3 days (Oxt 3d). Number of cells as in panel (k). (j) Sholl analysis of EGFP transfected cells treated with Oxt for 1 day (EGFP+Oxt 1d) or 3 days (EGFP+Oxt 3d), and of Oxtr-transfected cells treated with Oxt for 1 day (Oxtr+Oxt 1d) or 3 days (Oxtr+Oxt 3d). Number of cells as in panel (k). (k) Average numbers of dendrites intersecting Sholl circles at 15–65 μm distance from the cell body in untransfected control cells (Ctrl), untransfected cells treated with Oxt for 1 day (Oxt 1d) or 3 days (Oxt 3d), EGFP transfected cells treated with Oxt for 1 day (EGFP+Oxt 1d) or 3 days (EGFP+Oxt 3d), and Oxtr-transfected cells treated with Oxt for 1 day (Oxtr+Oxt 1d) or 3 days (Oxtr+Oxt 3d) (*p<0.05, EGFP+Oxt 1d vs. Oxtr+Oxt 1d; *p<0.05, EGFP+Oxt 3d vs. Oxtr+Oxt 3d). Ctrl, control. Data are shown as mean ± SEM. Numbers of analyzed cells are indicated in the histogram bars. Statistical analyses were performed with a two tailed Student's t-test. See Supplementary files 1 and 2 for further details.
Figure 3—figure supplement 1
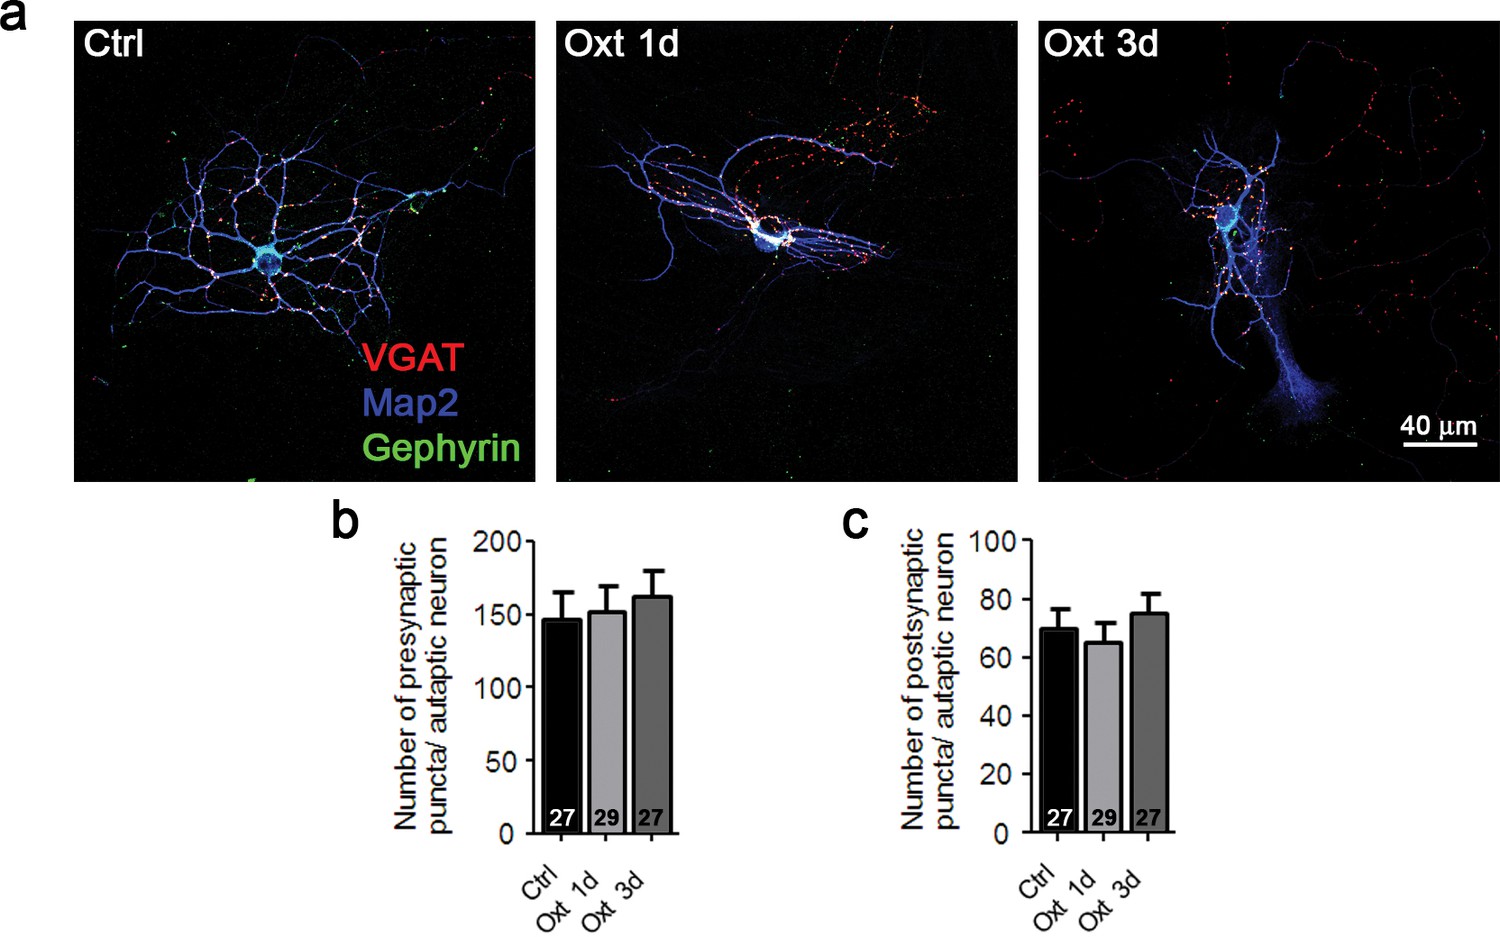
Oxt-treatment does not alter the synapse number of GABAergic autaptic striatal neurons.
(a) Representative images of a striatal control neuron (Ctrl) and neurons treated with Otx for 1 (Oxt 1d) or 3 days (Oxt 3d), immunofluorescently stained with antibodies directed against VGAT, Gephyrin, and MAP2 at 14DIV. (b–c) Average numbers of VGAT-positive GABAergic presynapses (b), and Gephyrin-positive postsynapses (c) in control neurons (Ctrl) and neurons treated with Otx for 1 (Oxt 1d) or 3 days (Oxt 3d). Data are shown as mean ± SEM. Numbers of analyzed cells are indicated in the histogram bars. See also Supplementary file 2.
Figure 4 with 2 supplements
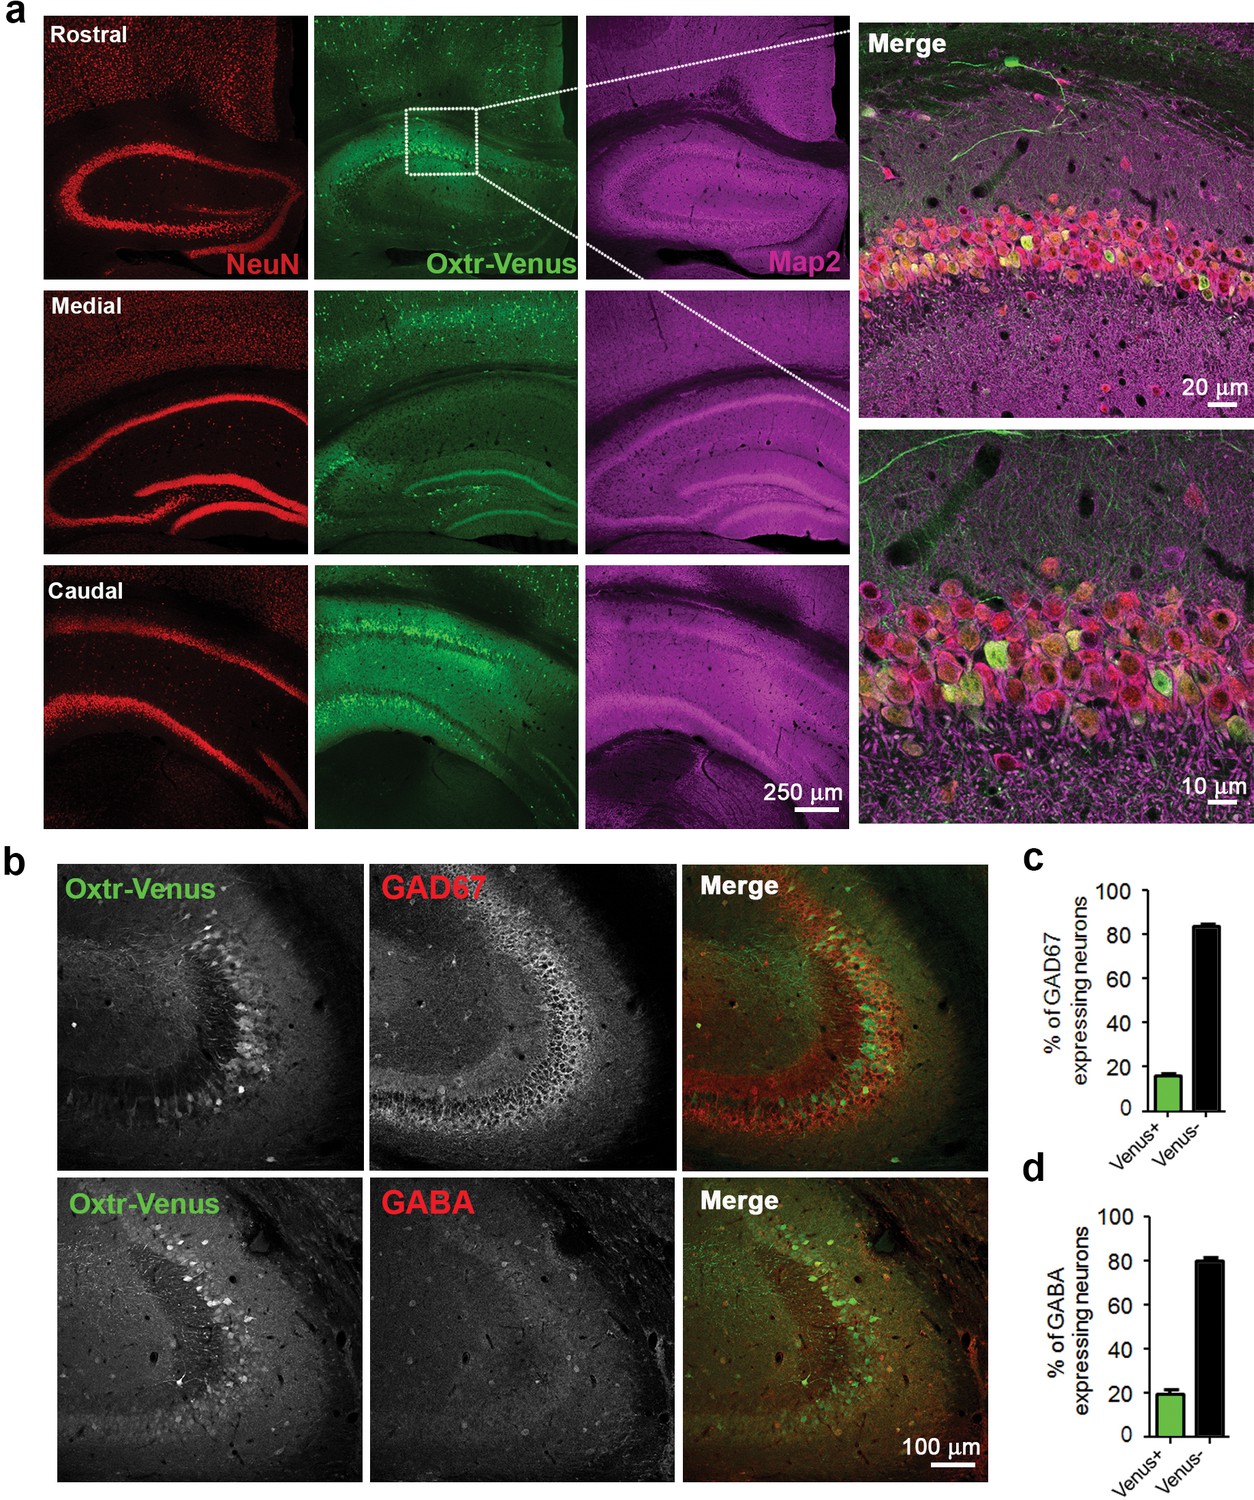
Differential and neuron-specific Oxtr expression in mouse hippocampus.
(a) Immunohistochemical mapping of Venus expression in coronal sections of the rostral, medial, and caudal hippocampus from three weeks old OxtrVn/+ mice triple-labeled with antibodies against NeuN (red), Venus (green), and Map2 (magenta). (b) Confocal images of OxtrVn/+ hippocampal slices double-labeled for Venus (green) and GAD67 (red) or GABA (red). (c) Quantitative analysis of GAD67-positive neurons with (Venus+) and without colabeling for Venus (Venus-) in OxtrVn/+ hippocampal sections (n = 4–6 sections from two mice). (d) Quantitative analysis of GABA-positive neurons with (Venus+) and without colabeling for Venus signals (Venus-) in OxtrVn/+ hippocampal sections (n = 4–6 sections from three mice). Data are shown as mean ± SEM.
Figure 4—figure supplement 1
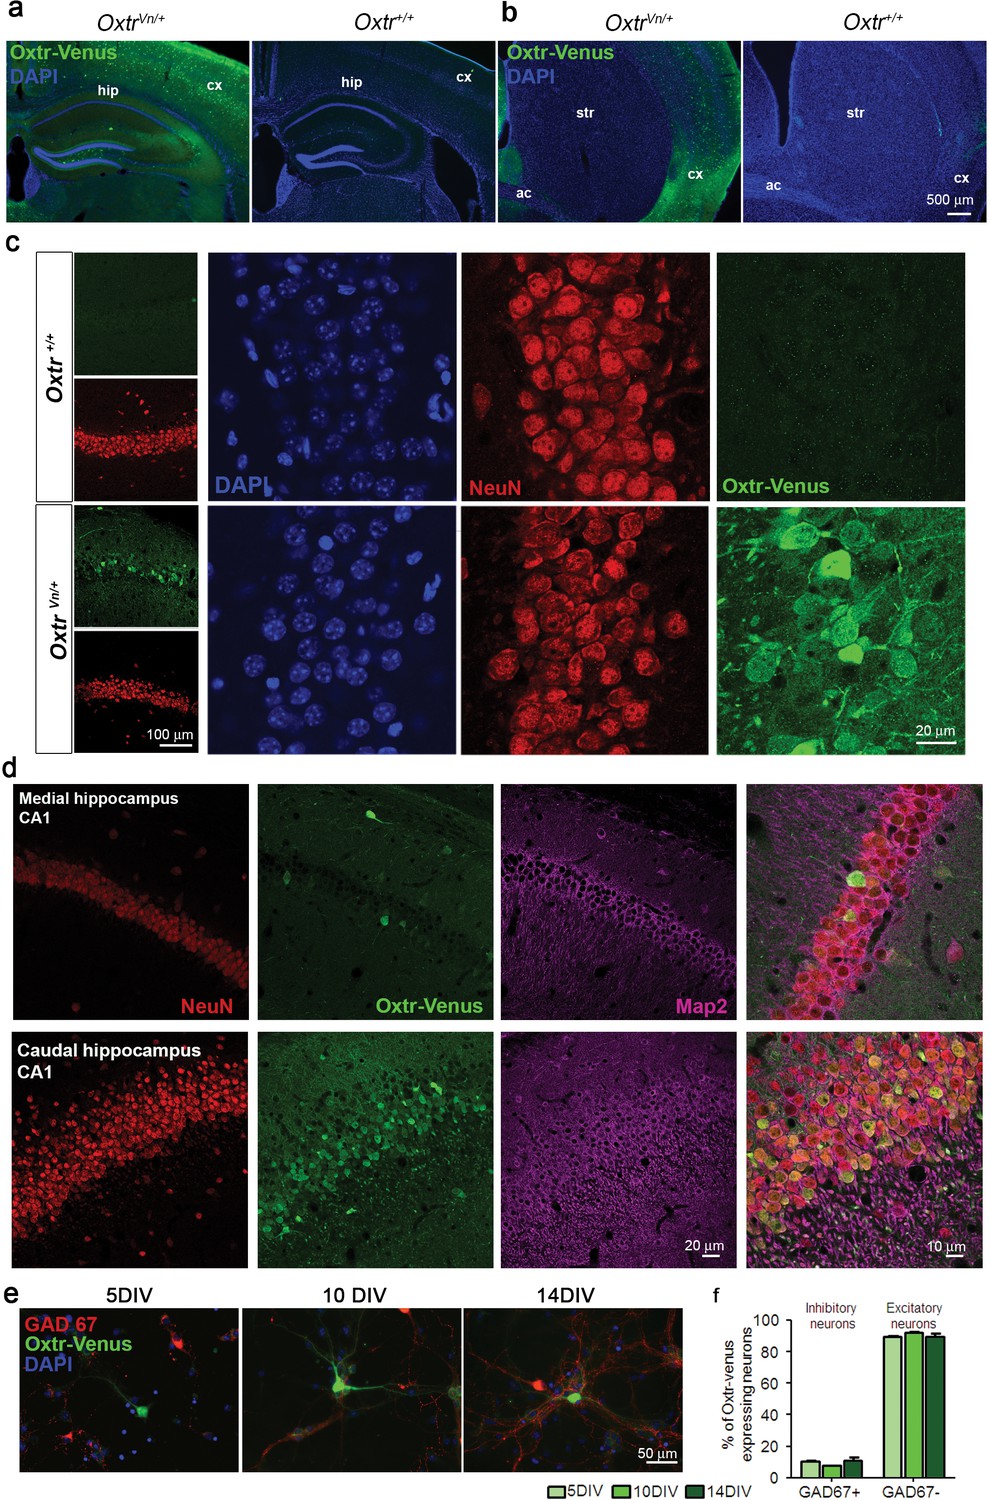
Oxytocin receptors (Oxtr) are expressed in mouse hippocampus.
(a and b) Coronal sections of the hippocampus (a) and striatum (b) from OxtrVn/+ and Oxtr+/+ mice stained for Venus and DAPI (ac, anterior commisure; cx, cortex; hip, hippocampus; str, striatum). (c) Confocal images of rostral Oxtr+/+ and OxtrVn/+ brain sections including hippocampus, double-labeled for Venus (green) and NeuN (red). (d) Confocal images of Oxtr-expressing neurons in the CA1 subfields of the medial and caudal hippocampus from OxtrVn/+ sections, triple stained with antibodies directed against NeuN (red), MAP2 (magenta), and Venus (green). (e) Representative images of hippocampal mass cultures obtained from OxtrVn/+ mice at P0 mice and processed for immunofluorescence staining at 5, 10, and 14 DIV using antibodies to Venus (green) and GAD67 (red), and DAPI (blue). (f) Quantitative analysis of Venus-positive neurons with (GAD67+) and without colabeling for GAD67 (GAD67-) in hippocampal mass cultures obtained from OxtrVn/+ mice at P0 mice and processed for immunofluorescence staining at 5, 10, and 14 DIV. Data are shown as mean ± SEM.
Figure 4—figure supplement 2
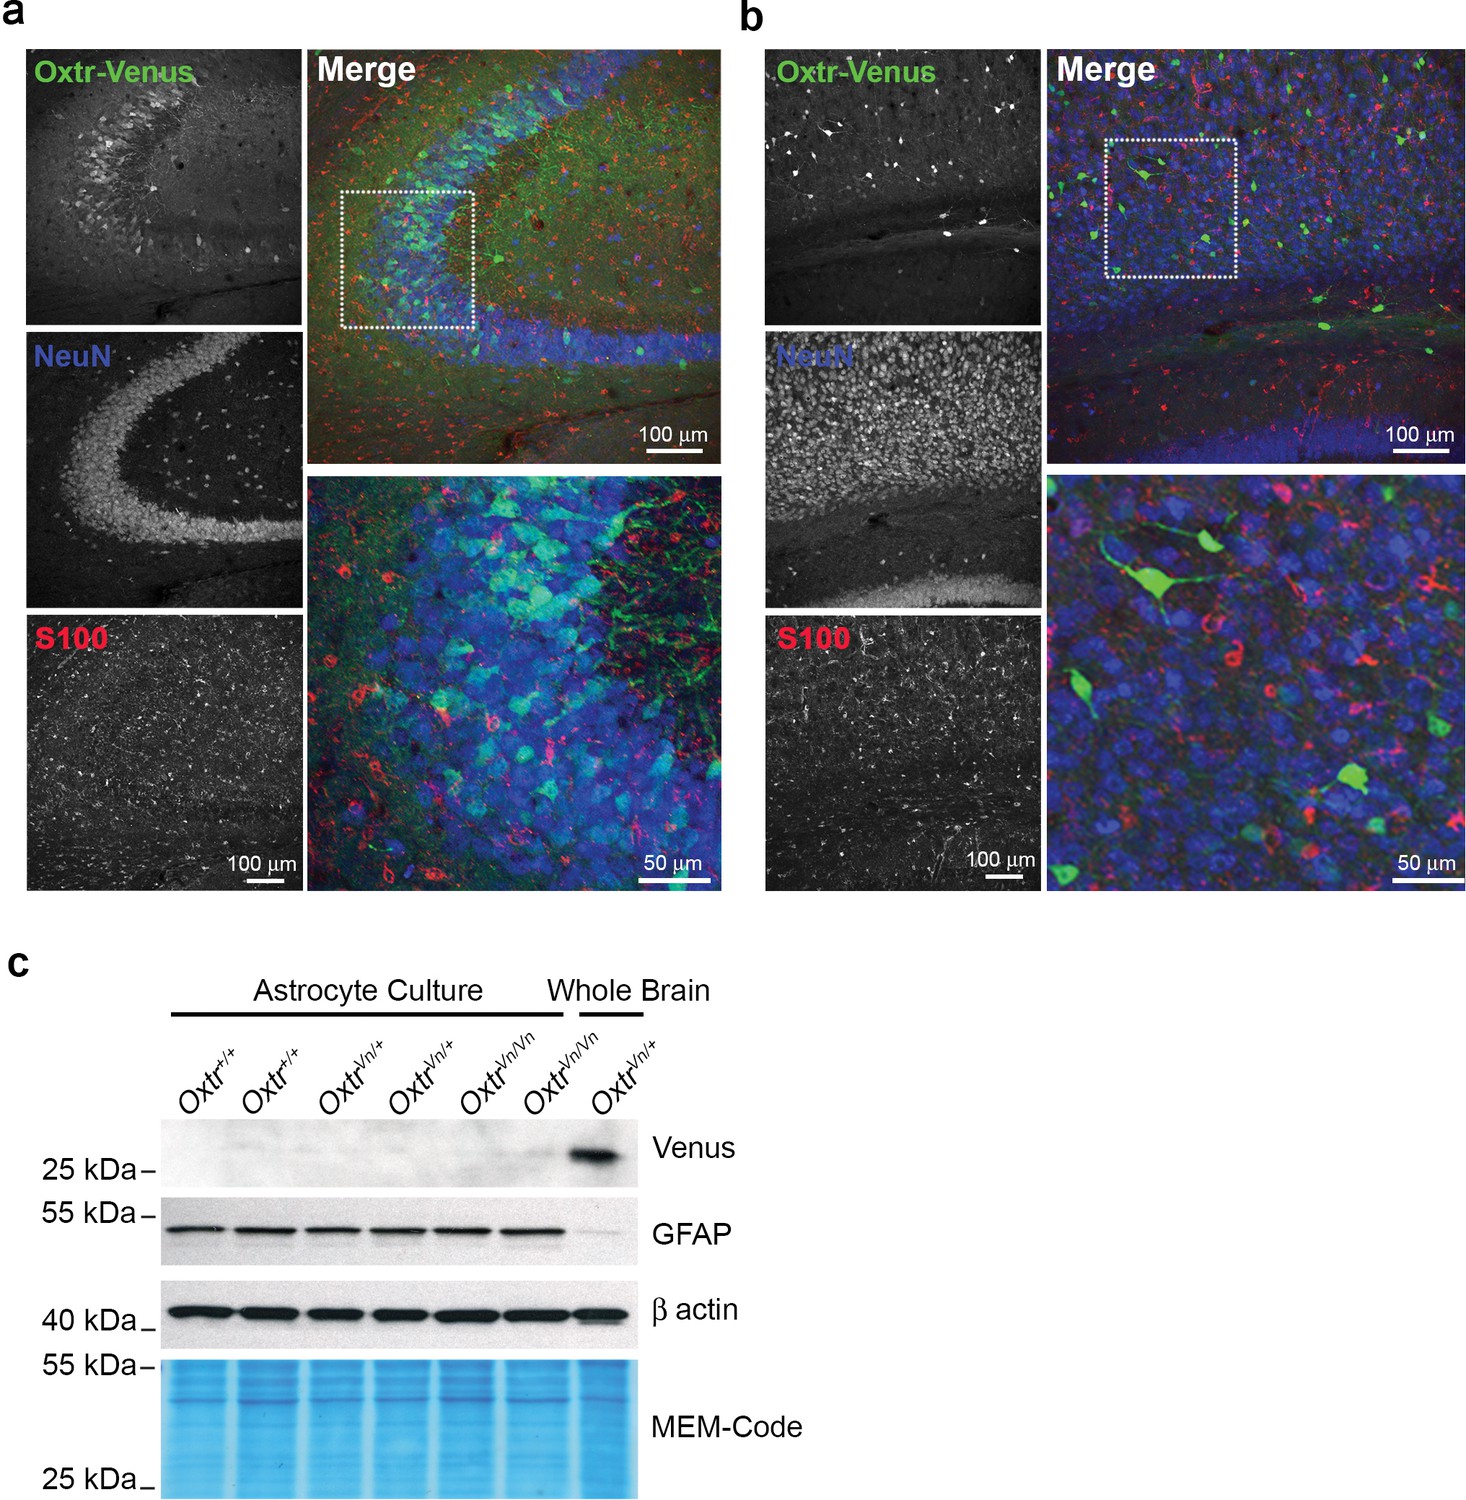
Oxytocin receptors (Oxtr) are not expressed in astrocytes.
(a) Confocal images of Oxtr-expressing neurons in the CA3 subfield of the medial hippocampus from OxtrVn/+ sections, triple stained with antibodies directed against NeuN (blue), S100 (red), and Venus (green). (b) Confocal images of Oxtr-expressing neurons in the cortex from OxtrVn/+ sections, triple stained with antibodies directed against NeuN (blue), S100 (red), and Venus (green). (c) Western Blotting for Oxtr gene expression (Venus reporter) in astrocytes and whole brain. Samples were probed for Venus and GFAP. Equal protein loading was assessed by β actin and MEM-code.
Figure 5 with 2 supplements
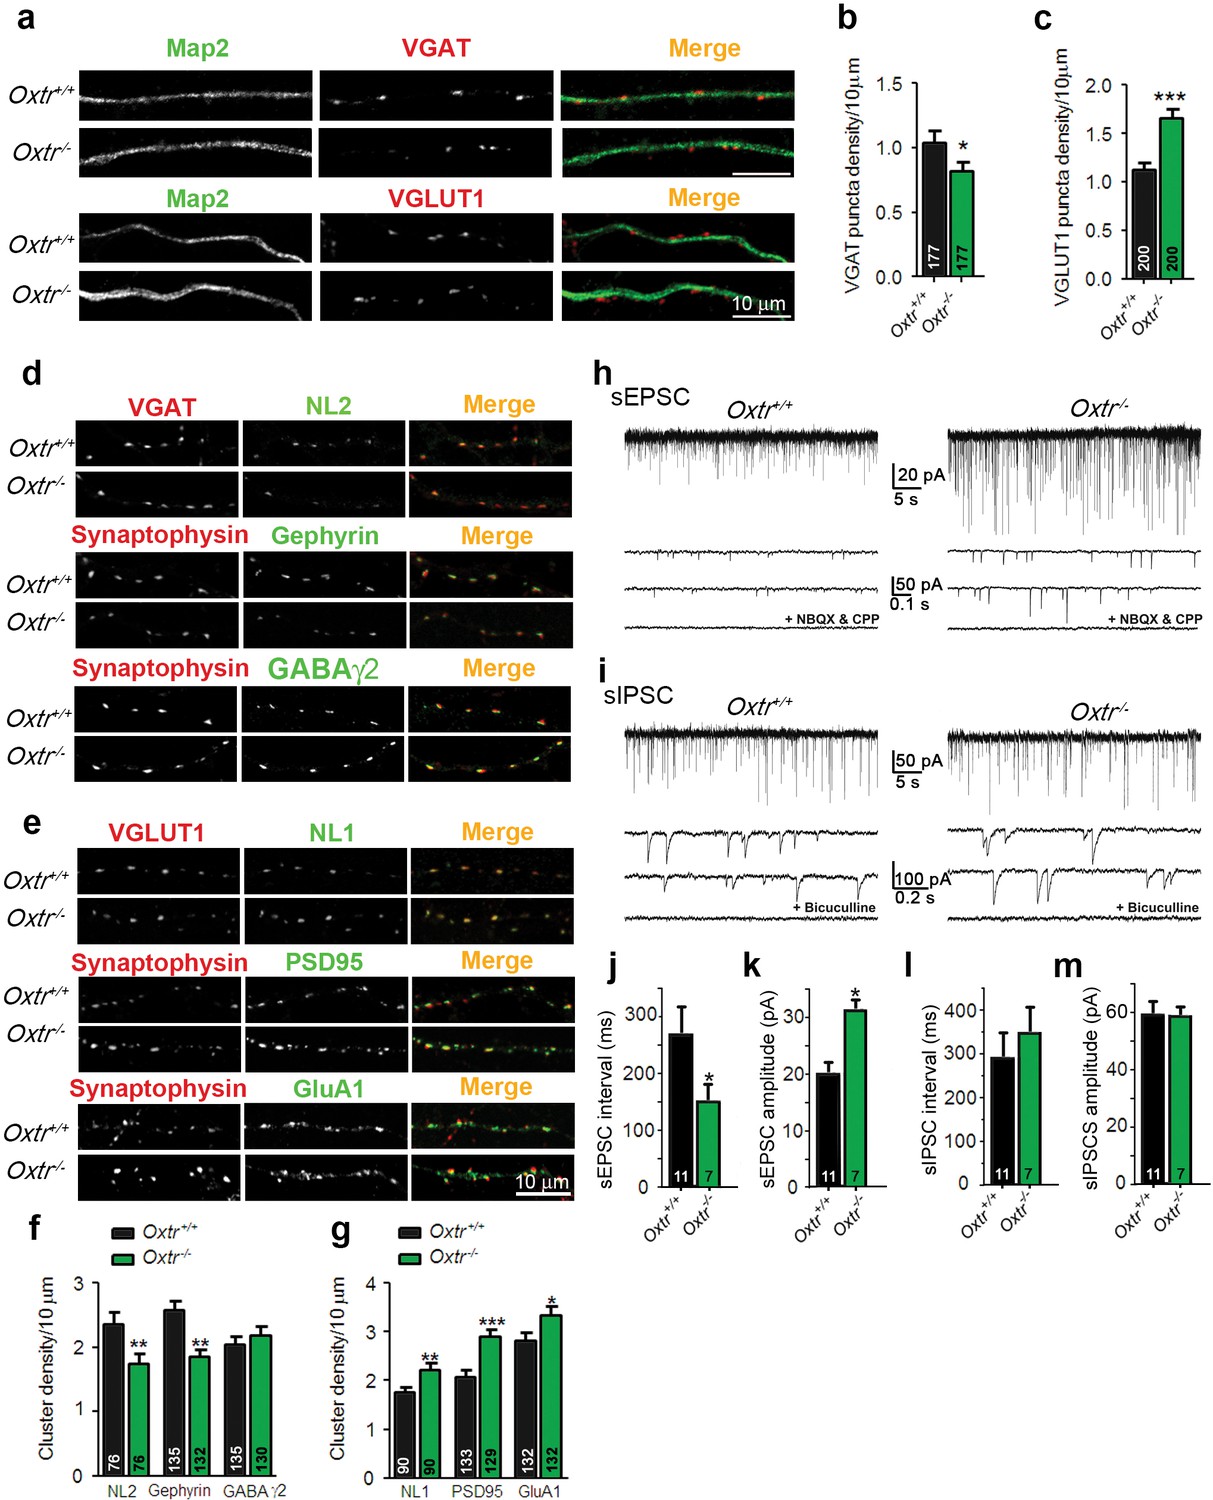
Hippocampal cultures from Oxtr−/− mice show an increased excitation/inhibition balance.
(a) Confocal images of Oxtr+/+ and Oxtr−/− 14DIV hippocampal cultures stained for Map2 (green) and VGAT or VGLUT1 (red). (b and c) Quantitative analysis of the densities of VGAT-positive (b) and VGLUT1-positive (c) fluorescent puncta juxtaposed to Map2-positive processes, expressed per 10 µm dendrite length (*p<0.05; ***p<0.0001). Numbers of analyzed dendrites are indicated in the histogram bars. (d) Immunocytochemical analysis of inhibitory synapses in 14DIV Oxtr−/− and Oxtr+/+hippocampal cultures double-labeled for postsynaptic NL2, Gephyrin, or GABAA receptor γ2 subunit (green), together with VGAT or synaptophysin (red) to label presynapses. (e) Immunocytochemical analysis of excitatory synapses in 14DIV Oxtr−/− and Oxtr+/+hippocampal cultures doubly immunostained for postsynaptic NL1, PSD95, AMPA receptor GluA1-subunit (green), together with VGLUT1 or Synaptophysin (red) to label presynapses. (f and g) Density of puncta positive for the indicated marker proteins of excitatory (f) and inhibitory (g) synapses in Oxtr−/− and Oxtr+/+ cultures, expressed per per 10 μm dendrite length (*p<0.05; **p<0.001; ***p<0.0001). Numbers of analyzed dendrites are indicated in the histogram bars. (h and i) Sample traces of spontaneous EPSCs (H) and IPSCs (I) in Oxtr+/+ (left) and Oxtr−/− (right) 11DIV neurons. The bottom traces show recordings in the presence of NBQX (10 µM) and CPP (30 µM) (h), and in the presence of bicuculline (10 µM) (i). (j–m) Mean inter-event intervals and amplitudes of sEPSC (J and K) and sIPSC (L and M) in Oxtr−/− and Oxtr+/+ neurons (*p<0.05). Data are shown as mean ± SEM. Numbers of analyzed cells are indicated in the histogram bars. Statistical analyses were performed with a two tailed Student's t-test. See Supplementary file 1 and 2 for further details.
Figure 5—figure supplement 1
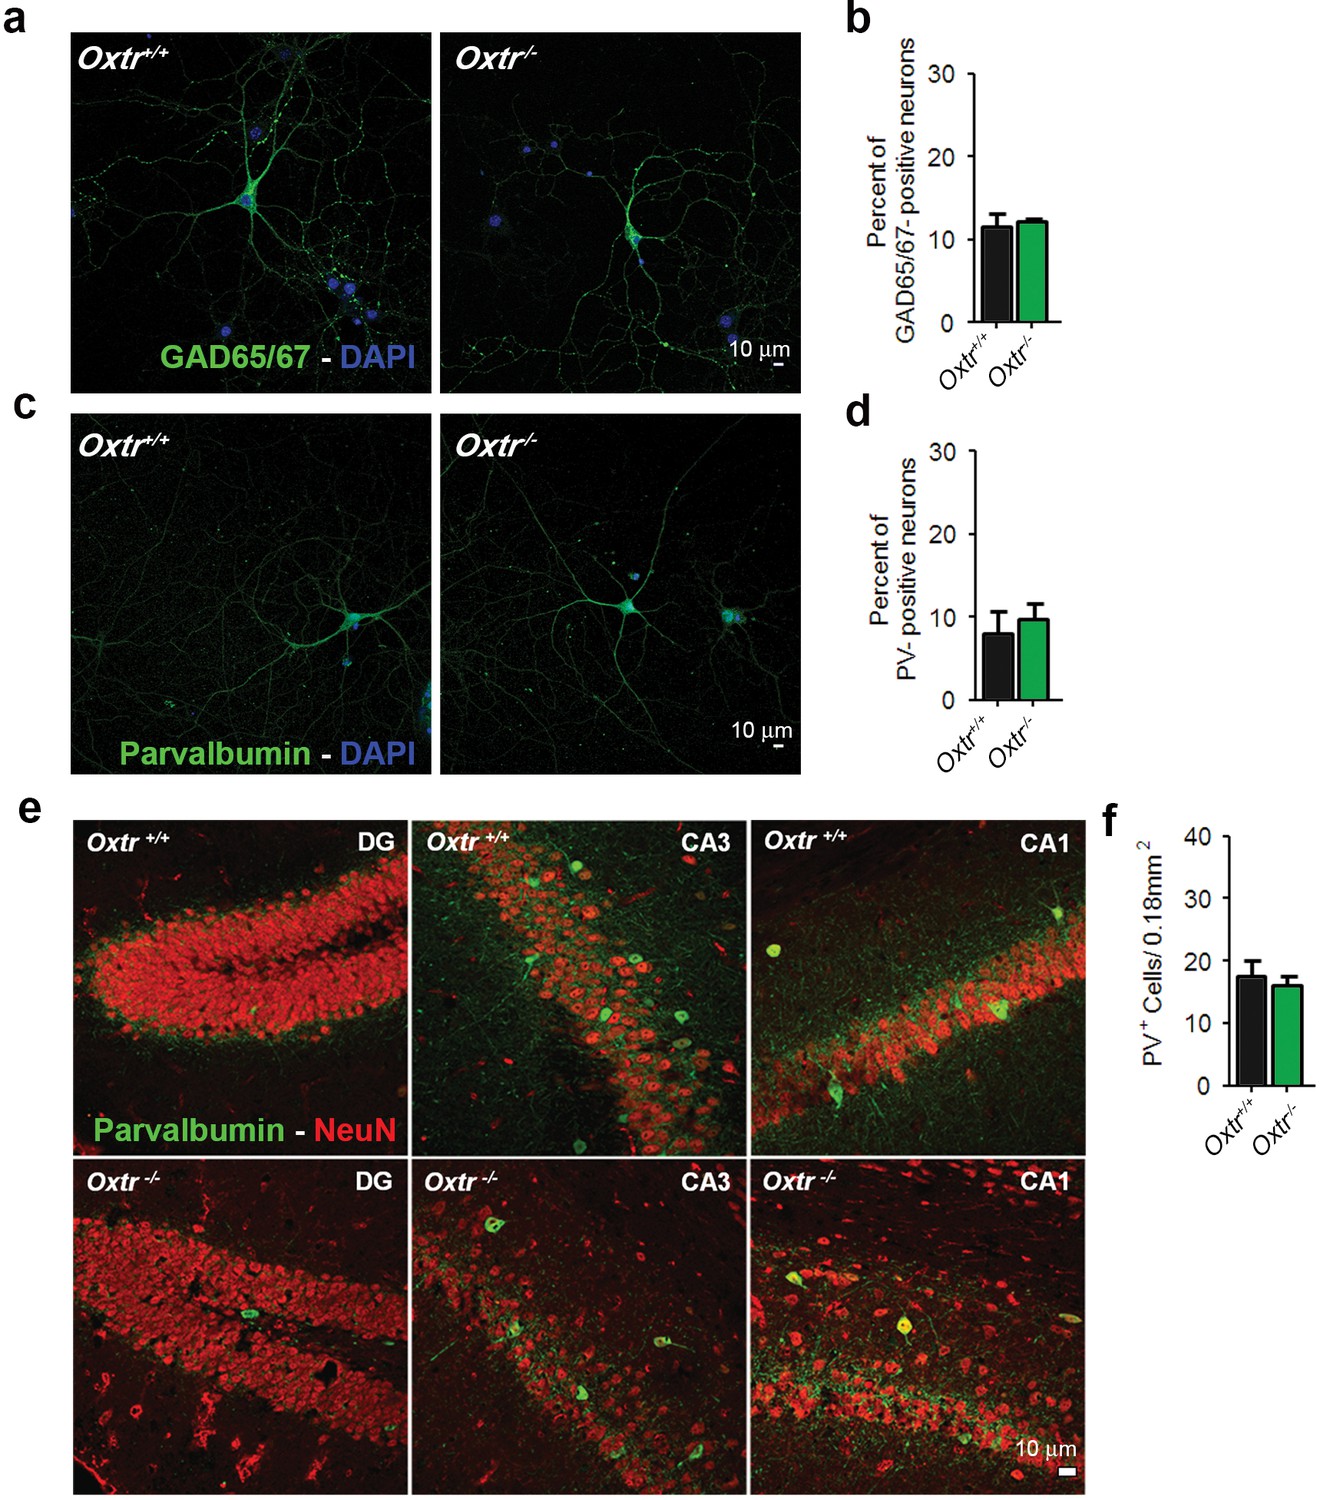
Oxtr+/+ and Oxtr−/− hippocampal cultures and brain slices show equal numbers of inhibitory GABAergic neurons.
(a) Representative images of hippocampal mass cultures obtained from Oxtr+/+ and Oxtr−/− E18 mouse embryos and stained for GAD65/67 (green) and DAPI (blue). (b) Quantitative analysis of the percentage of GAD65/67-positive neurons with respect to total nuclei labeled with DAPI in hippocampal mass cultures obtained from Oxtr+/+ and Oxtr−/− E18 mouse embryos. (c) Representative images of Oxtr+/+ and Oxtr−/− neurons prepared as in (a), immunolabeled for Parvalbumin (PV, green) and DAPI (blue). (d) Quantitative analysis of the percentage of PV-positive neurons with respect to total nuclei labeled with DAPI in hippocampal mass cultures obtained from Oxtr+/+ and Oxtr−/− E18 mouse embryos. (e) Coronal sections from 3-month-old Oxtr+/+ and Oxtr−/− mice double stained for NeuN (red) and PV (green). Data are shown as the mean ± SE. See also Supplementary file 2 for further details.
Figure 5—figure supplement 2
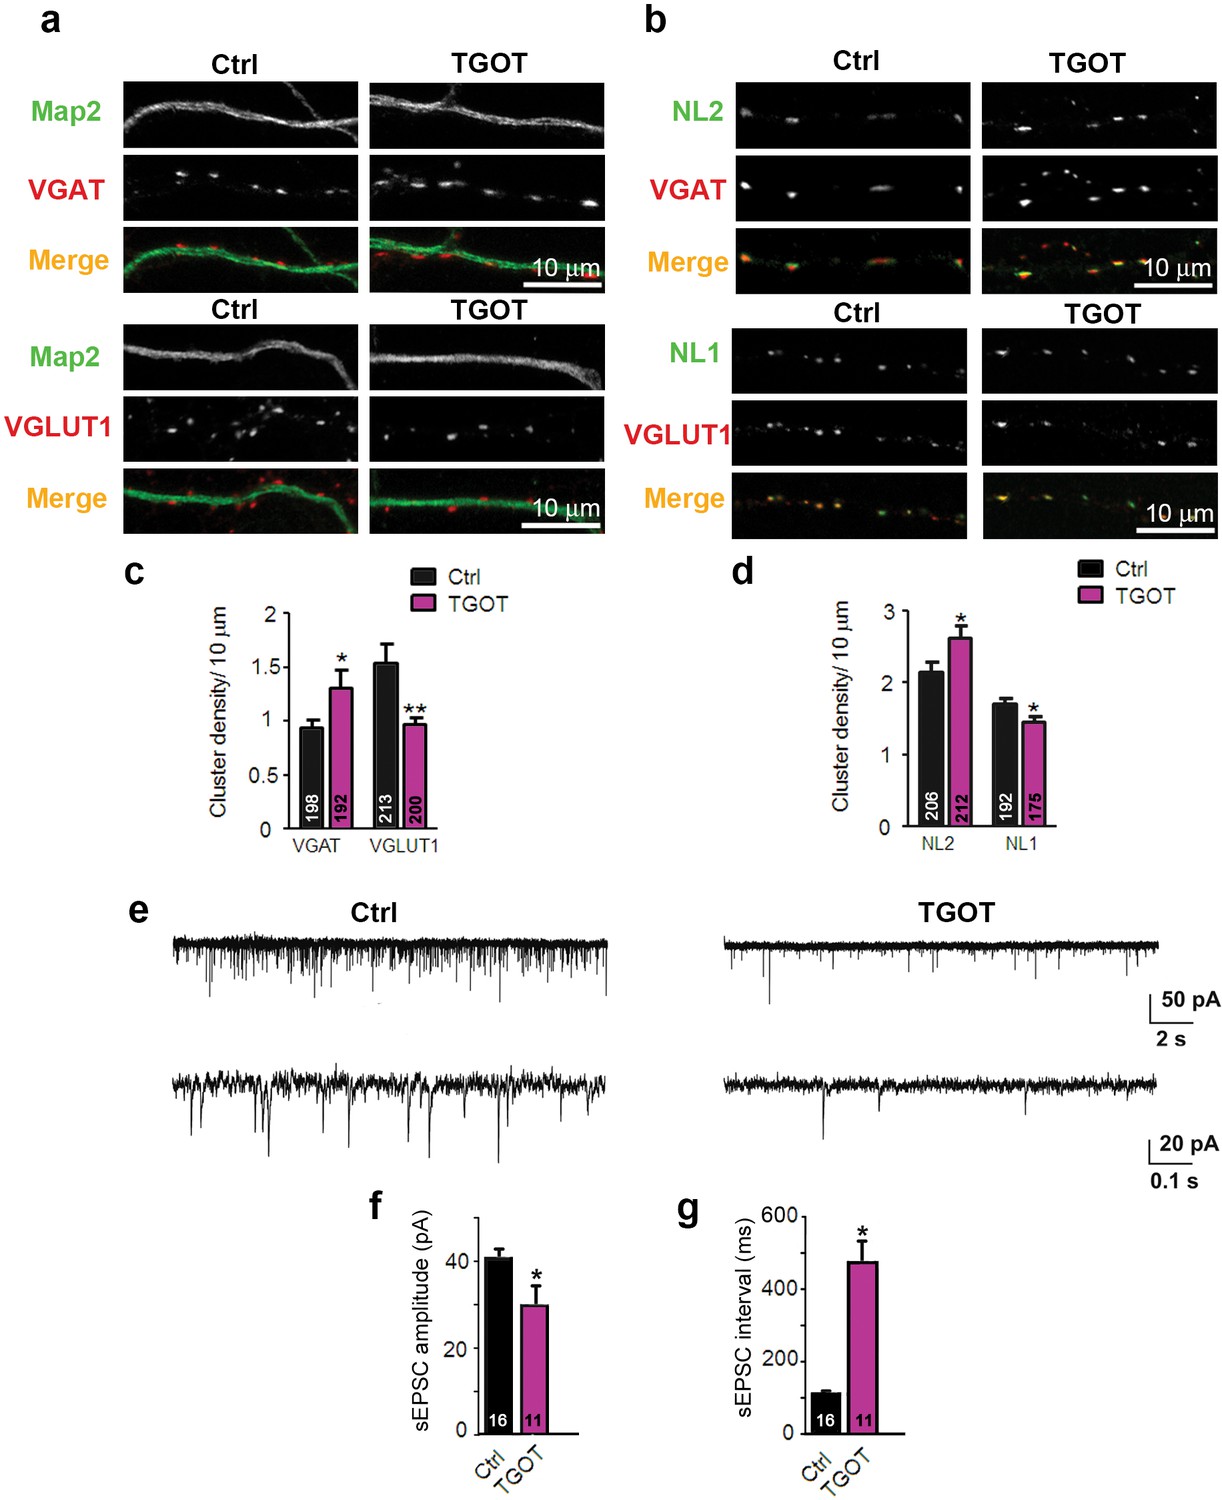
Exposure of WT hippocampal cultures to the selective oxytocin receptor agonist TGOT alters the excitatory/inhibitory synapse ratio .
(a) Confocal images of control and TGOT treated 14DIV hippocampal cultures stained for Map2 (green) and VGAT or VGLUT1 (red). (b) Confocal images of control and TGOT-treated neurons double stained for NL2 or NL1 (green) together with VGAT or VGLUT1 (red). (c) Quantitative analysis of the densities of VGAT- and VGLUT1-positive fluorescent puncta juxtaposed to Map2-positive processes, expressed per 10 µm dendrite length (*p<0.05; **p<0.001). Numbers of analyzed dendrites are indicated in the histogram bars. (d) Density of puncta positive for NL1 or NL2 in control and TGOT-treated cultures, expressed per per 10 μm dendrite length (*p<0.05). Numbers of analyzed dendrites are indicated in the histogram bars. (e) Sample traces of spontaneous EPSCs in a control neuron (left) and a neuron exposed to TGOT (right). (f–g) Mean inter-event intervals (f) and amplitudes (g) of sEPSC in control and TGOT-treated neurons (*p<0.05). Data are shown as mean ± SEM. Numbers of analyzed cells are indicated in the histogram bars. Statistical analyses were performed with a two tailed Student's t-test. See also Supplementary file 1 and 2.
Figure 6
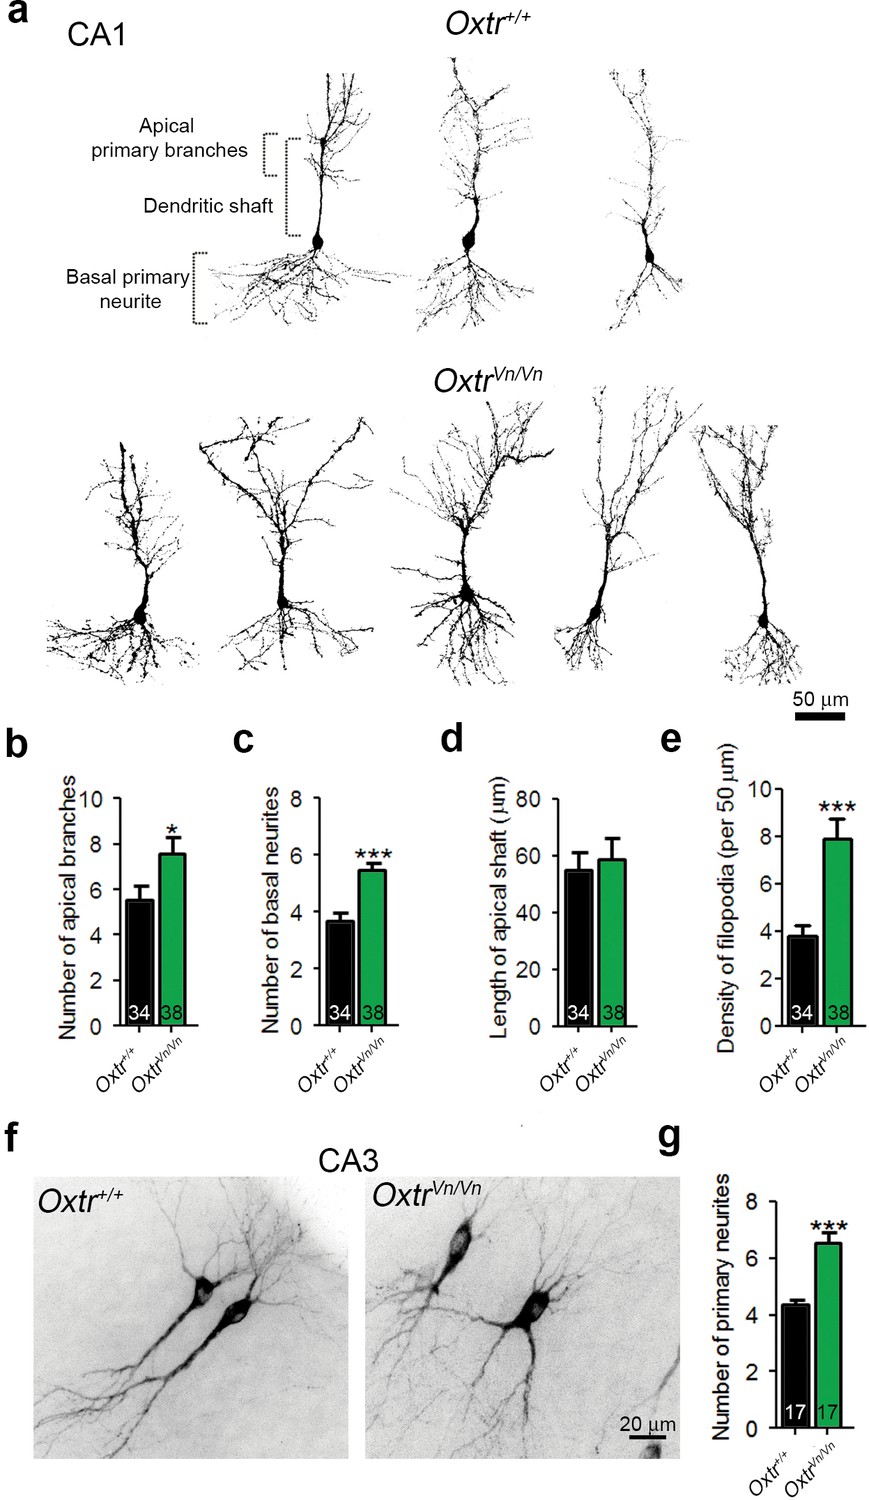
Deletion of Oxtrs in hippocampus causes dendrite overgrowth in CA1 and CA3 pyramidal neurons.
(a) Tracings of CA1 pyramidal neurons in P7 Oxtr+/+ and OxtrVn/Vn hippocampi expressing a membrane-targeted variant of tdTomato after in utero electroporation at E14. (b and c) Average numbers of primary apical dendrite branches (B) and basal primary neurites (C) of transfected pyramidal cells in Oxtr+/+ and OxtrVn/Vn CA1 hippocampus (*p<0.05; ***p<0.0001). (d) Mean length of the apical dendrite shaft of transfected CA1 pyramidal cells in Oxtr+/+ and OxtrVn/Vn hippocampus, measured as a distance between the neuronal soma and the first main bifurcation. (e) Average density of filopodia and filopodia-like protrusions along the apical dendrite shaft in transfected CA1 pyramidal cells in Oxtr+/+ and OxtrVn/Vn hippocampus (***p<0.0001). (f) Tracing of CA3 pyramidal neurons in P7 Oxtr+/+ and OxtrVn/Vn hippocampi expressing a membrane-targeted variant of tdTomato after in utero electroporation at E14. (g) Average number of primary dendrites of transfected CA3 pyramidal cells in Oxtr+/+ and OxtrVn/Vn hippocampus (**p<0.001 using). Data are shown as mean ± SEM. Numbers of analyzed cells are indicated in the histogram bars. Statistical analyses were performed with a two tailed Student's t-test. See Supplementary file 1 and 2 for further details.
Figure 7
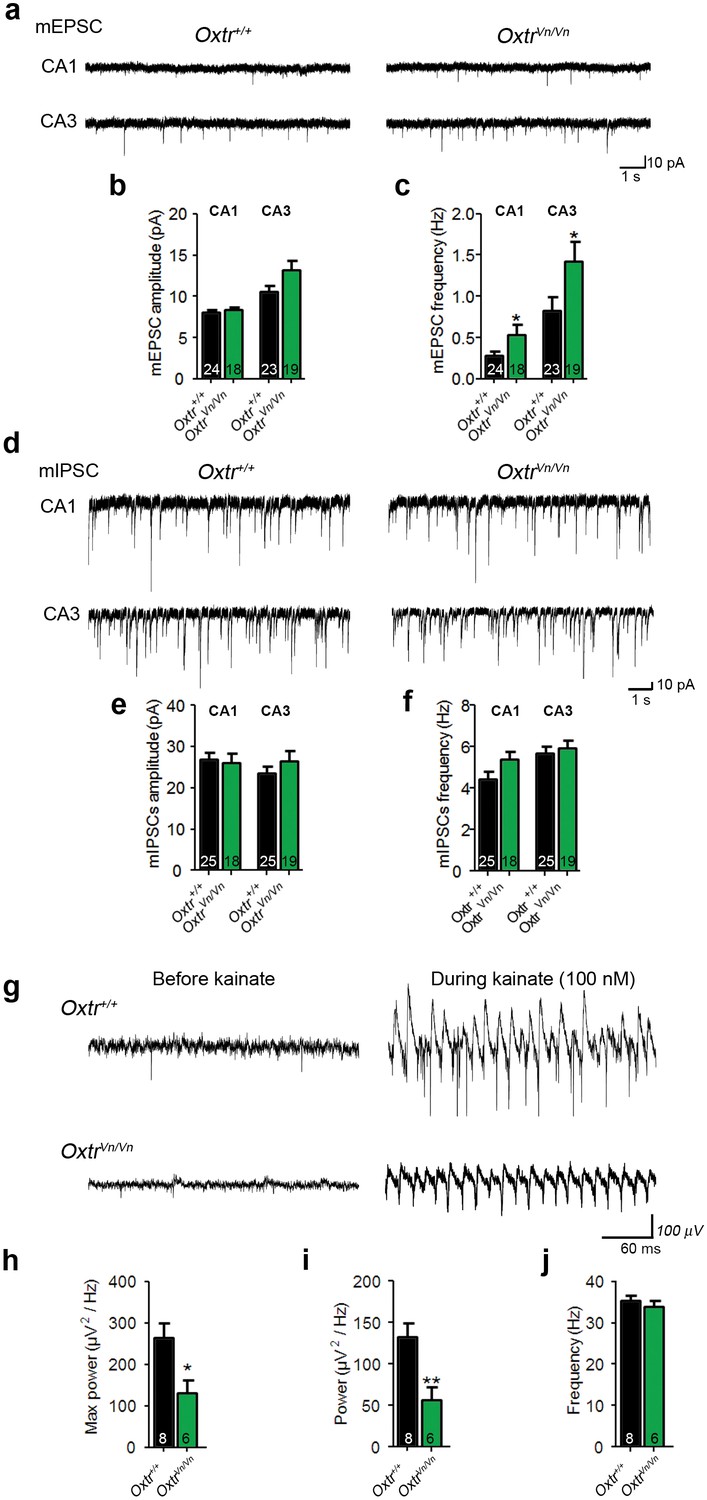
Loss of Oxtr increased excitatory synaptic transmmission and perturbed γ-oscillation in hippocampus.
(a) Representative traces of mEPSCs recorded from CA1 (top) and CA3 (bottom) pyramidal neurons in Oxtr+/+ (right) and OxtrVn/Vn (left) hippocampal slices. (b, c) Average mEPSC amplitude (B) and frequency (C) in CA1 and CA3 pyramidal neurons from Oxtr+/+ and OxtrVn/Vn mice (*p<0.05). (d) Representative traces of mIPSCs recorded from CA1 (top) and CA3 (bottom) pyramidal neurons in Oxtr+/+ (right) and OxtrVn/Vn (left) hippocampal slices. (e–f) Average mIPSC amplitude (B) and frequency (C) in CA1 and CA3 pyramidal neurons from Oxtr+/+ and OxtrVn/Vn mice. (g) Representative recordings of γ-oscillations in the CA3 region of hippocampal slices from Oxtr+/+ (top) and OxtrVn/Vn mice (bottom) before (left, baseline) and during (right) 100 nM kainate application. (h–j) Quantification of the maximum (h) and average (i) power and of the frequency (j) of kainate-induced (100 nM) γ-oscillations oscillations recorded in Oxtr+/+ and OxtrVn/Vn hippocampal slices (*p<0.05; **p<0.001). Data are shown as mean ± SEM. Numbers of analyzed cells (b–f) and mice (h–j) are indicated in the histogram bars. Statistical analyses were performed with a two tailed Student's t-test. See Supplementary files 1 and 2 for further details.
Figure 8
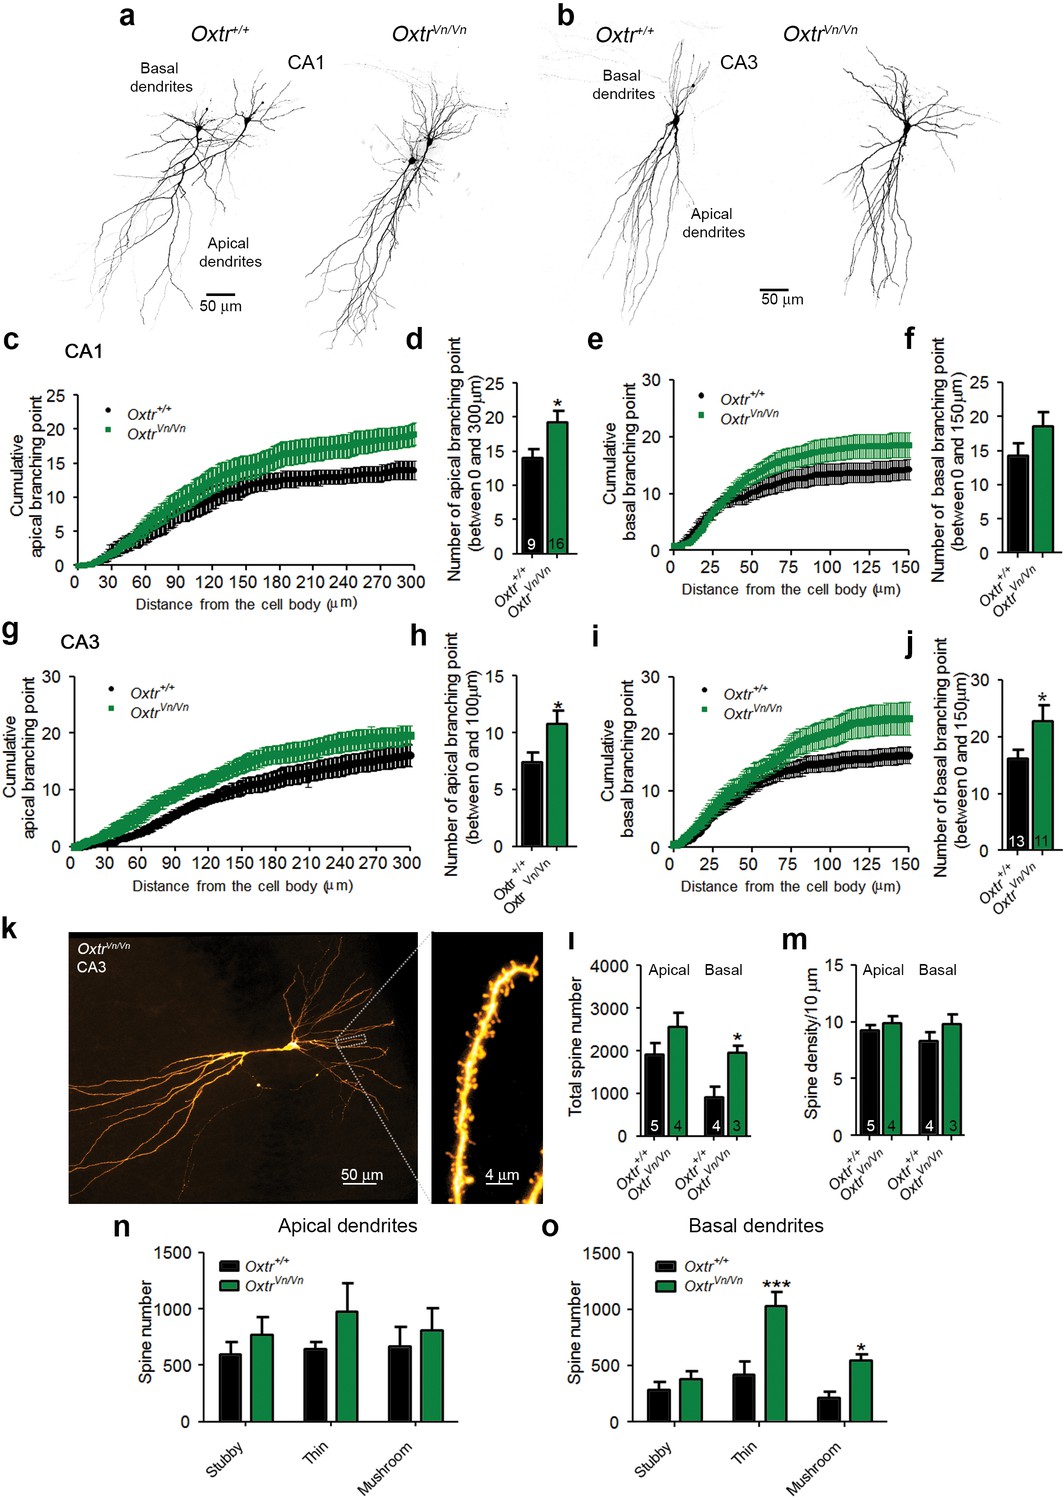
Altered dendritic complexity and spine number in Oxtr-deficient pyramidal hippocampal neurons.
(a, b) Representative images of biocytin-filled CA1 (a) and CA3 (b) pyramidal neurons in Oxtr+/+ and OxtrVn/Vn hippocampal slices. (c, d) Quantification of the cumulative number of apical branching points (c) and of the total number of apical branching points (d) in dendrites of CA1 pyramidal neurons from Oxtr+/+ and OxtrVn/Vn hippocampal slices (*p<0.05). (e, f) Quantification of the cumulative number of basal branching points (e) and of the total number of basal branching points (f) in dendrites of CA1 pyramidal neurons from Oxtr+/+ and OxtrVn/Vn hippocampal slices. (g, h) Quantification of the cumulative number of apical branching points (g) and of the total number of apical branching points (h) in dendrites of CA3 pyramidal neurons from Oxtr+/+ and OxtrVn/Vn hippocampal slices (*p<0.05). (i, j) Quantification of the cumulative number of basal branching points (i) and of the total number of basal branching points (j) in dendrites of CA1 pyramidal neurons from Oxtr+/+ and OxtrVn/Vn hippocampal slices (*p<0.05). (k) Confocal image of a biocytin-filled CA3 pyramidal neuron. (l, m) Quantification of the total spine number (l) and average spine density (m) in CA3 pyramidal neurons from Oxtr+/+ and OxtrVn/Vn hippocampal slices (*p<0.05). (n, o) Spine classification in apical (n) and basal (o) dendrites of CA3 pyramidal neurons from Oxtr+/+ and OxtrVn/Vn hippocampal slices (*p<0.05; ***p<0.0001). Data are shown as mean ± SEM. Numbers of analyzed cells are indicated in the histogram bars. Statistical analyses were performed with a two tailed Student's t-test. See Supplementary file 1 and 2 for further details.
Author response image 1
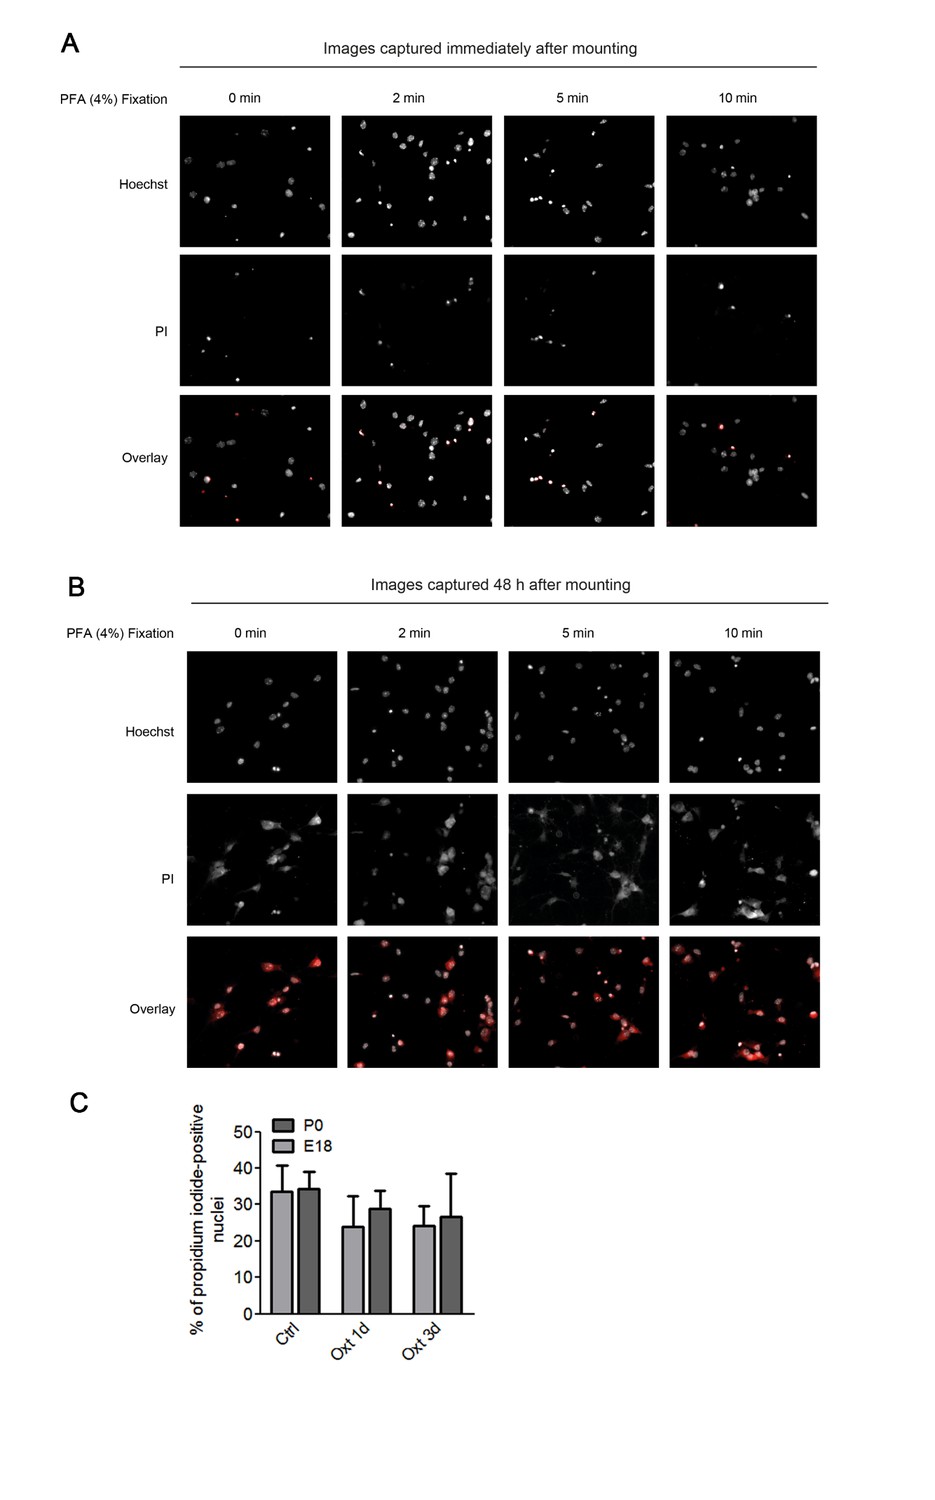
Assessment of apoptosis using propidium iodide.
(A) Representative images of propidium iodide (PI)-positive nuclei and Hoechst-labeled nuclei captured immediately after mounting after fixation under different conditions. (B) Representative images of propidium iodide (PI)-positive nuclei and Hoechst-labeled nuclei captured 48 hr after mounting after fixation under different conditions. (C) PI-positive neurons were quantified in separate channels and expressed as a percentage of total cells assessed by Hoechst staining in the same field. Data are expressed as mean ± SD.
Additional files
-
Supplementary file 1
Summary of the synaptic transmission analysis.
The Table provides an overview of all the electrophysiological experiments performed in this paper. The conditions used for each experiment are reported together with the related figures. Data are expressed as mean ± SEM. Fs: figure supplement.
- https://doi.org/10.7554/eLife.22466.023
-
Supplementary file 2
Summary of the morphological analysis.
The Table provides an overview of all the morphological experiments performed in this paper. The conditions used for each experiment are reported together with the related figures. Data are expressed as mean ± SEM. Fs: figure supplement.
- https://doi.org/10.7554/eLife.22466.024
Download links
A two-part list of links to download the article, or parts of the article, in various formats.
Downloads (link to download the article as PDF)
Open citations (links to open the citations from this article in various online reference manager services)
Cite this article (links to download the citations from this article in formats compatible with various reference manager tools)
Transient oxytocin signaling primes the development and function of excitatory hippocampal neurons
eLife 6:e22466.
https://doi.org/10.7554/eLife.22466


