Distinct responses of Purkinje neurons and roles of simple spikes during associative motor learning in larval zebrafish
- Northwestern University, United States
Figures
Figure 1
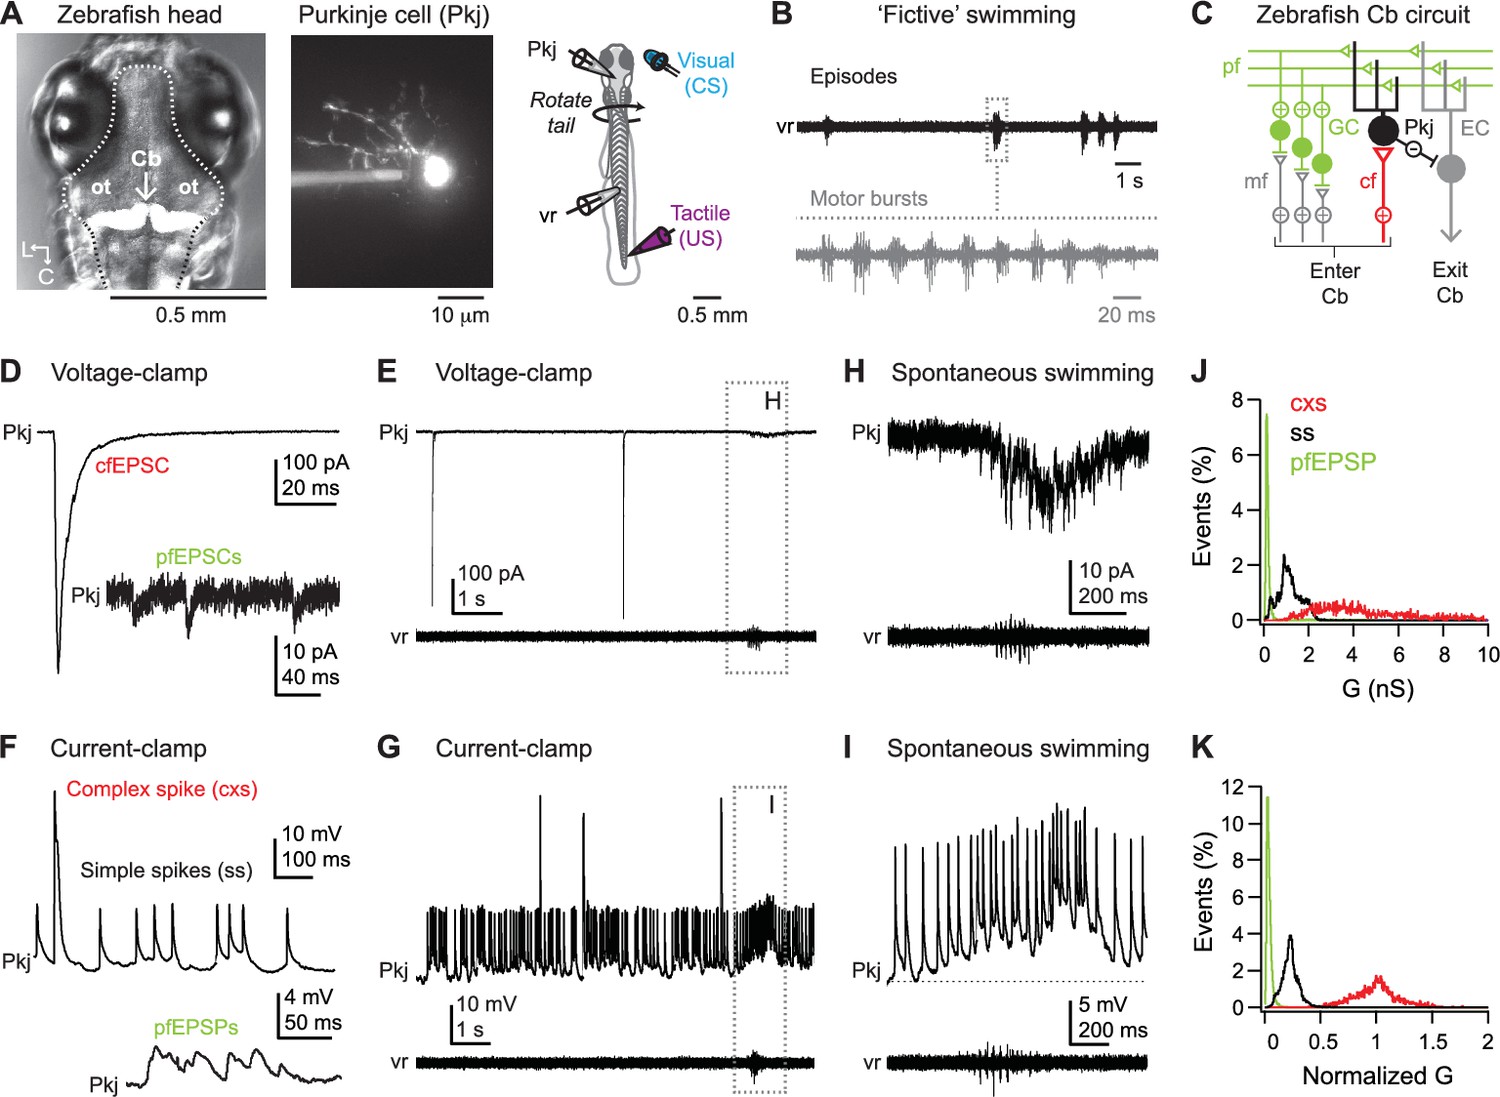
Spontaneous activity during dual recordings of Purkinje cells and ventral roots.
(A) Left, dorsal view of larval zebrafish head illustrating the location of the cerebellum (Cb, arrow). In this image, cerebellar Purkinje cells are fluorescently labeled by Archaerhodopsin-3 (white). Dotted line, outline of brain. ot: optic tectum. L, lateral; C, caudal. Middle, a Purkinje cell filled with Alexa Fluor 488. Right, schematic of the preparation. (B) Sample ventral root (vr) recording showing episodic bouts of fictive swimming (compressed time base, black) and cyclical motor bursts (expanded time base, grey). (C) Schematic of the zebrafish cerebellum. Pkj: Purkinje cell. EC: eurydendroid cell; GC: granule cell; cf: climbing fiber; mf: mossy fibers; pf: parallel fibers; Cb: cerebellum. (D) Sample voltage-clamp recording (holding potential = −60 mV, all voltage-clamp records) of cfEPSC and pfEPSCs (inset). (E) Sample voltage-clamp recording (top) and simultaneous vr recording (bottom). Box, episode of spontaneous swimming, expanded in (H). (F) Sample current-clamp recording of complex and simple spikes (top) and pfEPSPs (bottom). (G) Sample current-clamp recording of Purkinje cell spikes and simultaneous vr recording. Box, episode of spontaneous swimming, expanded in (I). Recordings in (E) and (G) are from the same cell. (H) Higher gain voltage-clamp and vr recording from (E) of clustered parallel fiber EPSCs during spontaneous swimming. (I) Higher gain current-clamp and vr recording from (G) of a parallel fiber driven long-lasting depolarization and simple spikes during spontaneous swimming. Dotted line, inter-spike potential (−56 mV) to illustrate depolarization. (J) Distribution of conductances associated with all complex spikes (cxs), simple spikes (ss), and parallel fiber EPSPs (pfEPSPs) included in the study. Absolute conductances (bin width, cxs and ss = 0.02 nS; pfEPSP = 0.01 nS). (K) As in (J) but conductances normalized to the mean cxs conductance in each cell (bin width = 0.005).
Figure 2
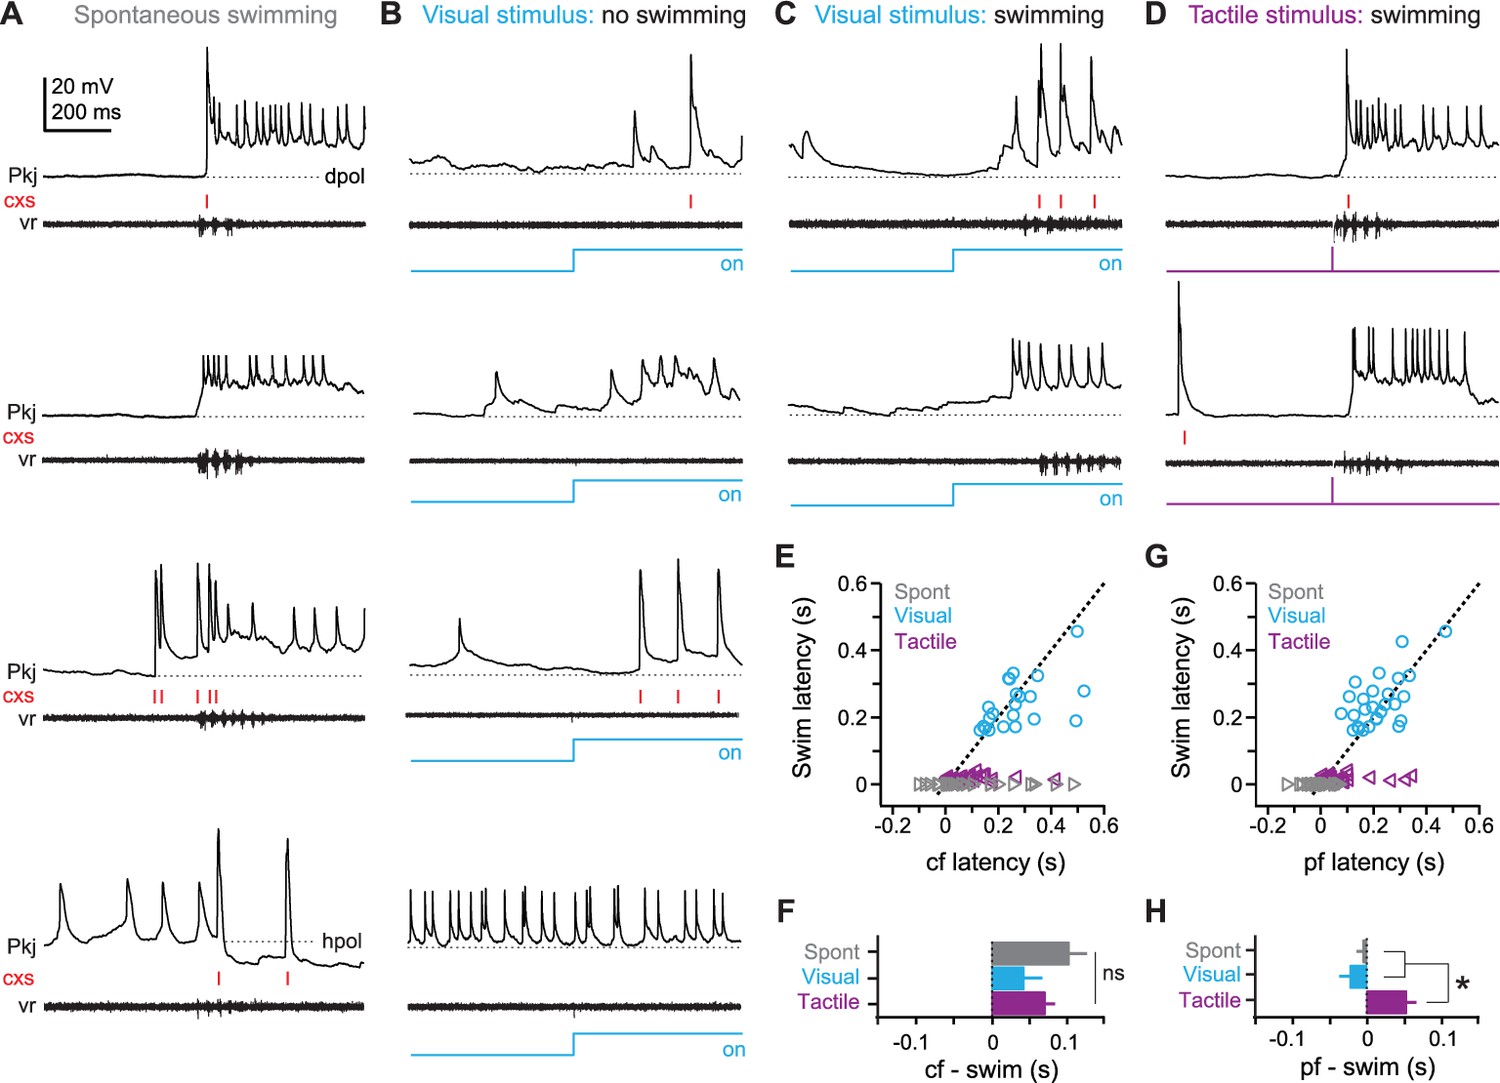
Purkinje cell responses during sensory stimuli and motor commands associated with fictive swimming.
(A) Responses of four different Purkinje cells (top to bottom) during spontaneous swimming, showing different combinations of climbing fiber, parallel fiber, and putative inhibitory input, resulting in complex spikes, simple spikes with long-lasting depolarizations, and/or hyperpolarization. In all panels, complex spikes (cxs) are indicated with red tick marks and the corresponding ventral root recording is included. Dotted lines at inter-spike potentials (top to bottom, −59 mV, −61 mV, −55 mV, −57 mV) illustrate depolarization (dpol) and hyperpolarization (hpol). (B) Responses of four different Purkinje cells to a visual stimulus (blue step, all panels) that did not evoke swimming. Dotted lines, top to bottom, −57 mV, −54 mV, −55 mV, −50 mV. (C) Responses of two different Purkinje cells to a visual stimulus that elicited swimming, either with (top) or without (bottom) complex spikes during the swimming episode. Dotted lines, top and bottom, −63 mV, −66 mV. (D) Responses of two different Purkinje cells to tactile stimulus (purple step, all panels), either with (top) or without (bottom) complex spikes during the swimming episode. Dotted lines, top and bottom, −60 mV, −66 mV. (E) Swim latency vs. climbing fiber response (complex spike) latency relative to stimulus onset for visual (blue), and tactile (purple) evoked swimming for all cells. Data for spontaneous (grey) swimming is included at a latency of 0. Dotted line, unity. (F) Mean latency of first climbing fiber response (complex spike) relative to swimming onset calculated from difference between x and y values in (E). Zero indicates coincidence. F(2,80)=1.84. (G) As in (E) but for latency of long-lasting (>200 ms) pfEPSP-initiated depolarizations. (H) As in (F) but for long-lasting depolarizations. F(2,88)=16.54. In all figures, data are plotted as mean ± SEM, and asterisks on plots indicate p<0.05.
Figure 3
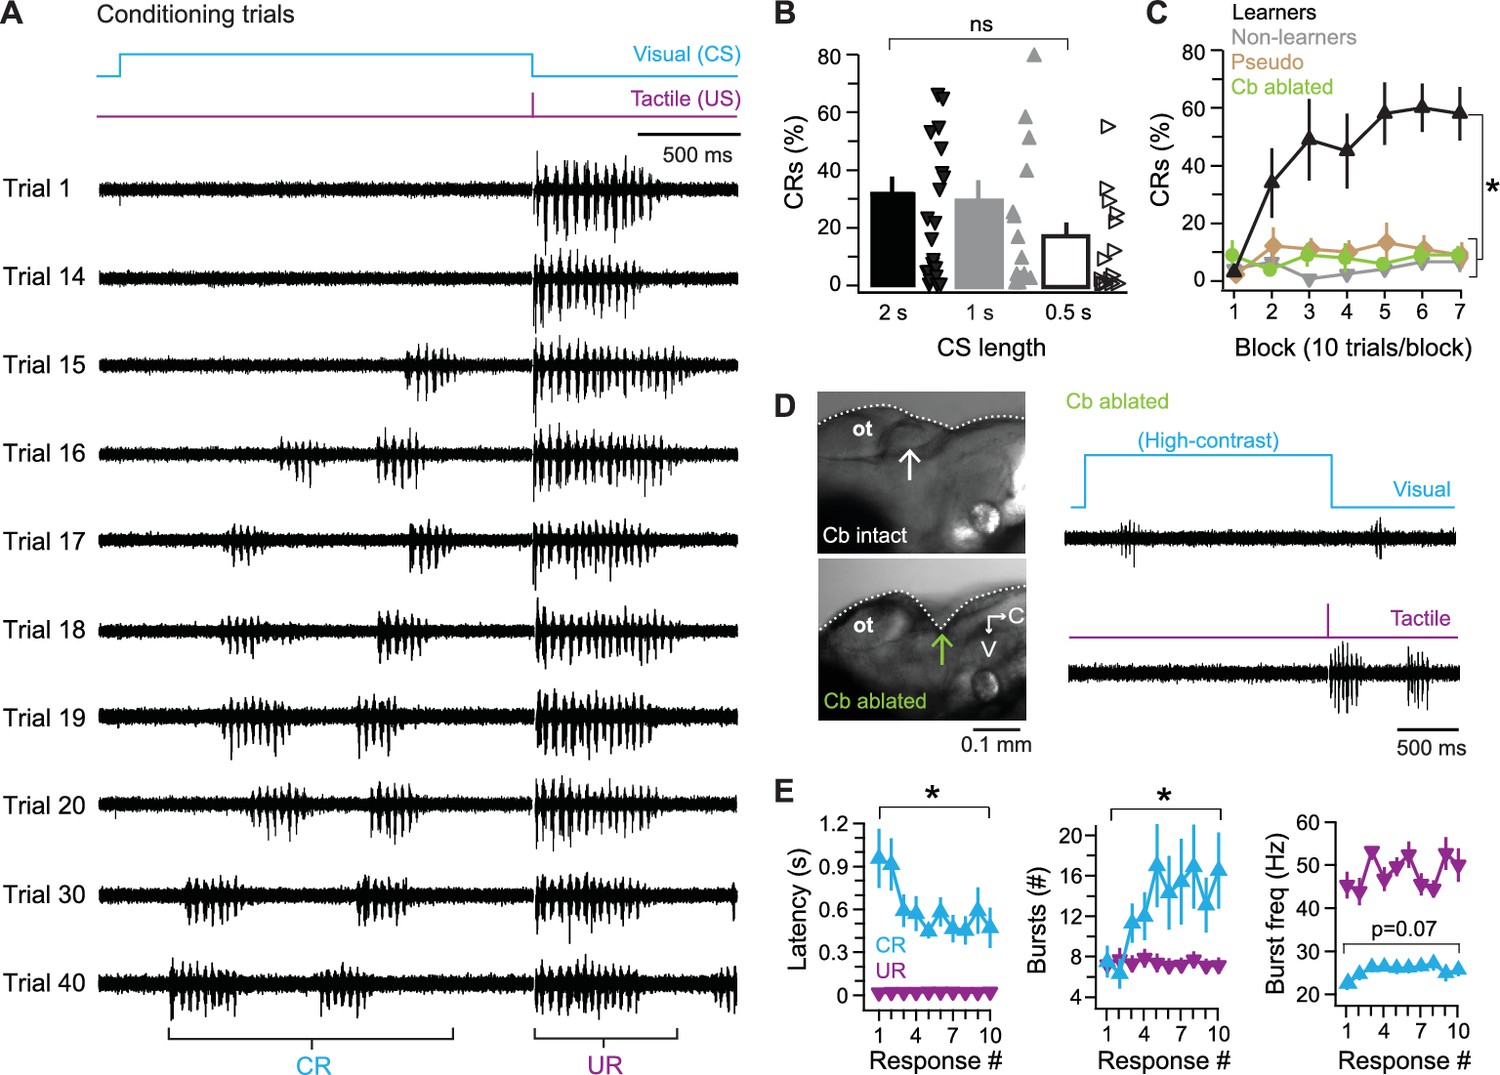
Cerebellar associative learning.
(A) Sample ventral root recordings during training, illustrating the emergence and persistence of conditional responses (CRs) over time, as well as unconditional responses (URs). Trial numbers as indicated. Blue step, conditional stimulus (CS); purple step, unconditional stimulus (US). (B) Percentage of trials with a CR over all 70 trials. Bars are means; markers are data from individual fish; ns, not significant. F(2,49)=0.97. (C) Percentage of trials with a CR per 10-trial block for learner and non-learner groups from fish in (B) trained with 2 s CS. F(6,18)=4.92. (D) Left side view of exposed zebrafish brain before (top) and after (bottom) ablation of the cerebellum (arrow). V, ventral; C, caudal. Right, sample ventral root recordings of swimming evoked by a high-contrast visual stimulus (top) or tactile stimulus (bottom) after cerebellar ablation. (E) Changes in CR properties from first 10 CR trials in learner fish. UR data plotted for comparison. Left, swimming latency (relative to CS or US onset), CR: F(9,81)=3.80, UR: F(3.98,81) = 0.78, p=0.5. Middle, number of bursts per swim response, CR: F(9,81)=2.8, UR: F(9,81)=1.60, p=0.13. Right, frequency of bursts, CR: F(9,81)=2.84, UR: F(3.47,81) = 1.82, p=0.16.
Figure 4
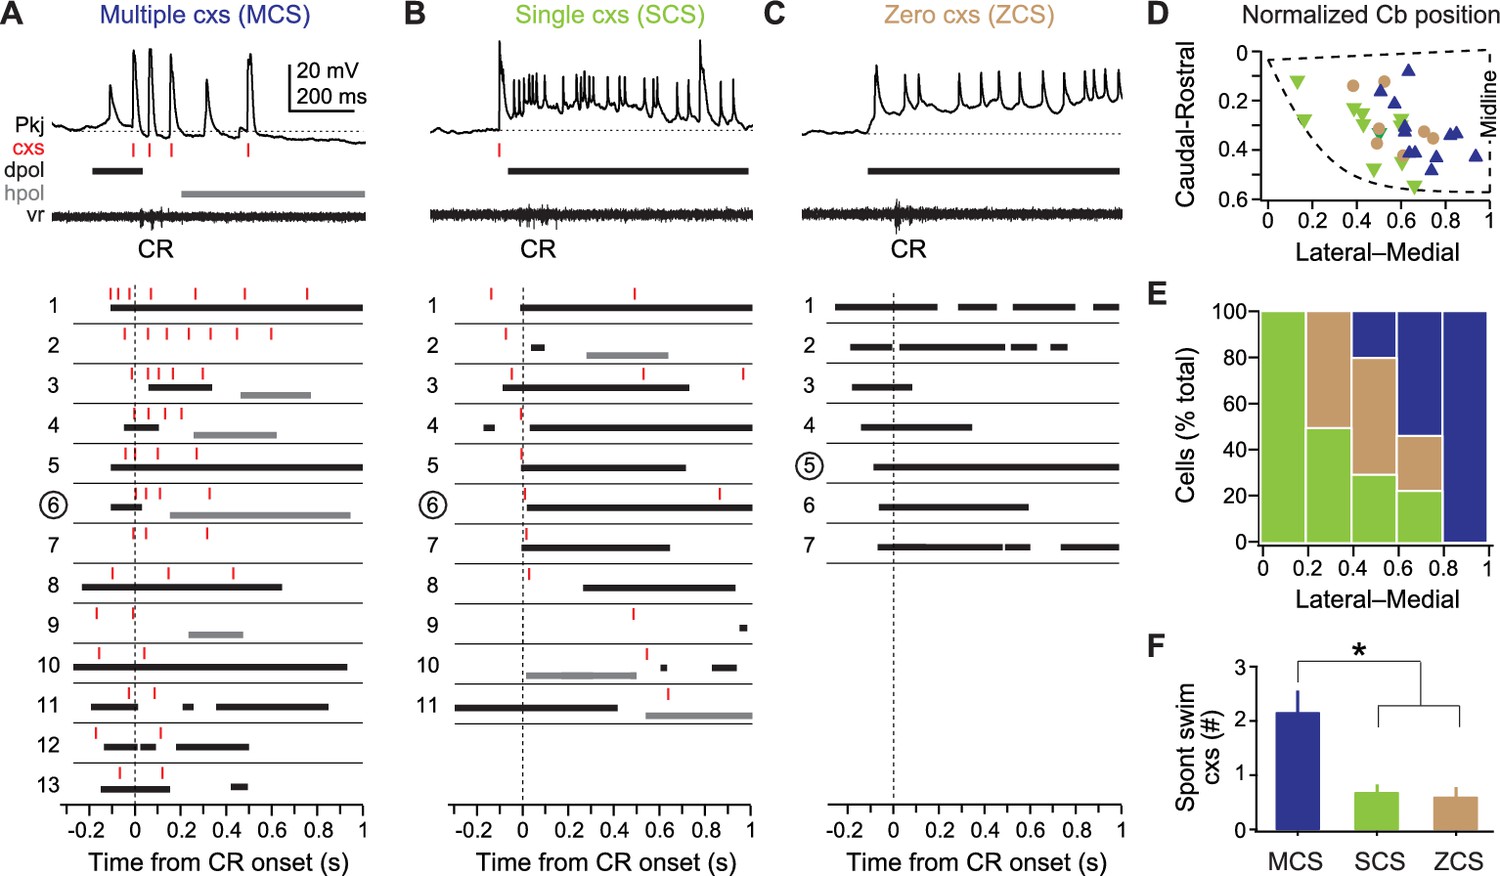
Three classes of Purkinje cell activity during learned swimming.
(A) Sample recording from a multiple complex spike (MCS) cell, top, during the conditional response (CR) late in training. Horizontal dotted line, −55 mV. Schematized responses from MCS cells, below, aligned to the CR onset (vertical dotted line). For (A), (B), and (C): red ticks, complex spikes; black bars, pfEPSP-initiated depolarizations (dpol); grey bars, hyperpolarizations (hpol). MCS cells are ordered by the number of complex spikes within the CR. The number corresponding to the sample recording is circled. (B) As in (A) but for single complex spike (SCS) cells. Horizontal dotted line, −59 mV. SCS cell schematized responses are ordered by the latency of CR-related complex spikes. (C) As in (A) but for zero complex spike (ZCS) cells. Horizontal dotted line, −56 mV. ZCS cell schematized responses are ordered by the latency of CR-related pfEPSPs. (D) Topographical distribution of MCS, SCS, and ZCS cells in the cerebellum. The position of the rostrolateral, rostromedial, and caudomedial corners are plotted (dashed line) to approximate the edges of the hemisphere, and relative positions of cells were calculated accordingly. (E) Ratios of each class of Purkinje cells along the mediolateral cerebellar axis. (F) Number of complex spikes in each class of Purkinje cells during episodes of spontaneous swimming. F(2,22)=7.78.
Figure 5

MCS Purkinje cell responses over the course of cerebellar learning.
(A) Sample recording from an MCS cell during spontaneous swimming. (B) Sample recording from the same MCS cell in (A), at the beginning of training (early), just before acquisition of the conditional response (CR; middle), and after CR acquisition (late). (C) Top, number of complex spikes during three forms of swimming: spontaneous, the CR, and the unconditional response (UR). F(2,35)=9.20. Bottom, mean latency of the first complex spike in all cells. F(2,35)=23.69. (D) Distribution of the latency of all complex spikes during swimming in all MCS cells (bin width = 50 ms). (E) The number of complex spikes during the first 500 ms of the conditional stimulus (CS). MCS, SCS (single complex spike), and ZCS (zero complex spike) cells, and cells from pseudoconditioned fish are shown for comparison. F(24,248)=1.95. For all similar plots, trial 0 is the first of consecutive trials with CRs for trained fish, or the tenth trial for pseudoconditioned fish (i.e., the median acquisition trial for trained fish). (F) The number of complex spikes during three trials without a CR for early, mid, and late training, for the first 500 ms of the CS (left; F(1.76,32) = 6.47) and 500 ms after the US (right). Cells from pseudoconditioned fish are shown for comparison. (G) Mean complex spike latency relative to CS onset for MCS cells. F(8,40)=2.01. (H) CV of complex spike timing relative to CS onset early in training, late in training, and relative to the CR onset for MCS cells. The CV was calculated across trials for each cell, and the mean CV for all cells is plotted. CS points include trials regardless of whether a CR was produced. CR point represents the latency of the first complex spike.
Figure 6
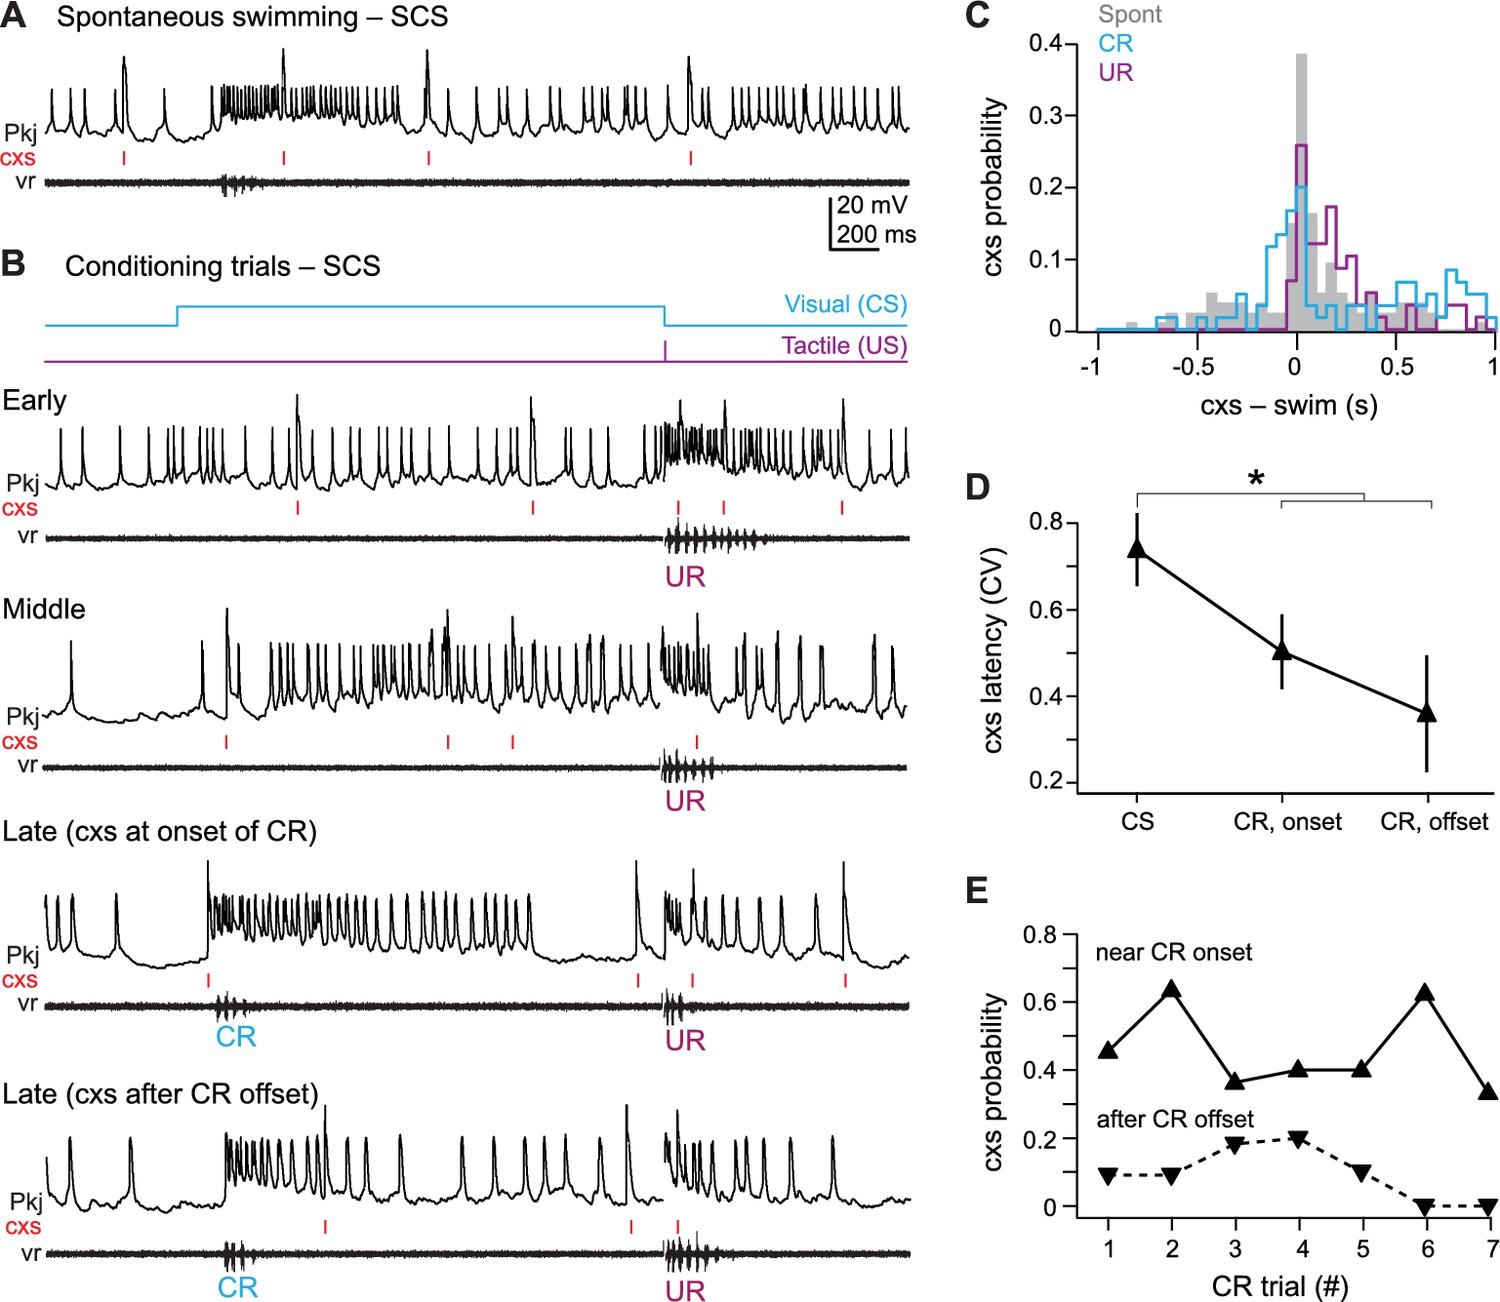
SCS Purkinje cell responses over the course of cerebellar learning.
(A) Sample recording from a single complex spike (SCS) cell during spontaneous swimming. (B) Sample recording from the same SCS cell in (A) at the beginning of training (early), just before acquisition of the conditional response (CR; middle), and on two trials after CR acquisition with complex spike activity either near CR onset or after CR offset within 300 ms of the CR. (C) The distribution of the latency of all complex spikes in SCS cells relative to spontaneous, CR, and unconditional response (UR) swimming onset. (D) The coefficient of variation (CV) of complex spike (cxs) latency relative to the conditional stimulus (CS) onset, the CR onset, and the CR offset for all SCS cells. The CV for each cell was calculated across trials, and the mean CV for all cells is plotted. (E) The probability of a complex spike within 300 ms of the onset (solid lines) or within 300 ms after the offset (dashed lines) of the CR for all SCS cells.
Figure 7
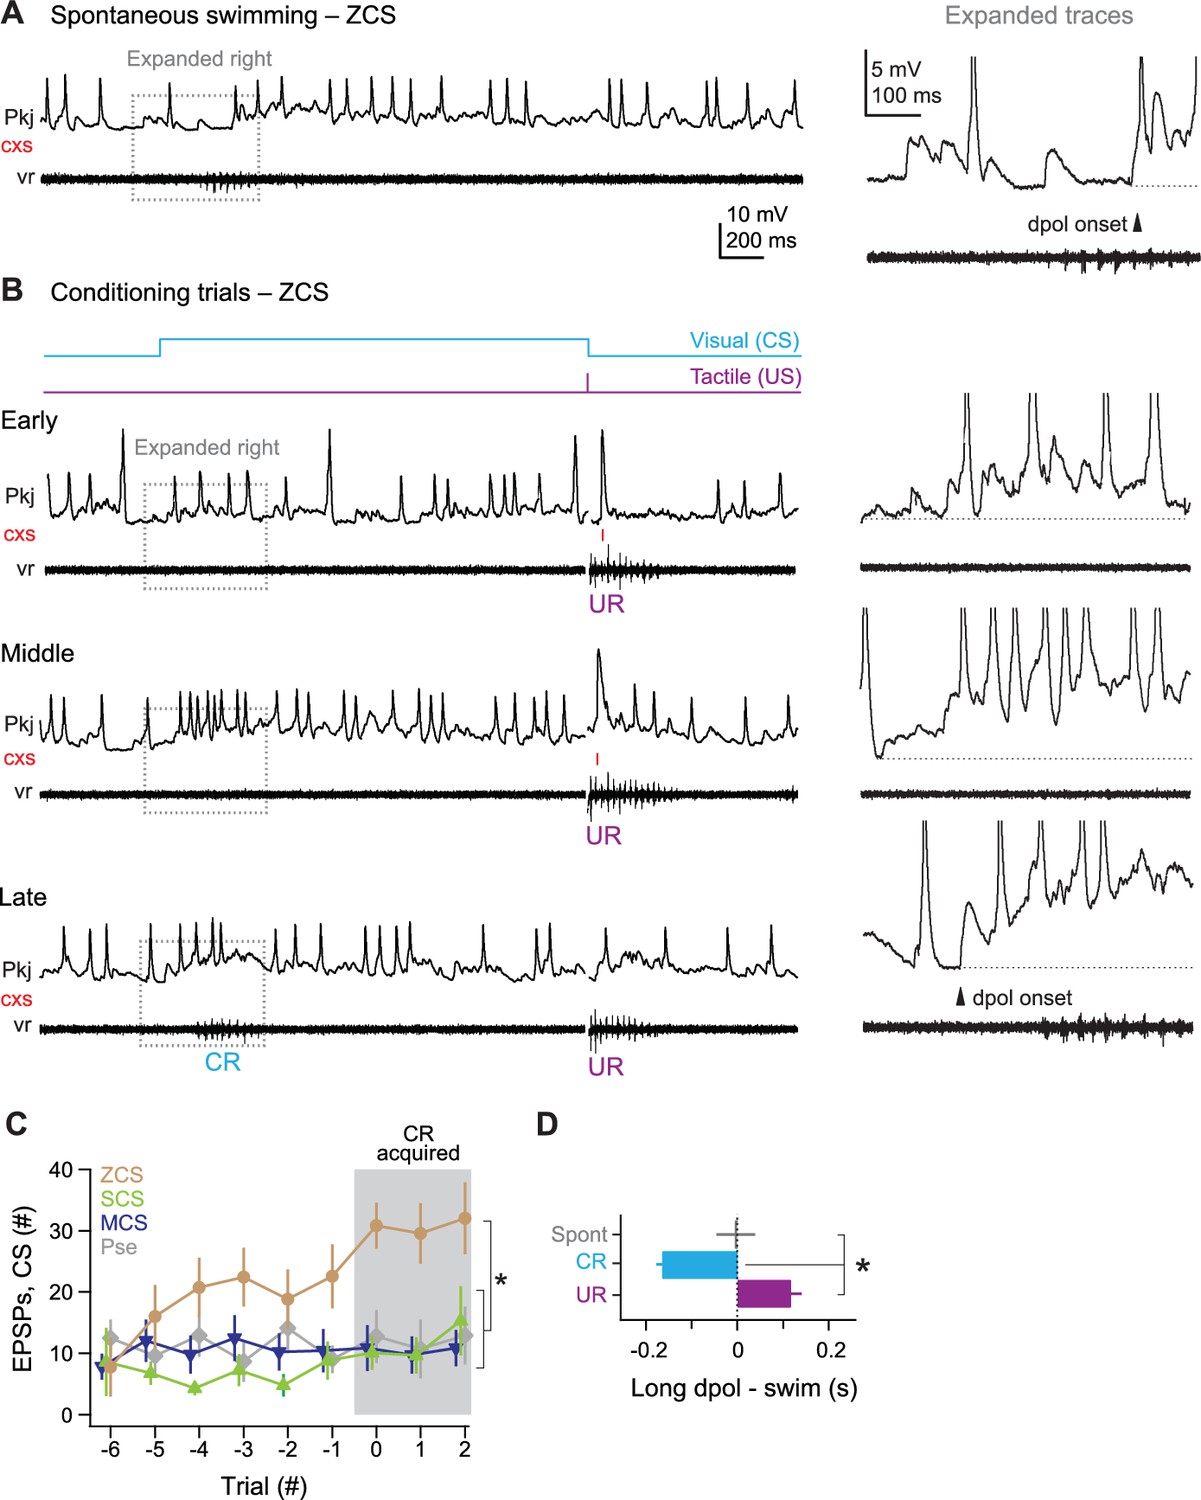
ZCS Purkinje cell responses over the course of cerebellar learning.
(A) Left, sample recording from a zero complex spike (ZCS) cell during spontaneous swimming. Right, magnification of boxed region at left. Arrow: onset of long-lasting depolarization. Dotted line, −51 mV. (B) Sample recording from the same ZCS cell in (A) at the beginning of training (early), just before acquisition of the conditional response (CR; middle), and after CR acquisition (late). Dotted lines, top to bottom, −51 mV, −54 mV, and −54 mV. (C) The number of parallel-fiber EPSPs (pfEPSPs) during the 2 s conditional stimulus (CS) for ZCS cells, as well as MCS, SCS cells and cells from pseudoconditioned fish. F(11.16,198) = 2.18. (D) Latency of pfEPSP-initiated long-lasting depolarization relative to the onset of spontaneous swimming, the CR, and the unconditional response (UR). F(2,18)=22.33.
Figure 8
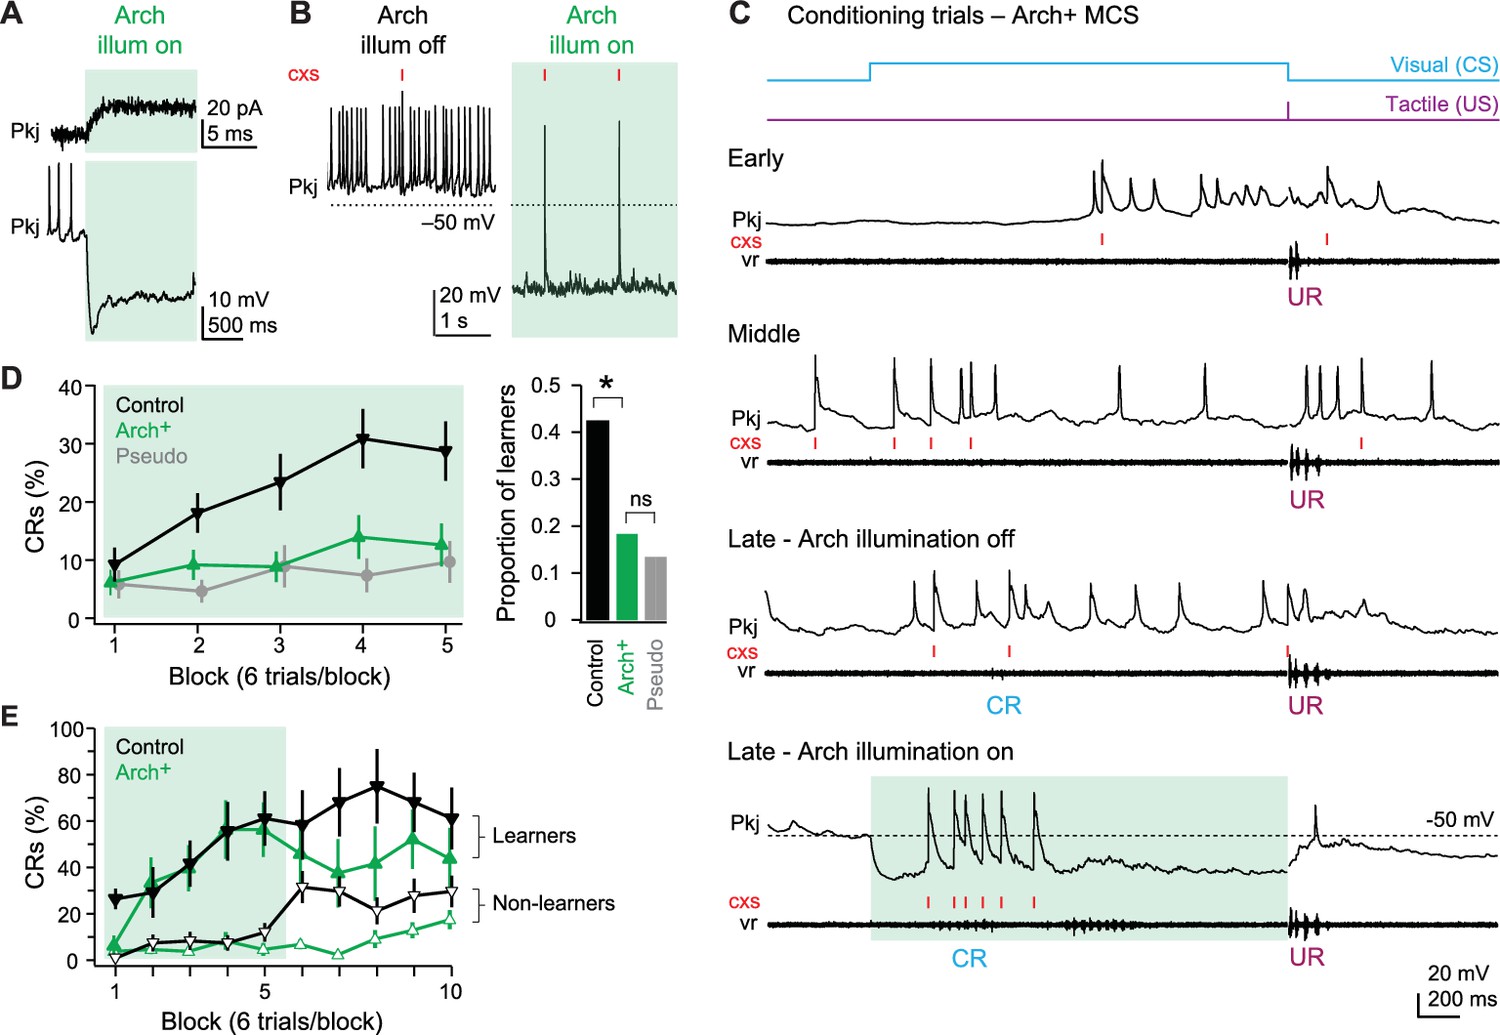
Effects of Arch-mediated simple spike suppression on acquisition of learned responses.
(A) Sample voltage-clamp (top), holding potential = −60 mV, and current-clamp (bottom) recordings from an Arch+ Purkinje cell during Arch activation. Green shading in all panels in all figures indicates cerebellar illumination with Arch-activating light. (B) Current-clamp recording of an Arch+ Purkinje cell without (left) and with (right) activation of Arch. Two complex spikes (cxs) are evident during illumination. (C) Response of an Arch+multiple complex spike (MCS) Purkinje cell at the beginning of training (early), just before acquisition of the conditional response (CR; middle), after CR acquisition without simple spike suppression (late - Arch illumination off) and after CR acquisition with simple spike suppression (late - Arch illumination on). (D) Left, CR percentage per 6-trial block of control, Arch+, and pseudoconditioned fish that received Arch-activating cerebellar illumination during visual stimulation from the onset of training. F(8,544)=2.14. Right, proportion of learner fish for each group. X2(1, N=96)=6.66. (E) CR percentage per 6-trial block for Arch+ (green) or control (black) fish classed as learners (closed symbols) or non-learners (open symbols) in the first 30 trials.
Figure 9
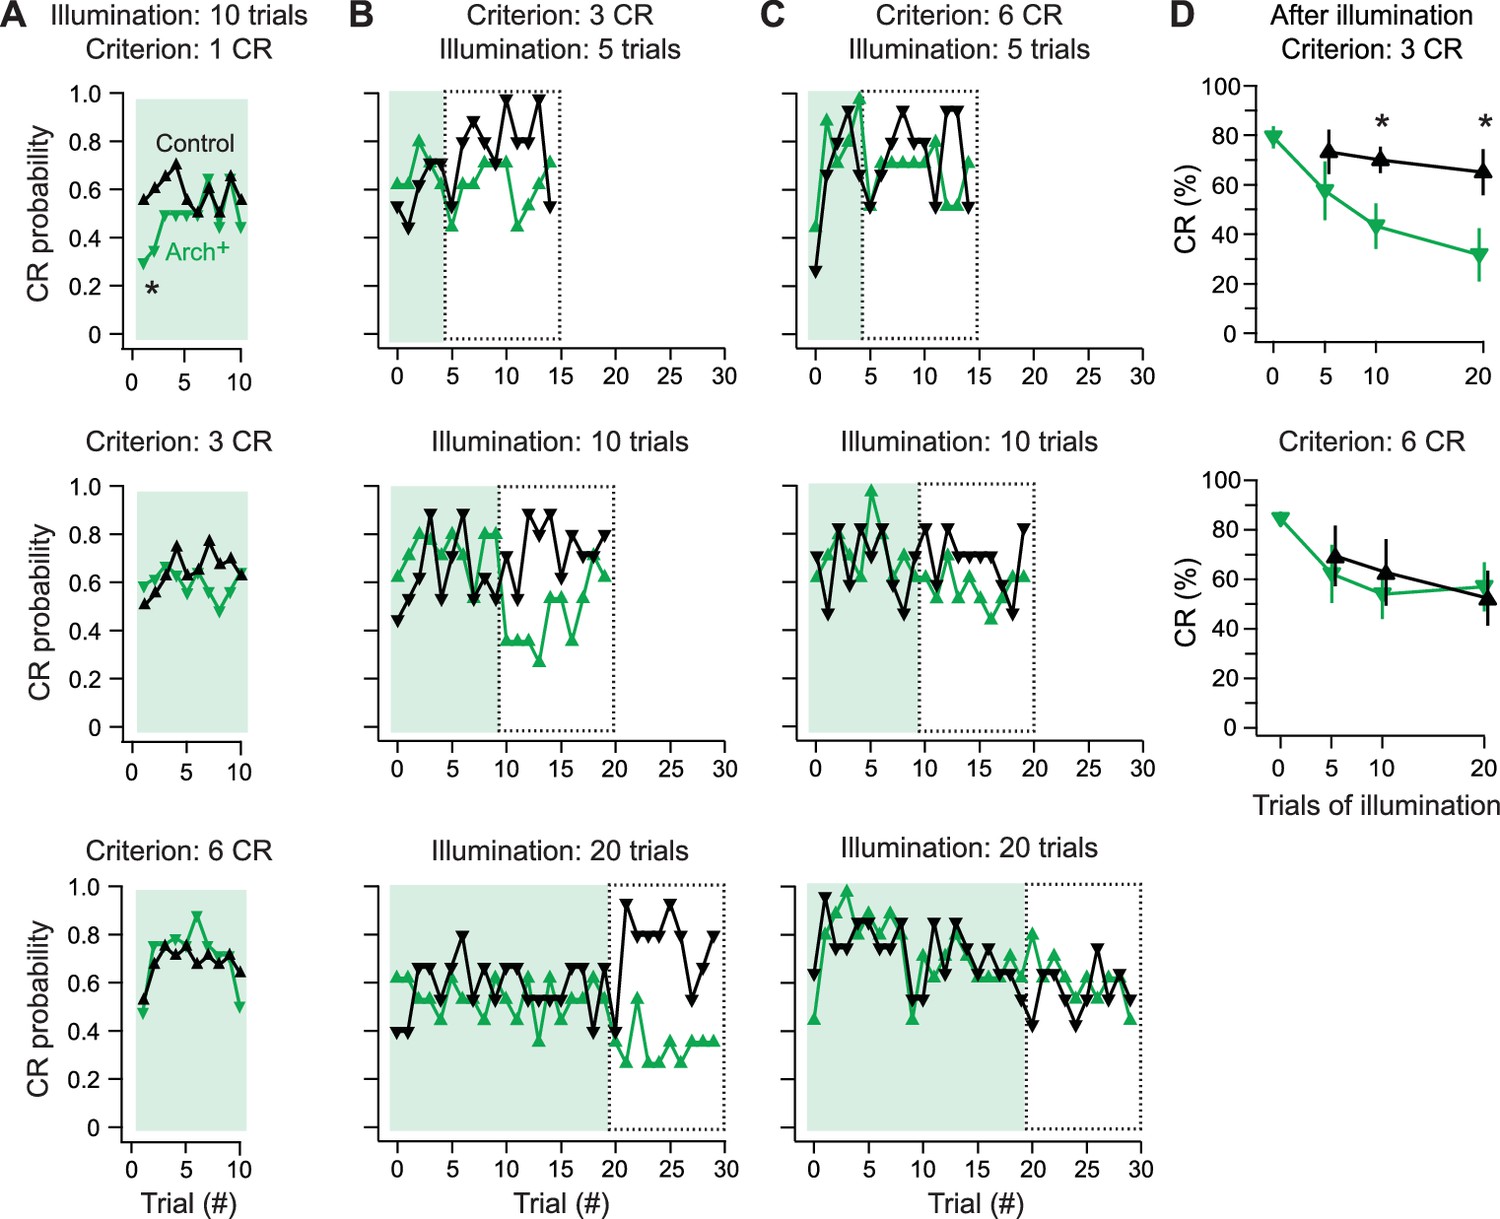
Effects of Arch-mediated simple spike suppression on expression and maintenance of learned responses.
(A) Conditional response (CR) probability across fish during cerebellar Arch-activating illumination applied after fish reached a learning criterion of 1 (top), 3 (middle), or 6 (bottom) consecutive trials with a CR without simple spike suppression. (B) CR probability across fish during 5 (top), 10 (middle), or 20 (bottom) trials of Arch-activating illumination, followed by 10 trials without, for 3-CR fish. Dotted boxes, trials from which CR percentage is calculated in (D). (C) Same as (B) for 6-CR fish. (D) CR percentage calculated from trials after Arch-activating illumination for 3-CR (top) and 6-CR (bottom) fish (from dotted boxes in B and C).
Download links
A two-part list of links to download the article, or parts of the article, in various formats.
Downloads (link to download the article as PDF)
Open citations (links to open the citations from this article in various online reference manager services)
Cite this article (links to download the citations from this article in formats compatible with various reference manager tools)
Distinct responses of Purkinje neurons and roles of simple spikes during associative motor learning in larval zebrafish
eLife 6:e22537.
https://doi.org/10.7554/eLife.22537


