Transient acidosis while retrieving a fear-related memory enhances its lability
- Roy J and Lucille A Carver College of Medicine, University of Iowa, United States
- University of Toledo, United States
- Howard Hughes Medical Institute, Roy J and Lucille A Carver College of Medicine, University of Iowa, United States
Figures
Figure 1 with 2 supplements
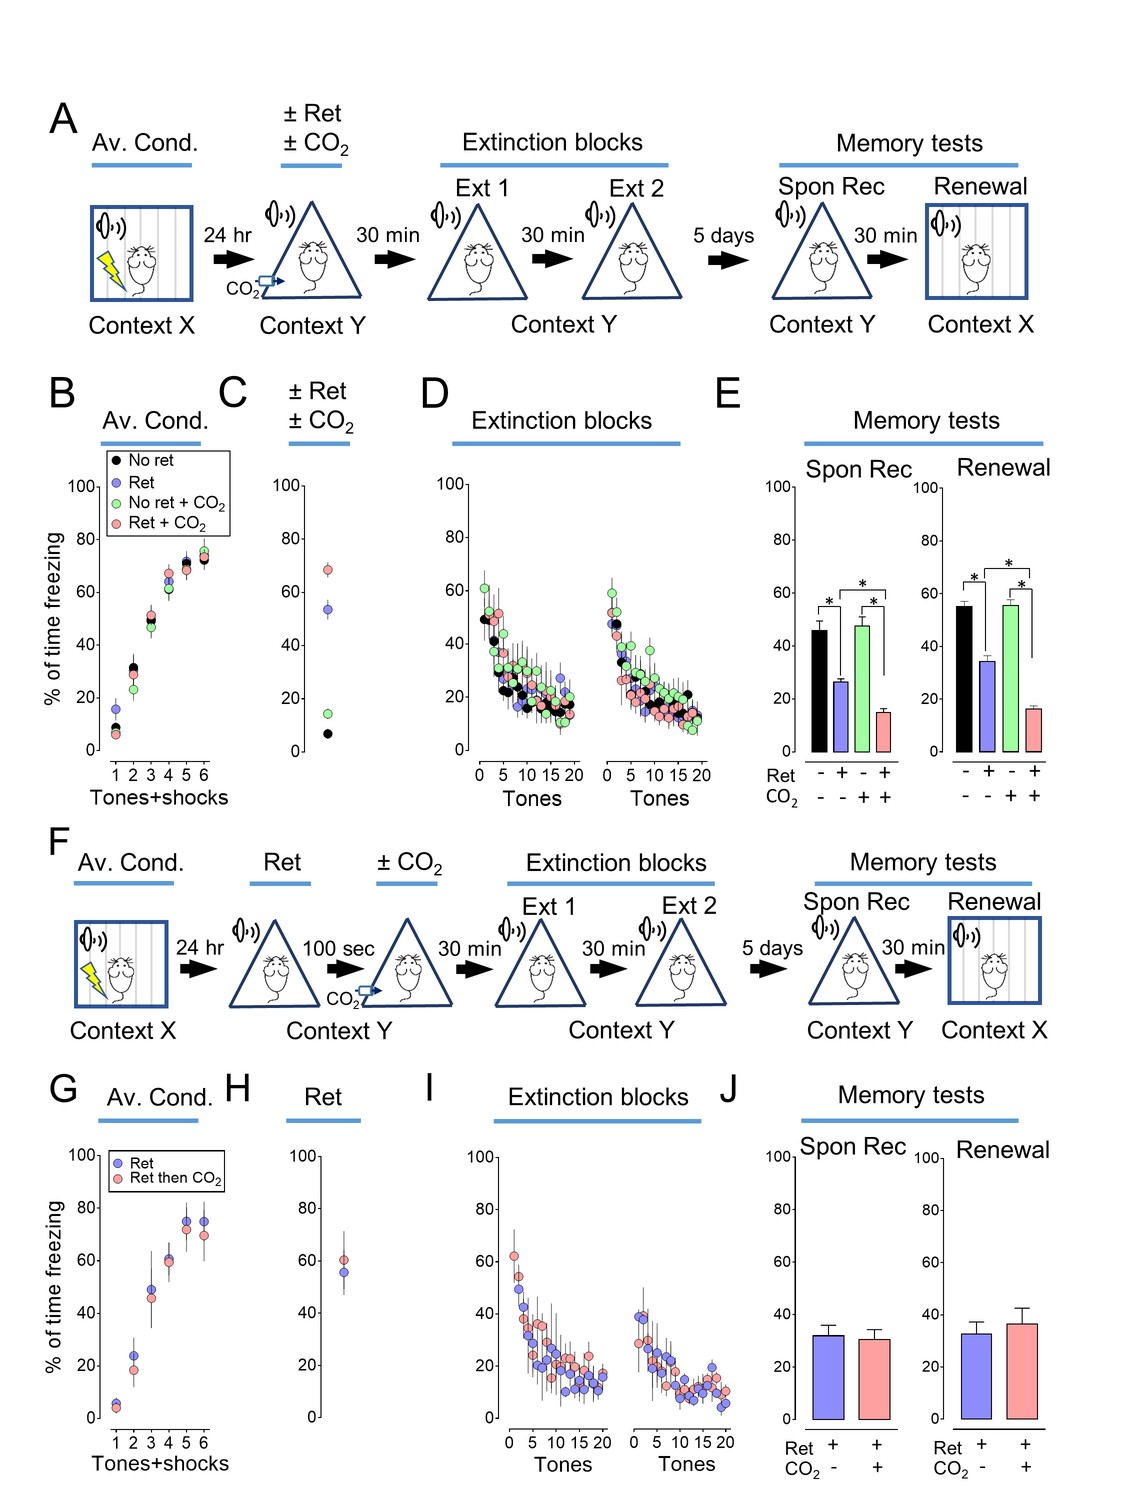
Inhaling CO2 during a retrieval tone augments the effect of extinction.
(A) Schematic of protocol for auditory aversive conditioning (also called fear conditioning), memory modification, and testing. The protocol contained four main components. (1) On day 1, mice underwent aversive conditioning (Av. Cond.) during which they received 6 tones paired with 6 foot shocks in context X. (2) On day 2, mice were placed in a modified chamber (context Y) and were randomly assigned to one of four groups. After 5 min, one group was presented with a single tone (Ret) and then remained in the chamber for two more minutes. One group breathed 10% CO2 for 7 min. One group breathed 10% CO2 and was presented with the tone. And one group received neither CO2 nor retrieval. (3) Thirty minutes later in context Y, all mice were treated with two blocks of extinction protocols (Ext 1 and Ext 2), each consisting of 20 tones; mice in the retrieval groups received 19 instead of 20 tones in the first block of extinction tones. (4) On day 7, mice were tested for freezing in response to 4 tones delivered in context Y (Spontaneous Recovery). Thirty minutes later they were tested for freezing in response to 4 tones delivered in context X (Renewal). (B–E) Data are the percentage of time mice were freezing in response to tones during aversive conditioning (B), the Ret/CO2 intervention (C), extinction (D), and during the two memory tests (E). (F) Schematic of protocol for auditory aversive conditioning, memory modification, and testing. The protocol was identical to that shown in panel A with the exception that the retrieval tone was presented and then 100 s later mice inhaled 10% CO2 for 7 min. (G–J) Data are the percentage of time mice were freezing during aversive conditioning (G), retrieval (H), extinction (I), and the two memory tests (J). Data are mean±SEM. n = 16 mice in each group for panels B-E and n = 8 mice in each group for panels G-J. * indicates p<0.05 by one-way ANOVA with Tukey’s post hoc multiple comparison for panels B-E. For panel E, No ret vs Ret, p=0.0001; No ret vs No ret + CO2, p=0.9683; No ret vs Ret + CO2, p<0.0001; Ret vs No ret + CO2, p<0.0001; Ret vs Ret + CO2, p=0.0300; No ret + CO2 vs Ret + CO2, p<0.0001. For panel E right, No ret vs Ret, p<0.0001; No ret vs No ret + CO2, p=0.9974; No ret vs Ret + CO2, p<0.0001; Ret vs No ret + CO2, p<0.0001; Ret vs Ret + CO2, p<0.0001; No ret + CO2 vs Ret + CO2, p<0.0001. There were no statistically significant differences between groups in panels G-J by unpaired Student’s t-test.
-
Figure 1—source data 1
Contexts for experiments.
Chart indicates the conditions used for contexts X, Y, Z, and ZZ.
- https://doi.org/10.7554/eLife.22564.003
Figure 1—figure supplement 1
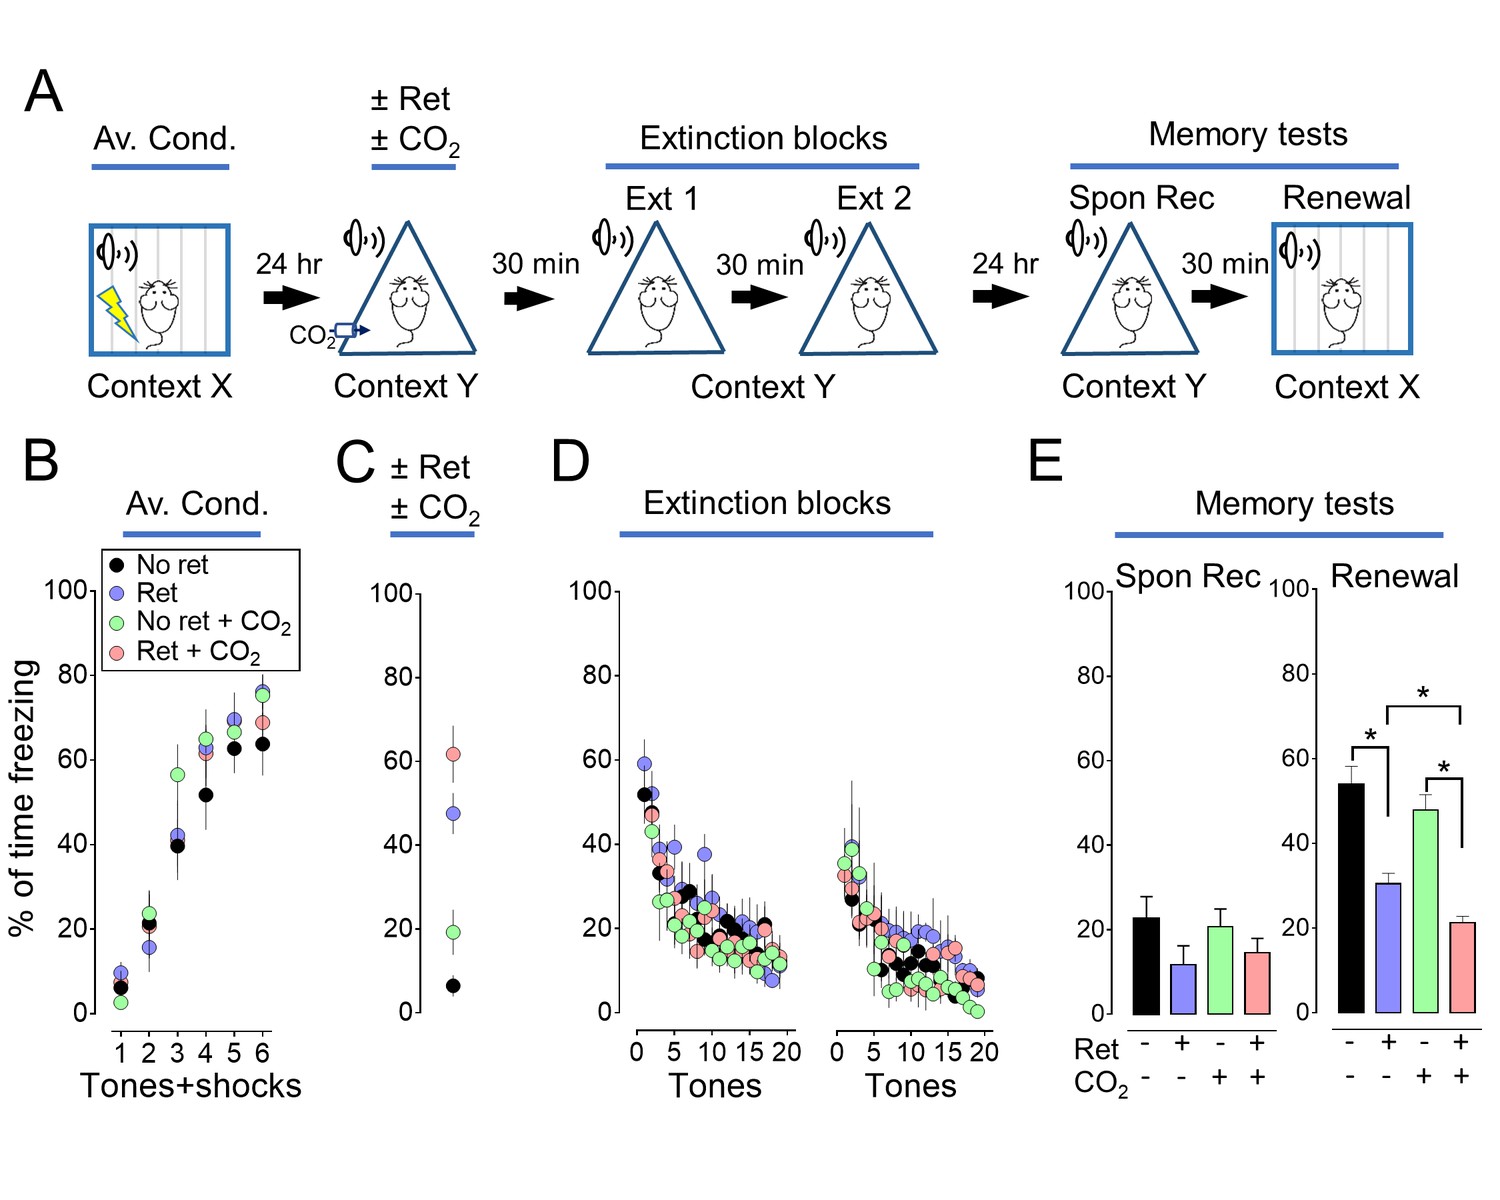
Inhaling CO2 during a retrieval tone augments the effect of extinction.
In Figure 1, we assayed memory 5 days after extinction. Previous studies also tested memory 1 day after extinction. With that shorter interval, a retrieval cue did not produce a decrease in freezing in the spontaneous recovery test (Monfils et al., 2009; Clem and Huganir, 2010). But, retrieval did decrease freezing in the renewal test. We performed a study like that in Figure 1, except we waited only 1 day after extinction to test memory. Consistent with earlier studies (Monfils et al., 2009; Clem and Huganir, 2010), 1 day after extinction, retrieval did not significantly reduce freezing in the spontaneous recovery test, but it did reduce freezing in the renewal test. Moreover, CO2 inhalation enhanced the effects of retrieval in the renewal test. (A) Schematic of protocol for auditory aversive conditioning, memory modification, and testing. The protocol was identical to that shown in Figure 1A and described in its legend with the exception that the interval between extinction and testing was 24 hr instead of 5 days. (B–E) Data are the percentage of time mice were freezing in response to tones during aversive conditioning (B), the retrieval/CO2 intervention (C), extinction (D), and the two memory tests (E). Data are mean±SEM. n = 16 mice in each group. * indicates p<0.05 by ANOVA with Tukey’s post hoc multiple comparison. There were no statistically significant differences between groups during the spontaneous recovery test. In the Renewal test: No ret vs Ret, p<0.0001; No ret vs No ret + CO2, p=0.5080; No ret vs Ret + CO2, p<0.0001; Ret vs No ret + CO2, p=0.0027; Ret vs Ret + CO2, p=0.0318; No ret + CO2 vs Ret + CO2, p<0.0001.
Figure 1—figure supplement 2
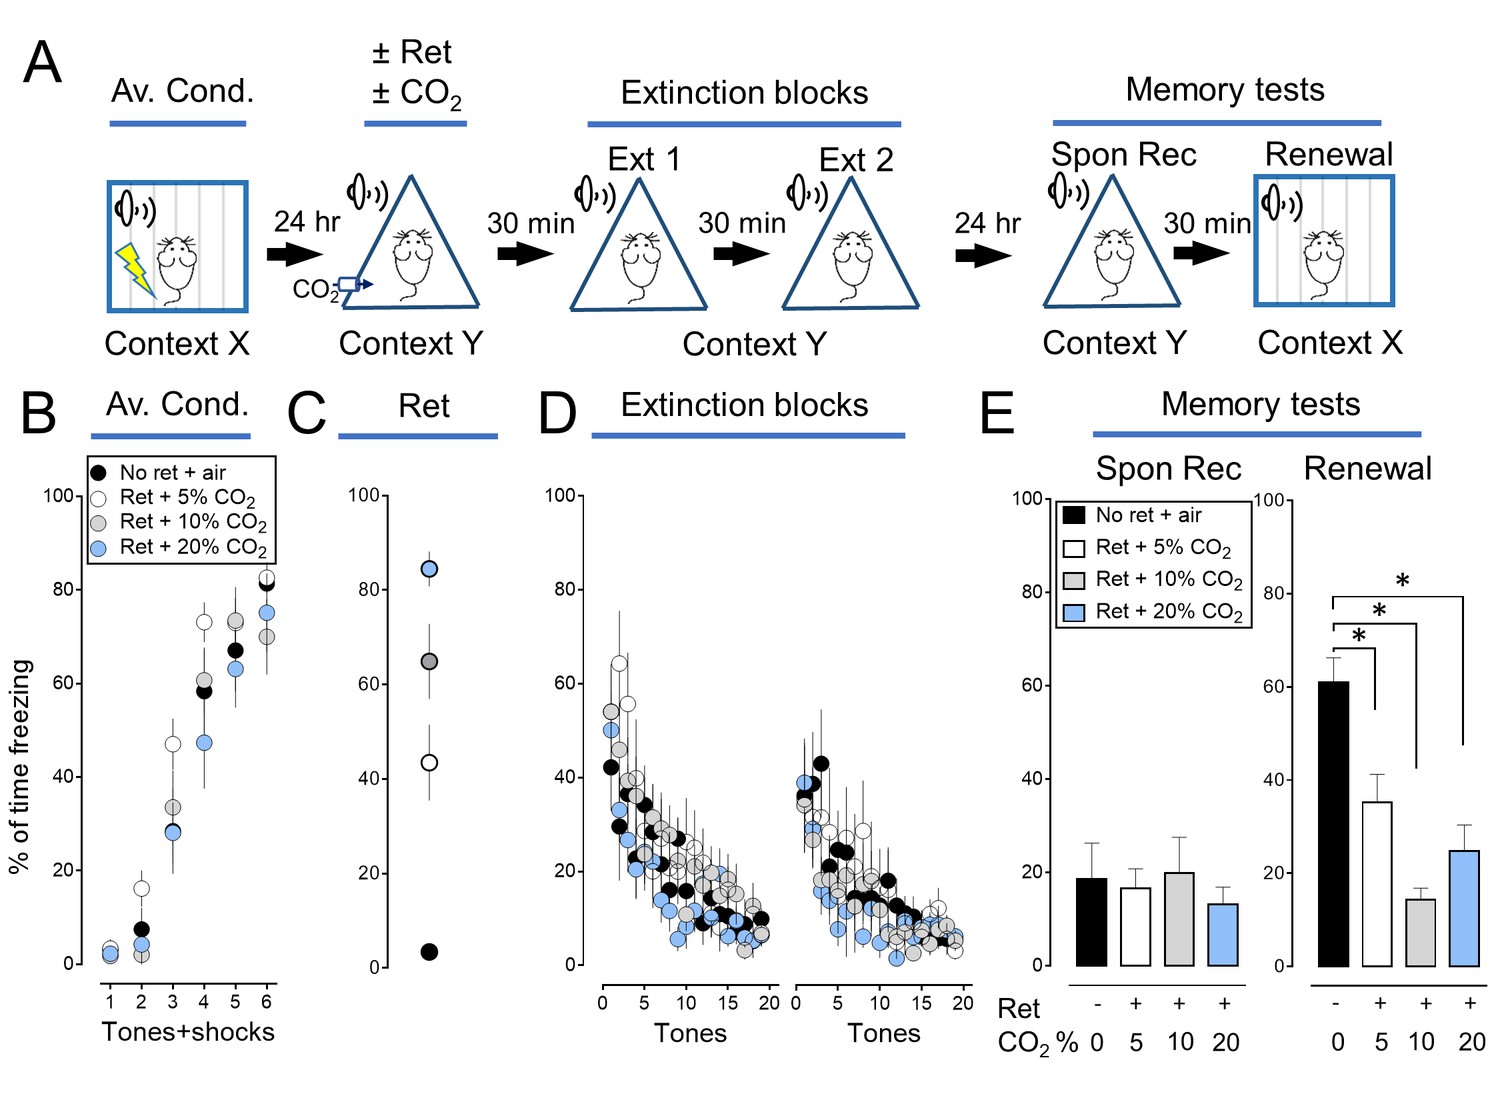
The effect of CO2 on memory retrieval is concentration dependent.
We tested the effect of varying the CO2 concentration (5%, 10%, and 20%) and found that inhaling 10% CO2 during retrieval caused the greatest effect. Therefore, in subsequent experiments we used that concentration. (A) Schematic of protocol for auditory aversive conditioning, memory modification, and testing. The protocol was identical to that shown in Figure 1—figure supplement 1A with the exception that the CO2 concentration was 5%, 10% or 20%. (B–E) Data are the percentage of time mice were freezing in response to tones during aversive conditioning (B), the Ret/CO2 intervention (C), extinction (D), and during the two memory tests (E). Data are mean±SEM. n = 8–10 mice in each group. * indicates p<0.05 by ANOVA with Tukey’s post hoc multiple comparison. There were no statistically significant differences between groups during the spontaneous recovery test. In the Renewal test: No ret vs Ret +5% CO2, p=0.0058; No ret vs Ret +10% CO2, p<0.0001; No ret vs Ret +20% CO2, p=0.0461; Ret +10% CO2 vs Ret +20% CO2, p=0.4693.
Figure 2 with 2 supplements
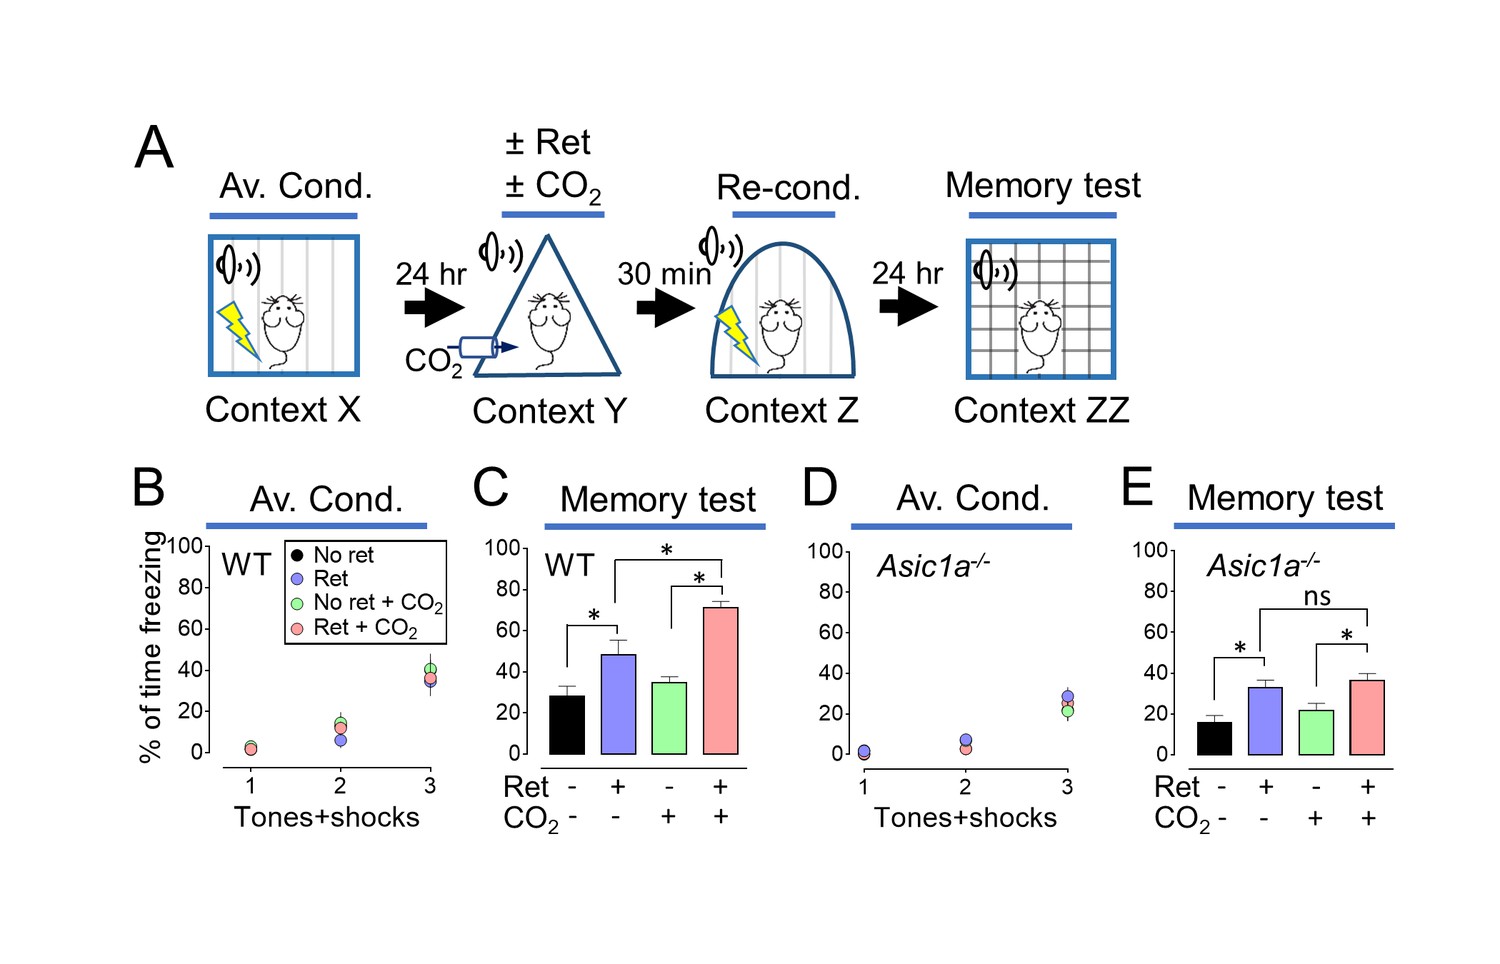
Inhaling CO2 during a retrieval tone augments the effect of reconditioning.
(A) Schematic of protocol for memory enhancement. During aversive conditioning, mice received 3 paired tones and foot shocks in context X. The Ret/CO2 period in context Y was as described for Figure 1A. Thirty minutes later, mice received a tone paired with a foot shock in context Z as reconditioning (Re-Cond.). Memories were tested 1 day later by presenting 4 tones in context ZZ. See also Figure 1—source data 1 and Figure 2—figure supplements 1 and 2. (B,C) Percentage of time freezing during aversive conditioning (B) and the memory testing (C) in wild-type (WT) mice. Data are mean±SEM. n = 16 mice in each group. * indicates p<0.05 by ANOVA with Tukey’s post hoc multiple comparison. No ret vs Ret, p=0.0295; No ret vs No ret + CO2, p=0.7774; No ret vs Ret + CO2, p<0.0001; Ret vs No ret + CO2, p=0.1763; Ret vs Ret + CO2, p=0.0055; No ret + CO2 vs Ret + CO2, p<0.0001. (D,E) Data as in panels B and C except in Asic1a−/− mice. Data are mean±SEM. n = 16 mice in each group. * indicates p<0.05 by ANOVA with Tukey’s post hoc multiple comparison. ‘ns’ indicates not statistically significant. No ret vs Ret, p=0.0055; No ret vs No ret + CO2, p=0.6228; No ret vs Ret + CO2, p=0.0006; Ret vs No ret + CO2, p=0.1242; Ret vs Ret + CO2, p=0.9049; No ret + CO2 vs Ret + CO2, p=0.0248.
Figure 2—figure supplement 1
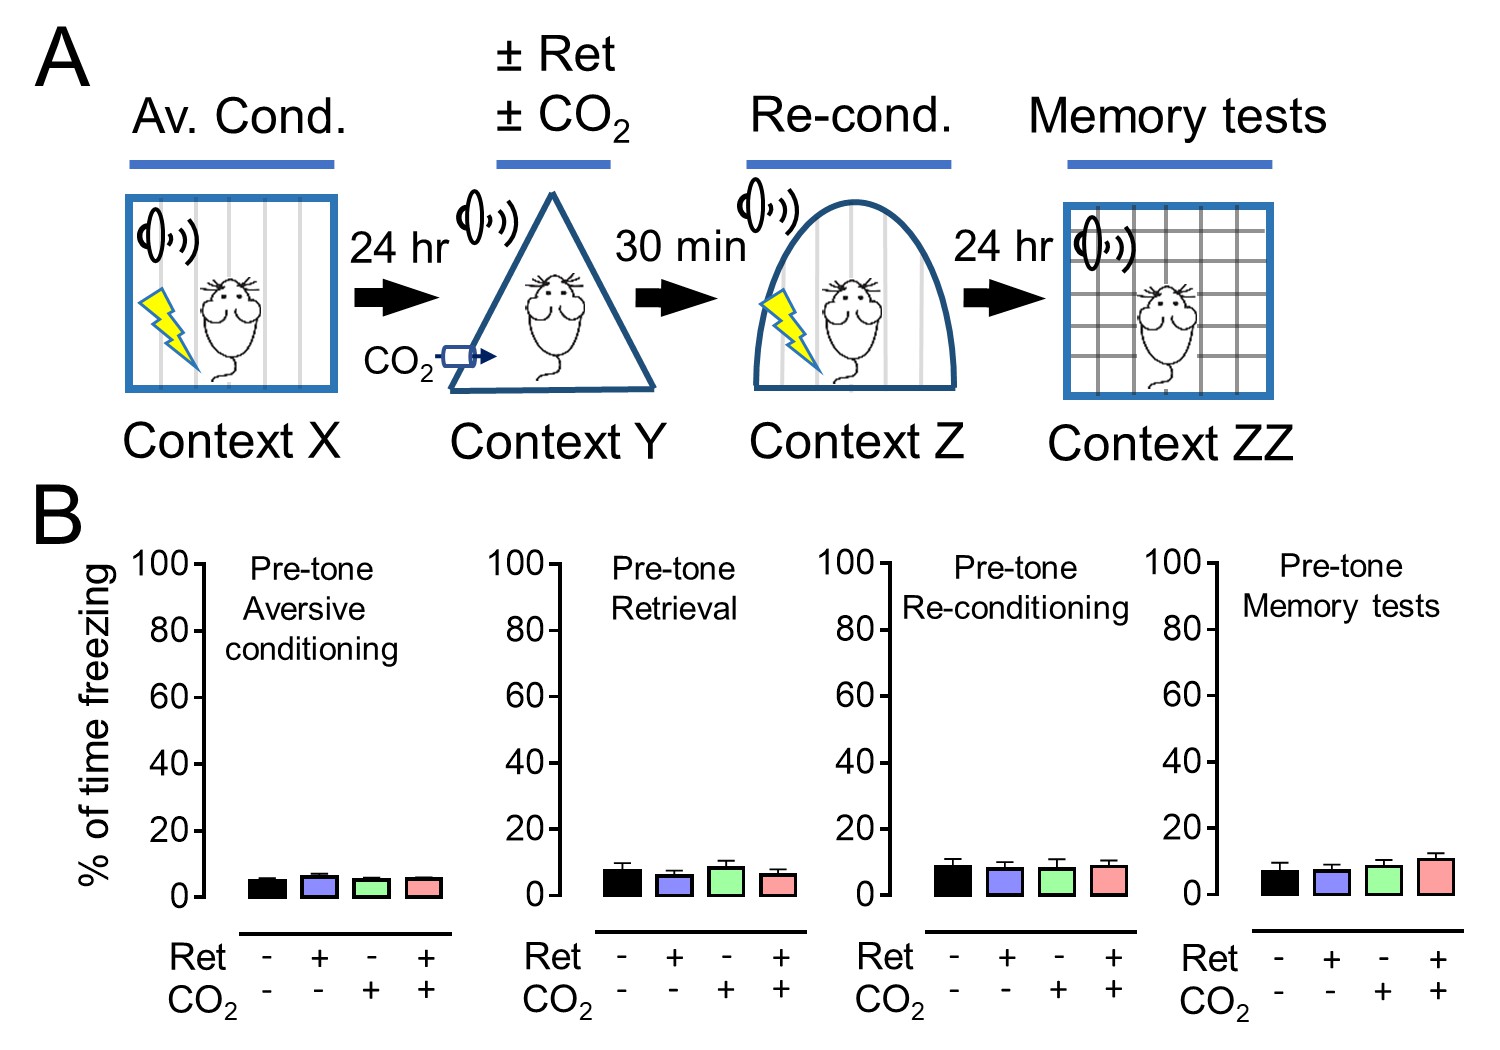
Distinct contexts were used to test the effect of retrieval on memory enhancement.
(A) Schematic of protocol for auditory aversive conditioning, memory modification, and testing. The protocol was identical to that shown in Figure 2A. (B) Data are the percentage of time mice were freezing in the four different contexts before aversive conditioning, before the retrieval tone, before reconditioning, and before the memory test. Data are mean ±SEM. n = 16 mice in each group. There were no statistically significant differences between groups by ANOVA with Tukey’s post hoc multiple comparison.
Figure 2—figure supplement 2
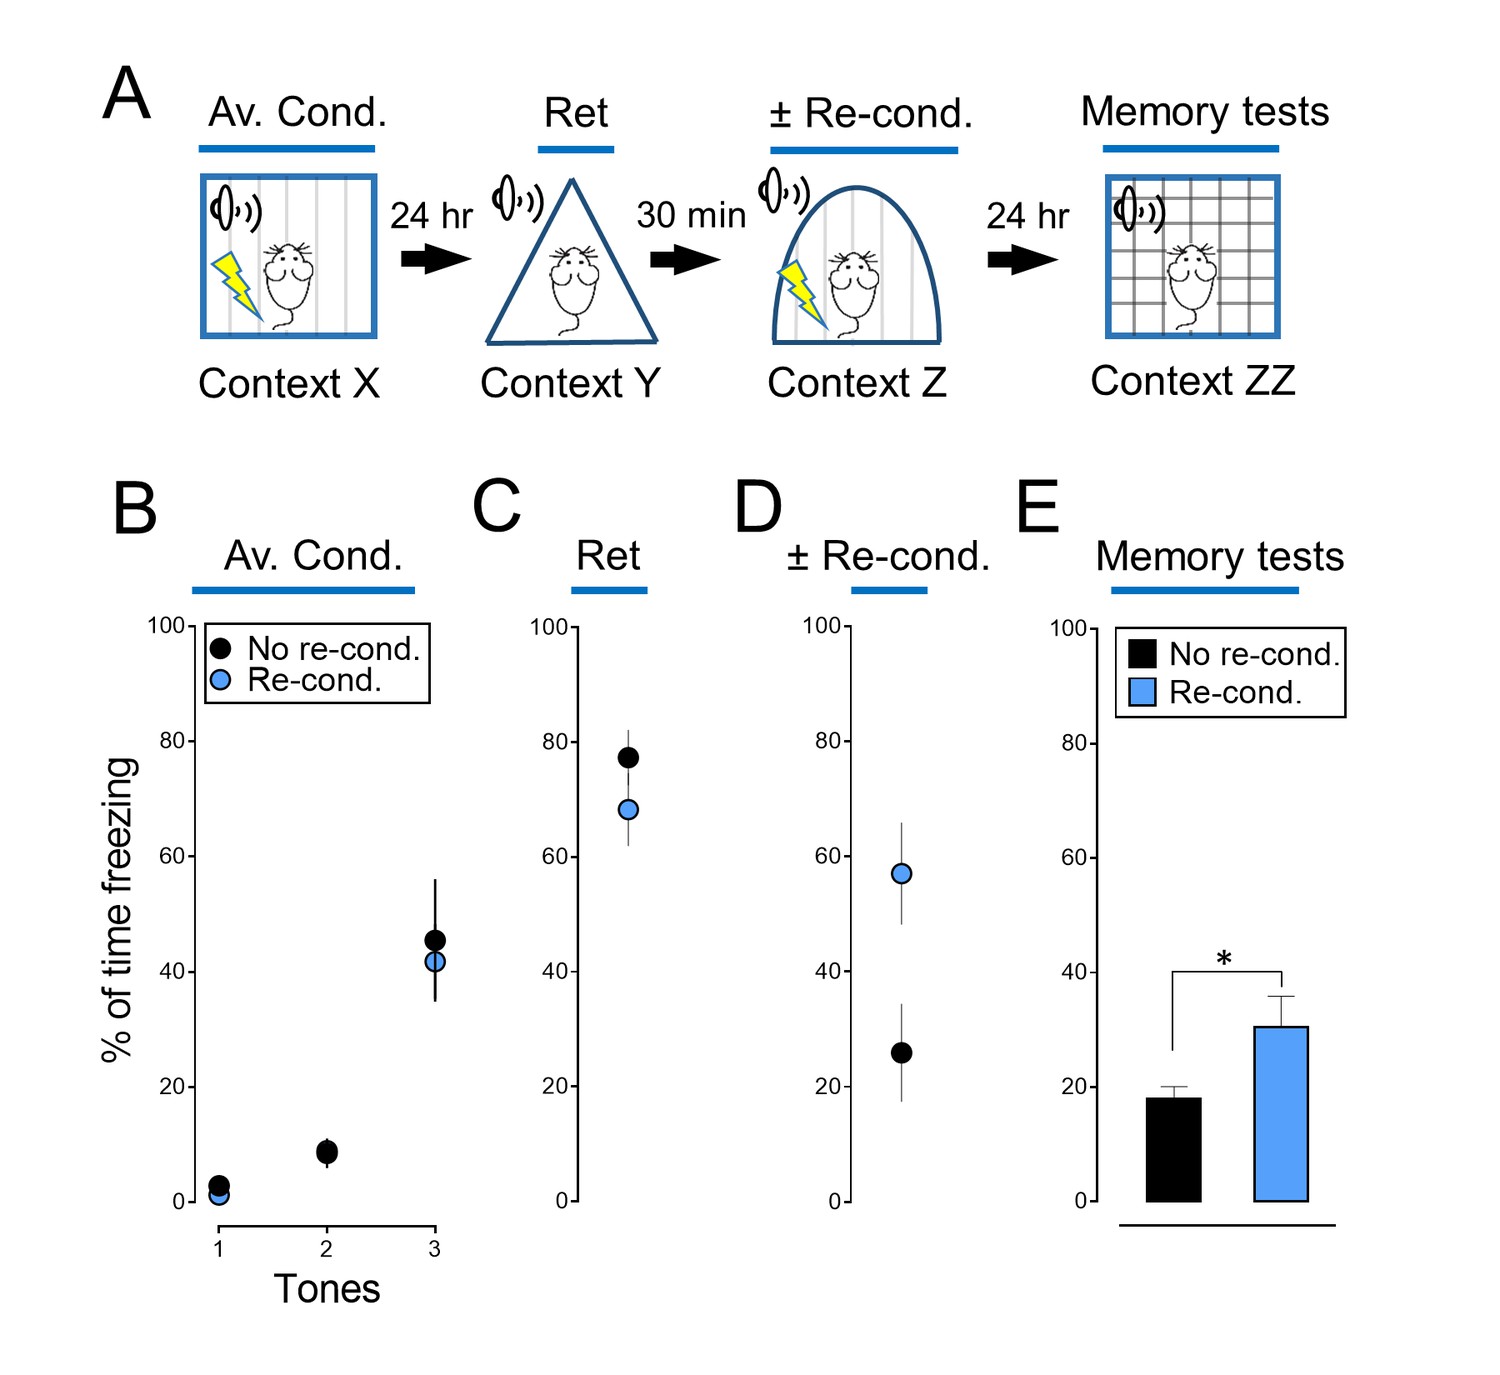
Reconditioning enhances an aversive memory.
(A) Schematic of protocol for auditory aversive conditioning, memory modification, and testing. The protocol was identical to that shown in Figure 2A. (B–E) Data are percentage of time mice were freezing in response to tones during the indicated components of the protocol. Data are mean ±SEM. n = 8 mice in each group. * indicates p<0.05 by unpaired Student’s t-test. No re-cond. vs Re-cond., p=0.0410.
Figure 3 with 2 supplements
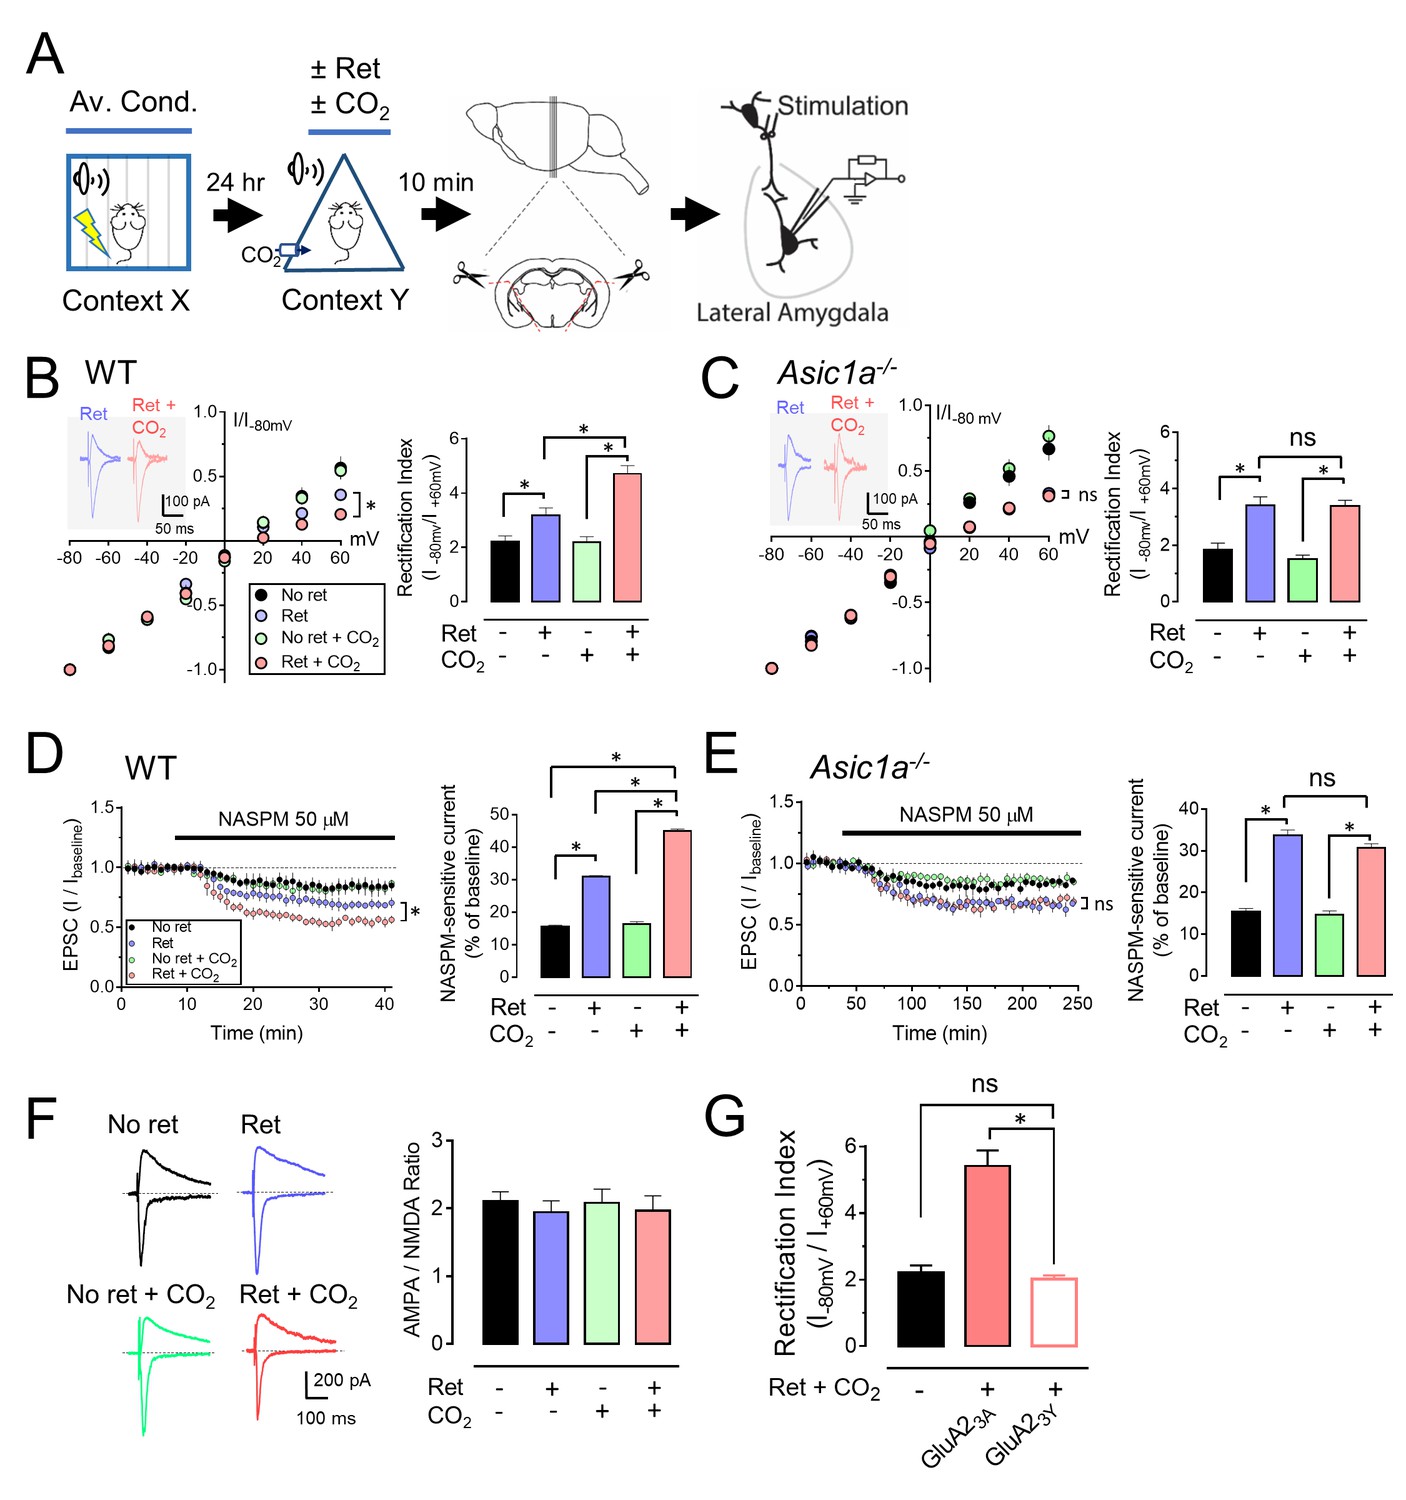
CO2 inhalation enhances retrieval-dependent AMPAR current rectification.
(A) Schematic of experimental procedure. Aversive conditioning and Ret/CO2 were as described for Figure 1A. Ten minutes later, brain slices were prepared, and patch-clamp recordings were made from lateral amygdala pyramidal neurons. Stimulation was of thalamic inputs. (B,C) Left, AMPAR current-voltage relationships in lateral amygdala pyramidal neurons. Insets show example of current from a mouse treated with retrieval and a mouse treated with retrieval plus CO2. Right, AMPAR rectification index (I-80 mV / I+60 mV). Data are from wild-type (B) and Asic1a−/− (C) mice. (D,E) Left, time-course showing effect of NASPM (blocks CP-AMPAR activity) application on EPSCs. D-APV (100 μM) was present throughout. Right, amplitude of NASPM-inhibited EPSCs as a percentage of current before NASPM addition. Data are from wild-type (D) and Asic1a−/− (E) mice. (B–E) Data are mean±SEM. n = 20–24 for each group. * indicates p<0.05 by ANOVA with Tukey’s post hoc multiple comparison. ‘ns’ indicates not statistically significant. In B, No ret vs Ret, p=0.0281; No ret vs No ret + CO2, p>0.9999; No ret vs Ret + CO2, p<0.0001; Ret vs No ret + CO2, p=0.0297; Ret vs Ret + CO2, p=0.0005; No ret + CO2 vs Ret + CO2, p<0.0001. In C, No ret vs Ret, p<0.0001; No ret vs No ret + CO2, p=0.7355; No ret vs Ret + CO2, p<0.0001; Ret vs No ret + CO2, p<0.0001; Ret vs Ret + CO2, p>0.9999; No ret + CO2 vs Ret + CO2, p<0.0001. In D, No ret vs Ret, p<0.0001; No ret vs No ret + CO2, p=0.8939; No ret vs Ret + CO2, p<0.0001; Ret vs No ret + CO2, p<0.0001; Ret vs Ret + CO2, p<0.0001; No ret + CO2 vs Ret + CO2, p<0.0001. In E, No ret vs Ret, p<0.0001; No ret vs No ret + CO2, p=0.9452; No ret vs Ret + CO2, p<0.0001; Ret vs No ret + CO2, p<0.0001; Ret vs Ret + CO2, p=0.1947; No ret + CO2 vs Ret + CO2, p<0.0001. (F) Left, examples of excitatory postsynaptic currents (EPSCs) recorded at −80 mV (AMPAR-EPSCs) and at +60 mV (NMDAR-EPSCs). Right, AMPAR/NMDAR EPSC ratios. Current amplitudes were measured 70 ms after onset. n = 12–16 for each group. (G) Rectification index of AMPAR-EPSCs. Aversive conditioning was done as in Figure 1A. Twenty-four hours later, mice received a microinjection of GluA23Y or GluA23A (control) into the amygdala. One hour later, mice were presented with a retrieval tone while inhaling 10% CO2. Ten minutes later, brain slices were prepared, and AMPAR-EPSCs were recorded from lateral amygdala pyramidal neurons. Data are mean±SEM of rectification index of AMPA-EPSCs. n = 24–40 for each group. * indicates p<0.05 by ANOVA with Tukey’s post hoc multiple comparison. ‘ns’ indicates not statistically significant. No ret vs GluA23A, p<0.0001; No ret vs GluA23Y, p=0.9197; GluA23A vs GluA23Y, p<0.0001.
Figure 3—figure supplement 1
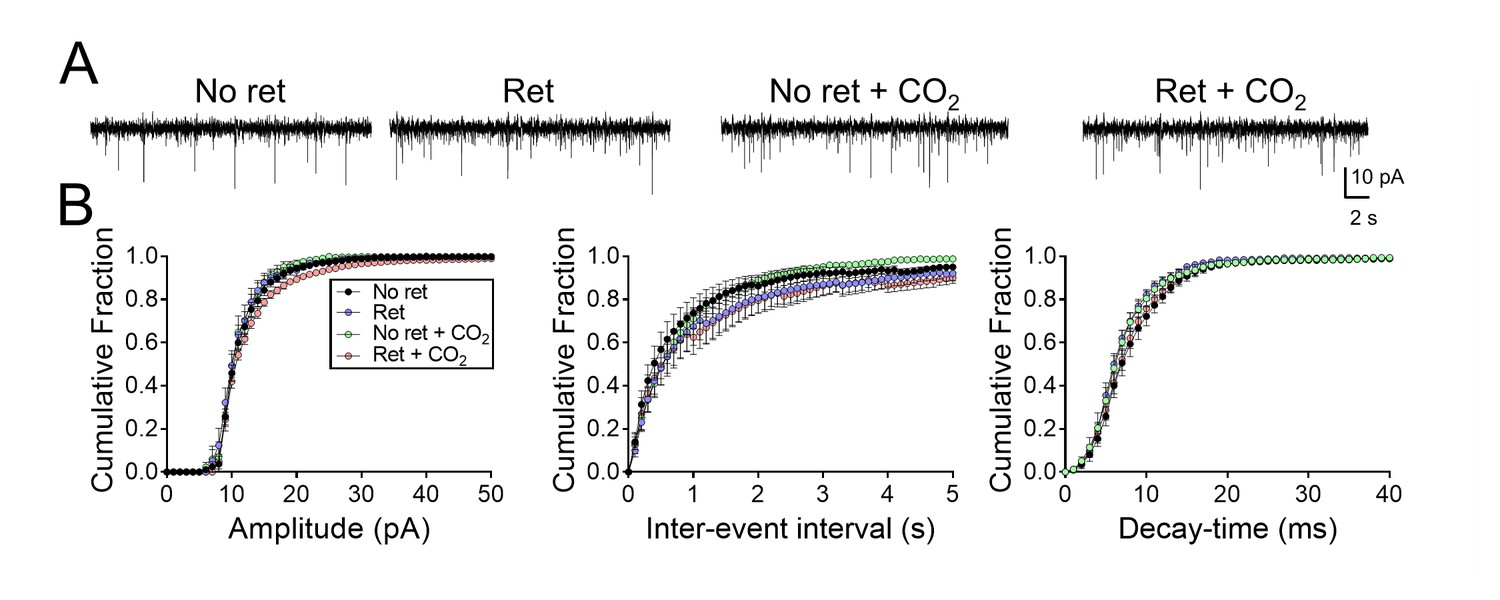
Inhaling CO2 does not alter synaptic strength in lateral amygdala neurons.
(A) Examples of miniature EPSCs. (B) Cumulative distributions of mEPSC amplitudes, inter-event intervals, and decay-times. n = 16–24 for each group. Data are mean±SEM. There were no statistically significant differences between groups by ANOVA with Tukey’s post hoc multiple comparison.
Figure 3—figure supplement 2
Prevention of shift from CI-AMPARs to CP-AMPARs weakens CO2 induced lability.
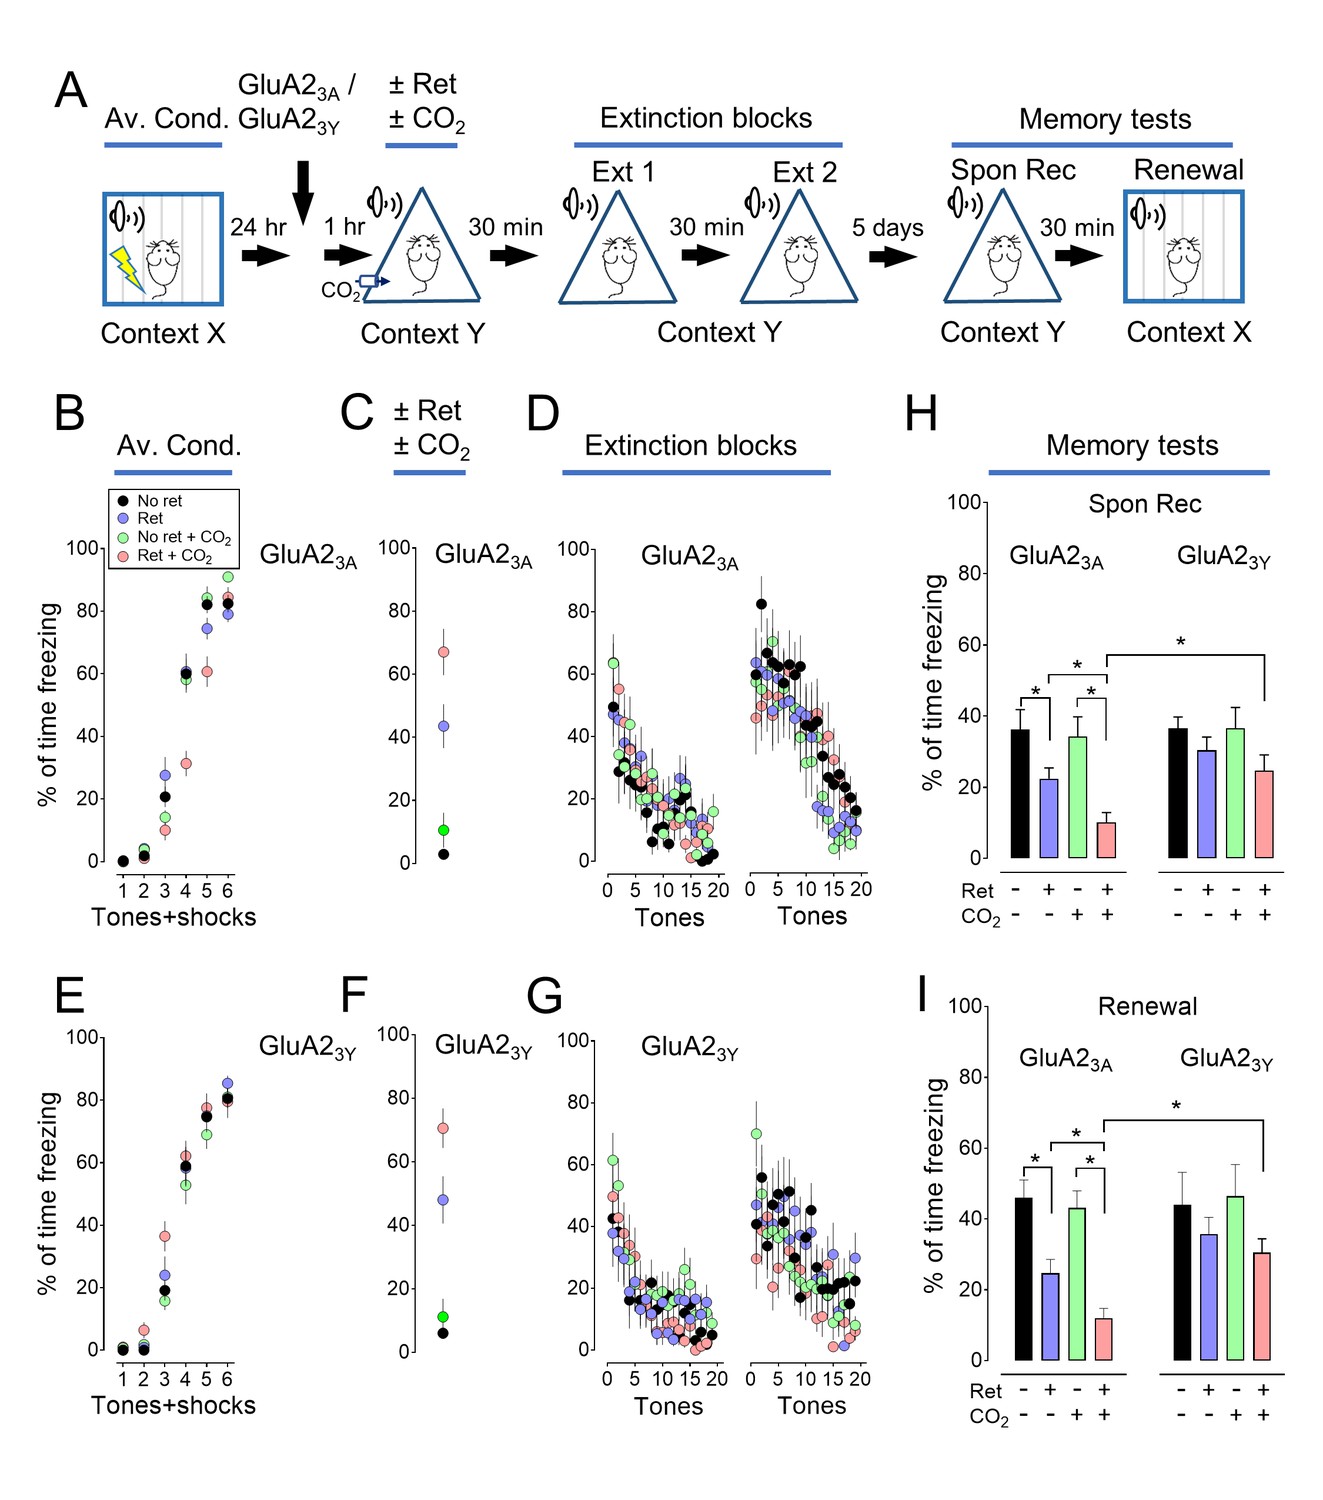
(A) Schematic of protocol for auditory aversive conditioning, memory modification, and testing. The behavioral protocol is the same as in Figure 1A. GluA23A or GluA23Y peptides were injected into the lateral amygdala bilaterally 1 hr before delivery of the retrieval tone. (B–G) Data are the percentage of time mice were freezing in response to tones during aversive conditioning (B and E), the Ret/CO2 intervention (C and F), and the extinction protocol (D and G). (H–I) On day 7, mice were tested for spontaneous recovery (H), and 30 min later they were tested for renewal (I). In each panel, the left sides are data from the GluA23A injected group, and right sides are data from the GluA23Y injected group. Data are mean±SEM. n = 16–21 mice in each group. * indicates p<0.05 by ANOVA with Tukey’s post hoc multiple comparison. The retrieval plus CO2 groups in the GluA23A and GluA23Y were also compared by an unpaired Student’s t-test in panels H and I.
Figure 4

Injecting acid into the amygdala before retrieval enhances exchange of AMPARs.
(A) Schematic of experimental procedure. Aversive conditioning was done as in Figure 1A. On day 2, mice received a microinjection of acidic saline (to reduce pH to ~6.8) or saline (pH ~7.35) into the amygdala. Five minutes later, they were presented with a single tone or not. Ten minutes after that, brain slices were prepared and AMPAR-EPSCs were recorded. (B) AMPAR current-voltage relationships in lateral amygdala pyramidal neurons. (C) Rectification index of AMPA-EPSCs. Data are mean±SEM. n = 18–24 for each group. * indicates p<0.05 by ANOVA with Tukey’s post hoc multiple comparison. No ret + saline vs Ret + saline, p=0.0431; No ret vs No ret + acidic saline, p=0.9781; No ret vs Ret + acidic saline, p<0.0001; No ret (WT) vs Ret + acidic saline (Asic1a−/−), p=0.9851; Ret + saline vs No ret + acidic saline, p=0.6081; Ret + saline vs Ret + acidic saline, p=0.0002; Ret + saline (WT) vs Ret + acidic saline (Asic1a−/−), p=0.5596; No ret + acidic saline vs Ret + acidic saline, p<0.0001; No ret + acidic saline (WT) vs Ret + acidic saline (Asic1a−/−), p>0.9999; Ret + acidic saline (WT) vs Ret + acidic saline (Asic1a−/−), p<0.0001.
Figure 5

Inhaling CO2 does not enhance AMPAR exchange at synapses between the cortex and lateral amygdala.
The procedure was the same as that shown in Figure 3A except that stimulation was of cortical inputs. (A,B) Left, AMPAR current-voltage relationships in lateral amygdala pyramidal neurons. Insets show example of current from a mouse treated with retrieval and mouse treated with retrieval plus CO2. Right, AMPAR rectification index (I-80 mV / I+60 mV). Data are from wild-type (A) and Asic1a−/− (B) mice. Data are mean±SEM. n = 14–19 for each group. There were no statistically significant differences between groups by ANOVA.
Figure 6
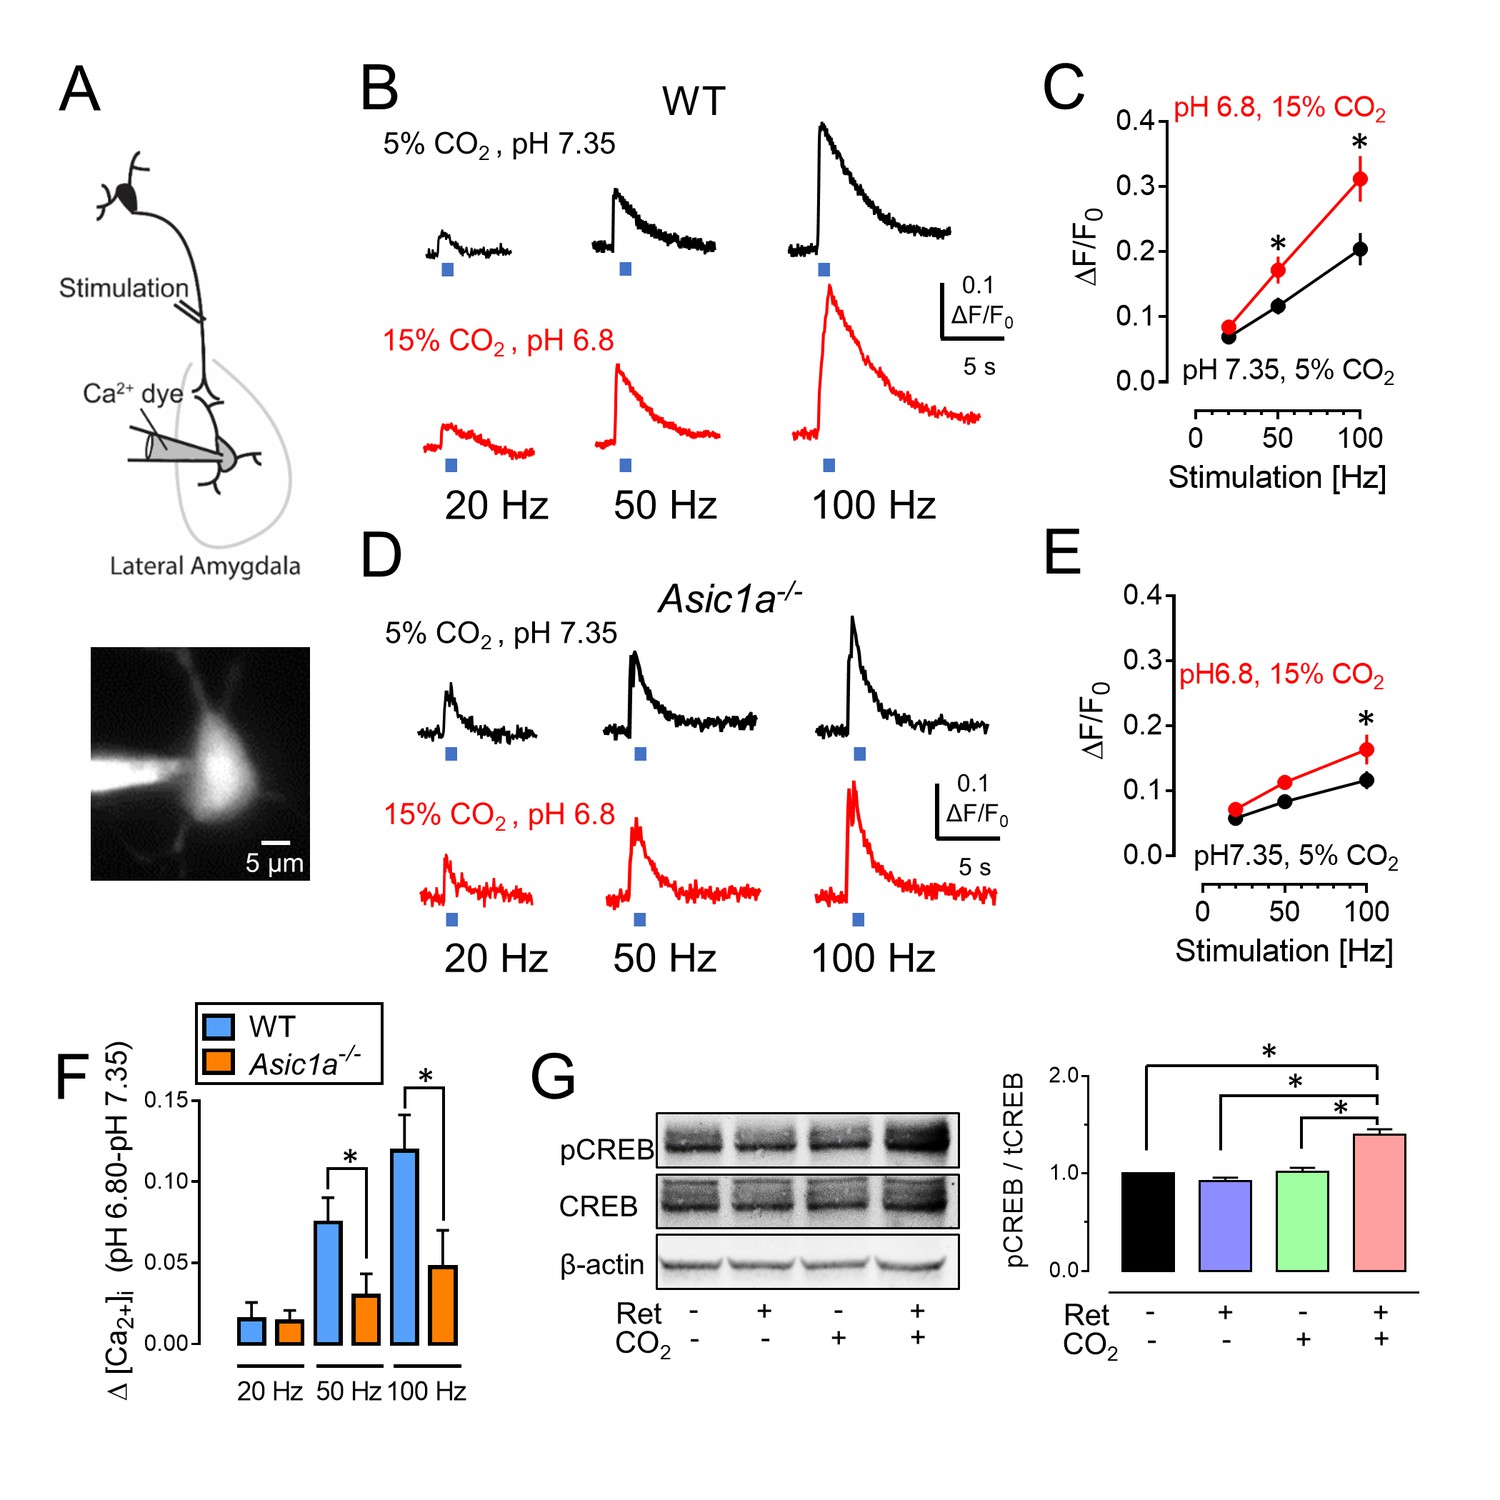
CO2-induced acidosis increases stimulation-dependent postsynaptic [Ca2+]i in amygdala slices and increases CREB phosphorylation after retrieval.
(A) Schematic for measuring changes in post-synaptic [Ca2+]i. Brain slices were prepared, and lateral amygdala pyramidal neurons were loaded with the fluorescent Ca2+ indicator Oregon Green 488 BAPTA-6F (100 μM) via a patch pipet. Changes in postsynaptic [Ca2+]i induced by presynaptic stimulation at 20, 50, and 100 Hz were assayed when the ACSF was saturated with either 5% CO2 (pH 7.35) or 15% CO2 (pH 6.8). (B) Examples of changes in [Ca2+]i signal with stimulation of wild-type neurons. (C) Mean±SEM of changes in [Ca2+]i signal. *p<0.05 by Student’s t-test. n = 14. p=0.0336 at 50 Hz; p=0.0189 at 100 Hz. (D,E) Data as in panels B and C except in Asic1a−/− mice. *p<0.05 by Student’s t-test. n = 24. p=0.0215 at 100 Hz. (F) Change in [Ca2+]i signal between pH 7.35 and 6.80 from panels C and E. (G) The procedure was the same as that shown in Figure 3A except that mice were euthanized 30 min after retrieval. Left, example of western blot with antibodies to CREB phosphorylated on Ser133, total CREB, and -actin. Right, mean±SEM of ratio of Ser133 phosphorylated CREB to total CREB. n = 6 sets of lateral amygdala tissue (each set contained lateral amygdala from the brains of 4 mice). * indicates p<0.05 by ANOVA with Tukey’s post hoc multiple comparison. No ret vs Ret, p=0.4683; No ret vs No ret + CO2, p=0.9819; No ret vs Ret + CO2, p<0.0001; Ret vs No ret + CO2, p=0.2845; Ret vs Ret + CO2, p<0.0001; No ret + CO2 vs Ret + CO2, p<0.0001.
Figure 7 with 1 supplement
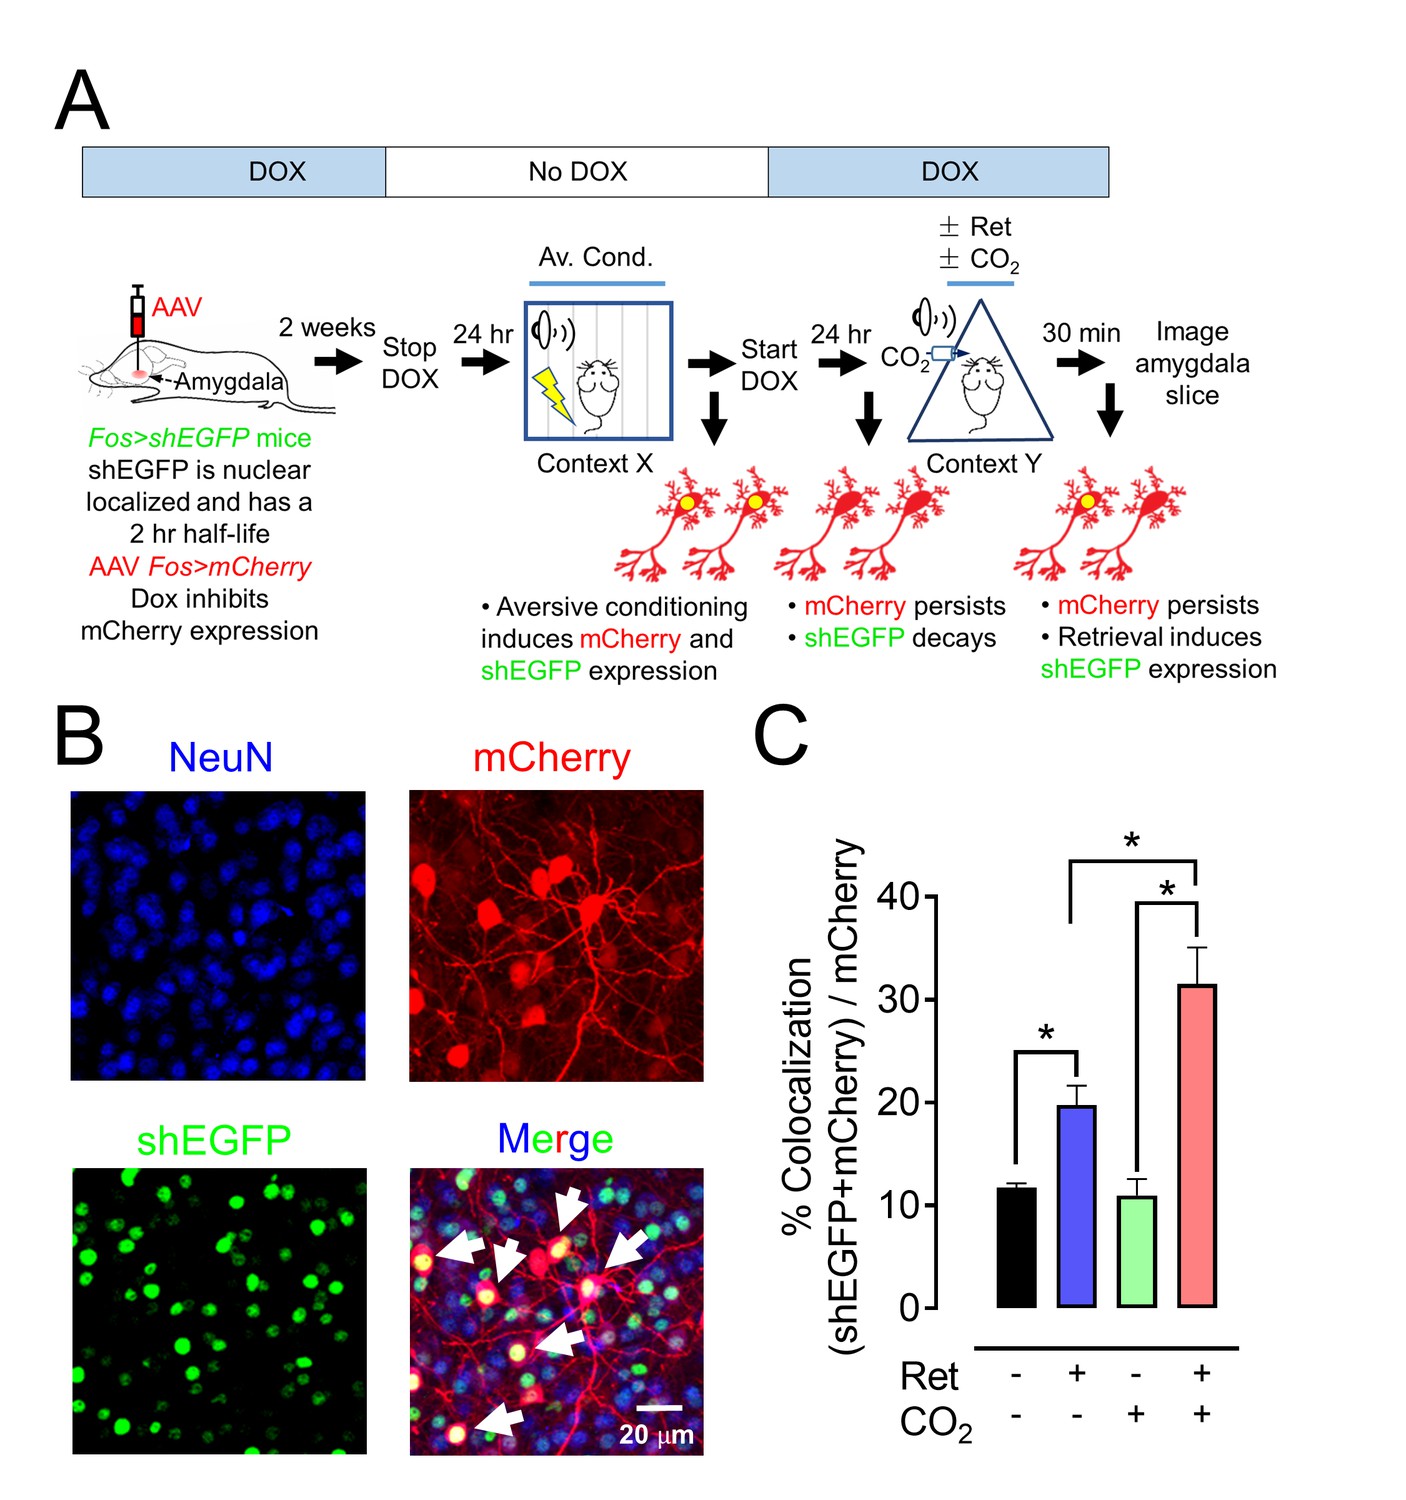
CO2 inhalation enhances retrieval-induced activation of lateral amygdala neurons bearing an aversive memory trace.
(A) Schematic showing procedure; see also Figure 7—figure supplement 1 for additional information about the doxycycline-inducible system. The activity-dependent promoter Fos was used to induce expression of nuclear localized shEGFP in transgenic mice, indicated as Fos>shEGFP. shEGFP rapidly decays with a half-life of 2 hr. Mice were fed doxycycline (DOX) for 1 week, and then an AAV9 vector encoding mCherry, indicated as Fos>mCherry (which is ultimately expressed when the Fos promoter is activated), was microinjected into the amygdala. DOX inhibits mCherry expression. Two weeks later, DOX was discontinued, and mice underwent the aversive conditioning protocol as described in Figure 1A. Under those conditions, the Fos promoter will drive both shEGFP and mCherry expression, but shEGFP will rapidly decay. After aversive conditioning, mice immediately resumed DOX treatment. One day later, the mice underwent the Ret/CO2 protocol shown in Figure 1A. Thirty minutes after that, brain slices were prepared and the shEGFP- and mCherry-positive neurons in the lateral amygdala were determined. (B) Example of lateral amygdala neurons labeled by mCherry (red), the nuclear localized shEGFP (green), and NeuN (blue). White arrows indicate examples of colocalization of mCherry and shEGFP. mCherry- and shEGFP-positive cells were also NeuN-positive. (C) Data are the percentage of mCherry-positive cells that were also shEGFP-positive. Data are mean ±SEM. n = 5 mice for each group. * indicates p<0.05 by ANOVA with Tukey’s post hoc multiple comparison. In C, No ret vs Ret, p=0.0154; No ret vs No ret + CO2, p=0.9915; No ret vs Ret + CO2, p<0.0001; Ret vs No ret + CO2, p=0.0197; Ret vs Ret + CO2, p=0.0013; No ret + CO2 vs Ret + CO2, p<0.0001.
Figure 7—figure supplement 1
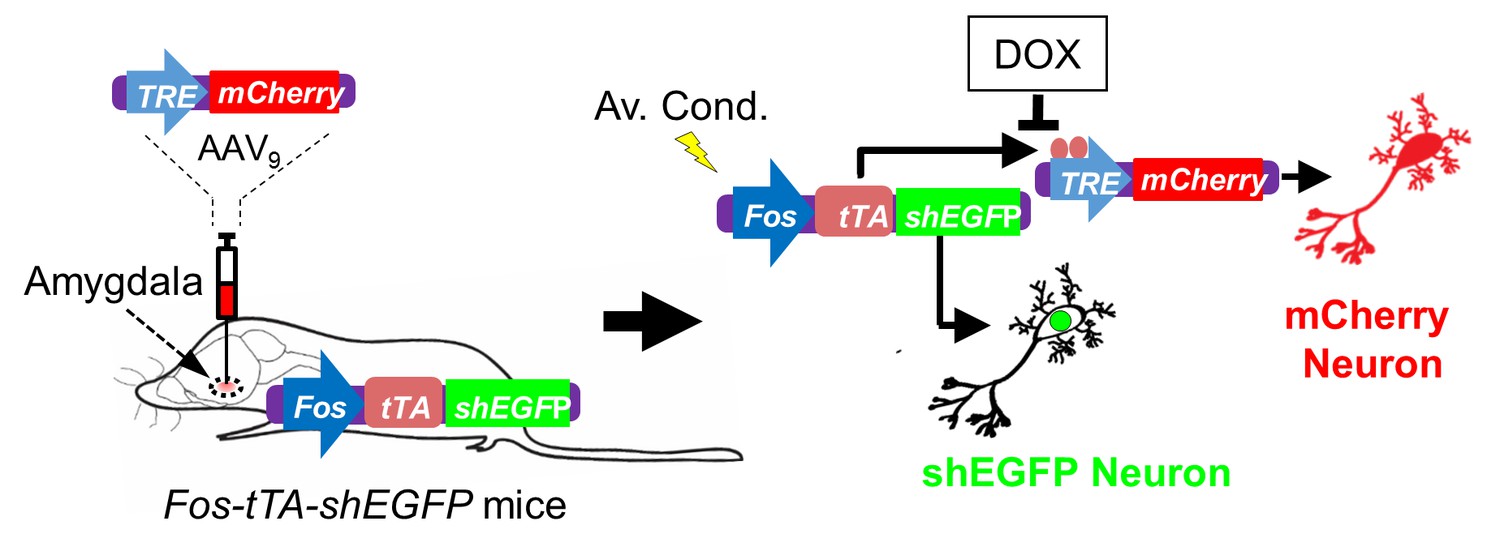
Schematic showing how neurons were labeled in mice transgenic for TetTag Fos-tTA and microinjected with the viral vector AAV9-TRE-mCherry.
Neuronal activity activates the Fos promoter. The Fos promoter drives expression of the tetracycline transactivator (tTA) and of shEGFP. The shEGFP protein is rapidly degraded with a 2 hr half-life. The tTA protein binds to its target, the tetracycline-responsive element (TRE) site on the microinjected AAV9-TRE-mCherry construct, resulting in the expression of mCherry in neurons. The presence of doxycycline (DOX) inhibits tTA from binding to the TRE and thus prevents the expression of mCherry.
Download links
A two-part list of links to download the article, or parts of the article, in various formats.
Downloads (link to download the article as PDF)
Open citations (links to open the citations from this article in various online reference manager services)
Cite this article (links to download the citations from this article in formats compatible with various reference manager tools)
Transient acidosis while retrieving a fear-related memory enhances its lability
eLife 6:e22564.
https://doi.org/10.7554/eLife.22564


