A role for cerebellum in the hereditary dystonia DYT1
- Albert Einstein College of Medicine, United States
Figures
Figure 1 with 2 supplements

Although knockdown of torsinA in the striatum and globus pallidus of adult mice does not cause dystonia, its knockdown in the cerebellum does.
(A) Schematic of the construct delivered to cells via AAV9 containing either non-targeted shRNA or shRNA against torsinA. Arrows are used to show promoters. (B) There was strong GFP expression in the basal ganglia (left image) of mice injected with the shRNA against torsinA. The right image is a sagittal section of a representative mouse injected with AAV-TorsinA shRNA-GFP. The dotted line delineates the separation between basal ganglia and cerebral cortex. CX = cerebral cortex, BG = basal ganglia, V = ventricle. Scale bar = 2.5 mm in left image, 500 µm in right image. (C) Example western blot (left) and quantification (right) from three animals in which AAV9 containing shRNA against torsinA was injected into the basal ganglia of adult mice. There is an average knockdown of 81.3% ± 6.2% (Mean ±S.E.M). (D) Observers blinded to the condition of the animals rated the basal ganglia injected animals on a previously published dystonia scale. On the graph each point represents an individual animal and the bars represent the average of all animals. All animals up to 13 weeks post-injection had an average score <1 (Mean ± S.E.M, NT shRNA, N = 8; Tor1A KD BG, N = 6; Tor1A KD BG2, N = 8). (E) There was strong GFP expression throughout the cerebellum (left image) of mice injected with the shRNA against torsinA. The right image is a sagittal section of a representative mouse injected with AAV-TorsinA shRNA-GFP. The dotted line delineates the cerebellum (CB). Scale bar = 2.5 mm in left image, 500 µm in right image. (F) Representative Western blot (left) and quantification (right) showing knockdown of torsinA from cerebellar lysates prepared from animals injected with a shRNA against torsinA when compared to WT animals or animals injected with a non-targeted (NT) shRNA. TorsinA KD 77.9% ± 4.7% (Mean ± S.E.M, Tor1A KD N = 6). (G) Adult mice with knockdown of torsinA in the cerebellum showed symptoms consistent with dystonia as rated by observers blinded to the condition of the animals. On the dystonia scale, a score of ≥2 is considered dystonic. Adult mice with knockdown of torsinA, using two shRNAs targeted to different regions of the protein, exhibited dystonic symptoms beginning around 7–9 weeks. (*=p<0.05, **=p<0.01, ***=p<0.001, ****=p<0.0001, Mean ± S.E.M, NT shRNA, N = 10; Tor1A KD CB, N = 20; Tor1A KD CB2, N = 15). By 13 weeks post-injection animals on average exhibited symptoms consistent with dystonia on this scale. (H) An example mouse 13 weeks after the injection of shRNA against torsinA into the cerebellum exhibiting an abnormal hind limb posture (arrow). (I) EMGs performed in three animals confirmed that abnormal postures are due to co-contraction of agonist and antagonist muscle pairs. In this example trace, the gastrocnemius (Ga, red) and anterior tibialis (AT, black) are shown during a dystonic co-contraction (arrow). Scale bar represents 5 s (x) by 100 μV (y). (J) The severity of motor symptoms, quantified by the dystonia scale 13 weeks after injection of torsinA in the cerebellum, is correlated with the level of shRNA mediated knockdown of torsinA. As the percent of torsinA knockdown increases, so does the severity of the motor phenotype (Torsin A KD CB (N = 22, purple) and torsin A KD CB2 (N = 15, pink). Black symbols show the average of the binned combined data from both shRNAs against torsinA (Spearman r = 0.63, 95% CI 0.3759 to 0.7960, p value < 0.0001). knockdown is presented as within-blot loading control-normalized values. The data are presented as mean ±S.E.M.
Figure 1—figure supplement 1
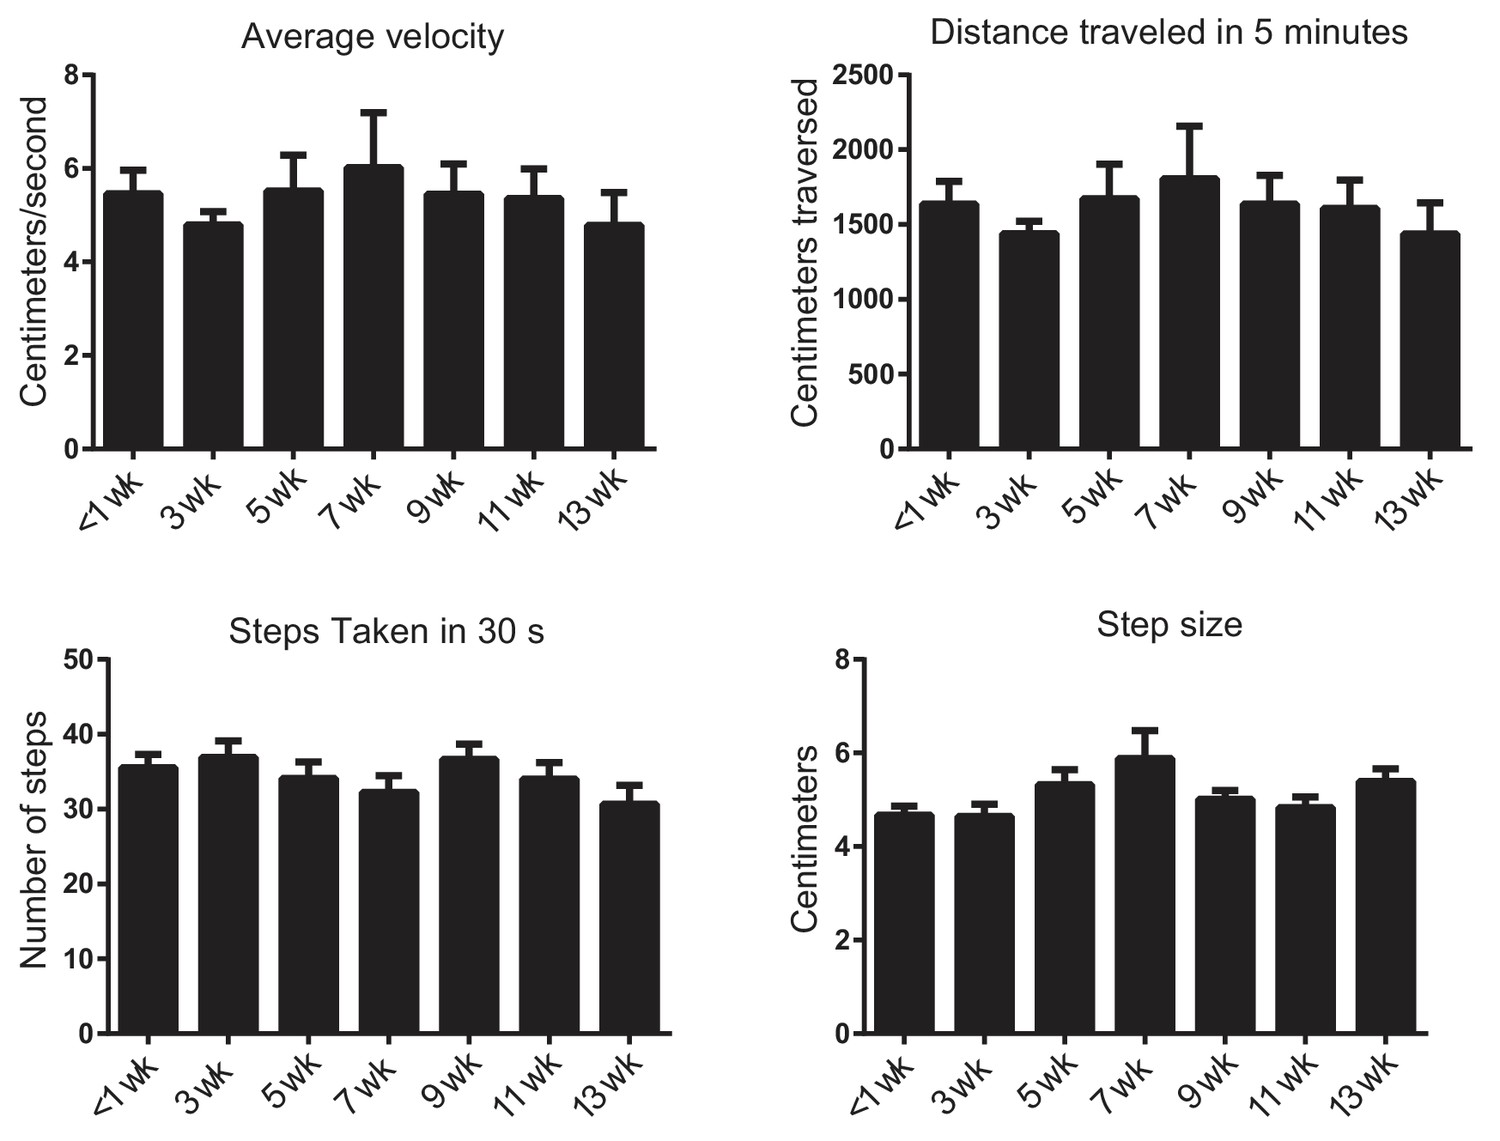
Knockdown of torsinA in the basal ganglia of adult mice does not change open field behavior.
To determine whether or not torsinA knockdown in the basal ganglia affected motor behavior in the open field, quantification of average velocity, average distance traveled in 5 min, number of steps taken in 30 s, and step size were quantified using ethovision (N = 5 first shRNA; 5 s shRNA) over a 13 week period post-injection. Because there was no significant difference between the effect of the two shRNAs, the data shown is a combined analysis (N = 10). There was no significant effect of shRNA knockdown on any of these parameters (p>0.05 compared using Kruskal-Wallis test).
Figure 1—figure supplement 2
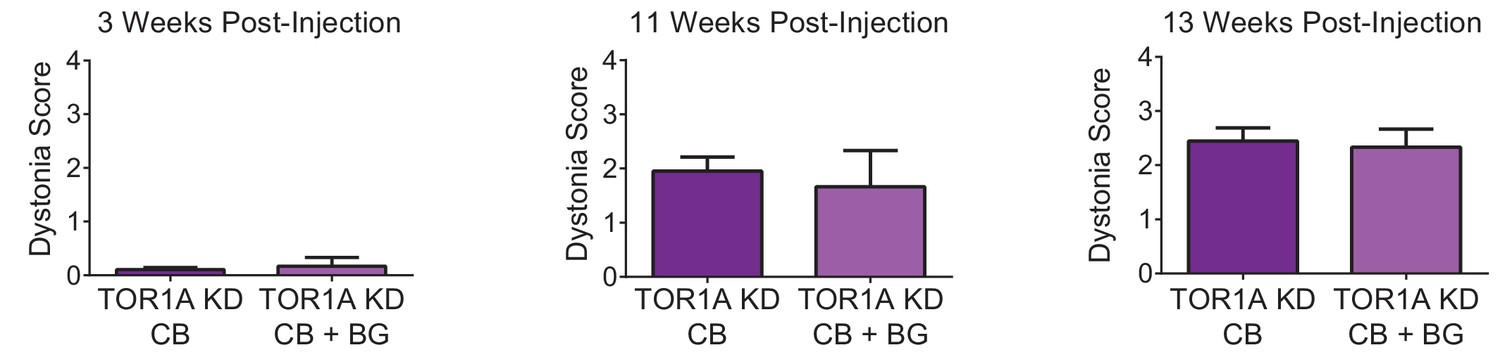
Symptoms in adult mice with simultaneous knockdown of torsinA in the basal ganglia and the cerebellum are not significantly different from symptoms seen in mice with knockdown in the cerebellum alone.
The figure shows a direct comparison of dystonia scores for animals with torsinA knockdown in the cerebellum alone (TorsinA CB, N = 20) compared with mice with knockdown in the cerebellum and basal ganglia (TorsinA CB+BG, N = 3) at three representative time points; three weeks (TorsinA CB average dystonia score: 0.11 ± 0.04, TorsinA CB+BG: 0.17 ± 0.17, p=0.82 Mann-Whitney test), 11 weeks (TorsinA CB: 1.95 ± 0.26, TorsinA CB+BG: 1.67 ± 0.67, p=0.80), and 13 weeks post-injection (TorsinA CB: 2.43 ± 0.24, TorsinA CB+BG: 2.32 ± 0.32, p=0.88). At no time point was there a significant difference in dystonia score between mice with torsinA knockdown in the cerebellum alone compared to those with knockdown in the cerebellum and basal ganglia.
Figure 2 with 1 supplement
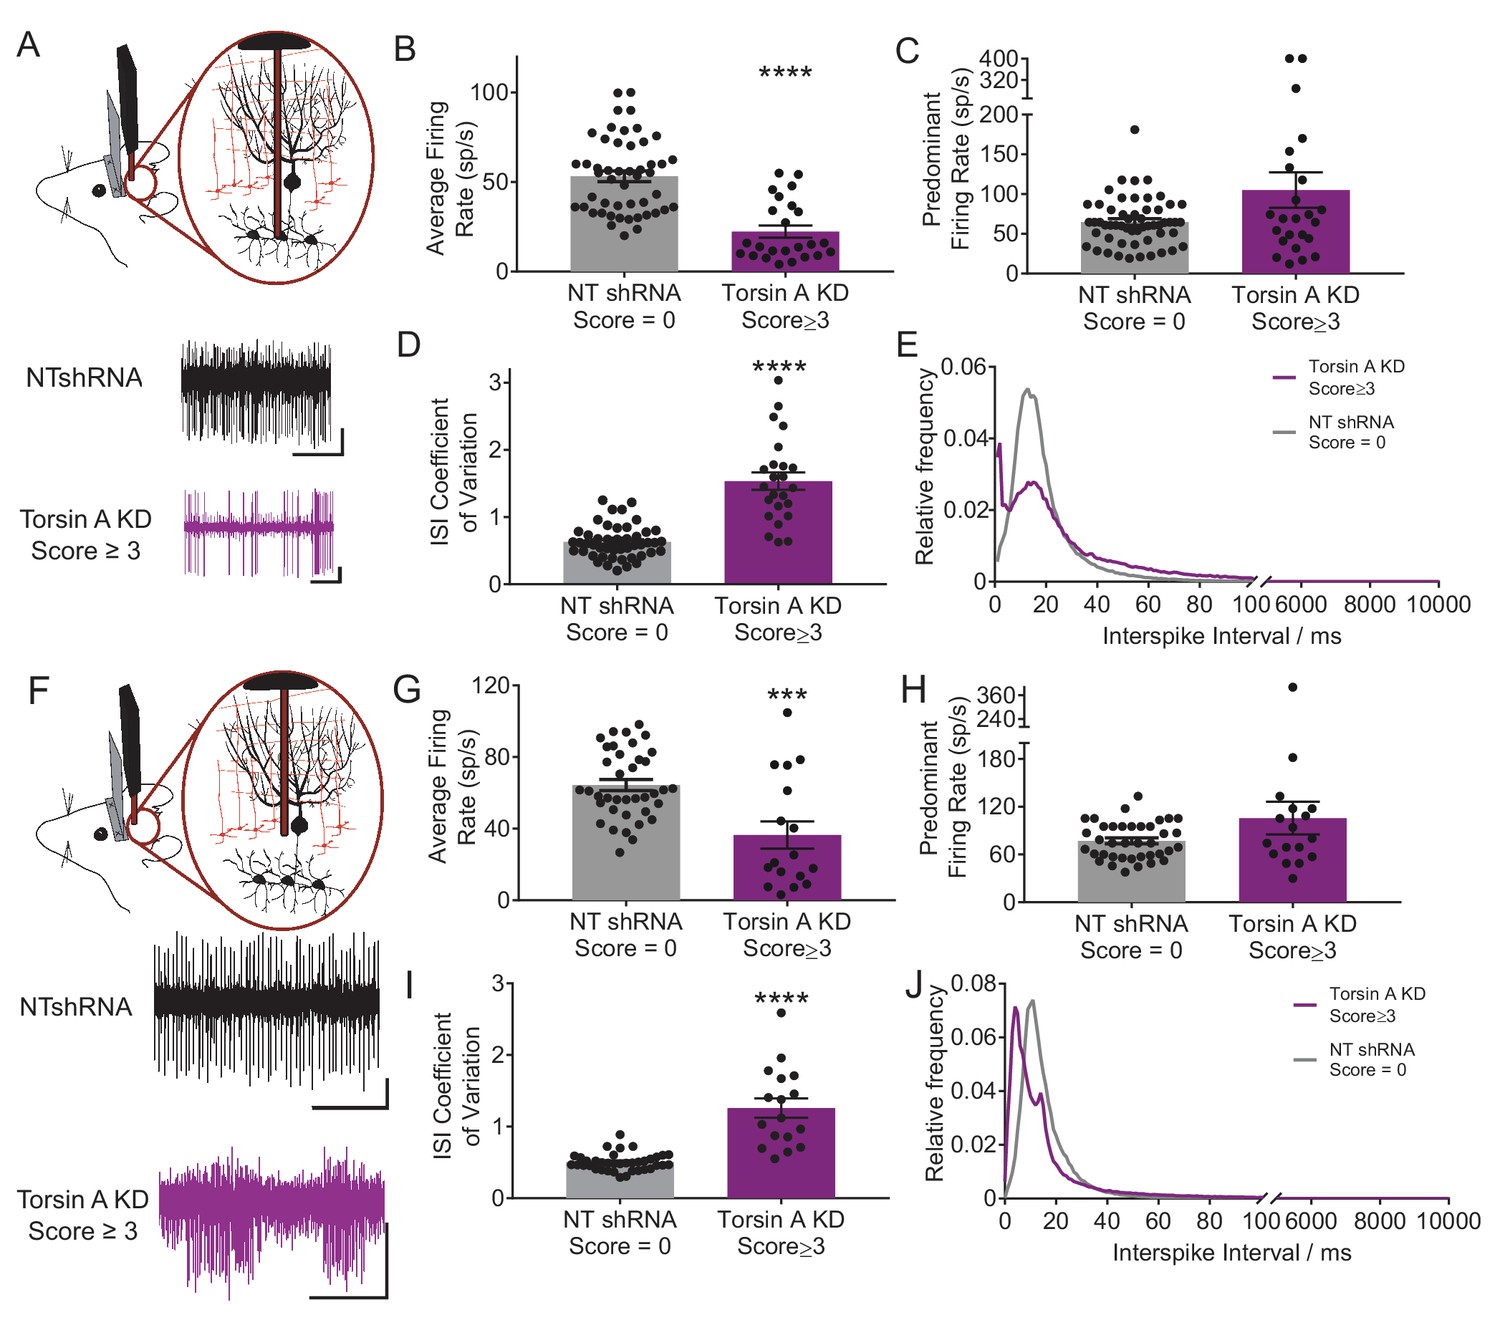
Purkinje cells and neurons of the deep cerebellar nuclei (DCN) fire abnormally in dystonic mice.
(A) Schematic showing recordings from DCN neurons in awake head restrained animals. To the right are example traces recorded from a non-dystonic mouse injected with non-targeted shRNA (NTshRNA, black) and from a dystonic mouse with cerebellar knockdown of torsinA (torsinA KD, purple). Scale bar = 500 ms (x) by 50 μV (y) for both traces. (B) Quantification of the average firing rate of DCN neurons revealed that DCN cells recorded from dystonic mice with knockdown of torsinA (purple) (N = 3, n = 25) exhibited a significantly decreased average firing rate compared to those from non-dystonic mice expressing NTshRNA (gray) (N = 5, n = 49) (control average firing rate: 53.21 ± 2.998 spikes/second (sp/s), average firing rate in dystonic mice: 22.4 ± 3.4 sp/s, p<0.0001). (D) DCN cells from dystonic mice (purple) also exhibited an increased coefficient of variation of the interspike intervals (CV ISI) compared to controls (gray) indicating that these cells fired more irregularly than controls (control CV ISI: 0.63 ± 0.034, dystonic CV ISI: 1.53 ± 0.13, p<0.0001). (C,E) There was no statistically significant difference between the predominant firing rate of control DCN cells and those from dystonic animals (C) (control: 64.86 ± 4.056 sp/s, dystonic animals: 105.1 ± 22.3 sp/s, p=0.3044), although the interspike interval (ISI) histograms of representative DCN neurons (n = 20 per condition) showed an additional peak at shorter ISIs in dystonic animals (purple, (E) compared to controls (black, (E). On all bar graphs, bars represent mean ± S.E.M with points representing individual values ****= p<0.0001. (F) Schematic showing that Purkinje cells (PCs) were recorded from awake head restrained mice. Beneath are example raw traces of a PC recorded from a control mouse with expression of NTshRNA in the cerebellum (black) and one recorded from a dystonic mouse with knockdown of torsinA in the cerebellum (purple). PCs recorded in dystonic animals exhibited abnormal burst firing. Both scale bars are 200 ms (x) by 200 μV (y). (G) Quantitatively, there was a significant difference between the average firing rate of control PCs (gray; N = 5, n = 38) and those from dystonic mice (purple; N = 3, n = 17) control: 64.31 ± 3.094 sp/s, dystonia: 36.45 ± 7.6 sp/s, ***p=0.0001. (I) In addition, PCs in dystonic mice (purple) exhibited an increase in the coefficient of variation of interspike intervals compared to controls (gray) suggesting that these cells fire more irregularly (control: 0.5 ± 0.019, dystonia: 1.26 ± 0.135, p<0.0001). (H,J) PCs in dystonic mice (purple) exhibited a trend towards an increased predominant firing rate PFR compared to controls (gray) (control: 77.7 ± 3.76 sp/s, dystonia: 105.6 ± 20.52 sp/s, p=0.24), and the ISI histograms of representative cells from each condition (n = 15 per condition) showed a peak ISI shifted to the left towards shorter ISIs in torsinA KD animals (purple, (J).On all graphs, bars represent mean ± S.E.M with points representing values from individual cells.
Figure 2—figure supplement 1
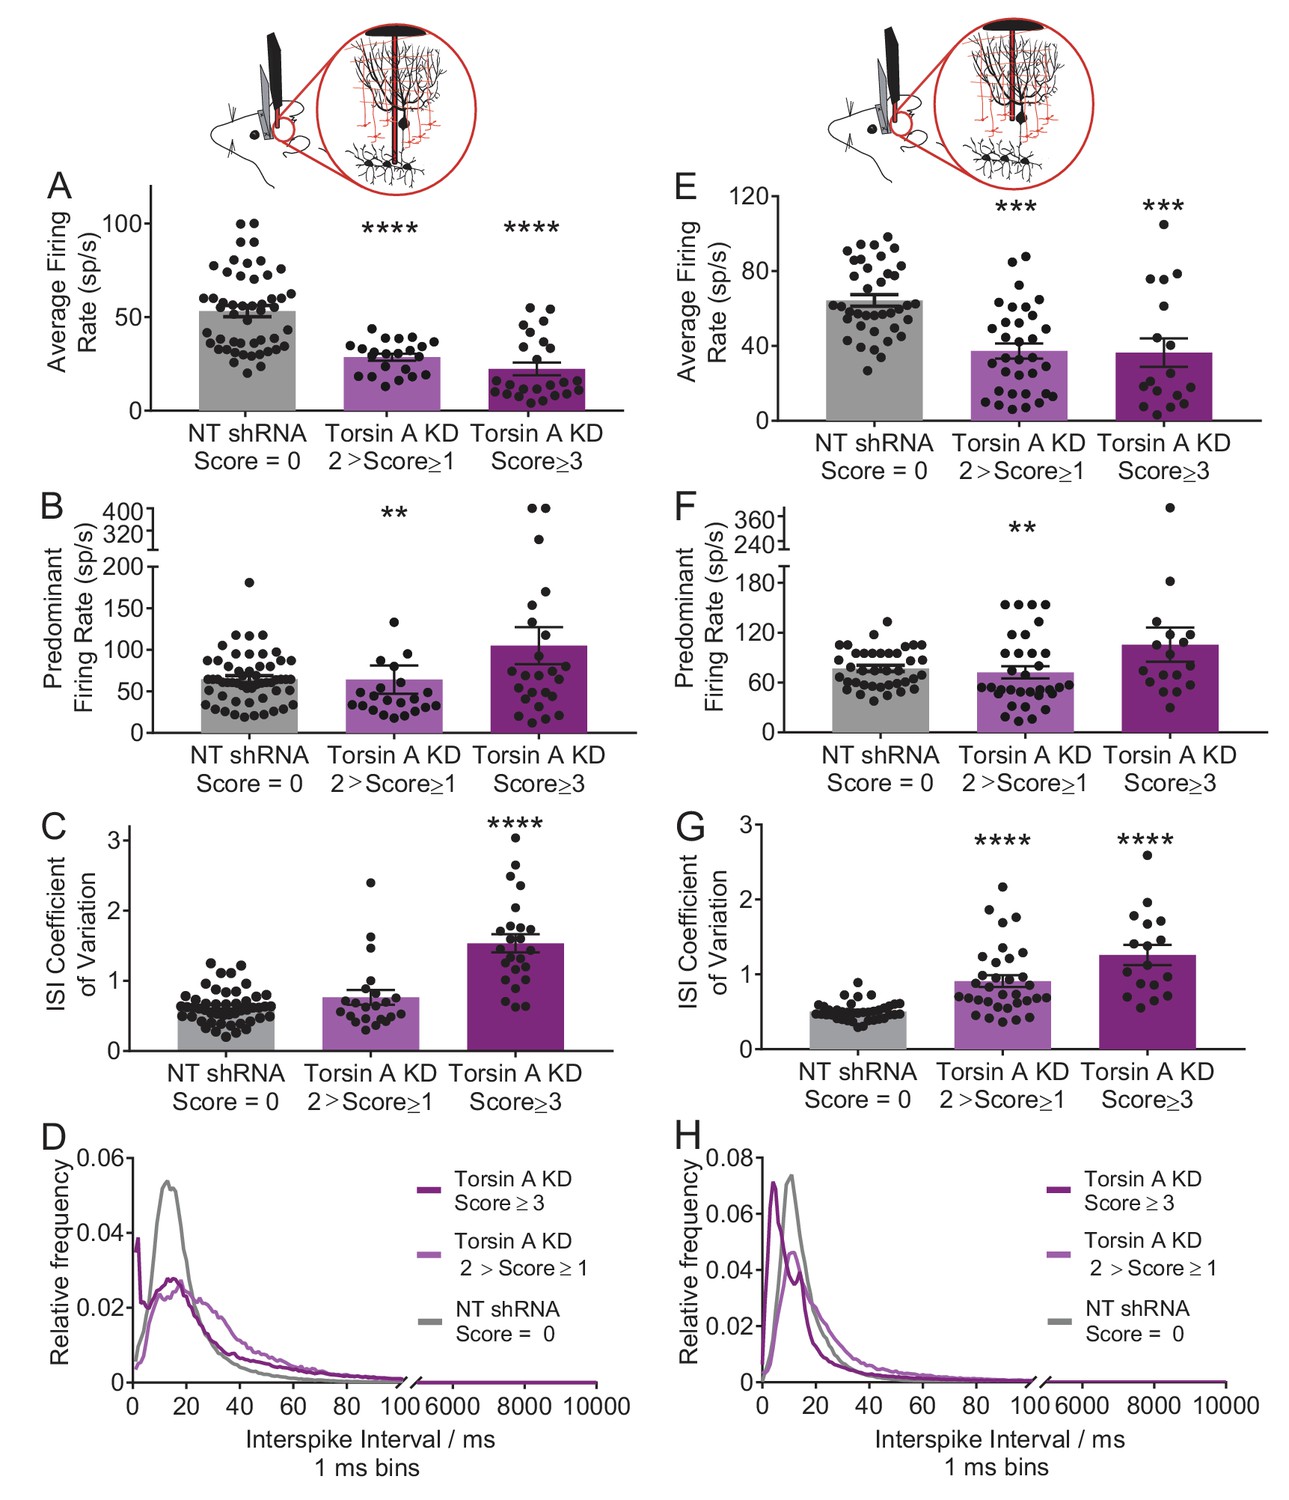
Neurons of the deep cerebellar nuclei (DCN) and Purkinje cells recorded in vivo from less severe mice injected with the shRNA against torsinA in the cerebellum exhibit abnormal activity.
We recorded from mice with a dystonia score ranging from one to < 2 (N = 4, light purple). While these mice showed abnormal motor symptoms, the symptoms did not include dystonia. (A) DCN neurons in these animals had a significant decrease in their average firing rate (N = 4, n = 22, control average firing rate: 53.21 ± 2.998 spikes/second (sp/s), average firing rate in less severe mice: 28.62 ± 1.86 sp/s, p<0.0001). (B) In addition, there was a decrease in their predominant firing rate compared to dystonic animals (control: 64.86 ± 4.056 sp/s, less severe animals: 64.2 ± 17.09 sp/s, **p=0.0064). (C) However, there was only a slight, not statistically significant, increase in the CV ISI of these animals when compared to the control animals injected with the non-targeting shRNA (control mice: 0.63 ± 0.034, less severe mice: 0.7655 ± 0.1, p=0.78). (D) The ISI histogram of the DCN neurons in these animals also shows that the majority of ISIs lie in the same range as the control animals, with some cells showing longer ISIs. (E) Purkinje cells in these animals showed a significant decreased average firing rate (control: 64.31 ± 3.094 sp/s, less severe mice: 37.33 ± 4.044 sp/s, ***p=0.0001). (F) There was also a decrease in the predominant firing rate compared to dystonic animals and controls (control: 77.7 ± 3.76 sp/s, less severe mice: 72.28 ± 7.39 sp/s, **p=0.0099). (G) There was also an increase in the CV ISI of these animals when compared to the control animals injected with the non-targeted shRNA (control: 0.5 ± 0.019, less severe mice: 0.91 ± 0.08, p<0.0001). (H) The ISI histogram of the DCN neurons in these animals shows that the majority of ISIs lie in the same range as the control animals, with some cells showing longer ISIs, which like the DCN neurons is shown in the decreased average firing rate.
Figure 3

Knockdown of torsinA alters the intrinsic activity of Purkinje cells and neurons in the deep cerebellar nuclei (DCN).
(A) Schematic of extracellular recordings which were performed from acute brain slices in which fast glutamatergic and GABAergic synaptic transmission was blocked. Beneath are raw traces of adjacent Purkinje cells recorded from dystonic mice with torsinA knockdown in the cerebellum. The Purkinje cell on the top is not infected and exhibits regular firing characteristic of this cell type (black). The one on the bottom had torsinA knockdown and exhibited erratic firing (purple). Scale bar is 200 ms (x) by 50 μV (y) and is applicable to both traces. (B) There is no significant change in the average firing rate of Purkinje cells with torsinA knockdown (TorsinA KD (GFP+ TorsinA KD, N = 5, n = 12) compared to GFP− Purkinje cells (GFP− TorsinA KD, n = 12) from the same animal and Purkinje cells from control animals WT, (N = 5, n = 21) and GFP positive (NT GFP+, N = 3, n = 15) and negative cells (NT GFP−, n = 10) from animals infected with AAV9-NTshRNA-GFP (average firing rate of WT: 53.9 ± 6.7, GFP+ TorsinA KD: 68.1 ± 13.1 sp/s, GFP+ NT: 49.8 ± 7.0 sp/s, p=0.45). (C) Purkinje cells with torsinA knockdown have a higher predominant firing rate than controls (PFR of WT: 53.7 ± 6.6, GFP+ TorsinA KD: 93.2 ± 20.7 sp/s, GFP+ NT: 49.5 ± 6.9 sp/s, p=0.048). (D) Purkinje cells with torsinA knockdown have an increased CV ISI compared to controls reflecting the irregularity of the firing of these neurons (CV ISI of WT: 0.110 ± 0.010, GFP+ TorsinA KD: 1.151 ± 0.248, GFP+ NT: 0.096 ± 0.008, p=0.0003). On all graphs, bars represent mean ± S.E.M with points representing individual values. *=p<0.05, ****= p<0.0001. (E) ISI histogram of all cells in each condition shows that cells with knockdown of torsinA (purple) have shorter ISIs compared to cells from all other conditions. (F) Schematic showing extracellular recordings of DCN neurons in slices where fast glutamatergic and GABAergic synaptic transmission was blocked. Below are representative traces of DCN neurons recorded in slices taken from dystonic mice with knockdown of torsinA. The top trace is a neuron recorded from an area of DCN with no GFP expression which exhibits regular pacemaking characteristic of these cells. The bottom trace is from a neuron located in an area of DCN with high GFP expression and torsinA knockdown which exhibits irregular activity. Scale bar = 500 ms (x) by 200 μV and is applicable to both traces. (G) The average firing rate of DCN cells with torsinA knockdown (torsinA KD N = 3; GFP+ cells n = 7 and GFP− cells n = 6) was significantly reduced compared to DCN cells recorded in control animals (wild type = WT (N = 3, n = 8), control animals injected with AAV-NTshRNA-GFP (N = 3): neurons from GFP+ DCN (NT GFP+ DCN, n = 8) and neurons from GFP− DCN (NT GFP− DCN, n = 9) (average firing rate of GFP+ neurons from dystonic animals: 7.9 ± 2.3 sp/s, GFP+ neurons from control animals: 21 ± 2.1 sp/s **=p<0.01. (H) There was no significant difference between the predominant firing rates (PFR) of DCN neurons with torsinA knockdown compared to controls (GFP+ TorsinA: 41.9 ± 14.2 sp/s, GFP+ NT DCN: 21.4 ± 2.2 sp/s, p=0.15). (I) DCN neurons with torsinA knockdown exhibited an increased coefficient of variation of interspike intervals compared to controls, reflecting the irregularity of firing of these neurons (GFP+ neurons from dystonic animals: 1.21 ± 0.312, GFP+ neurons from control animals: 0.1 ± 0.011, **p=0.0021). (J) ISI histogram of all cells for each condition shows that cells with knockdown of torsinA (purple) have larger ISIs compared to cells from all other conditions. On all graphs, bars represent mean ± S.E.M with points representing individual values.
Figure 4
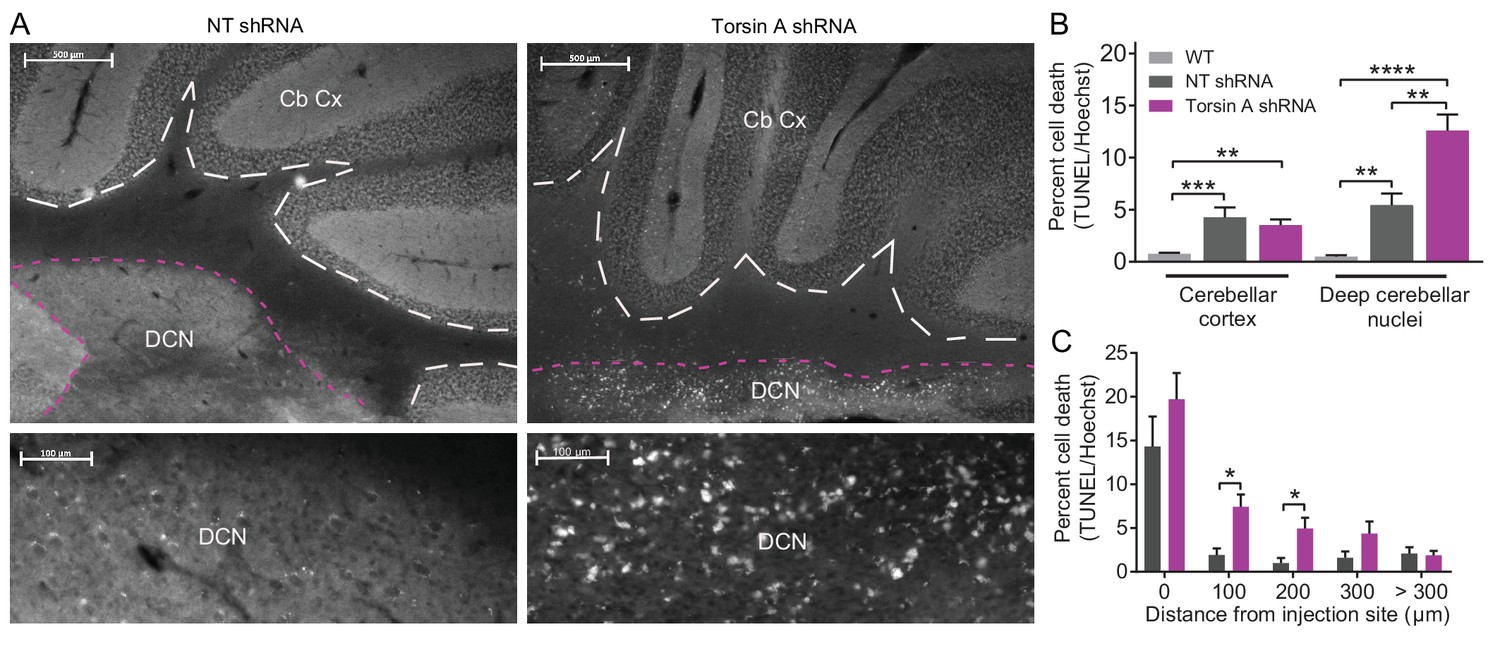
Apoptotic cells in the deep cerebellar nuclei (DCN) were observed in mice with torsinA knockdown in the cerebellum.
At 15 weeks post-injection, dystonic mice injected with AAV-TorsinAshRNA-GFP (N = 6), age-matched mice injected with AAV-NTshRNA-GFP (N = 6) and wild-type mice (N = 4) were perfused, cryosectioned and stained using a TUNEL assay protocol. (A) Sections were stained for TUNEL and Hoechst. Representative images compare the density of TUNEL positive cells in cerebellar cortex (Cb Cx) and the deep cerebellar nuclei (DCN). Dashed lines outline the Cb Cx and dotted lines outline the DCN. Note the increase in TUNEL positive cells (white) in the DCN of AAV-TorsinA shRNA-GFP injected animals. Bottom panels are magnified images of the DCN. (B) Quantification of percent cell death in the DCN and Cb Cx. There is a significant increase in apoptotic cells in the Cb Cx and DCN of AAV-TorsinA shRNA-GFP injected mice and non-targeted (NT) injected mice. While there was no difference in the cerebellar cortex between the percentage of apoptotic cells in AAV-NTshRNA-GFP mice compared to AAV-TorsinAshRNA-GFP mice, there was a significant increase in apoptotic cells in the DCN of AAV-TorsinAshRNA-GFP compared to AAV-NTshRNA-GFP mice. Quantification of percent cell death in relation to distance from the injection site shows that most of the apoptotic cells from the AAV-NTshRNA-GFP mice were located at the injection site. Mice injected with AAV-TorsinAshRNA-GFP displayed a significant increase in cell death up to 200 μm from the injection site when compared to the AAV-NTshRNA-GFP mice. (*p<0.05, **p<0.01, ***p<0.001, ****p<0.0001 Mean ± SEM) (Scale bar = 500 μm in images in the top panel; scale bar = 100 μm in magnified images of the DCN, bottom panels).
Figure 5 with 1 supplement
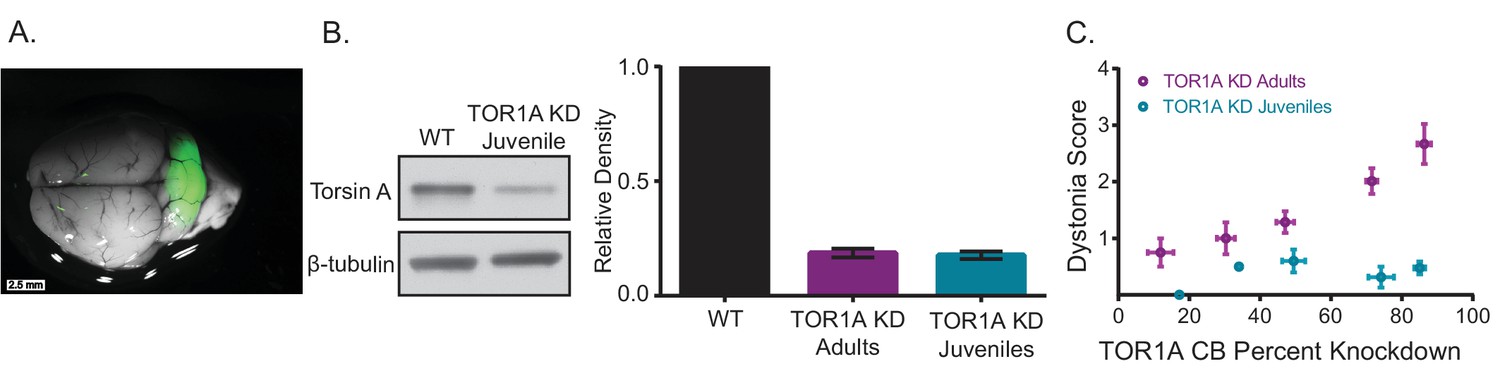
Knockdown of torsinA in the cerebellum of mice injected at early postnatal life produces mild motor symptoms not consistent with dystonia.
(A) Injection of AAV-TorsinAshRNA-GFP in the cerebellum of mice at postnatal day 7 (P7) results in expression of the construct throughout the cerebellum. (B) Injection of AAV-TorsinAshRNA-GFP in the cerebellum produces similar knockdown in mice injected at P7 (torsin A KD Juveniles) and in mice injected at 6–8 weeks of age (torsinA KD Adults) (Adult KD: N = 17, Juveniles KD: N = 8, Mann-Whitney test, p=0.5294, ns) 13 weeks after injection. The left image displays a representative western blot of cerebellar lysates from a non-injected mouse and a mouse injected at P7. The y-axis in the right graph represents within-blot loading control normalized values. The shRNA against torsinA decreases expression of torsinA in vivo by approximately 80% in both adults and juveniles compared to wild-type mice. (C) shRNA mediated torsinA knockdown in the cerebellum produces dystonia in a dose-dependent manner when mice are injected in adulthood, in contrast to mice injected at early postnatal life that do not develop a severe phenotype independent of the knockdown level. The severity of motor symptoms quantified by the dystonia scale 13 weeks after injection is correlated with the level of shRNA mediated knockdown of torsinA in mice injected at 6–8 weeks of age, such that as the percent of torsinA knockdown increases, so does the severity of the motor phenotype (Spearman r = 0.63, 95% CI 0.3759 to 0.7960, p value < 0.0001). In contrast, mice injected at early postnatal life do not develop dystonia by 13 weeks after injection, independent of the level of torsinA knockdown (Spearman r = 0.1228, 95% CI −0.3803 to 0.5698, p value = 0.6387, ns). The x-axis represents within-blot loading control normalized values. The y-axis represents the average of the dystonia score 13 weeks after injection from four colleagues blinded to the animal’s condition. Mice were grouped in bins of 20% knockdown. Each point represents the average of the dystonia score and percent knockdown of the mice within the bin and the lines show SEM.
Figure 5—figure supplement 1
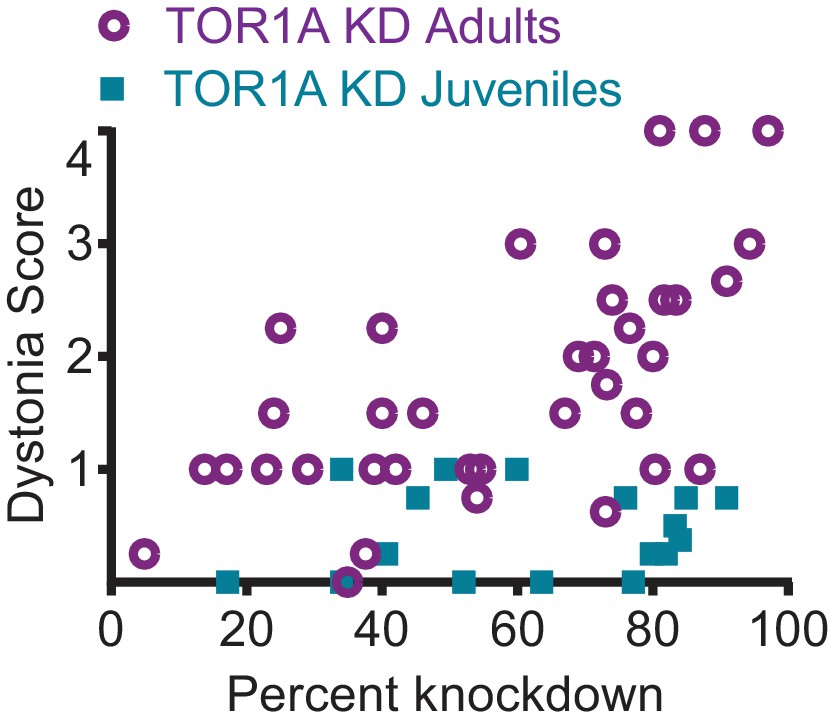
TorsinA dose response curve.
shRNA mediated torsinA knockdown in the cerebellum produces dystonia in a dose-dependent manner when mice are injected in adulthood, in contrast with mice injected at early postnatal life that do not develop a severe phenotype independent of the knockdown level. The severity of motor symptoms quantified by the dystonia scale 13 weeks after injection is correlated with the level of shRNA mediated knockdown of torsinA in mice injected at 6-8 weeks of age, such that as the percent of torsinA knockdown increases, so does the severity of the motor phenotype (Spearman r=0.63, 95% CI 0.3759 to 0.7960, p value < 0.0001, N=37). In contrast, mice injected at early postnatal life do not develop dystonia by 13 weeks after injection, independent of the level of torsinA knockdown (Spearman r=0.1228, 95% CI -0.3803 to 0.5698, p value = 0.6387, ns, N=17). The x-axis represents within-blot loading control normalized values. The y-axis represents the average of the dystonia score 13 weeks after injection from four colleagues blinded to the animal’s condition.
Videos
Video 1
shRNA-mediated knockdown of torsinA in the basal ganglia of adult mice does not produce dystonic postures.
A representative video showing a mouse 13 weeks after injection, injected with a shRNA against torsinA in the cerebellum at 6 weeks of age. In the open-field no motor abnormalities were observed.
Video 2
shRNA-mediated knockdown of torsinA in the cerebellum of adult mice produces dystonic postures by 13 weeks after injection.
A representative video showing the progression of symptoms in a mouse injected with a shRNA against torsinA in the cerebellum at 6 weeks of age. The video starts with the mouse walking in an open-field chamber at three weeks after injection displaying no obvious motor abnormalities. At the 24 s time-point in the video, the same mouse is shown at seven weeks after injection with an unsteady gait and jerky movements. At 1 min 10 s, the same mouse is seen at 13 weeks after injection with exacerbated symptoms including difficulty maintaining balance, frequent repetitive movements and dystonic postures.
Video 3
shRNA-mediated knockdown of torsinA in the cerebellum of juvenile mice does not produce dystonic postures by 13 weeks after injection.
A representative video showing a mouse 13 weeks after injection, injected with a shRNA against torsinA in the cerebellum at 1 week of age. In the open-field the mouse displays an unsteady gait but no dystonic postures are observed.
Download links
A two-part list of links to download the article, or parts of the article, in various formats.
Downloads (link to download the article as PDF)
Open citations (links to open the citations from this article in various online reference manager services)
Cite this article (links to download the citations from this article in formats compatible with various reference manager tools)
A role for cerebellum in the hereditary dystonia DYT1
eLife 6:e22775.
https://doi.org/10.7554/eLife.22775


