Subcellular tracking reveals the location of dimethylsulfoniopropionate in microalgae and visualises its uptake by marine bacteria
- James Cook University, Australia
- Australian Institute of Marine Science, Australia
- University of Technology Sydney, Australia
- The University of Western Australia, Australia
- University of New South Wales, Australia
- Australian National University, Australia
- Curtin University, Australia
Figures
Figure 1 with 2 supplements

DMSP biosynthetic pathway targeted in this study.
Sulfate (SO42-) taken up from seawater by Symbiodinium is converted to sulfite (SO32-), sulfur-based amino acids and finally DMSP. Some DMSP molecules are then exuded from Symbiodinium cells and can be degraded by a variety of marine bacteria (sulfur atoms (S) and bacterial cells that have taken up sulfur are in red). The biosynthetic pathway presented here is simplified, for more details see Stefels (Stefels, 2000).
-
Figure 1—source data 1
ASP-8A supplement composition used for Symbiodinium cultures modified from Blank (1987).
- https://doi.org/10.7554/eLife.23008.004
Figure 1—figure supplement 1
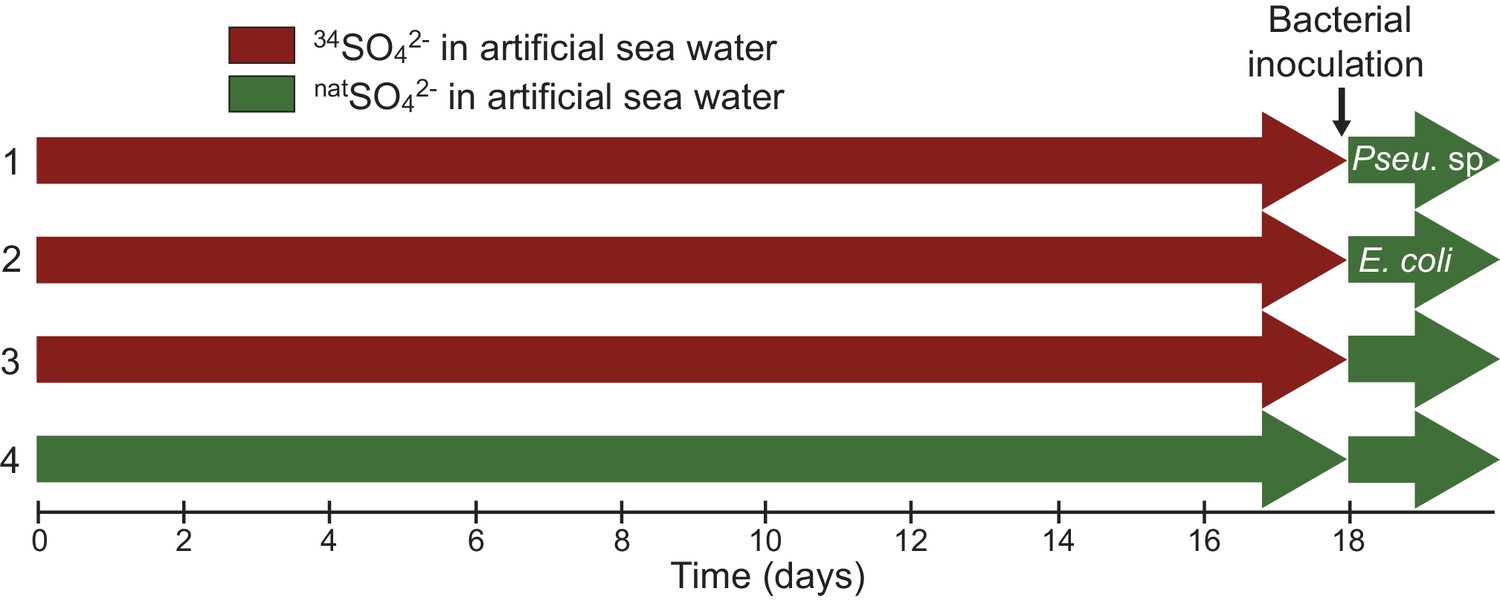
Sampling design showing the four different culture treatments.
Symbiodinium cells were incubated into artificial sea water (ASW) containing either 34SO42- (red, 34S-ASW) or natSO42- (green, natS-ASW control). In treatments (1–3), Symbiodinium cells were incubated in 34S-ASW; after 18 days all treatments were rinsed three times with natS-ASW (in order to remove all residual 34SO42- from the medium) and inoculated with different bacterial strains for six hours. Treatment (1) was inoculated with the DMSP-degrading bacterium Pseudovibrio sp P12; treatment (2) with Escherichia coli W (ATCC 9637), a bacterium incapable of utilizing DMSP; treatment (3) acted as a negative control with no bacteria added. Furthermore, an additional control was used (4), where the Symbiodinium cells were never in contact with enriched levels of 34S nor inoculated with bacteria.
Figure 1—figure supplement 2
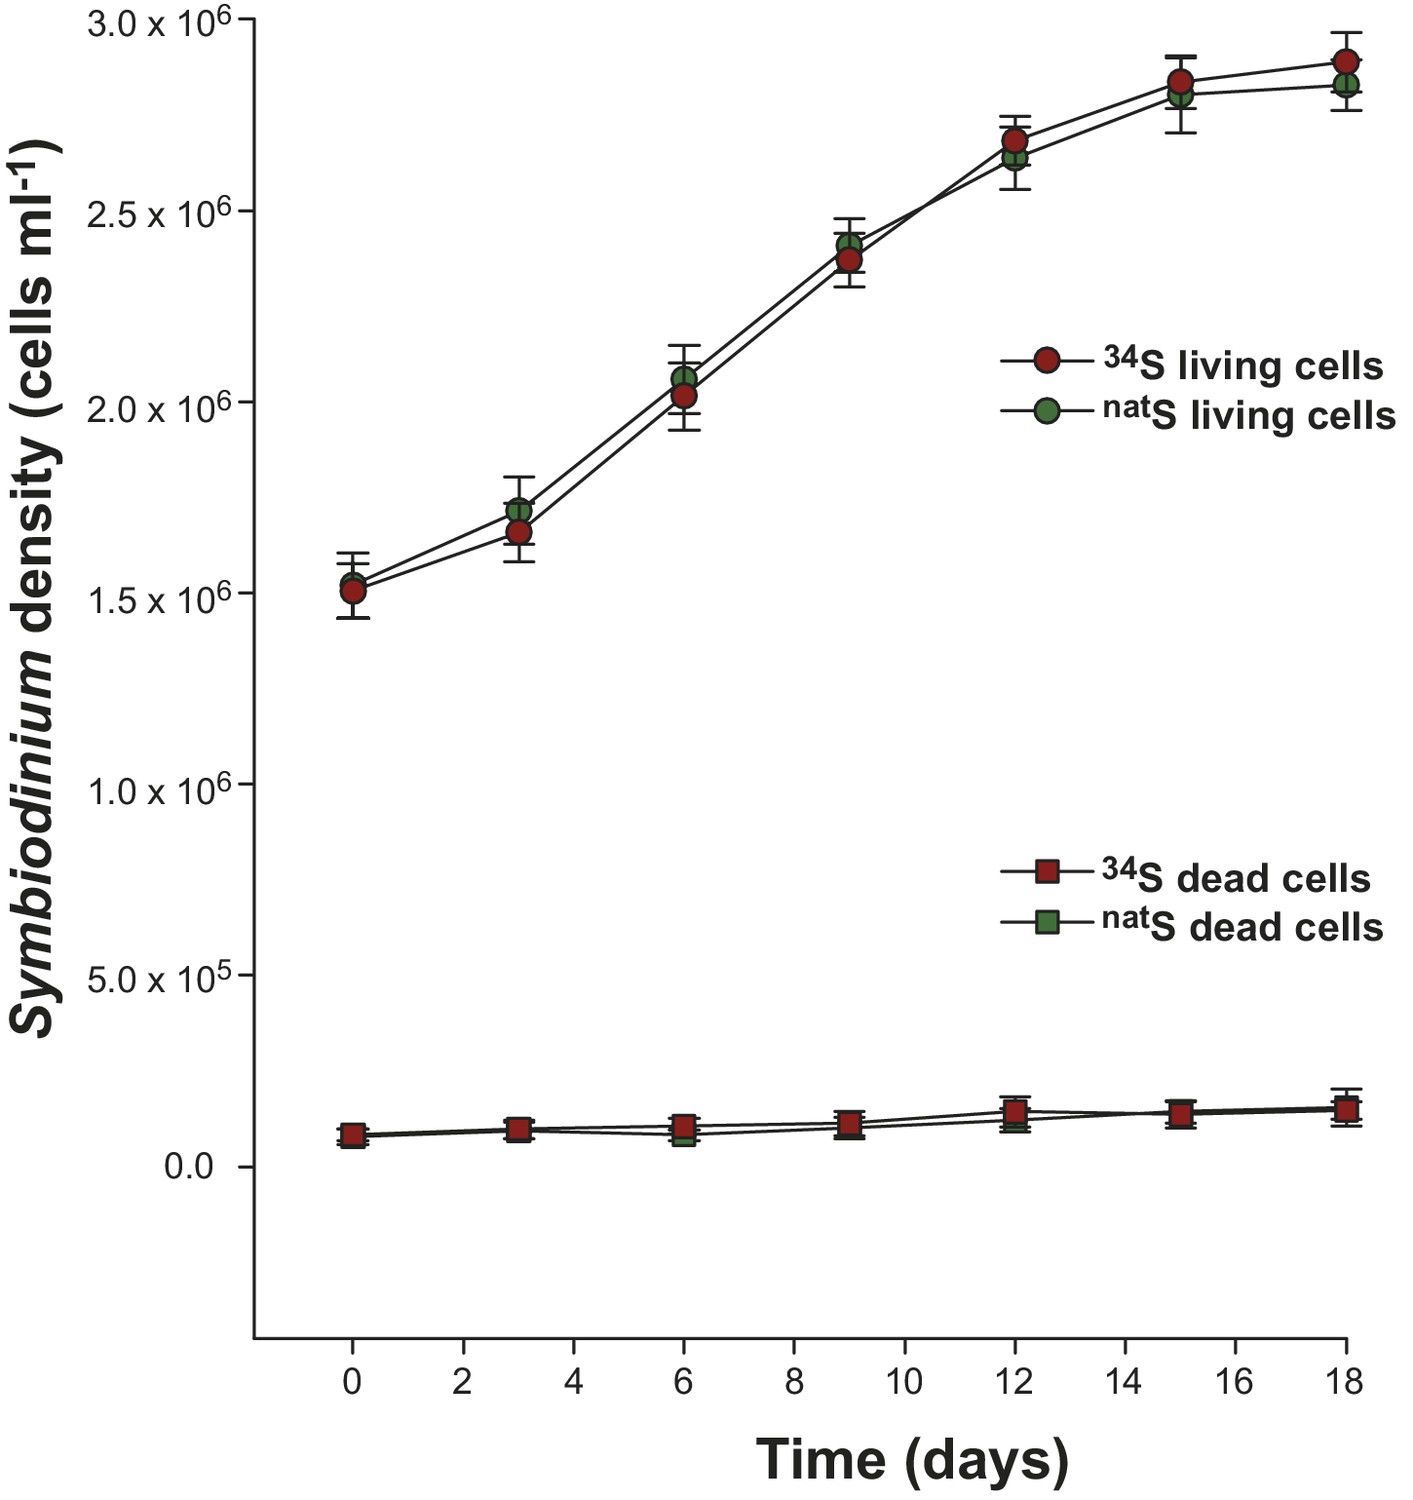
Growth kinetics of Symbiodinium cells (strain C1; mean ± SE; n = 8) incubated at 27°C in artificial seawater containing either 34SO42- (red) or natSO42- (green) as the sole sulfur source.
The round symbols present the number of cells alive while the square symbols represent the number of dead cells (as determined with Evans Blue stain).
Figure 2 with 2 supplements
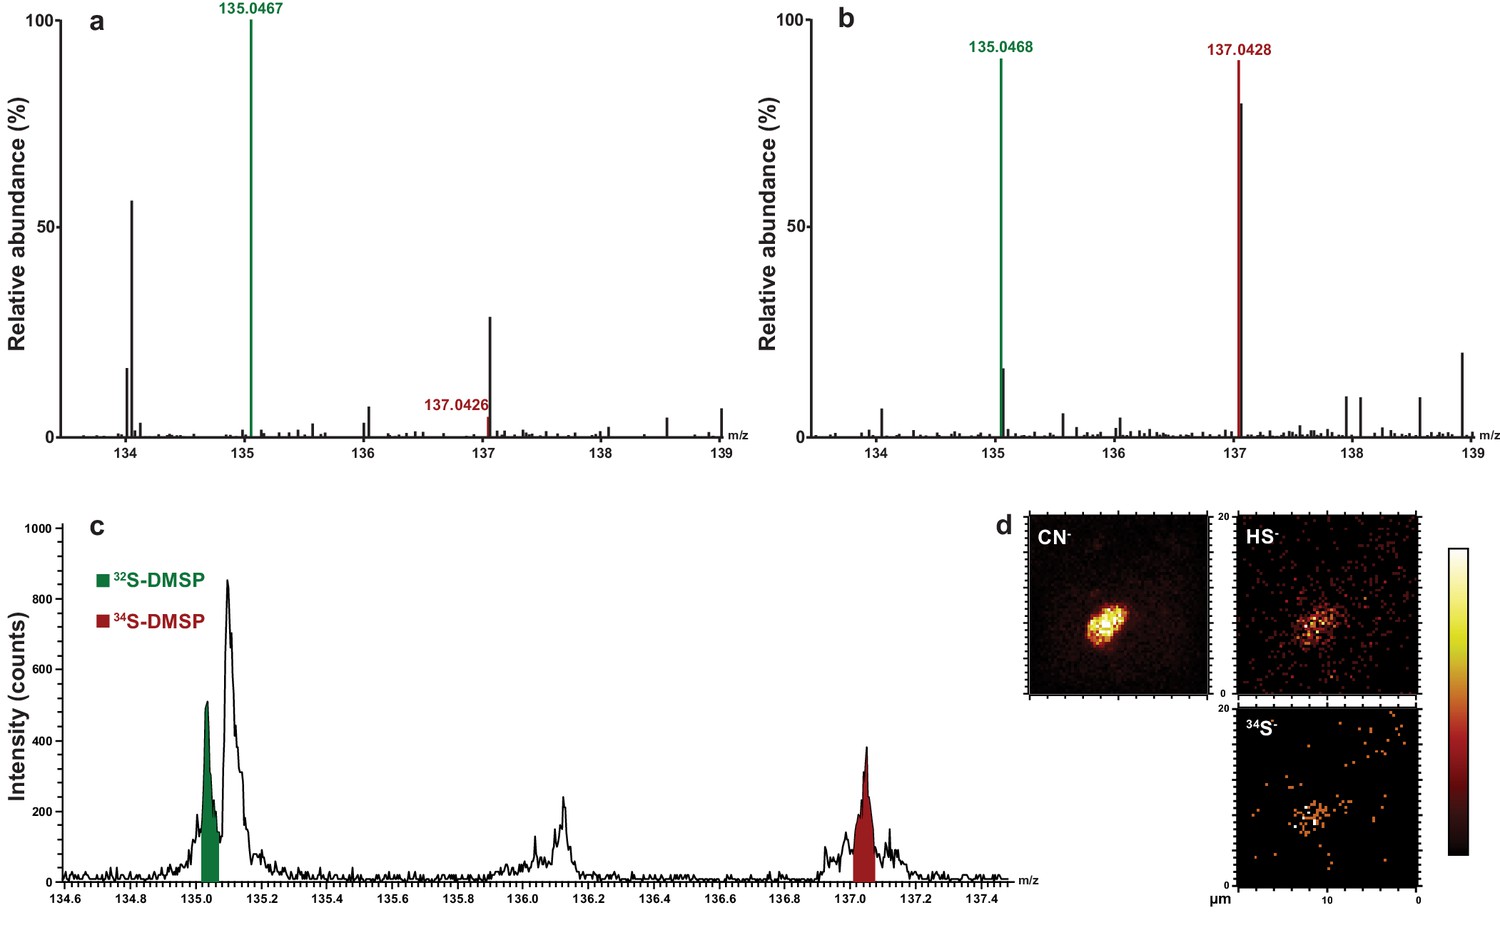
Representative HPLC-MS spectra showing the presence and relative abundance of 32S-DMSP (green peak) and 34S-DMSP (red peak) in methanol extracts derived from Symbiodinium culture (particulate fraction).
(a) incubated with natS (treatment 4, see Figure 1—figure supplement 1); (b) incubated with 34S (treatment 3, see Figure 1—figure supplement 1). For more detailed spectra, see Figure 2—figure supplement 2; for absolute DMSP abundance, see Figure 2—source data 1. (c) Positive-ion ToF-SIMS spectrum of Symbiodinium incubated with 34S (treatment 3, see Figure 1—figure supplement 1) after resin embedding (34S-DMSP represented 46% of total DMSP counts). For comparison between treatment and control spectra, see Figure 2—figure supplement 1; (d) Negative-ion ToF-SIMS images showing the distribution of CN-, HS- and 34S- species over a Symbiodinium cell (treatment 3, see Figure 1—figure supplement 1) enriched in 34S. Field of view is 20 × 20 μm2 (lateral resolution is ~300 nm).
-
Figure 2—source data 1
DMSP in methanol extracts derived from the four different Symbiodinium culture treatments (particulate fraction), as measured by quantitative NMR (n = 3 biological replicates for cultures inoculated with Pseudovibrio sp.) and HPLC-MS (32S-DMSP and 34S-DMSP fractions, n = 3).
Note, when the samples were collected, the Symbiodinium densities were not significantly different between the different treatments (T-Test, n = 8, t = 0.589, p=0.565).
- https://doi.org/10.7554/eLife.23008.008
Figure 2—figure supplement 1
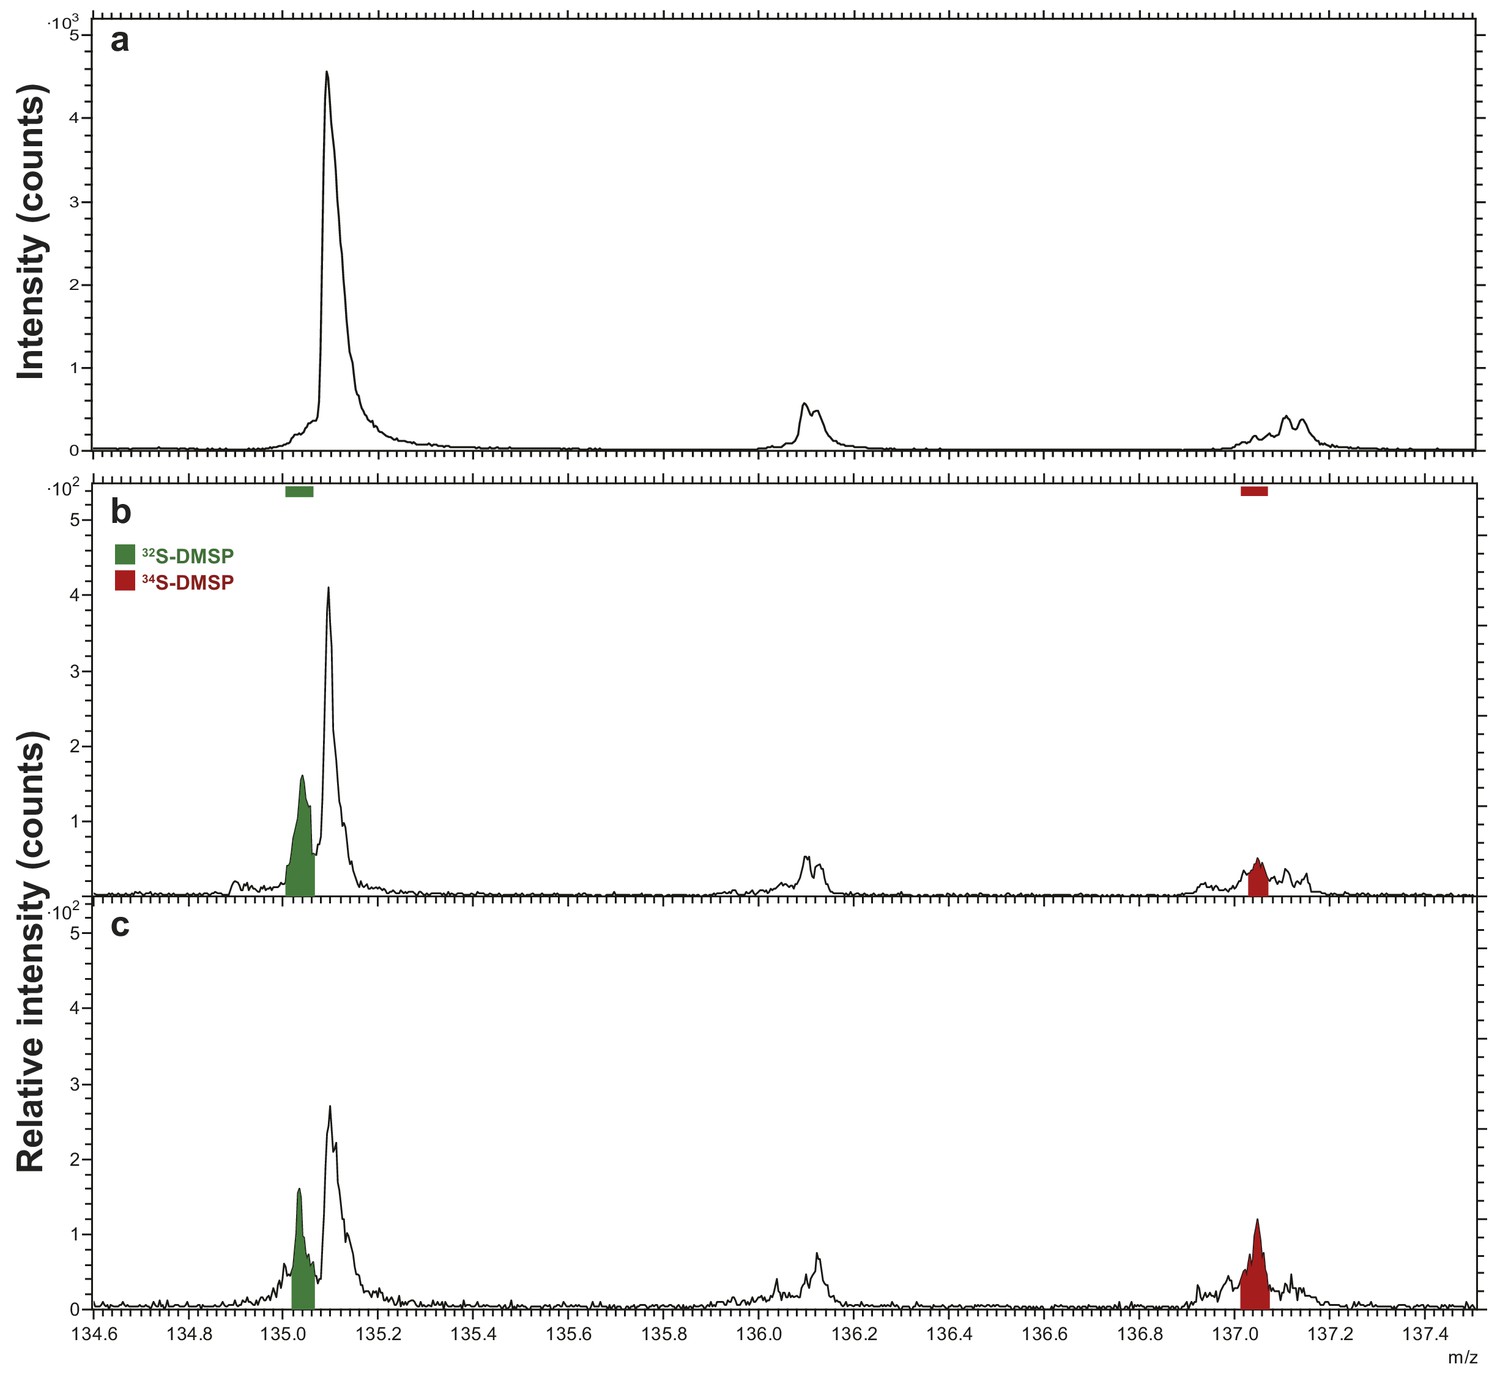
Representative positive-ion spectra of (a) Araldite 502 resin, and Symbiodinium (b) incubated with natS (treatment 4) and (c) incubated with 34S (treatment 3) after resin embedding.
Spectra in (b) and (c) were arbitrarily scaled such that the 32S-DMSP peaks have similar intensities. The areas under the peaks of 34S-DMSP (red) normalised to that of 32S-DMSP (green) are 0.26 and 0.91 in (b) and (c), respectively.
Figure 2—figure supplement 2
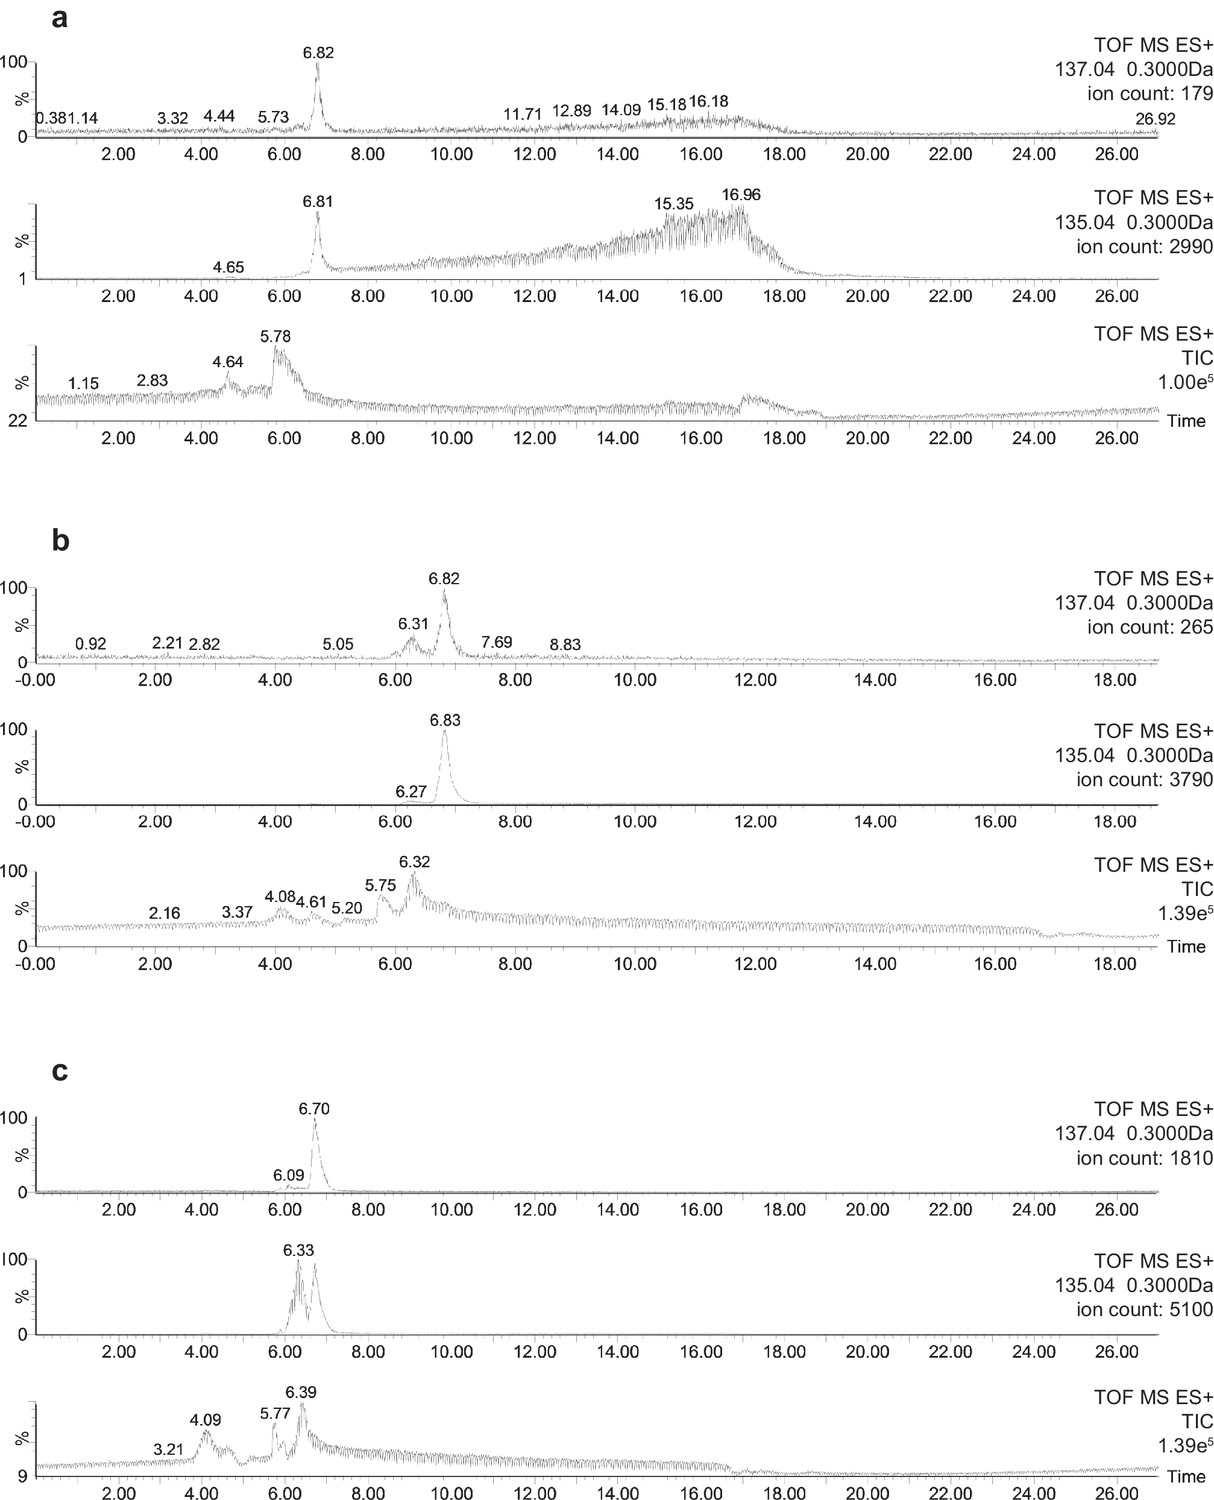
Representative HPLC-MS spectra showing the presence and relative abundance of 32S-DMSP (mass 135.04) and 34S-DMSP (mass 137.04) in methanol extracts: (a) DMSP standard containing natural abundance of 34S-DMSP; (b) Symbiodinium cells incubated with natS (treatment 4); (c) Symbiodinium cells incubated with 34S (treatment 3).
For each spectrum, the number on the right hand side refer to: (i) TOF MS ES+ time-of-flight mass spectrometer and electrospray ionisation positive mode; (ii) 137.04 or 135.04 being the mass of the ion investigated (with a range of ±0.3 Da); (iii) the ion count detected for the ion investigated. Note: the slight difference in retention time between (a, b and c) would be an effect of temperature change in the laboratory.
Figure 3 with 1 supplement
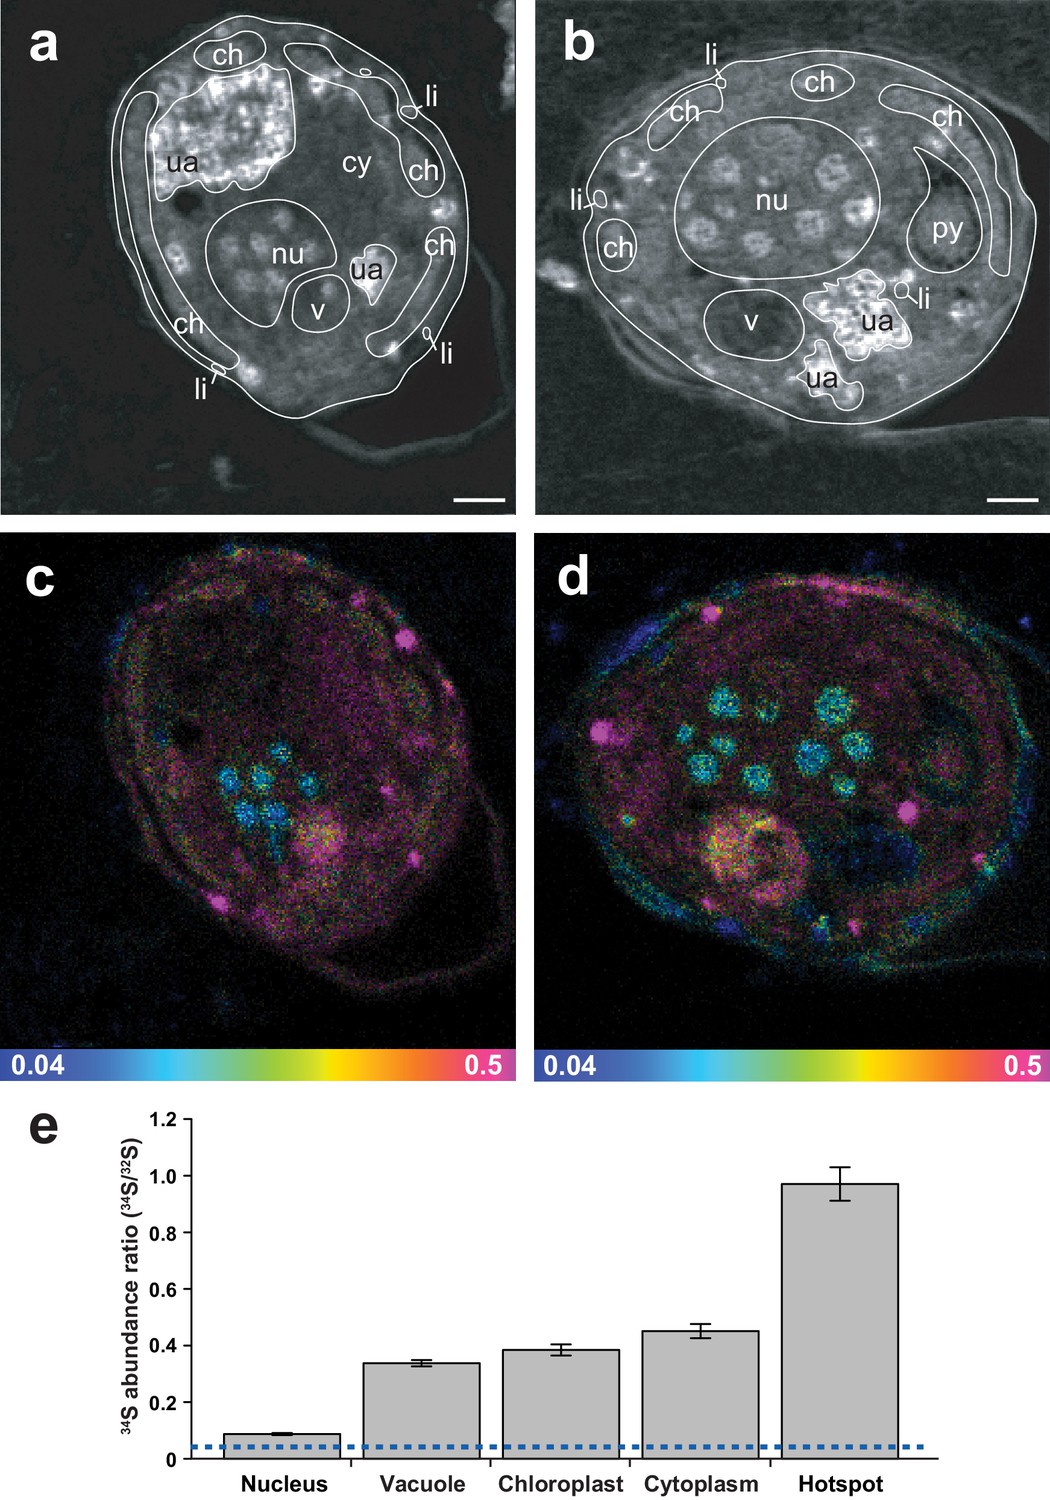
Representative NanoSIMS ion images of Symbiodinium cells showing the sub-cellular distribution of 34S.
(a and b) 12C14N/12C2 mass images showing cellular structures. (c and d) 34S/32S ratio images of the same cells, shown as Hue Saturation Intensity (HSI) images where the colour scale indicates the value of the 34S/32S ratio, with natural abundance in blue, changing to pink with increasing 34S levels. (e) Isotope ratio of 34S/32S in different cellular regions (nucleus n = 10; vacuole n = 3; chloroplast n = 35; cytoplasm n = 12; hotspot n = 20; error bar: SE; source data available: Figure 3—source data 1). The dashed blue line represents the natural 34S abundance recorded in the control samples. nu: nucleus; ch: chloroplast; py: pyrenoid; ua: uric acid storage; v: vacuole; cy: cytoplasm; li: sulfolipids. Scale bars: 1 µm.
-
Figure 3—source data 1
32S and 34S measured in the different cellular region depicted in Figure 3e.
- https://doi.org/10.7554/eLife.23008.012
Figure 3—figure supplement 1
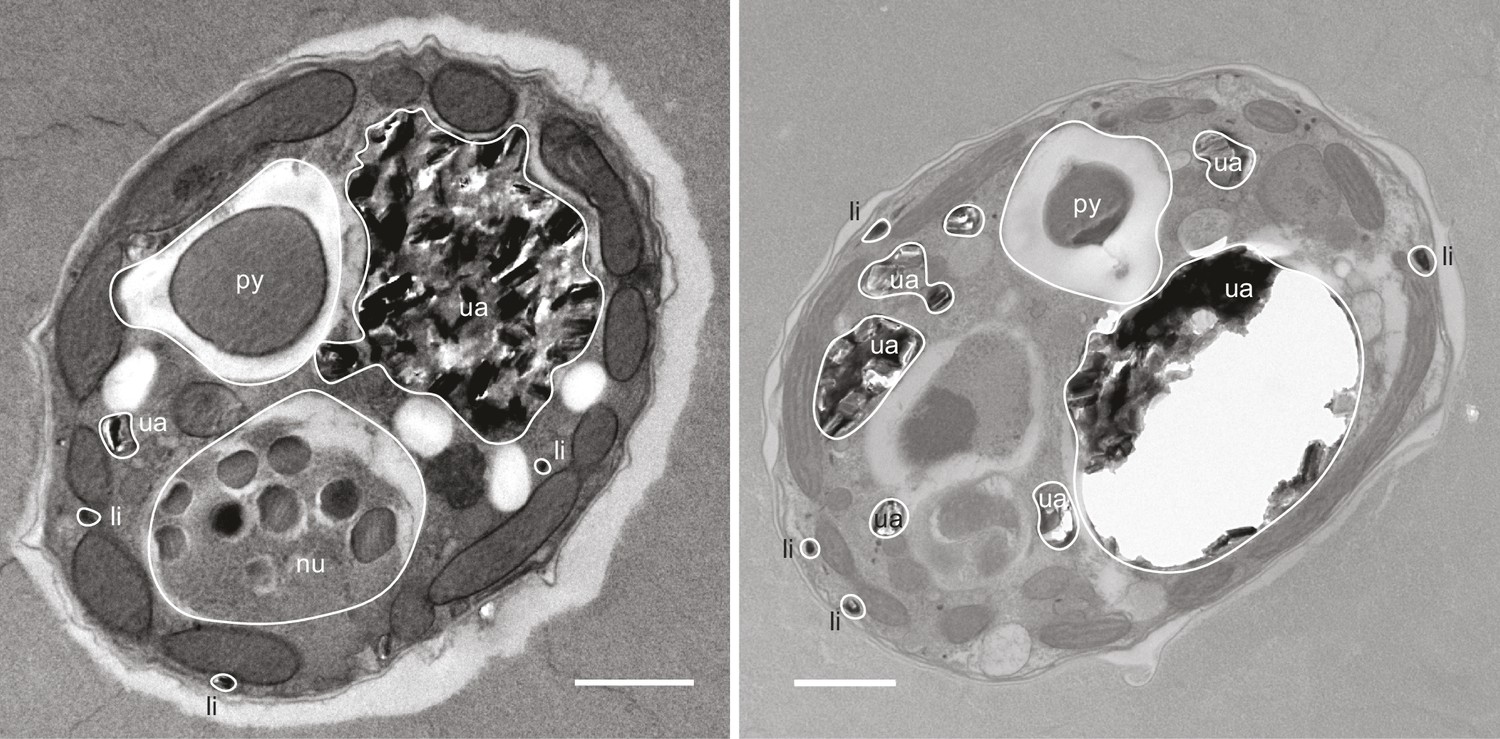
Representative electron micrographs of Symbiodinium cells after OsO4 staining showing the position and size of intracellular lipid droplets.
nu: nucleus; py: pyrenoid; ua: uric acid storage; li: lipids. Scale bars: 1 µm.
Figure 4 with 1 supplement

Representative NanoSIMS ion images of Symbiodinium cells exposed to 34S- or natS-artificial seawater (ASW) for 18 days and subsequently inoculated with two different bacterial strains for six hours.
(a) Timeline of the experiment. (b, c and d) 12C15N/12C14N mass images showing the presence of 15N enriched bacterial cells. (e, f and g) 34S/32S ratio image of the same regions. These mass images are shown as HSI images where the colour scale indicates the value of the stable isotope ratios, with natural abundance in blue, changing to pink with increasing 15N or 34S levels. (b, c, e and f) Symbiodinium cultures were inoculated with the DMSP-degrading bacterium Pseudovibrio sp. P12 (treatment 1). (d and g) Symbiodinium cultures were inoculated with Escherichia coli (treatment 2). White arrows indicate bacteria. (h) Isotope ratio of 34S/32S in bacteria, Pseudovibrio cells were significantly more enriched than E. coli (t-Test, n = 60, t = 9.021, *p<0.001, error bars: SE). The dashed blue line represents the natural 34S abundance recorded in the control samples. (i) Total particulate DMSP concentration in Symbiodinium inoculated with Pseudovibrio sp. or E. coli (t-Test, n = 3, t = 9.908, *p<0.001, error bar: SE). Source data available: Figure 4—source data 1. Note: two regions of interest were merged to create Figure 4c due to stage-shifting errors during sequential acquisition of N and S data. Scale bars = 3 µm.
-
Figure 4—source data 1
12C15N, 12C14N, 32S and 34S measured in the different organisms and treatments depicted in Figure 4h and Figure 4—figure supplement 1.
- https://doi.org/10.7554/eLife.23008.015
Figure 4—figure supplement 1

Isotope ratio of (a) 15N/14N and (b) 34S/32S in Symbiodinium and bacteria cells measured by NanoSIMS in the different treatments (values were extracted from the images).
The dashed lines represent the natural 15N and 34S abundance measured in the controls (0.0037 and 0.0438, respectively). 15N/14N of the inoculated bacterial cells was 4.2243 ± 0.1886 on average, compared to 0.0037 ± 8.29E-06 recorded in the controls. Source data available: Figure 4—source data 1. Note: only inoculated bacteria were incubated in 15N. Error bars = SE.
Download links
A two-part list of links to download the article, or parts of the article, in various formats.
Downloads (link to download the article as PDF)
Open citations (links to open the citations from this article in various online reference manager services)
Cite this article (links to download the citations from this article in formats compatible with various reference manager tools)
Subcellular tracking reveals the location of dimethylsulfoniopropionate in microalgae and visualises its uptake by marine bacteria
eLife 6:e23008.
https://doi.org/10.7554/eLife.23008


