Synaptic transmission and plasticity require AMPA receptor anchoring via its N-terminal domain
- MRC Laboratory of Molecular Biology, United Kingdom
Figures
Figure 1 with 1 supplement
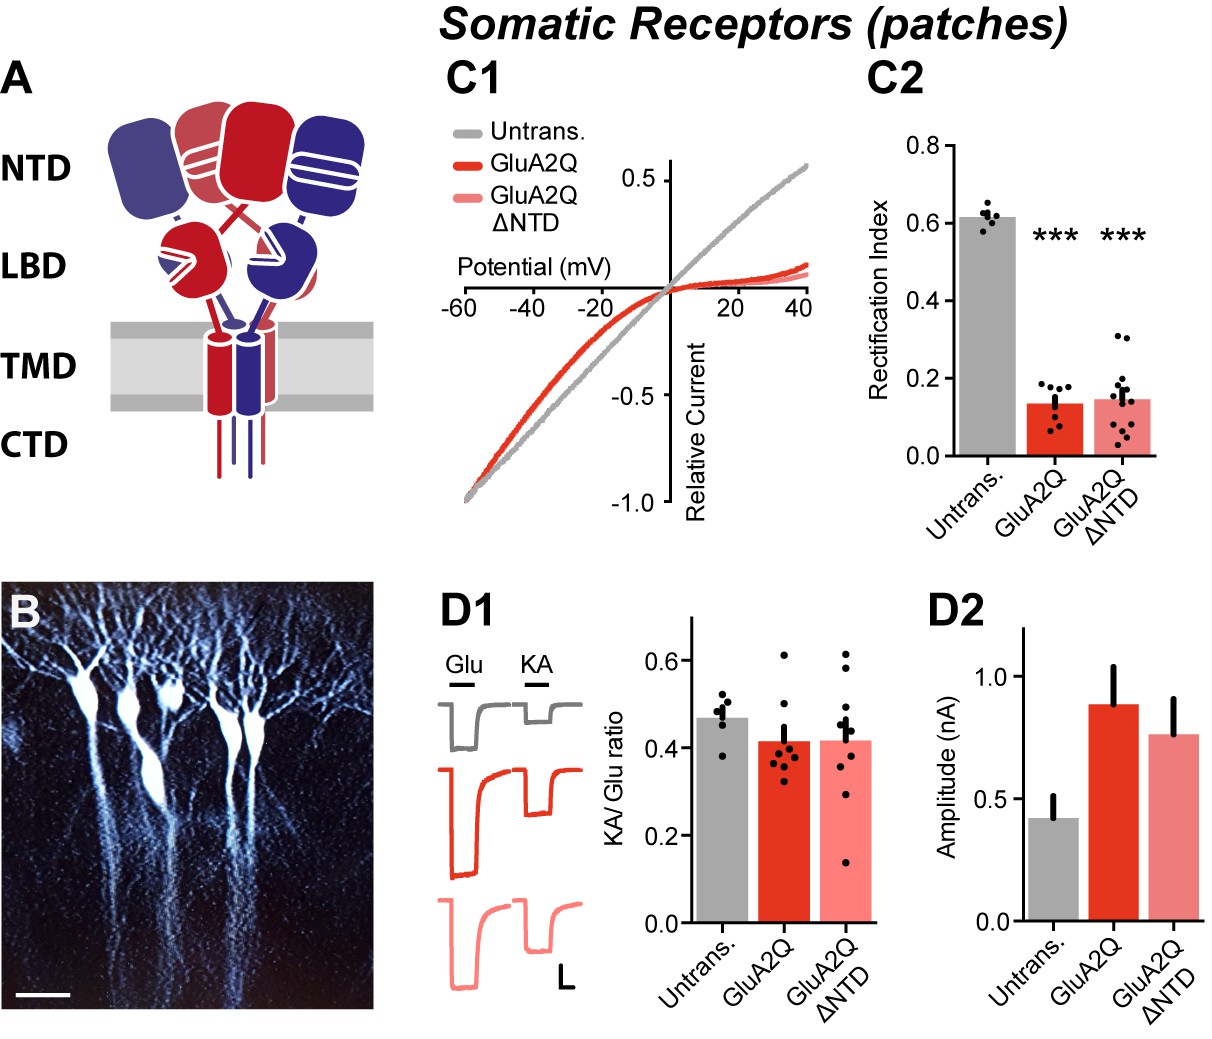
NTD deleted GluA2 is robustly expressed on the cell surface.
(A) AMPA receptor schematic detailing the four-domain structure (NTD - N-terminal domain; LBD - Ligand-binding domain; TMD - Transmembrane domain; CTD - C-terminal domain). (B) Single-cell electroporated CA1 pyramidal neurons in an organotypic slice culture. Scale bar = 50 μm. (C1) I/V curves of glutamate-evoked AMPAR currents recorded from outside-out patches of untransfected, GluA2Q and GluA2Q ΔNTD-expressing cells. (C2) AMPAR currents from transfected neurons show strong inward-rectification on GluA2 construct expression (Rectification index (RI): untrans.: 0.62 ± 0.03 (n = 5); GluA2Q: 0.13 ± 0.02 (n = 8); GluA2Q ΔNTD: 0.15 ± 0.02 (n = 13); One-way ANOVA, p<0.0001). Significance (*) indicates difference to untransfected cells. (D1) Ratio of response amplitude to kainic acid and glutamate, indicative of auxiliary subunit association, from somatic patches is unchanged on receptor overexpression (KA/Glu: untrans.: 0.48 ± 0.03 (n = 5); GluA2Q: 0.41 ± 0.03 (n = 8); GluA2Q ΔNTD: 0.42 ± 0.05 (n = 9); One-way ANOVA, p=0.51). Example traces showing glutamate (Glu) and kainic acid (KA) application are shown left. Scale bar = 50 ms and 100 pA. (D2) Amplitudes of surface patch AMPAR glutamate responses are apparently elevated on GluA2Q or GluA2Q ΔNTD overexpression (untrans.: 398 ± 50 pA; GluA2Q: 886 ± 153 pA; GluA2Q ΔNTD: 763 ± 145 pA).
Figure 1—figure supplement 1
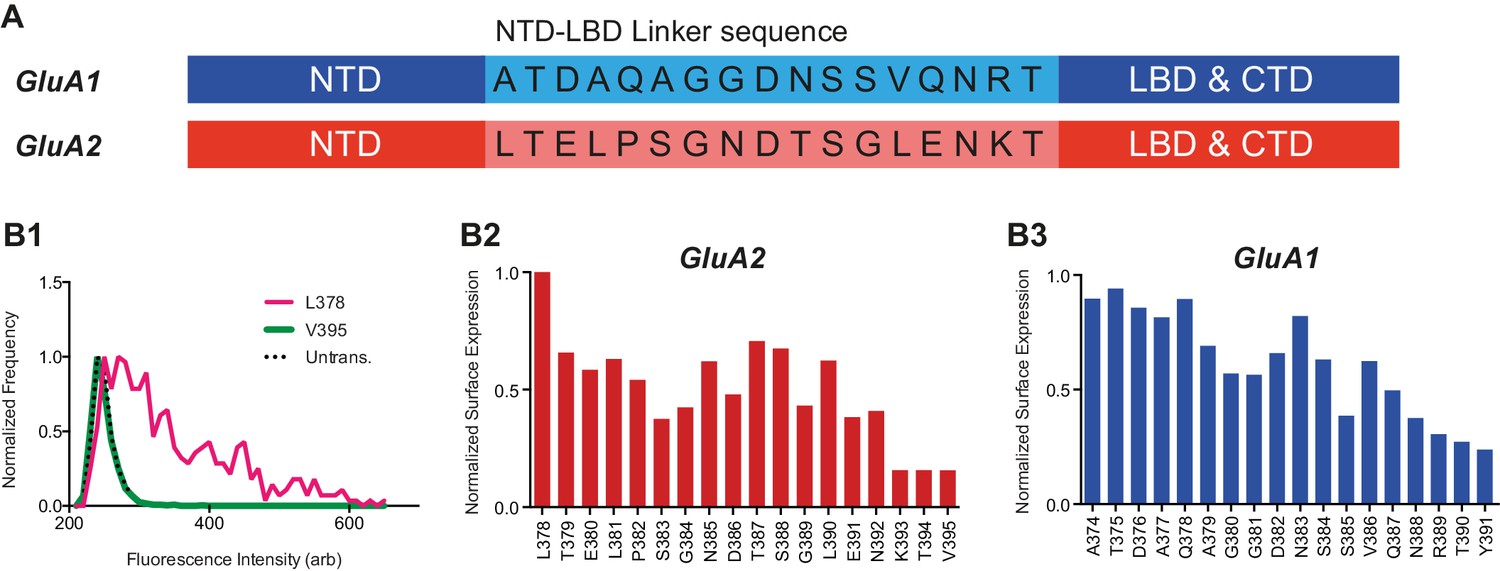
NTD deletion construct screening.
(A) GluA1 and GluA2 NTD-LBD linker sequences. (B1) Fluorescence histogram of two GluA2 NTD-deletion constructs as measured using flow cytometry. Amino acid number indicates first residue of deletion constructs. Background fluorescence of untransfected (untrans.) cells is shown for reference. (B2) Surface expression of NTD deletion constructs of GluA2 normalized to best expressing construct. Data represents an average of two repetitions. L378 construct was used henceforth. (B3) Normalized surface expression of GluA1 NTD deletion constructs (two preparations averaged). A374 construct was used henceforth.
Figure 2 with 1 supplement
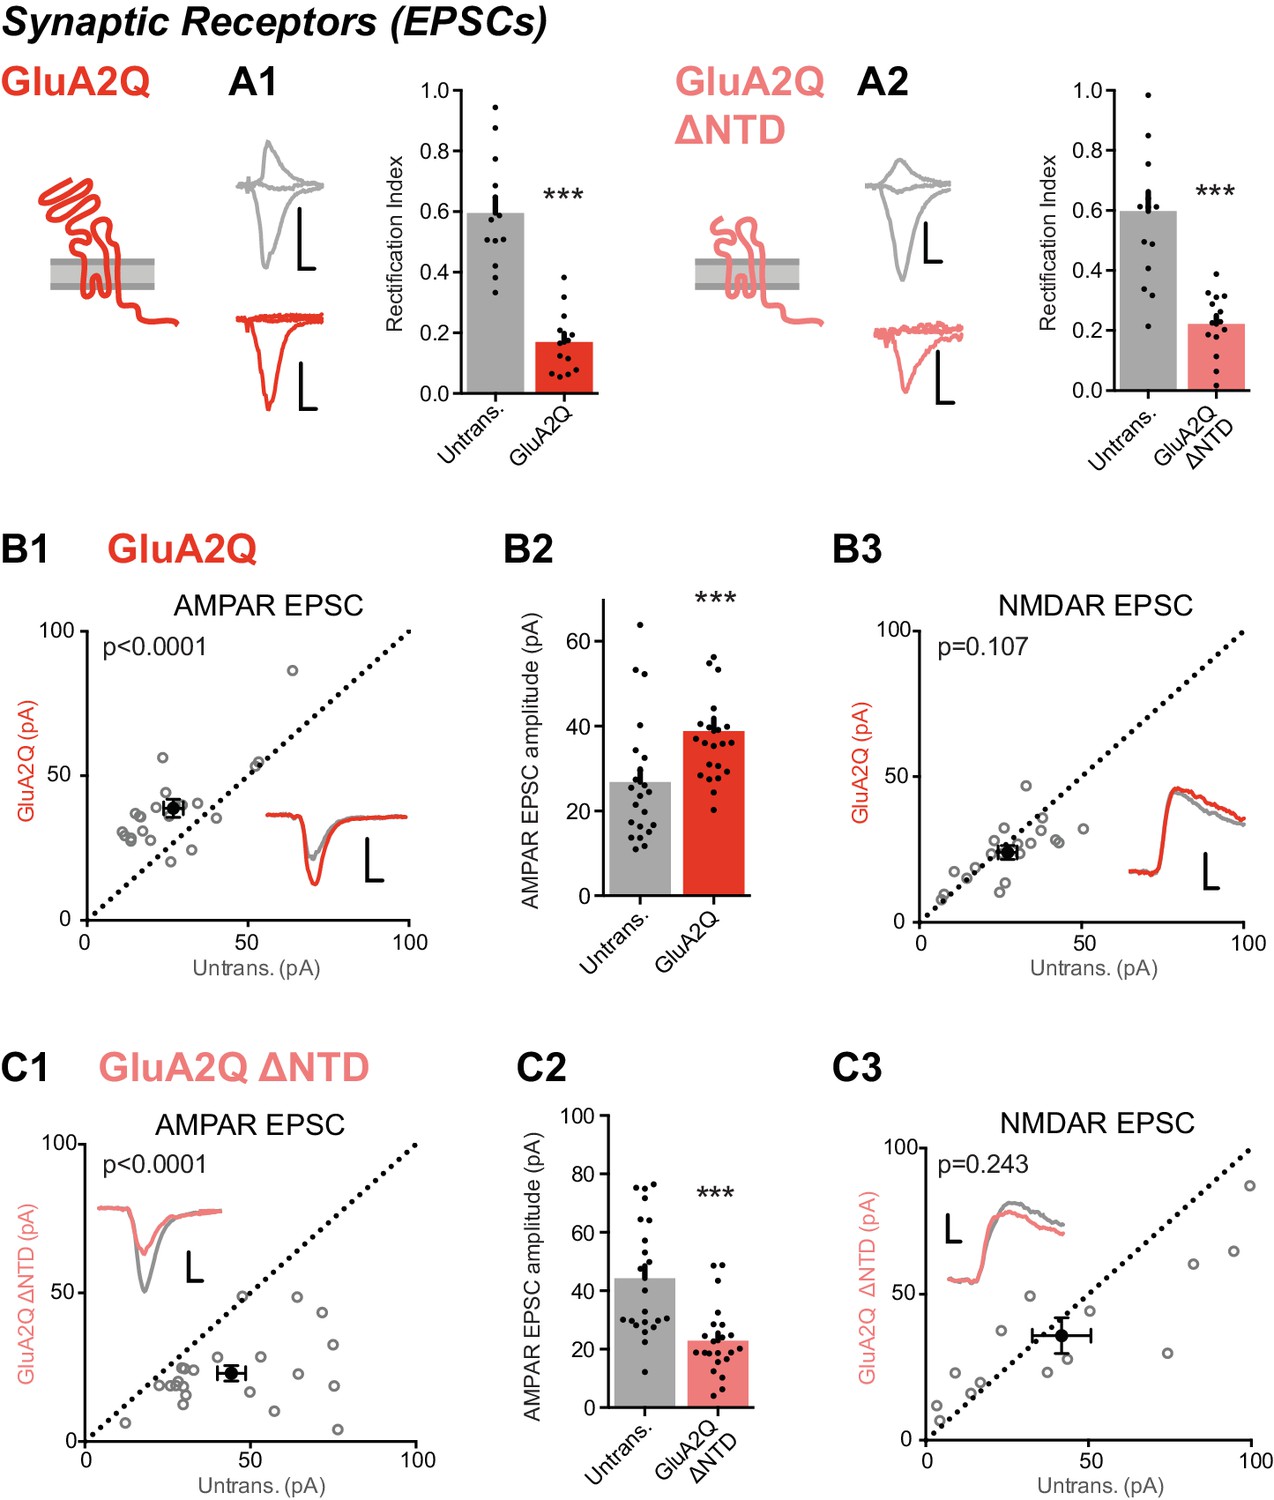
Expression of NTD deleted GluA2 causes large reduction in synaptic currents.
(A) Synaptic RI measured from pairs of untransfected and transfected cells indicate both homomeric GluA2Q and GluA2Q ΔNTD are inserted into synapses. (A1) Untrans., 0.60 ± 0.19; GluA2Q, 0.17 ± 0.10; n = 13 pairs; paired t-test, p=0.001. (A2) Untrans., 0.60 ± 0.25; GluA2Q ΔNTD, 0.22 ± 0.11; n = 16 pairs; paired t-test, p<0.0001. Sample traces and construct schematics are shown on the left. Scale bar = 10 ms, 50 pA (grey and GluA2Q) or 20 pA (GluA2Q ΔNTD). (B–C) Scatter plots and bar charts of EPSC amplitudes from pairs of cells, showing single pairs (open circles) and mean values ± SEM (filled circles). Sample traces inset. Scale bar = 10 ms, 30 pA. (B1) GluA2Q-expressing cells have increased AMPAR EPSCs relative to untransfected cells (untrans.: 26.8 ± 3.1 pA; GluA2Q: 38.8 ± 3.0 pA; n = 22 pairs; paired t-test, p<0.0001). (B2) Bar chart of AMPAR EPSCs from B1. (B3) NMDAR-mediated EPSCs remain unchanged (untrans.: 27.2 ± 2.7 pA; GluA2Q: 24.0 ± 2.2 pA; n = 20; paired t-test, p=0.107). (C1) GluA2Q ΔNTD-expressing cells show AMPAR EPSC amplitude depression (untrans.: 44.3 ± 4.3 pA; GluA2Q ΔNTD: 23.0 ± 2.5 pA; n = 22; paired t-test, p<0.0001). (C2) Bar chart of AMPAR EPSCs from C1. (C3) NMDAR EPSCs show no amplitude change (untrans.: 41.8 ± 9.0 pA; GluA2Q ΔNTD: 35.8 ± 6.1 pA; n = 14; paired t-test, p=0.243).
Figure 2—figure supplement 1
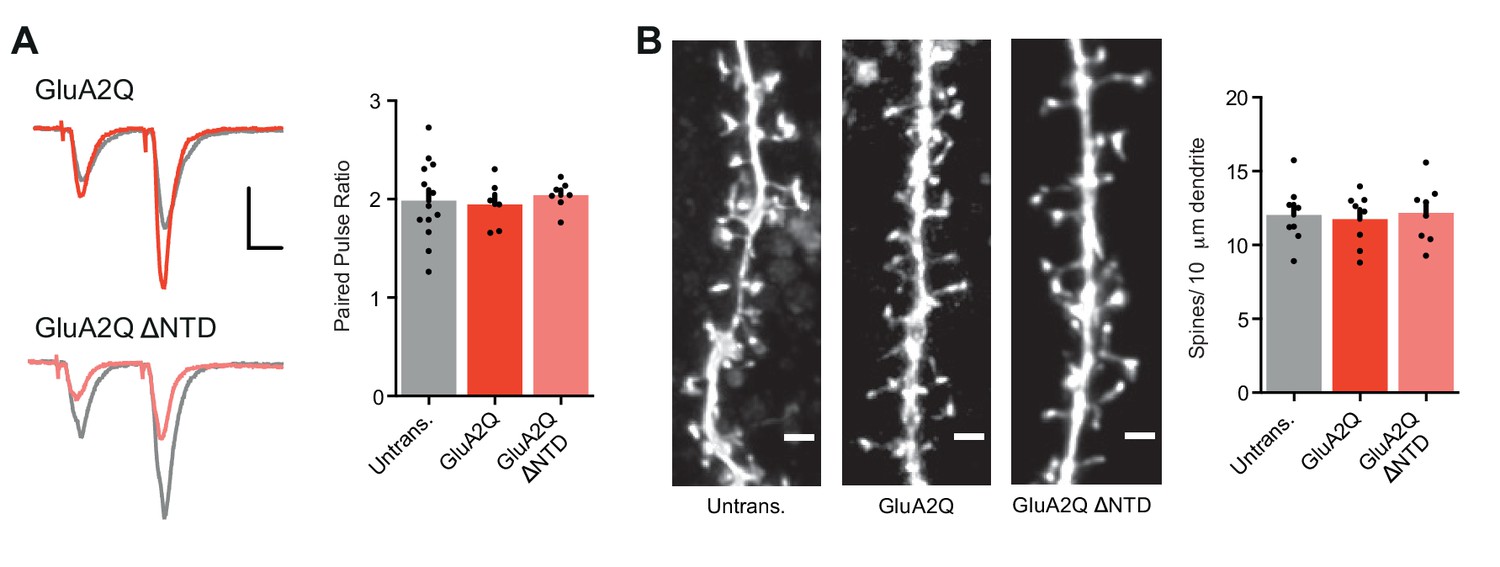
Measurement of paired-pulse ratio and spine density.
(A) Average paired-pulse ratio of neighboring untransfected and transfected cells (untrans.: 1.98 ± 0.11 (n = 13); GluA2Q: 1.95 ± 0.10 (n = 6); GluA2Q ΔNTD: 2.04 ± 0.06 (n = 7); One-way ANOVA: p=0.876), with example traces from pairs of cells shown on the left. Scale bars = 20 ms and 30 pA. (B) Bar chart of dendritic spine density on untransfected and transfected cells (untrans.: 12.0 ± 0.7 (n = 8 cells); GluA2Q: 11.8 ± 0.6 (n = 8); GluA2Q ΔNTD: 12.2 ± 0.7 (n = 8); One-way ANOVA: p=0.916). Sample images are shown on the left. Scale bar = 2.5 μm.
Figure 3
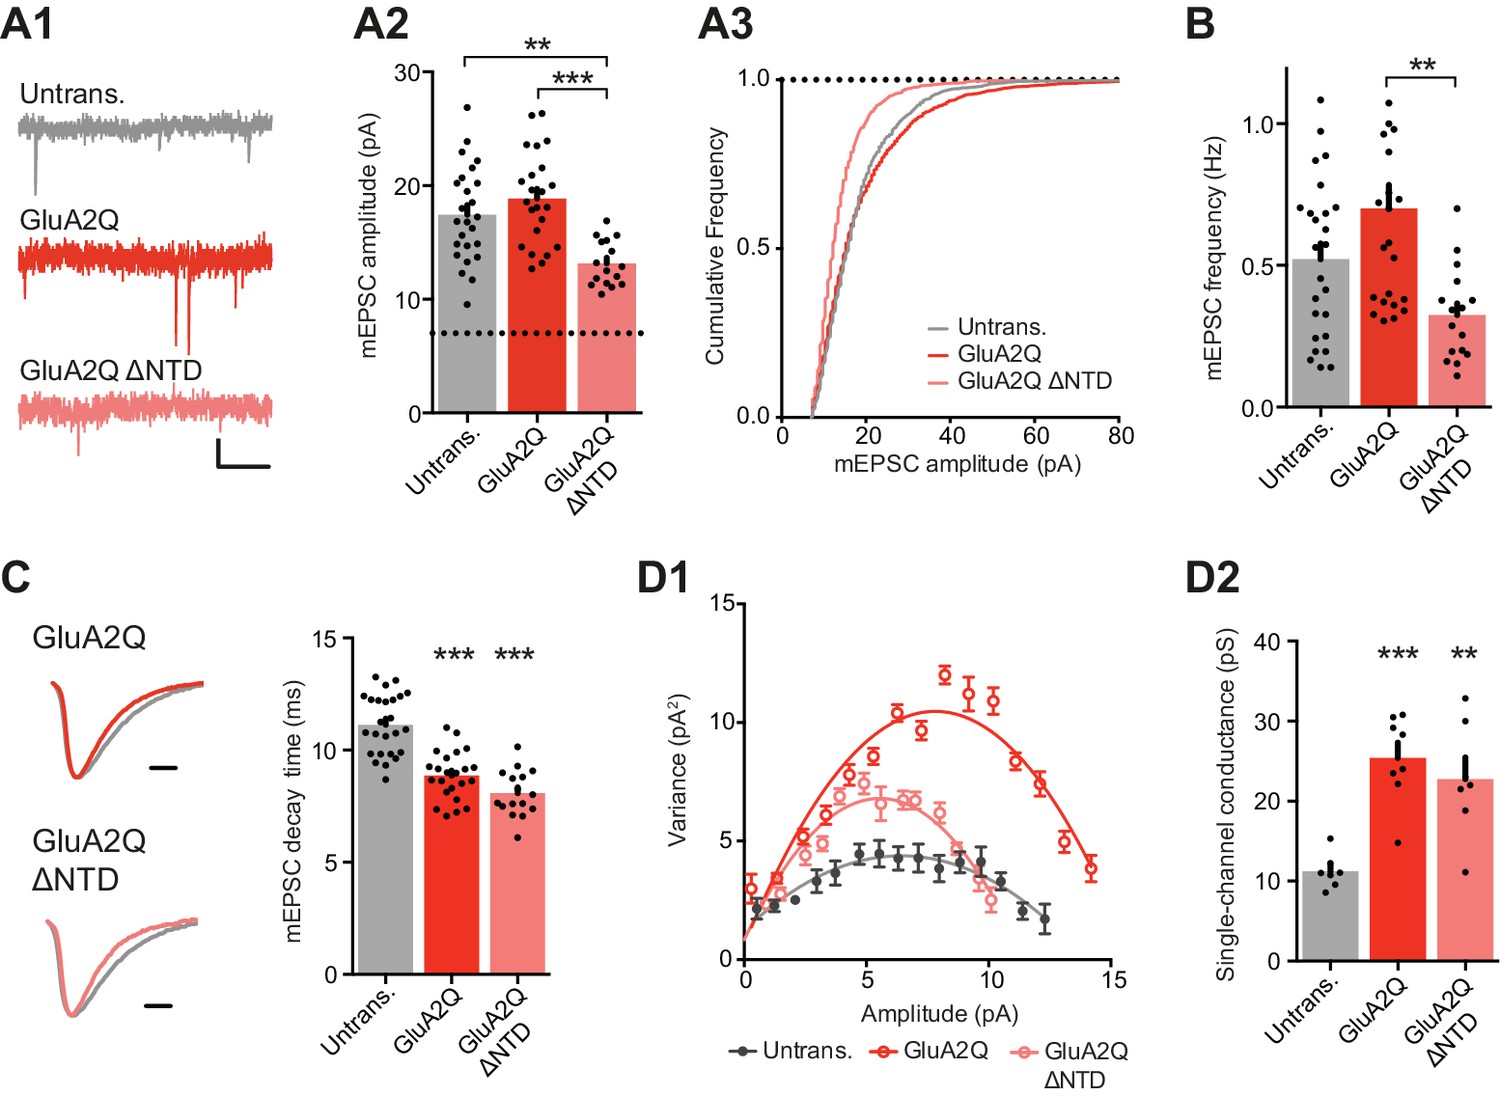
NTD deleted GluA2 is detrimental to spontaneous transmission.
(A1) Example traces of mEPSCs recorded from untransfected, GluA2Q and GluA2Q ΔNTD-expressing cells. Scale bar = 0.5 s, 5 pA. (A2) Bar chart of mEPSC amplitude with event detection limit indicated (dotted line) (untransfected: 17.5 ± 0.8 pA (n = 25 cells); GluA2Q: 18.9 ± 0.8 pA (n = 23); GluA2Q ΔNTD: 13.2 ± 0.5 pA (n = 16); One-way ANOVA, p<0.0001). (A3) Cumulative frequency distribution of mEPSC amplitude data from A2. (B) Bar chart of mEPSC frequency (untransfected: 0.52 ± 0.06 Hz; GluA2Q: 0.70 ± 0.08 Hz; GluA2Q ΔNTD: 0.32 ± 0.04 Hz; One-way ANOVA, p=0.002). (C) Example traces of scaled mEPSCs from untransfected (grey) and GluA2 construct-expressing cells. Scale bar = 3 ms. Bar chart shows cell averaged mEPSC decay times (untrans.: 11.14 ± 0.27 ms (n = 25); GluA2Q: 8.86 ± 0.23 ms (n = 23); GluA2Q ΔNTD: 8.08 ± 0.26 ms (n = 16); One-way ANOVA, p<0.0001). (D1) Amplitude vs. variance plot for non-stationary fluctuation analysis (NSFA) of scaled mEPSCs with parabolic fits from representative cells. (D2) Single-channel conductance of synaptic AMPARs show comparable conductance between GluA2Q and GluA2Q ΔNTD-expressing cells (untransfected: 11.2 ± 0.82 pS (n = 7); GluA2Q: 25.4 ± 1.92 pS (n = 8); GluA2Q ΔNTD: 22.8 ± 2.70 pS (n = 7); One-way ANOVA, p=0.0002).
Figure 4
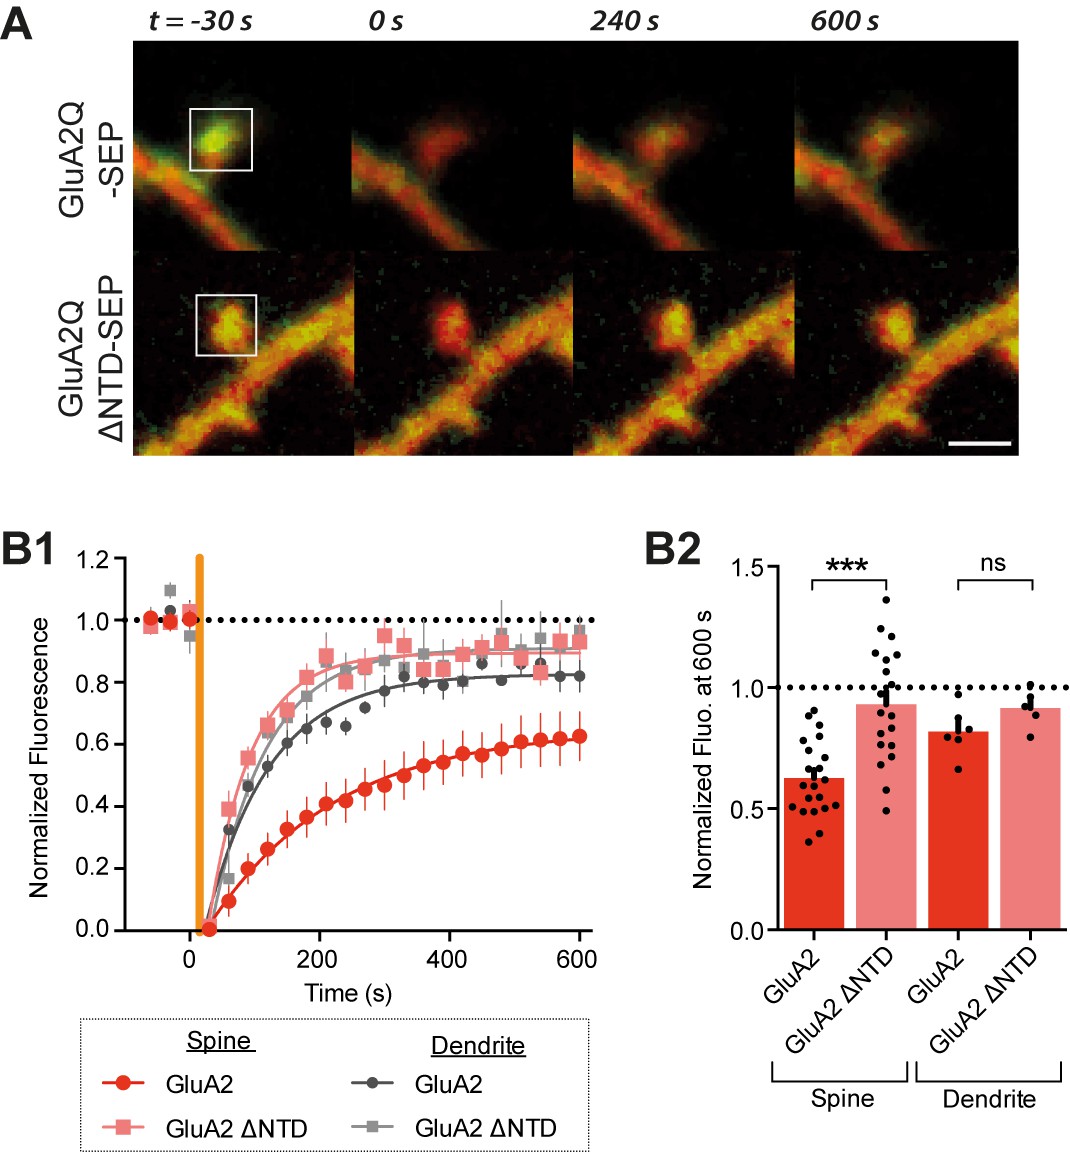
The GluA2 NTD controls synaptic immobilisation.
(A) Example images of FRAP on dendritic spine from cells expressing SEP-tagged AMPAR constructs, where t = 0 indicates time and square indicates location of photobleaching. Red channel: cytosolic mCherry; green: SEP fluorescence. Scale bar = 1 μm B1, SEP fluorescence over time in bleached regions of dendrite or spine, normalized to pre-bleaching fluorescence. Orange vertical line indicates onset of photobleaching (time constant of fit τ: spine GluA2 = 197.3, spine GluA2 ΔNTD = 65.4, dendritic GluA2 = 98.1, dendritic GluA2 ΔNTD = 83.1). (B2), Fluorescence at 600s averaged by cell shows greater recovery for GluA2Q ΔNTD than full-length GluA2Q (spine GluA2Q: 0.63 ± 0.03 (n = 22 cells); spine GluA2Q ΔNTD: 0.93 ± 0.05 (n = 19); dendrite GluA2Q: 0.80 ± 0.04 (n = 6); dendritic GluA2Q ΔNTD: 0.92 ± 0.04 (n = 5); One-way ANOVA, p<0.0001).
Figure 5

The NTD is essential for synaptic anchoring of GluA1.
(A1) I/V relationships of glutamate-evoked AMPAR-mediated current from outside-out patches of untransfected, GluA1 and GluA1 ΔNTD expressing cells. (A2) Average RI of surface currents from above neurons (untrans.: 0.61 ± 0.05 (n = 5); GluA1: 0.23 ± 0.03 (n = 5); GluA1 ΔNTD: 0.19 ± 0.02 (n = 7); One-way ANOVA, p<0.0001). (B1) KA/Glu ratio from somatic patches is unchanged on GluA1 construct overexpression (KA/Glu: untrans.: 0.47 ± 0.02 (n = 5); GluA1: 0.43 ± 0.03 (n = 9); GluA1 ΔNTD: 0.39 ± 0.02 (n = 9); One-way ANOVA, p=0.16). Example traces showing glutamate (Glu) and kainic acid (KA) application are shown left. Scale bar = 50 ms and 300 pA. (B2) AMPAR surface patch amplitudes are similarly elevated on GluA1 or GluA1 ΔNTD overexpression (untrans.: 421 ± 90 pA; GluA1: 849 ± 154 pA; GluA1 ΔNTD: 878 ± 173 pA). (C1) Synaptic RI from pairs of untransfected and GluA1-expressing cells (untransfected: 0.57 ± 0.04; GluA1: 0.33 ± 0.03; n = 20; paired t-test, p=0.0001), with example traces and construct schematic shown on the left. Scale bars for panels C and D = 10 ms and 15 pA C2 Scatter plot of AMPAR EPSC amplitudes from pairs of untransfected and GluA1-expressing cells (untransfected: 36.4 ± 3.5 pA; GluA1: 29.4 ± 3.0 pA; n = 34; paired t-test, p=0.013). (D1) Synaptic RI from pairs of untransfected and GluA1 ΔNTD-expressing cells (untransfected: 0.51 ± 0.04; GluA1 ΔNTD: 0.48 ± 0.03; n = 18; paired t-test, p=0.072), with example traces shown on the left. (D2) Scatter plot of AMPAR EPSC amplitudes from pairs of untransfected and GluA1 ΔNTD-expressing cells (untransfected: 32.6 ± 2.1 pA; GluA1 ΔNTD: 26.9 ± 2.7 pA; n = 21; paired t-test, p=0.014).
Figure 6 with 1 supplement
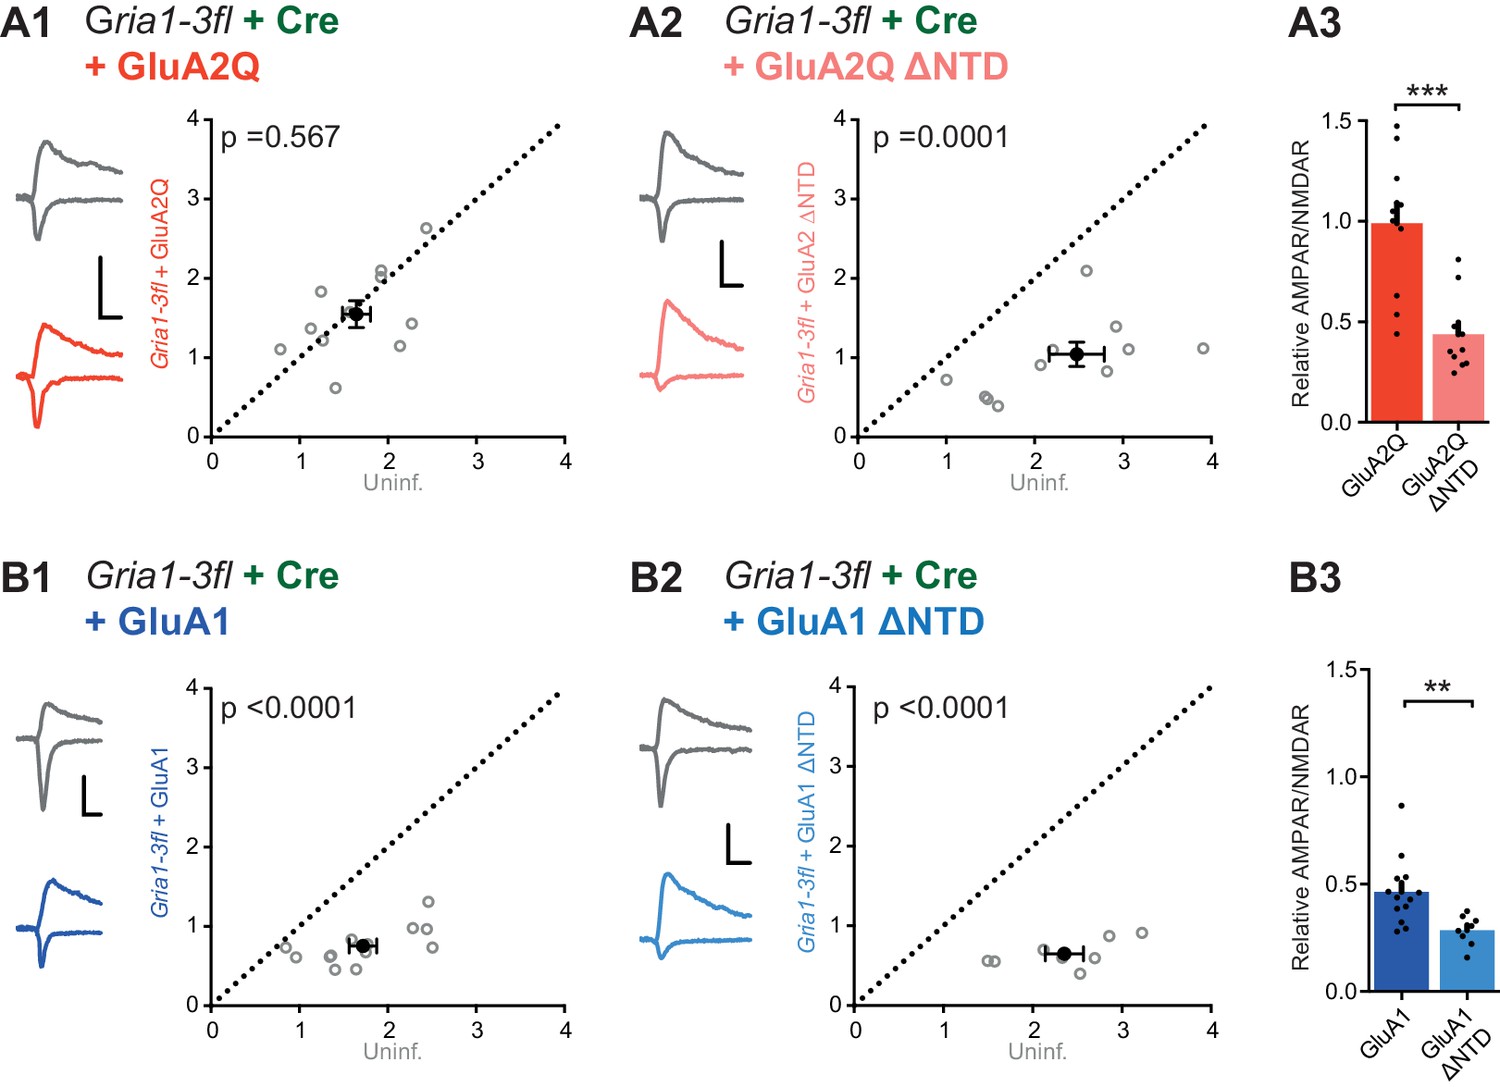
NTD dependent interactions enhance synaptic AMPAR anchoring in a knockout background.
Paired recordings from Gria1-3fl neurons infected with AAV-Cre and rescued with AMPAR subunits, or uninfected and untransfected (uninf.). Example traces show current responses at −60 mV (AMPAR) and +40 mV (NMDAR) holding potentials. Scale bars = 30 ms and 50 pA. (A1) Rescue with GluA2Q restores the ratio of AMPAR to NMDAR currents to levels of uninfected neurons (AMPAR/NMDAR, (n = 11 pairs): uninf.: 1.64 ± 0.16; GluA2Q: 1.55 ± 0.17; paired t-test, p=0.567). (A2) Rescue with GluA2Q ΔNTD cannot fully restore AMPAR currents relative to NMDAR (AMPAR/NMDAR, (n = 11 pairs): uninf.: 2.28 ± 0.26; GluA2Q ΔNTD 0.97 ± 0.15; paired t-test, p=0.0001). (A3) Normalization of synaptic currents to uninfected cells reveals that GluA2Q NTD deletion reduces synaptic AMPAR rescue (Relative AMPAR/NMDAR ratio: GluA2Q: 0.99 ± 0.10; GluA2Q ΔNTD: 0.44 ± 0.05; unpaired t-test, p=0.0001). (B1) Rescue of synaptic currents by GluA1 transfection (AMPAR/NMDAR, (n = 13 pairs): uninf.: 1.72 ± 0.15; GluA1: 0.75 ± 0.06; paired t-test, p<0.0001). (B2) Rescue of synaptic currents with GluA1 ΔNTD (AMPAR/NMDAR, (n = 9 pairs): uninf.: 2.48 ± 0.23; GluA1 ΔNTD: 0.83 ± 0.19; paired t-test, p<0.0001). (B3) GluA1 rescues synaptic currents to a greater extent than GluA1 ΔNTD (Relative AMPAR/NMDAR ratio: GluA1: 0.46 ± 0.04; GluA1 ΔNTD: 0.28 ± 0.03; unpaired t-test, p=0.007).
Figure 6—figure supplement 1
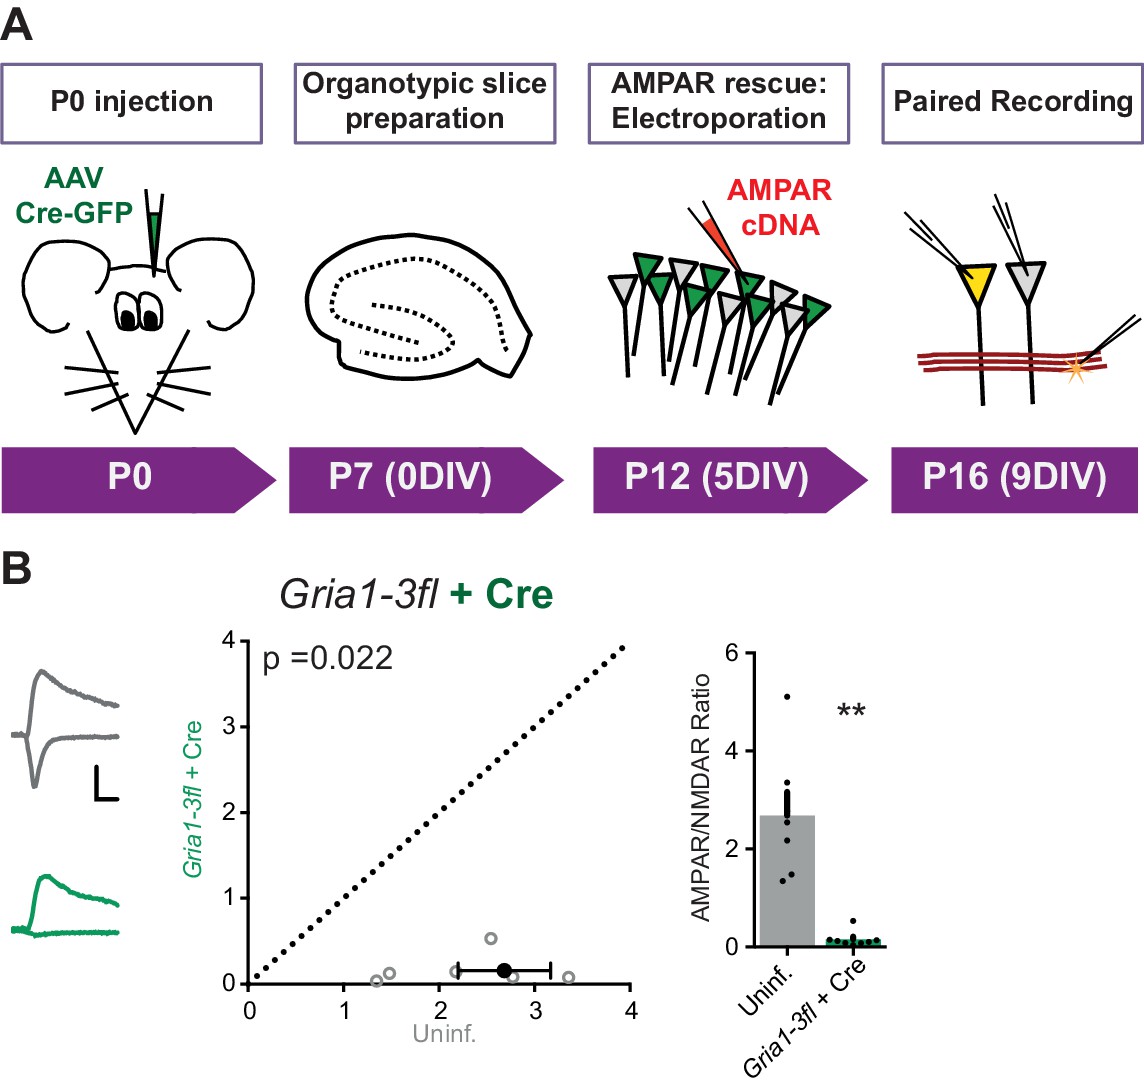
Overview and characterization of conditional AMPAR knockout in Gria1-3fl organotypic slices.
(A) Protocol schematic for AMPAR knockout and rescue in Gria1-3fl neurons, with timings shown as mouse postnatal age (P) and days in vitro (DIV). (B) Paired recordings from AAV-Cre and uninfected (uninf.) neurons from Gria1-3fl slices shows almost complete loss of AMPAR EPSCs (normalized to NMDAR current amplitude) (AMPAR/NMDAR, (n = 7 pairs): uninf.: 2.68 ± 0.48; Cre: 0.16 ± 0.06; paired t-test, p=0.022) as seen by scatter (left) and bar charts (right). Example traces show currents at −60 mV and +40 mV holding potentials for each condition. Scale bar = 30 ms and 50 pA.
Figure 7 with 1 supplement
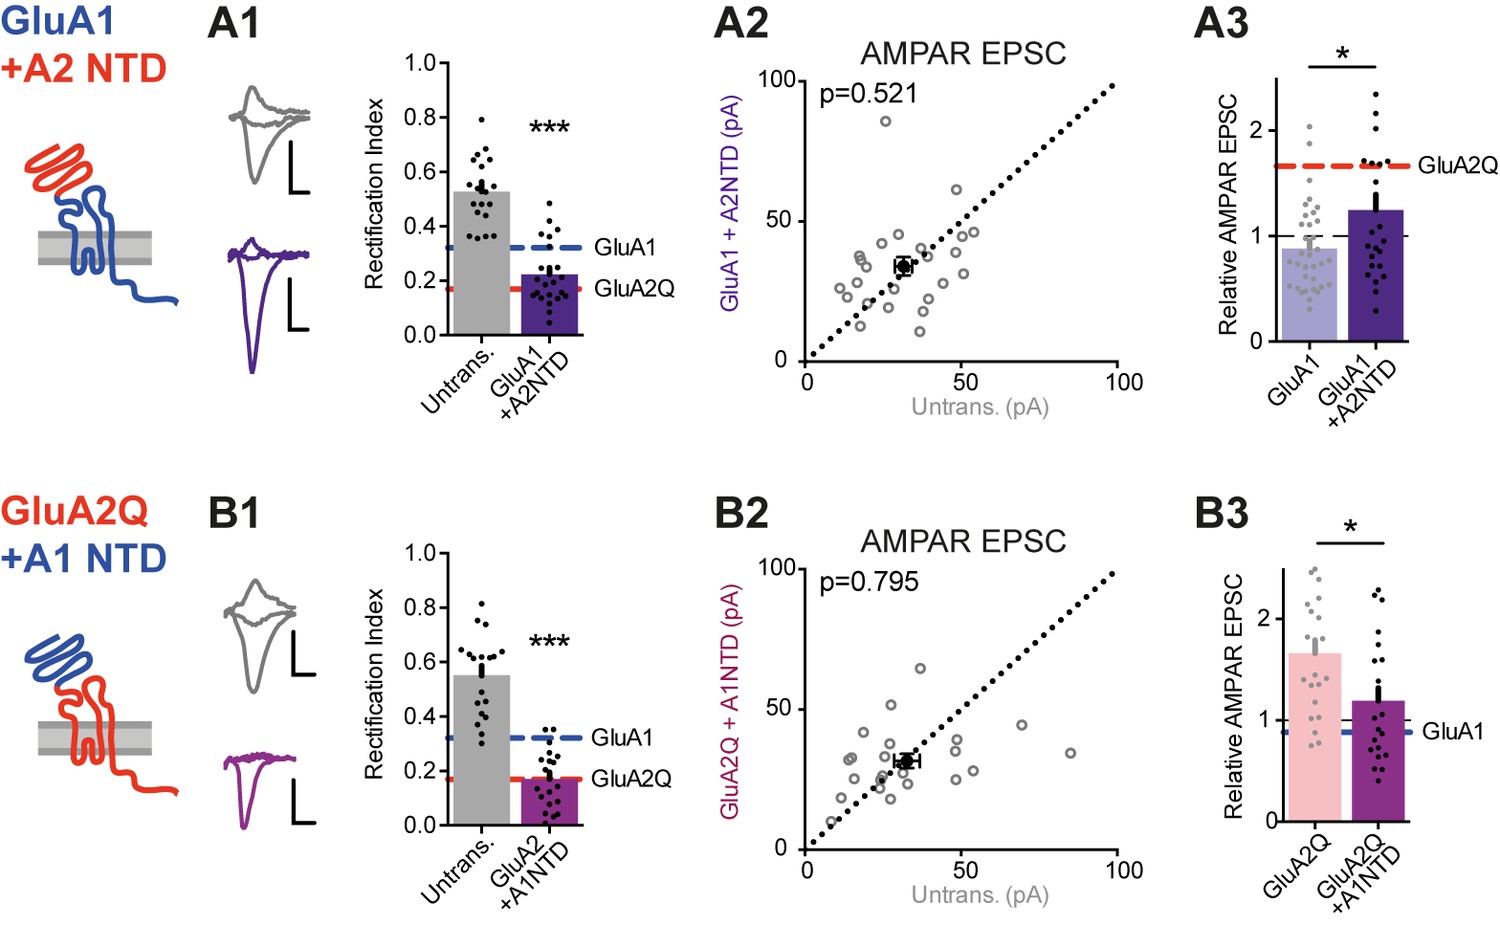
NTD-dependent synaptic anchoring is subunit-specific.
Synaptic EPSC properties of neurons expressing chimeric AMPAR constructs formed by exchanging NTD sequences (see construct schematics). (A1) Synaptic RI from pairs of untransfected cells and cells expressing GluA1 +A2NTD (untransfected: 0.56 ± 0.04; GluA1 +A2NTD: 0.22 ± 0.02; n = 23; paired t-test, p<0.0001), with example traces and construct schematic shown on the left. GluA1 and GluA2Q RI values are indicated for reference. Scale bars = 10 ms and 20 pA. (A2) Scatter plot of AMPAR EPSCs from pairs of untransfected and transfected cells expressing GluA1 +A2NTD (untrans.: 31.6 ± 2.7 pA; GluA1 +A2NTD: 34.0 ± 3.3 pA; n = 24; paired t-test, p=0.521). (A3) Bar chart of AMPAR EPSC amplitudes of transfected cells normalized to untransfected cells of paired recordings (GluA1: 0.88 ± 0.07 (n = 34); GluA1 +A2NTD: 1.25 ± 0.15 (n = 24); unpaired t-test, p=0.017). Value for GluA2Q is indicated by red line for reference. (B1) Synaptic RI from pairs of untransfected and GluA2Q +A1NTD-expressing cells (untransfected: 0.55 ± 0.03; GluA2Q +A1NTD: 0.17 ± 0.03; n = 19; paired t-test, p<0.0001), with example traces shown on the left. (B2) Scatter plot of AMPAR EPSCs from pairs of untransfected and GluA2Q +A1NTD (untrans.: 32.7 ± 4.1 pA; GluA2Q +A1NTD: 31.6 ± 2.6 pA; n = 22; paired t-test, p=0.795). (B3) Bar chart of AMPAR EPSCs amplitudes normalized to untransfected cell of paired recording (GluA2Q: 1.66 ± 0.13 (n = 22); GluA2Q +A1NTD: 1.19 ± 0.13 (n = 22); unpaired t-test, p=0.013). Value for GluA1 is indicated by blue line for reference.
Figure 7—figure supplement 1
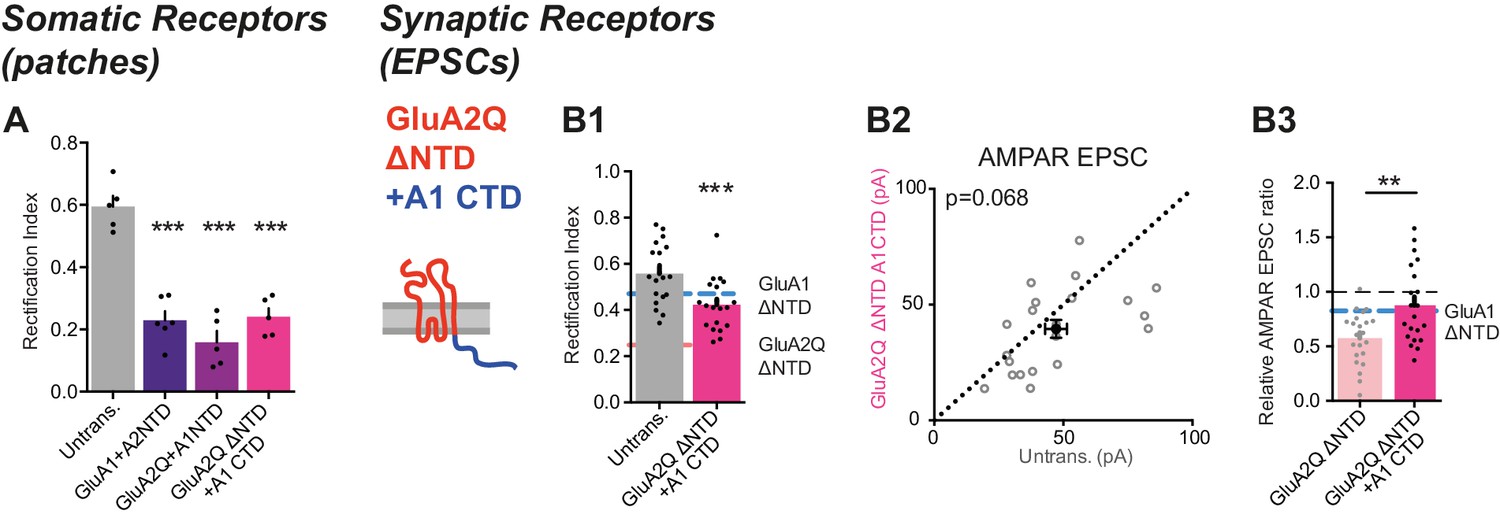
Investigation of GluA2Q ΔNTD + A1CTD.
(A) Average RI of surface currents for chimeric construct expression (untrans.: 0.60 ± 0.08 (n = 5); GluA1 +A2NTD: 0.23 ± 0.07 (n = 6); GluA2Q +A1NTD: 0.16 ± 0.08 (n = 5); GluA2Q ΔNTD + A1CTD; 0.24 ± 0.06 (n = 5); One-way ANOVA, p<0.0001). (B) Synaptic EPSC properties of cells expressing chimeric construct formed by exchange of GluA2Q ΔNTD’s C-terminal sequence with that of GluA1 (GluA2Q ΔNTD + A1CTD; see construct schematic). (B1) RI of synaptic AMPAR-mediated EPSCs from pairs of untransfected and transfected cells. GluA1 ΔNTD and GluA2Q ΔNTD RIs are shown as lines for reference (untrans.: 0.57 ± 0.03; GluA2Q ΔNTD + A1CTD: 0.42 ± 0.02; n = 20; paired t-test, p=0.0002). (B2) Scatter plot of AMPAR EPSCs from above cells showing no change in amplitude (untrans.: 47.2 ± 4.3 pA; GluA2Q ΔNTD + A1CTD: 39.5 ± 3.9 pA; n = 21; paired t-test, p=0.068). (B3) AMPAR EPSCs normalized to untransfected cell of pair for GluA2Q ΔNTD and GluA2Q ΔNTD + A1CTD expressing cells showing loss of AMPAR EPSC depression by GluA2Q ΔNTD on CTD exchange (GluA2Q ΔNTD: 0.57 ± 0.05 (n = 22); GluA2Q ΔNTD + A1CTD: 0.88 ± 0.08 (n = 21); unpaired t-test, p=0.002). GluA1 ΔNTD value is shown as a line for reference.
Figure 8 with 2 supplements
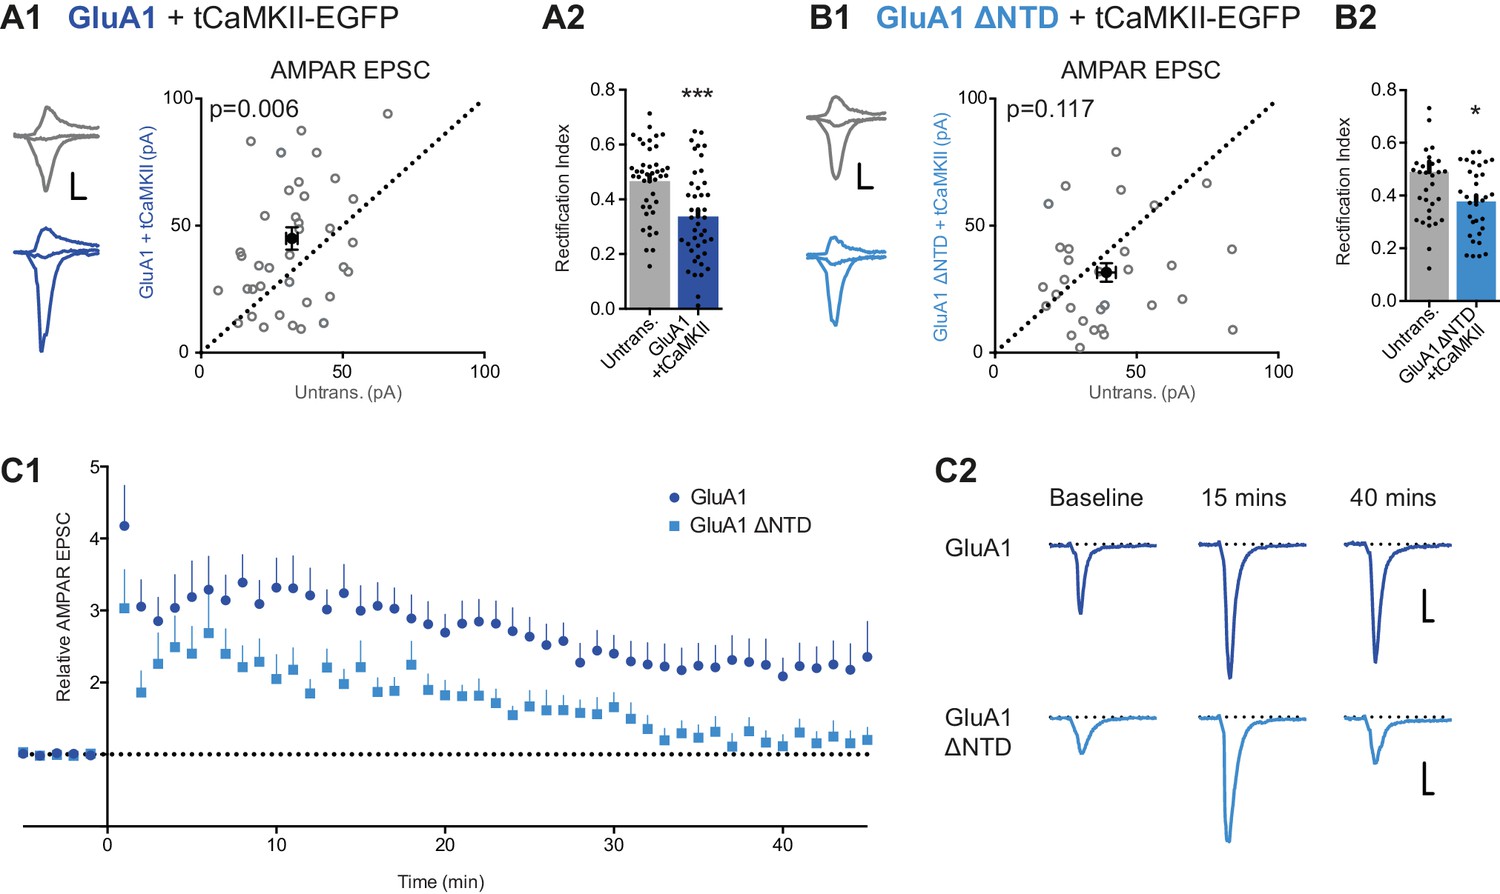
LTP is impaired without the NTD of GluA1.
(A1) Co-expression of GluA1 and tCaMKII increases AMPAR EPSC amplitude (untransfected: 32.1 ± 2.0 pA; GluA1+tCaMKII: 44.9 ± 4.4 pA; n = 42; paired t-test, p=0.006). Scale bar = 10 ms and 20 pA. (A2) RI from above cells (untransfected: 0.47 ± 0.02; GluA1 + tCaMKII: 0.34 ± 0.03; n = 42; paired t-test, p=0.0003). (B1) Potentiation mediated by tCaMKII is impaired in GluA1 ΔNTD expressing cells (untransfected: 39.3 ± 3.3 pA; GluA1 ΔNTD + tCaMKII: 31.6 ± 3.7 pA; n = 32; paired t-test, p=0.117). Scale bar = 10 ms and 20 pA. (B2) RI from above cells (untransfected: 0.49 ± 0.04; GluA1 ΔNTD + tCaMKII: 0.38 ± 0.02; n = 33; paired t-test, p=0.019). (C1) AMPAR EPSC amplitudes from cells expressing GluA1 or GluA1 ΔNTD over time, averaged in one-minute bins. At time = 0 LTP was induced using a pairing protocol (2 Hz, 100 s at −10 mV holding potential). EPSC amplitudes are normalized to pre-induction amplitude. LTP is maintained past 35 min in cells expressing GluA1, but not GluA1 ΔNTD. Normalized amplitude at 45 mins: GluA1: 2.35 ± 0.49 (n = 16); GluA1 ΔNTD: 1.20 ± 0.17 (n = 14). (C2) Representative AMPAR EPSC traces from cells expressing GluA1 or GluA1 ΔNTD. Traces show EPSCs before induction (baseline) and 15 and 40 min after induction. Scale bar = 10 ms and 20 pA.
Figure 8—figure supplement 1
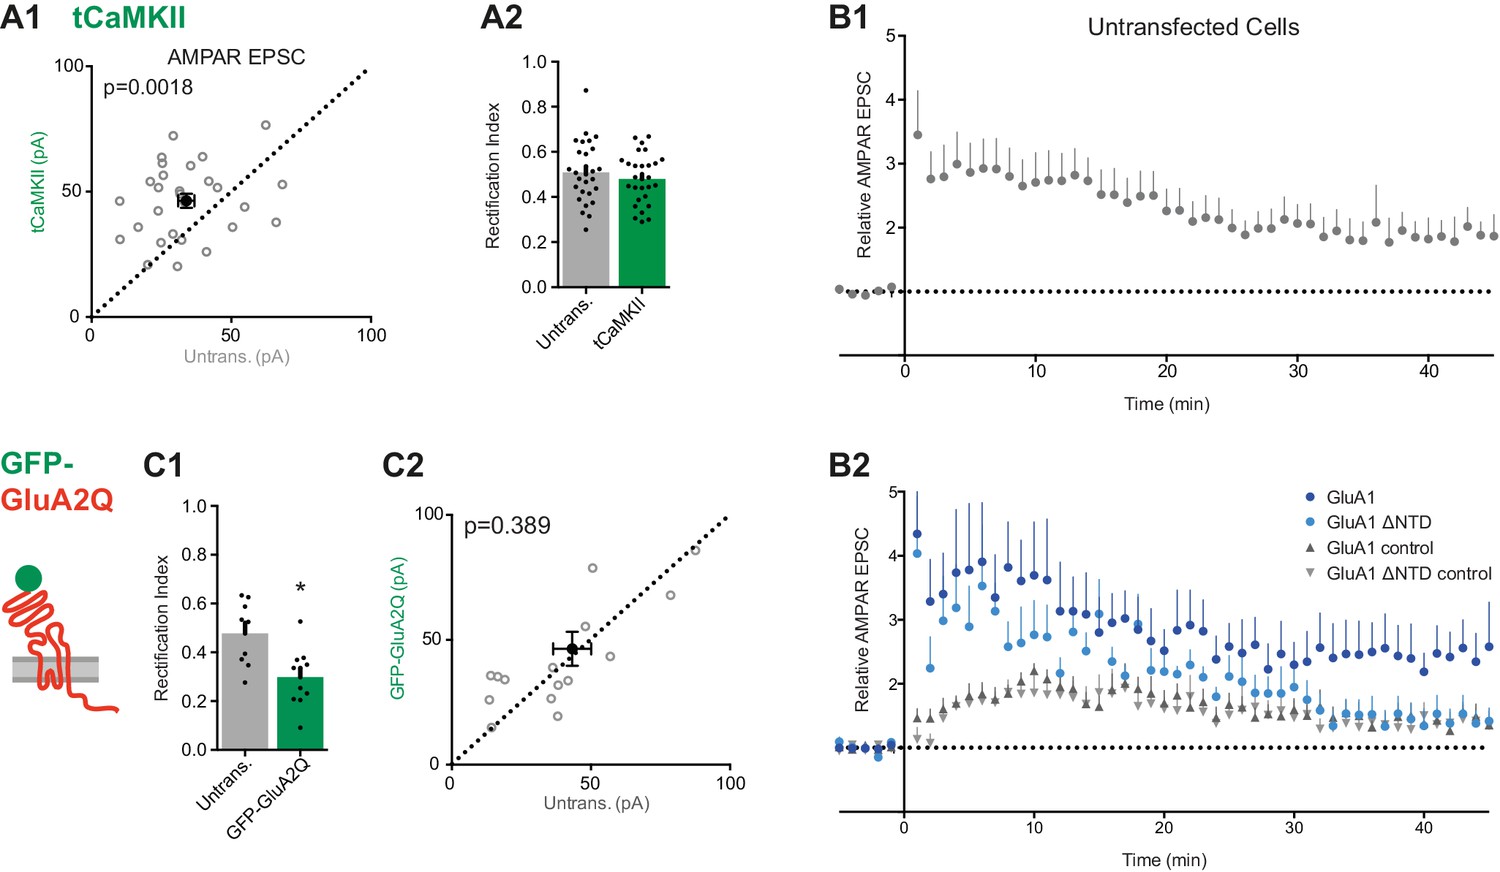
Synaptic potentiation using tCaMKII and an electrical pairing protocol.
(A1) Scatter plot of AMPAR EPSCs from tCaMKII-EGFP and untransfected cells showing successful potentiation (untrans.: 33.9 ± 2.9 pA, tCaMKII: 46.4 ± 2.8 pA; n = 28; paired t-test, p=0.0018). (A2) RI is unchanged on tCaMKII expression (untrans.: 0.51 ± 0.03, tCaMKII: 0.48 ± 0.02; n = 28; paired t-test, p=0.369). (B1) Average AMPAR EPSC amplitudes over time normalized to pre-LTP amplitudes (with LTP induced at t = 0) from untransfected cells shows potentiation at 45 mins post induction (1.87 ± 0.34, n = 9). (B2) AMPAR EPSCs from a subset of GluA1 and GluA1 ΔNTD-expressing cells (see Figure 8C1). Control pathways from both conditions remained comparable and stable over recording duration. Only test pathway of GluA1 remained potentiated at 45 mins (GluA1: n = 7; GluA1 ΔNTD: n = 10). (C1) Construct schematic and RI of GFP-GluA2Q expression (untrans.: 0.477; GFP-GluA2Q: 0.298; n = 9; paired t-test, p=0.264). (C2) Scatter plot of AMPAR EPSCs from GFP-GluA2Q-expressing and untransfected cells showing no change in amplitude (untrans.: 43.3 pA; GFP-GluA2Q: 46.4 pA; n = 16; paired t-test, p=0.389).
Figure 8—figure supplement 2
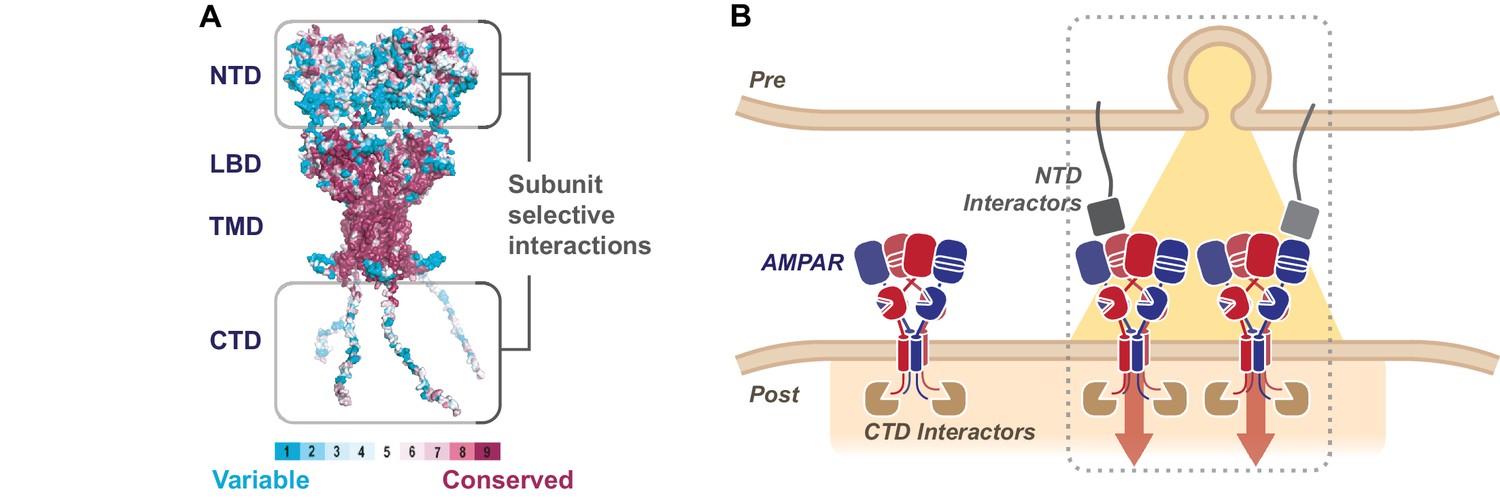
The sequence diversity of the AMPAR NTD mediates subunit-selective synaptic anchoring.
(A) AMPAR structural model colored by sequence conservation across AMPAR paralogs and orthologs highlighting the potential of the NTD and CTD for subunit specific interactions (Ashkenazy et al., 2016), while the channel core (LBD and TMD) is highly conserved. (B) A hypothetical model of synaptic AMPAR anchoring, whereby CTD interactors (brown) facilitate postsynaptic localization, however stabilization of the receptor to engage in functional transmission requires N-terminal interactions, with factors yet to be identified (grey) (Post = postsynapse, Pre = presynapse).
Author response image 1
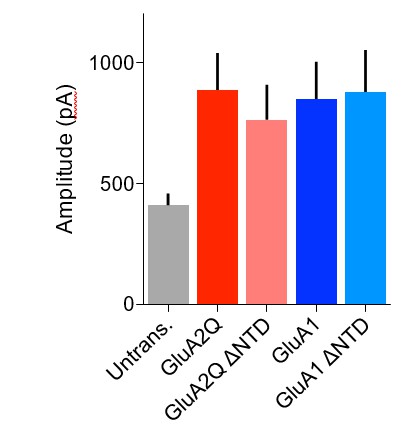
Amplitude of glutamate-evoked AMPAR currents from outside-out patches of untransfected and AMPAR construct transfected CA1 pyramidal neurons.
Amplitude of currents is similar between all transfected cells and appears to be double that of untransfected cells.
Author response image 2
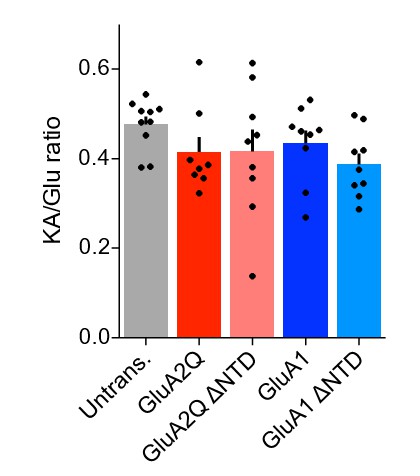
KA/Glu ratio of AMPAR currents from outside-out patches is unchanged on overexpression of exogenous AMPAR constructs.
https://doi.org/10.7554/eLife.23024.018Download links
A two-part list of links to download the article, or parts of the article, in various formats.
Downloads (link to download the article as PDF)
Open citations (links to open the citations from this article in various online reference manager services)
Cite this article (links to download the citations from this article in formats compatible with various reference manager tools)
Synaptic transmission and plasticity require AMPA receptor anchoring via its N-terminal domain
eLife 6:e23024.
https://doi.org/10.7554/eLife.23024


