Identification of octopaminergic neurons that modulate sleep suppression by male sex drive
- Thomas Jefferson University, United States
- School of Medicine, University of Minho, Portugal
- ICVS/3B's - PT Government Associate Laboratory, Portugal
- Perelman School of Medicine at the University of Pennsylvania, United States
Figures
Figure 1 with 1 supplement
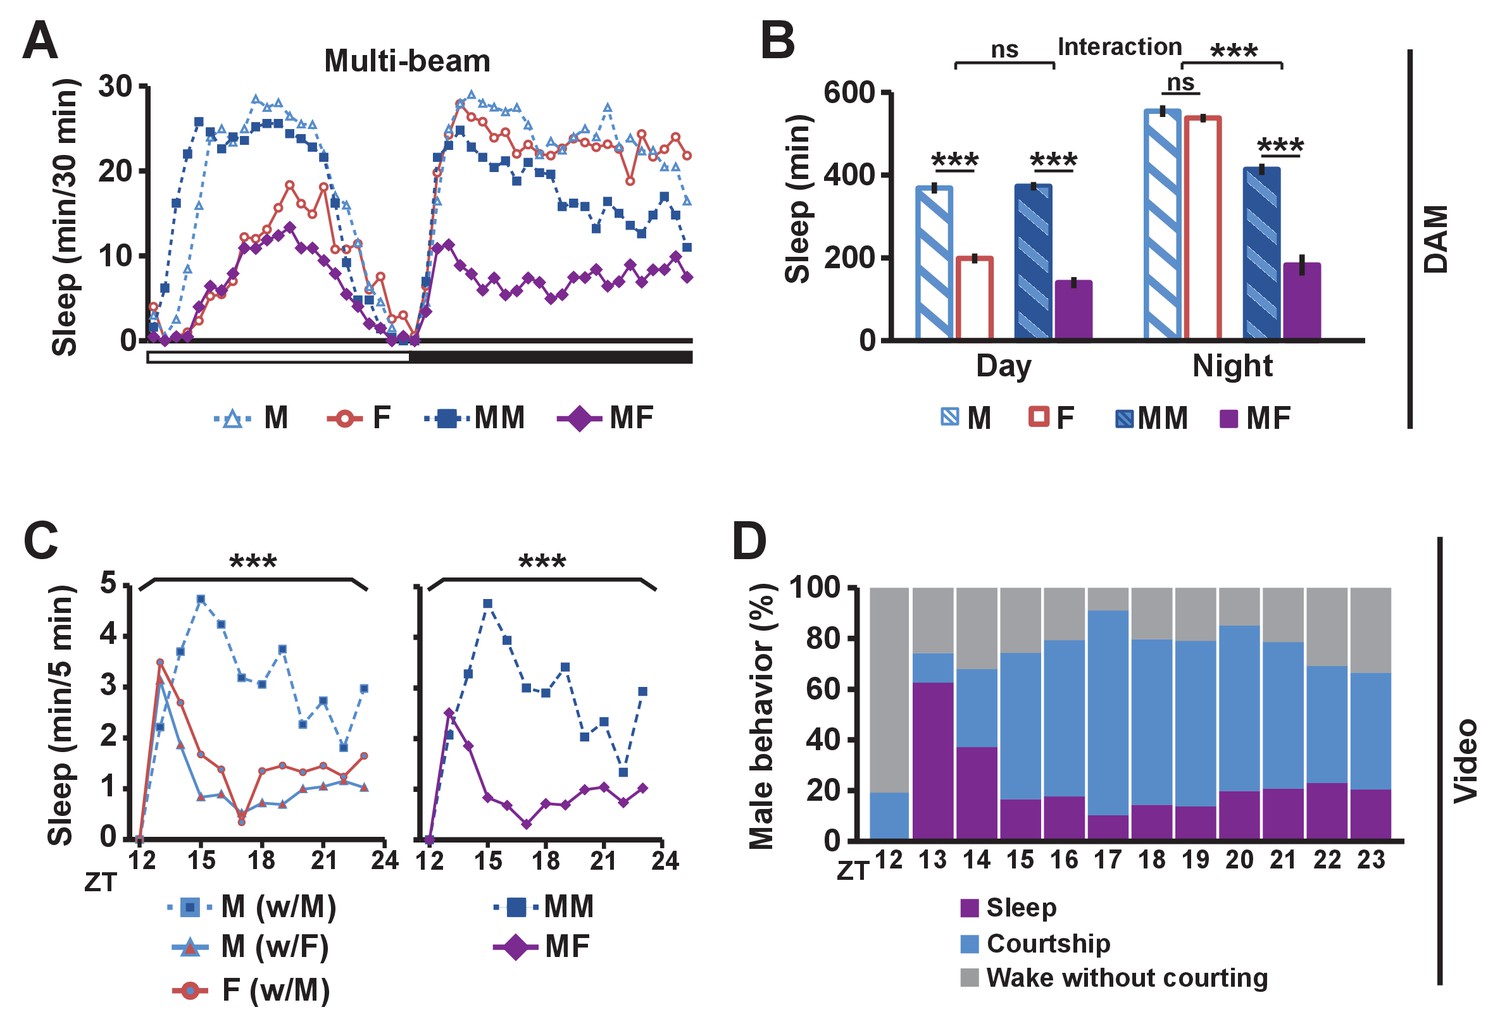
Balance between sleep drive and sex drive determines male sleep levels.
(A) Sleep profile in 30 min intervals for wild-type (iso31) flies in isolation (M for male, F for female) or in pairs (MM for male-male, MF for male-female) using multi-beam monitors. Corresponding data using single-beam monitors are shown in Figure 1—figure supplement 1. In all figures, the white and black bars below the x-axis indicate light and dark periods, respectively. N = 29–44. (B) Daytime and nighttime sleep amount of flies shown in (A). (C) Nighttime sleep profile in 5 min bins each hour for wild-type (iso31) flies from video analysis. Sleep amount was manually scored for the first 5 min of each hour for individual males (M w/ F) or females (F w/ M) in MF pairs or individual males in MM pairs (M w/ M). Collective sleep amount of MM and MF pairs, i.e., when both flies were asleep, is presented on the right. N = 15–24. (D) Percentage of three types of male behavior, i.e., sleep, courtship, and wake but not courtship, during the 5 min bins shown in (C). In all figures, error bars represent SEM; *p<0.05; **p<0.01; ***p<0.001; ns = not significant. Two-way ANOVA (B) or one-way ANOVA (C) followed by Tukey post hoc test. Significance of the interaction between the two factors (single vs pair and presence vs absence of a female) is indicated in (B). Sleep amounts obtained for 5 min intervals were summed for ANOVA in (C) and significant differences between conditions are indicated above the brackets. Sleep amount was not significantly different between individual males and females in MF pairs (M w/ F vs F w/ M).
Figure 1—figure supplement 1
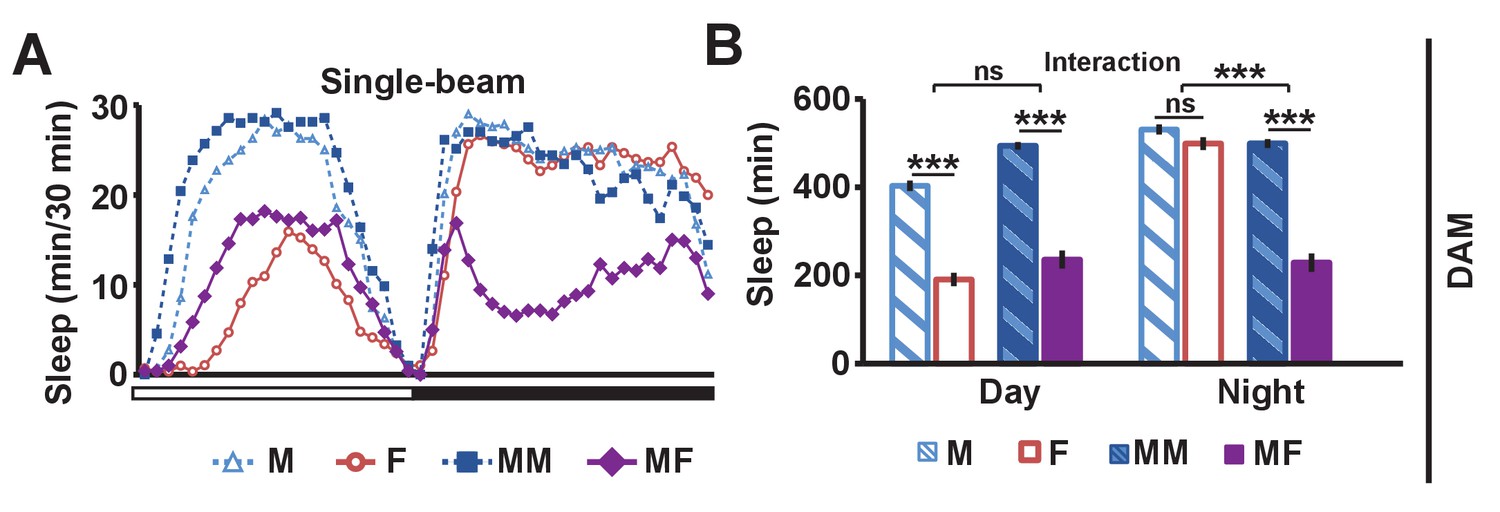
Single-beam DAM data demonstrating reduced male sleep in the presence of females.
(A) Sleep profile in 30 min intervals for wild-type (iso31) flies in isolation (M, F) or in pairs (MM, MF). N = 45–52. (B) Daytime and nighttime sleep amount for flies shown in (A). Two-way ANOVA followed by Tukey post hoc test (B). Significance of the interaction between the two factors (single vs pair and presence vs absence of a female) is indicated.
Figure 2 with 2 supplements
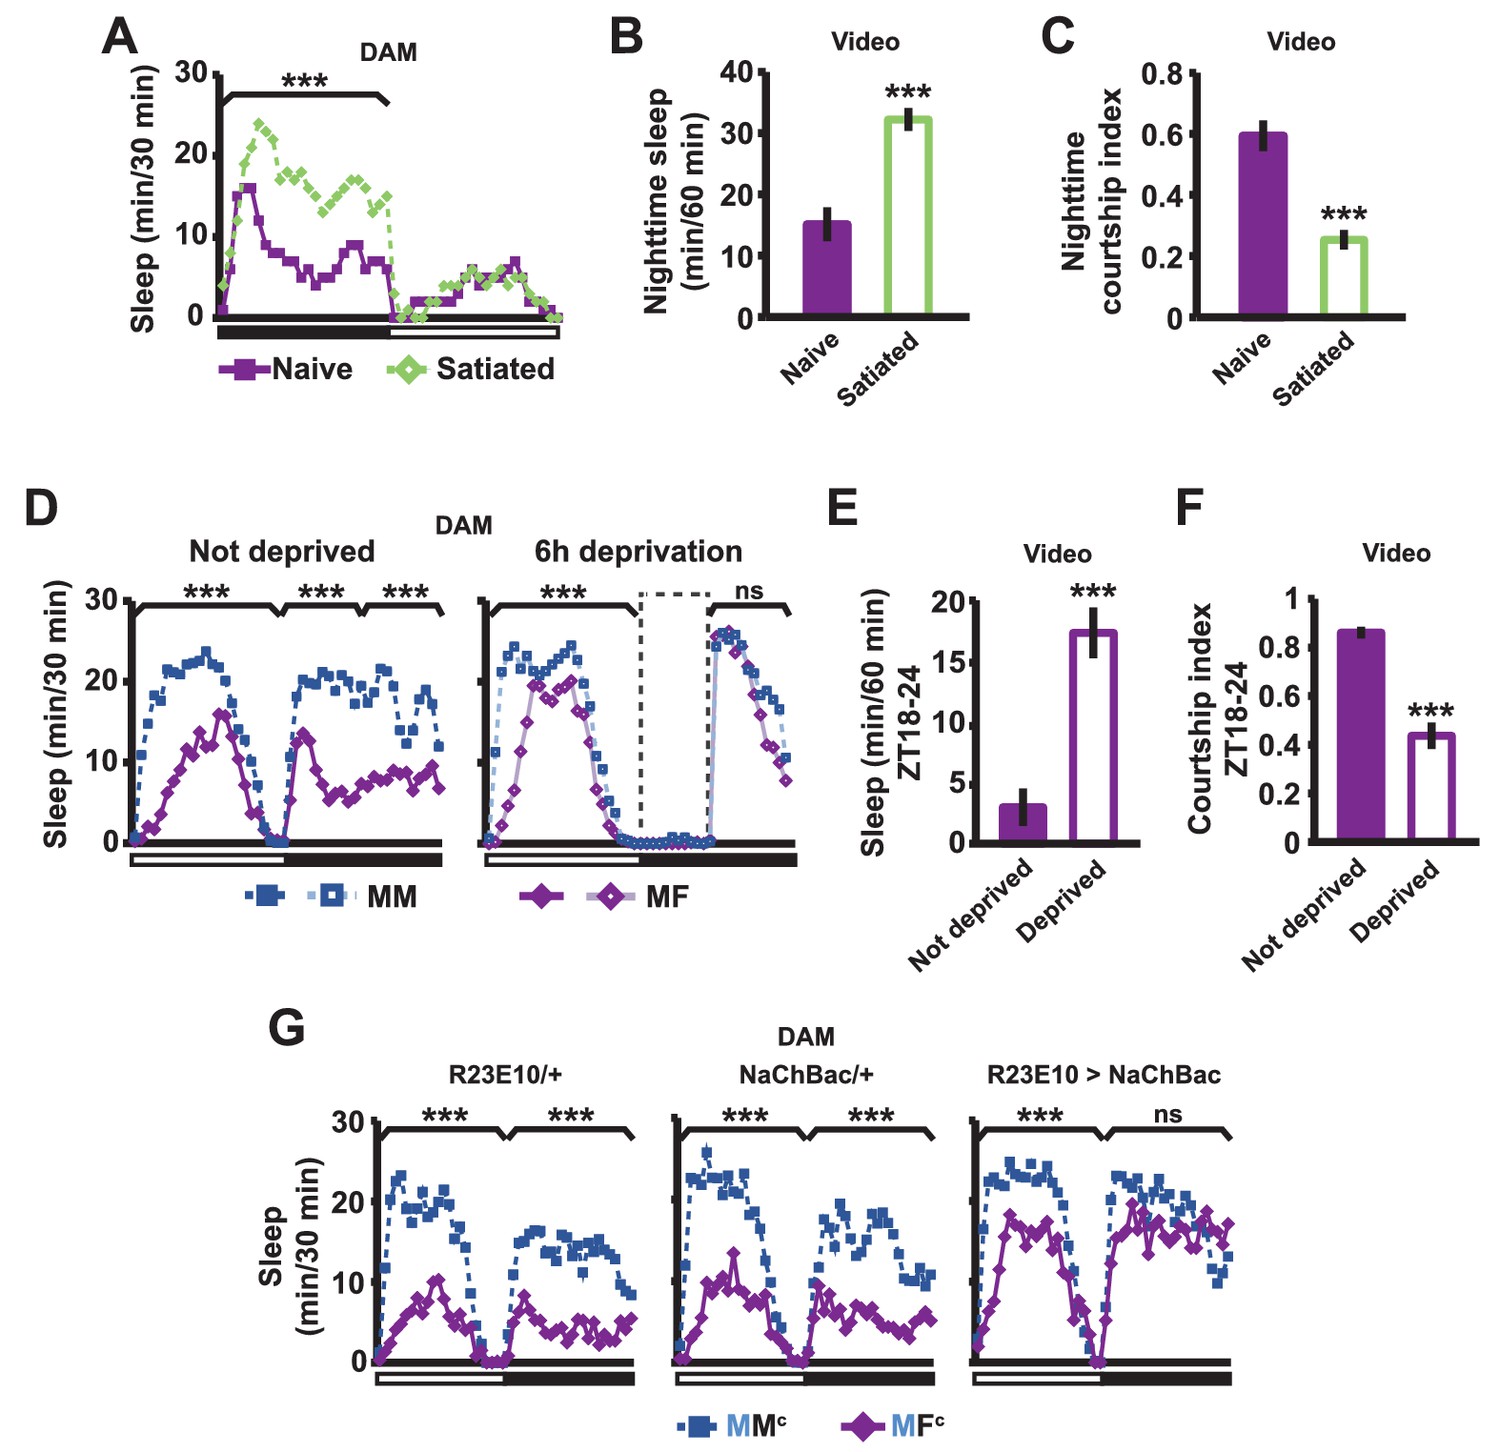
Sexual satiety and sleep deprivation attenuate female-induced sleep loss in males.
(A) Sleep profile of wild-type (iso31) MF pairs including satiated or non-satiated (naive) males assayed using single-beam monitors. N = 31–33. (B–C) Sleep amount (B) and courtship index (C) of males in MF pairs from video analysis of the first 5 min every nighttime hour. N = 38–40. (D) Sleep profile of wild-type (iso31) MM or MF pairs without sleep deprivation or with 6 hr sleep deprivation in the early night measured using single-beam monitors. Dotted rectangles indicate the period of sleep deprivation by mechanical stimulation. N = 38–42. (E–F) Sleep amount (E) and courtship index (F) of males in MF pairs without sleep deprivation or with 6 hr sleep deprivation in the early night. Sleep during the first 5 min every 30 min during 6 hr after sleep deprivation (ZT18 – ZT24) was scored from videos. N = 40–48. (G) Sleep profile of ‘experimental’ (R23E10>NaChBac, R23E10/+, or NaChBac/+) males, paired with iso31 control females (MFc) or control males (MMc) measured using multi-beam monitors. N = 28–30. Student’s t test (A–G) with Bonferroni correction (A, D, G). For statistical analysis, sleep amounts were summed and courtship index averaged over the periods indicated by the brackets above the sleep profiles or as noted on the y-axis of the bar graphs. For simplicity, in all figures involving comparison of a genotype against two parental controls, significant differences are indicated only if the experimental group differed significantly from both control groups in the same direction.
Figure 2—figure supplement 1
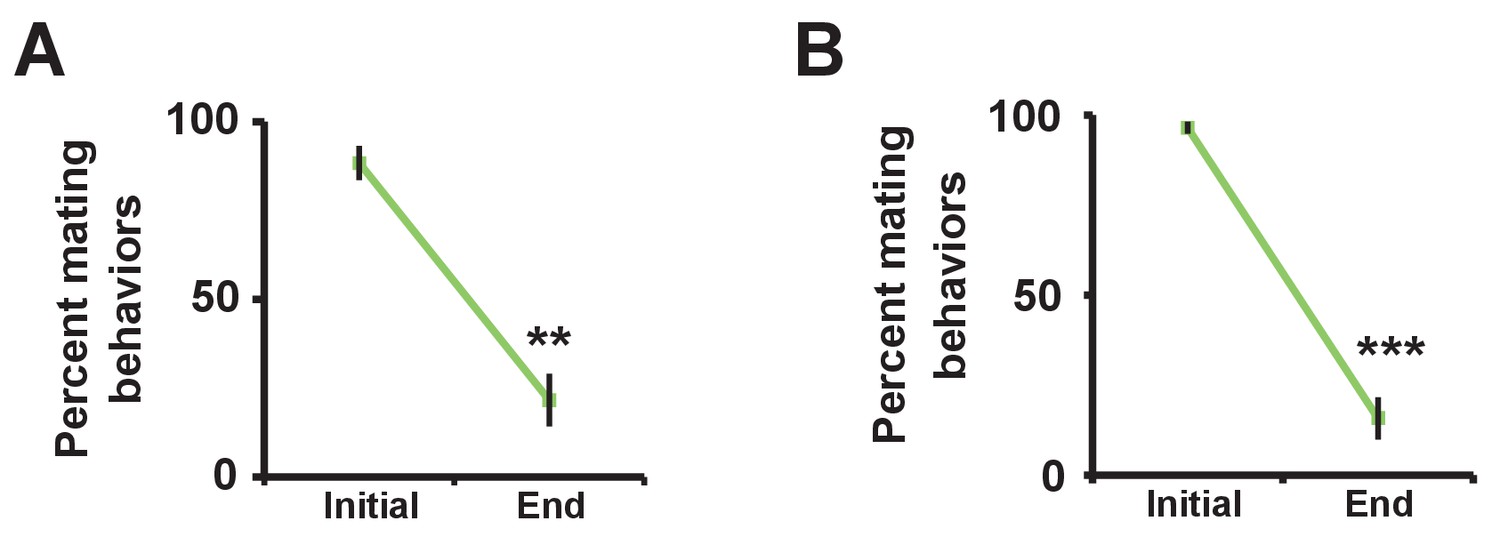
Successful manipulation of sexual satiety in male flies.
(A) Percent of satiated males shown in Figure 2A exhibiting mating (courtship or copulation) behavior. Mating behavior was examined twice during the first hour (initial) and twice during the last hour (end) in 4.5 hr or 5.5 hr assays. N = 5 groups of 6–7 males. (B) Percent of satiated males shown in Figure 2B exhibiting courtship or copulation behavior. N = 7 groups of 6 males. Student’s paired t test (A, B).
Figure 2—figure supplement 2
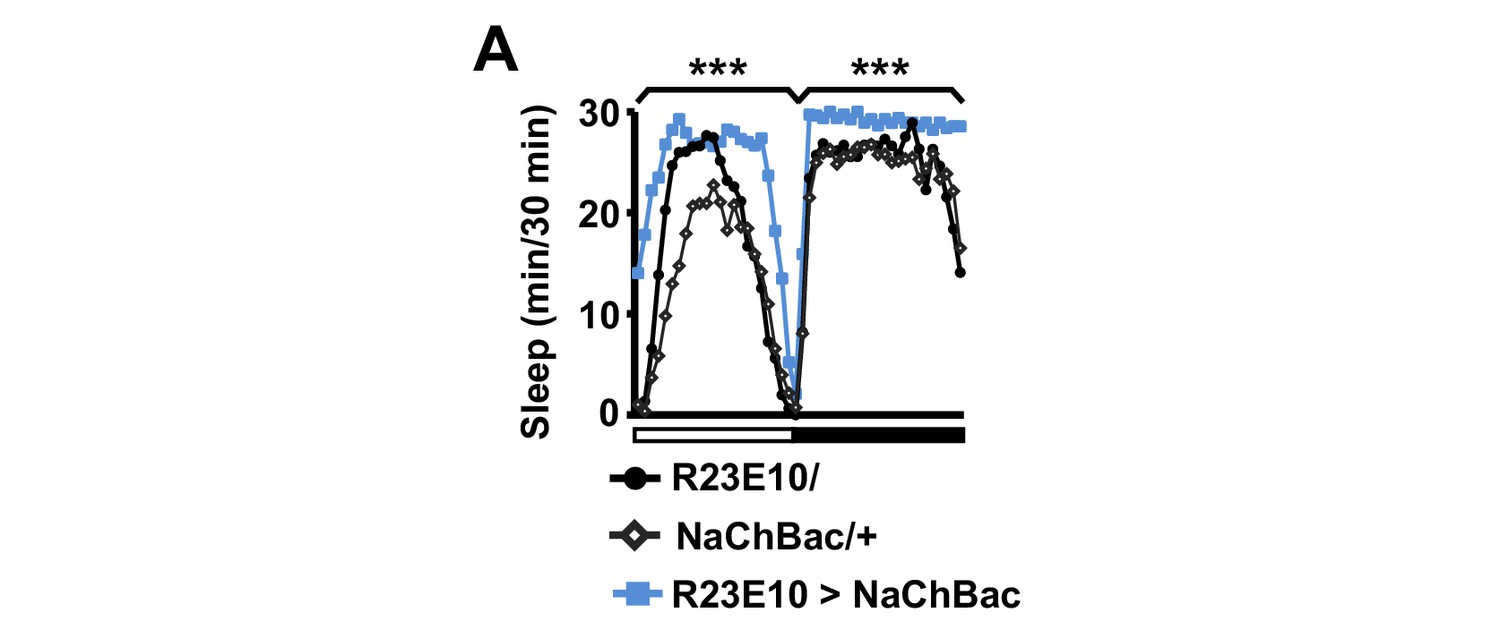
Activation of dFSB induces sleep in isolated males.
Sleep profile of R23E10>NaChBac and parental control (R23E10/+ or NaChBac/+) males in isolation. N = 40–57. Daytime and nighttime sleep amounts were summed for one-way ANOVA followed by Dunnett post hoc test relative to both parental controls.
Figure 3
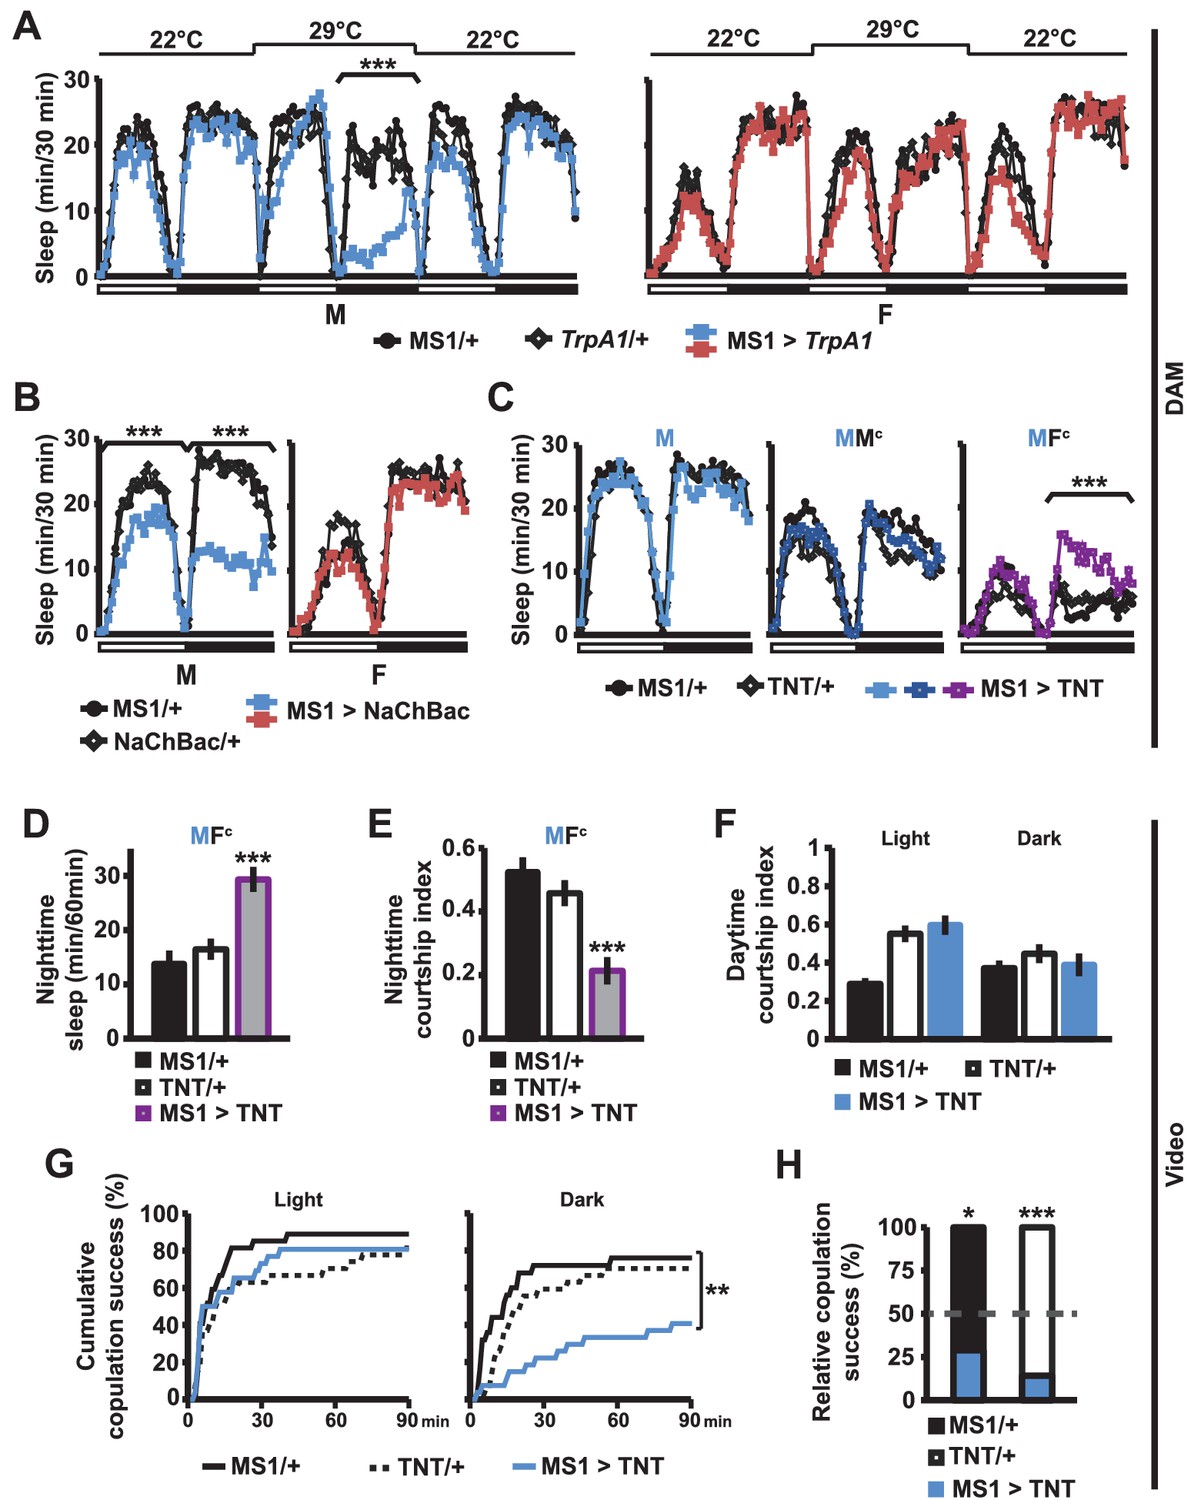
MS1 neuronal activity regulates sleep and mating behavior in males.
(A) Sleep profile of male (left) and female (right) flies expressing the warmth-activated TrpA1 channel in MS1 neurons (MS1>TrpA1) and control flies (MS1/+ and TrpA1/+). TrpA1 was activated by temperature shift from 22°C to 29°C. N = 32–40. (B) Sleep profile of flies expressing the NaChBac bacterial sodium channel in MS1 neurons and parental controls. N = 30–36. (C) Sleep profile of males expressing tetanus toxin in MS1 neurons (MS1>TNT) and parental controls (MS1/+ and TNT/+) in isolation (M) or paired with iso31 control males (MMc) or females (MFc) in multi-beam monitors. N = 37–49. (D–E) Sleep amount (D) and courtship index (E) of males with silenced MS1 neurons (MS1>TNT) and parental controls paired with control females. Videos were manually scored for sleep and courtship index during the first 5 min bins every hour at night and values summed (D) or averaged (E) for statistical analysis. N = 26–27. (F–G) courtship index (F), and cumulative copulation success (G) over 90 min mating assays. Males with silenced MS1 neurons (MS1>TNT) and parental controls were assayed in dim white light (left) or infrared light (right). N = 23–26. (H) Percentage of successful copulation by males with silenced MS1 neurons (MS1>TNT) against MS1/+ or TNT/+ controls in 90 min competitive copulation assays under dim red light. N = 29–34. One-way ANOVA followed by Dunnett post hoc test relative to both parental controls (A–F); log rank test (G); binomial test relative to 50% (H).
Figure 4
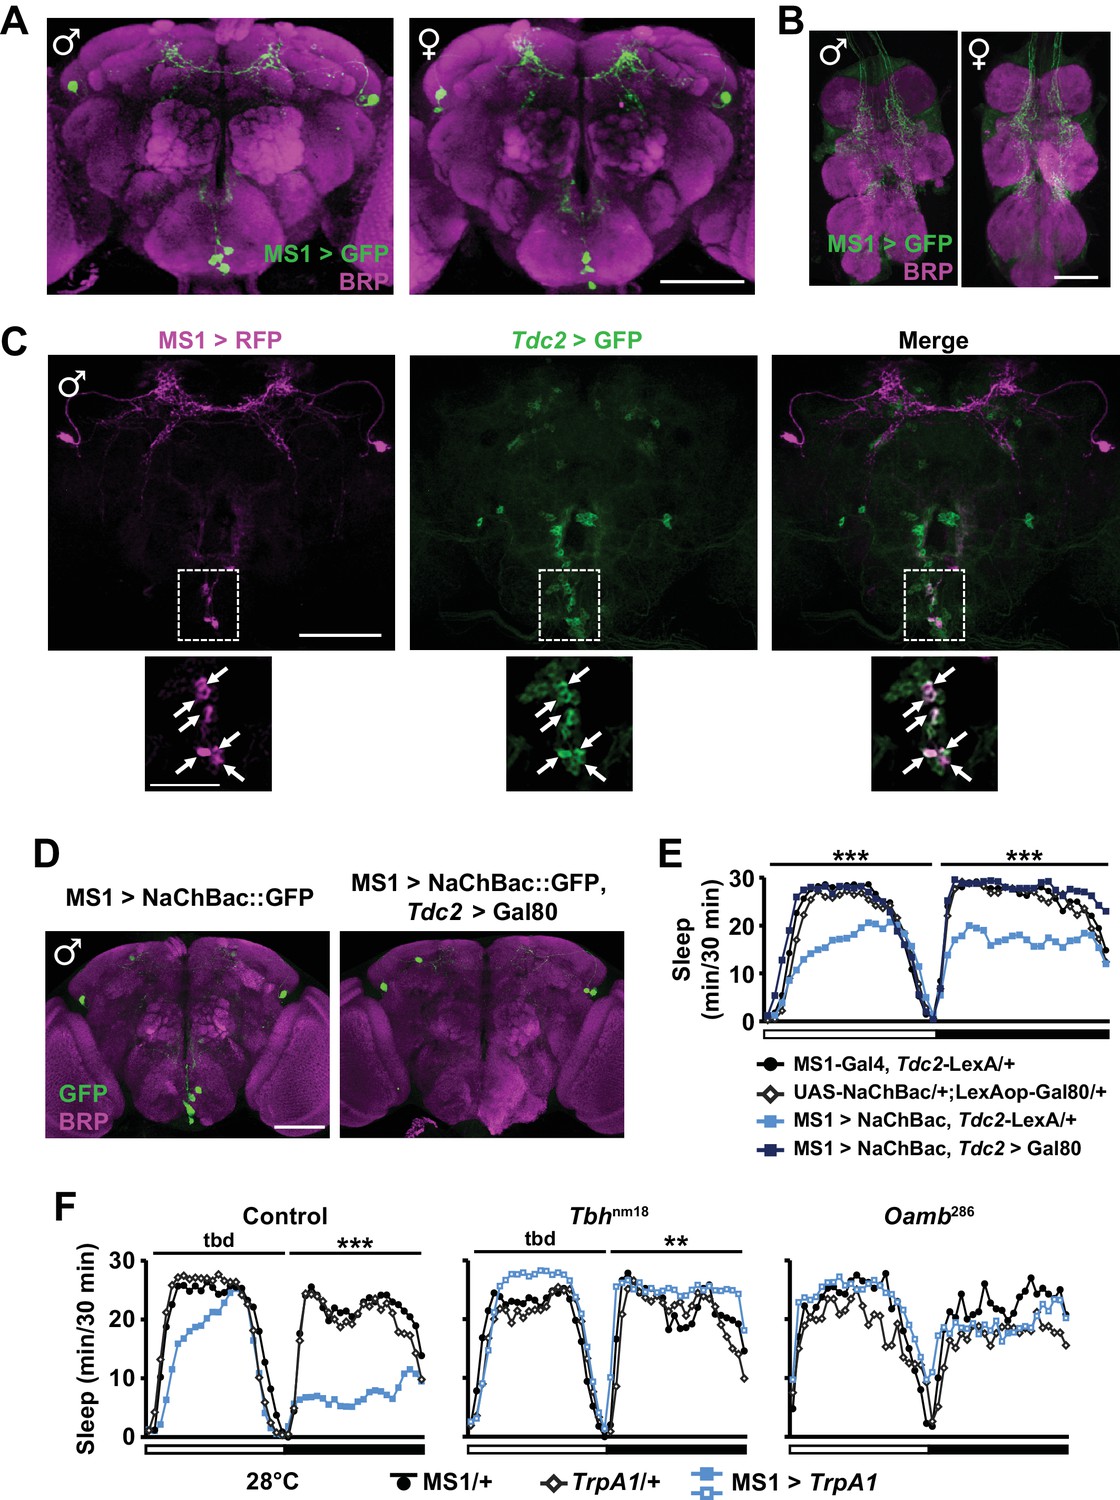
MS1 neurons in the SOG are octopaminergic.
(A) Confocal projection of a whole-mounted MS1> CD8::GFP male (left) or female (right) adult central brain. Antibodies against GFP (green) and Bruchpilot (BRP, magenta) were used for immunostaining. Scale bar: 100 µm. (B) Confocal projection of the ventral nerve cord of a male or female expressing CD8::GFP under the control of MS1-Gal4. Scale bar: 50 µm. (C) Top: confocal projection of a male central brain expressing RFP (magenta) in MS1 neurons (using Gal4-UAS) and GFP (green) in Tdc2 neurons (using LexA-LexAOp). Scale bar: 100 µm. Bottom: Magnified view of the SOG region indicated by the rectangle in the corresponding image in the top row. Arrows point to neurons co-expressing MS1>RFP and Tdc2>GFP. Scale bar: 50 µm. (D) Expression of NaChBac::GFP in all MS1 neurons (left, MS1-Gal4, Tdc2-LexA/UAS-NaChBac) and in the non-octopaminergic subset (right, MS1-Gal4, Tdc2-LexA/UAS-NaChBac; LexAop-Gal80). Expression of Gal80, a suppressor of Gal4, in TDC2 neurons removed NaChBac::GFP expression specifically in the SOG. Scale bar: 100 µm. (E) Sleep profile of male flies of the indicated genotypes. N = 75–78. (F) Sleep profile of males in which MS1 neurons were activated with TrpA1 expression at 28°C in an iso31 control (left), Tbhnm18 mutant (middle), or Oamb286 mutant (right) background. N = 20–165. One-way ANOVA followed by Dunnett post hoc test relative to MS1>NaChBac, Tdc2-LexA/+ flies (E) or both parental controls (F).
Figure 5 with 1 supplement
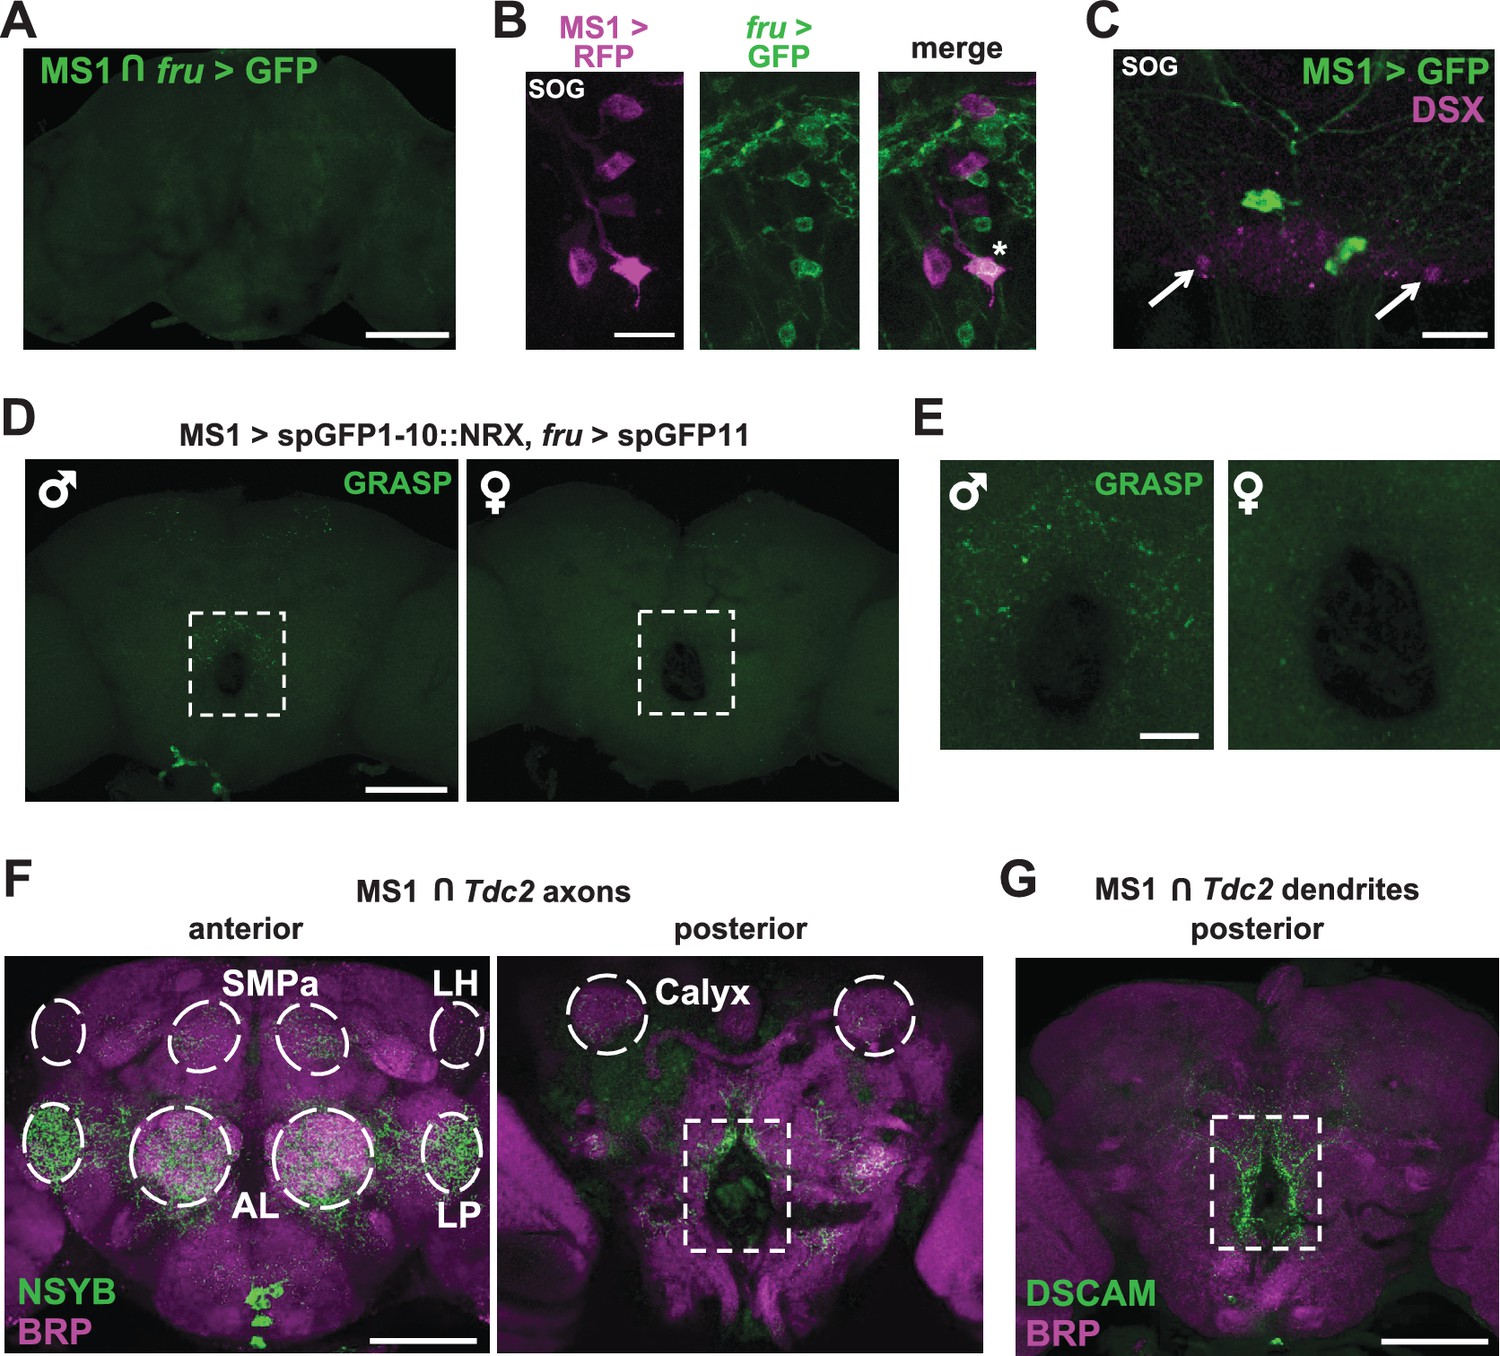
MS1 neurons appear to form synaptic contacts with FRU neurons.
(A) Confocal projection of a male brain expressing CD8::GFP in the intersection between MS1-Gal4 and fru-FLP (MS1-Gal4/UAS-FRT-stop-FRT-CD8::GFP; FRU-FLP/+). Scale bar: 100 µm. (B) Confocal projection of the SOG region of a male brain expressing RFP (magenta) in MS1 neurons (MS1-Gal4 > UAS-mCD8::RFP) and GFP (green) in FRU neurons (fru-LexA > LexAOp-CD8::GFP). *The single MS1 neuron and two FRU neurons are at different focal planes. Scale bar: 25 µm. (C) Confocal projection of the SOG region of a male brain expressing CD8::GFP under the control of MS1-Gal4. The brain was co-stained using antibodies against GFP and DSX. Arrows point to DSX positive neurons. Scale bar: 25 µm. (D) Confocal projection of a male (left) or female (right) brain expressing spGFP1-10::NRX driven by MS1-Gal4 and spGFP11::CD4 driven by fru-LexA. Reconstituted GFP fluorescence was detected without antibody staining. Scale bar: 100 µm. A negative control image is presented in Figure 5—figure supplement 1B. (E) Magnified view of the region indicated by the rectangle in (D). Scale bar: 25 µm. (F) Confocal projections of male brains expressing the pre-synaptic marker NSYB in the octopaminergic subset of MS1 neurons (MS1-Gal4 > UAS-FRT-stop-FRT-nSyb, Tdc2-LexA > LexAop-FLP). Axon terminals are visible in antennal lobes (AL), lateral protocerebrum (LP), lateral horn (LH), anterior superior medial protocerebrum (SMPa), mushroom body calyx (Calyx), and the region surrounding the esophagus (indicated by the rectangle). Scale bar: 100 µm. (G) Posterior view of a male brain expressing the post-synaptic marker DSCAM in the octopaminergic subset of MS1 neurons (MS1-Gal4 > UAS-FRT-stop-FRT-Dscam, Tdc2-LexA > LexAop-FLP). DSCAM expression is highly enriched around the esophagus (indicated by the rectangle). Scale bar: 100 µm.
Figure 5—figure supplement 1
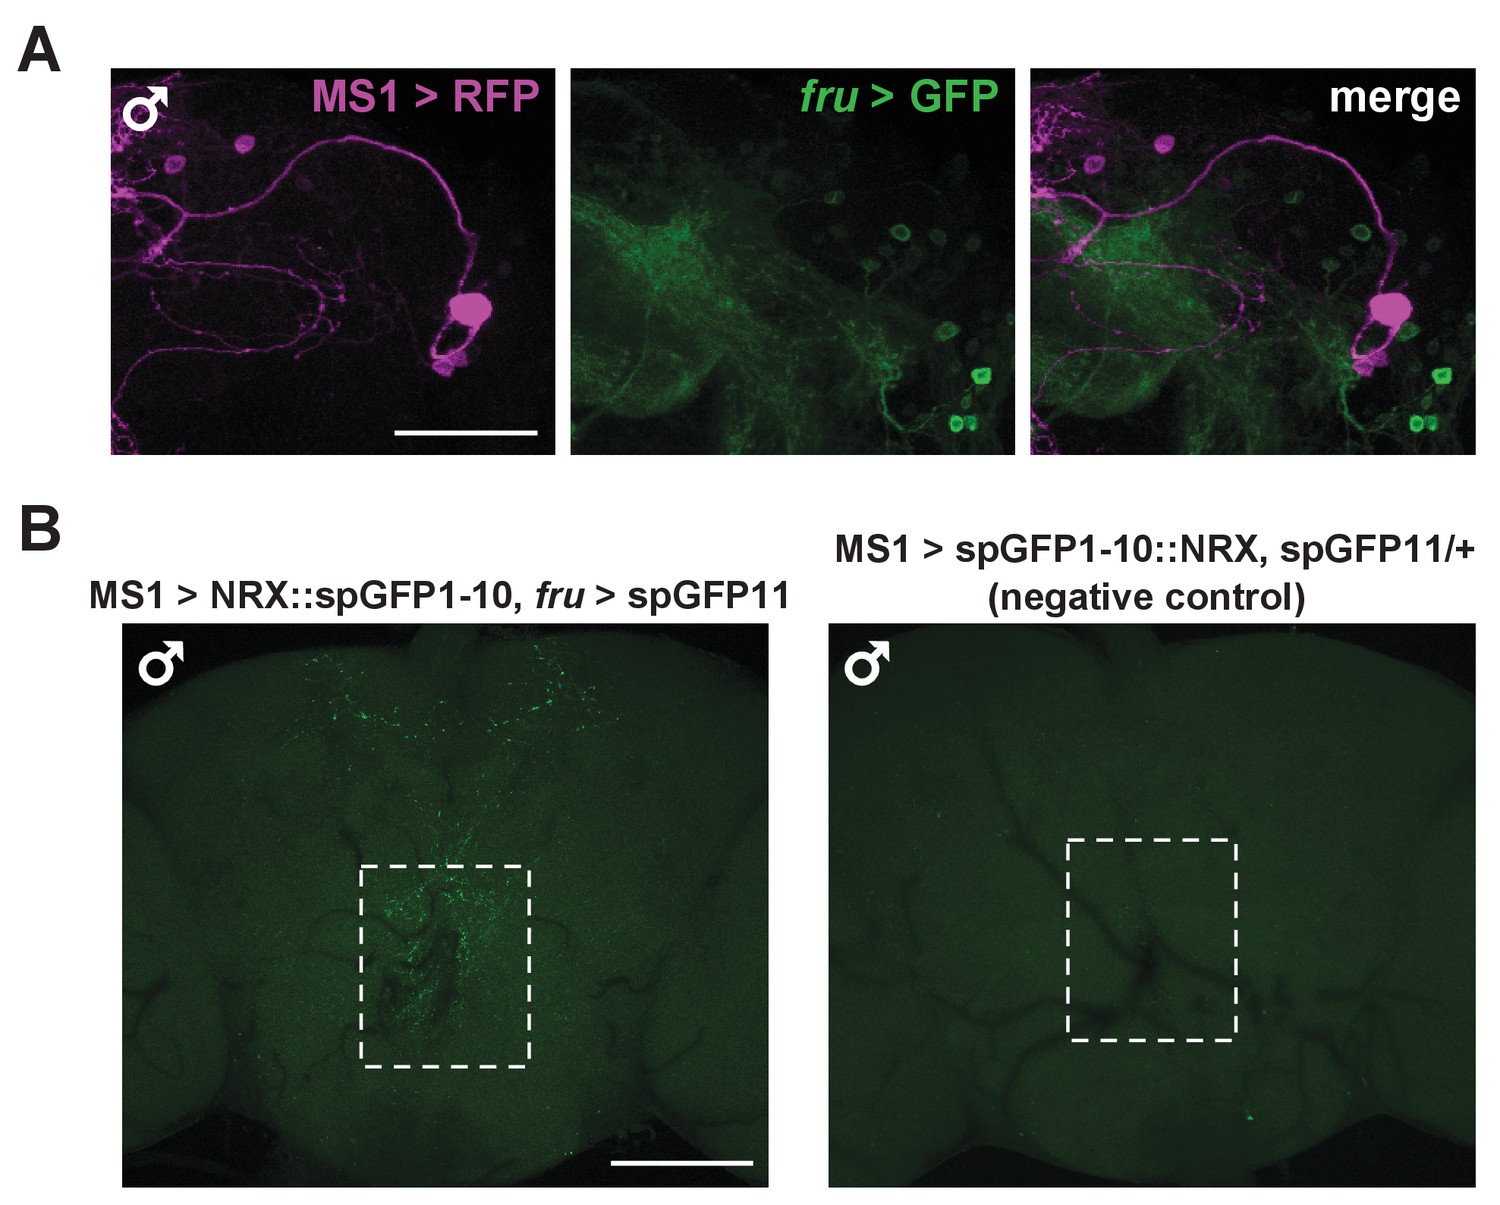
MS1 neurons do not express FRU but likely form synaptic contacts with FRU neurons.
(A) Confocal projection of the lateral protocerebrum of a male brain expressing RFP (magenta) in MS1 neurons (MS1-Gal4 > UAS-CD8::RFP) and GFP (green) in FRU neurons (fru-LexA > LexAOp-CD8::GFP). Scale bar: 50 µm. (B) Confocal projections of a male brain expressing split GFP fragments in MS1 and FRU neurons (left, MS1-Gal4/UAS- spGFP1-10::NRX; fru-LexA /LexAop-spGFP11) and a negative control male brain (right, MS1-Gal4/UAS-spGFP1-10::NRX/+; LexAop-spGFP11/+). Reconstituted GFP fluorescence was detected without antibody staining. Scale bar: 100 µm.
Figure 6 with 1 supplement
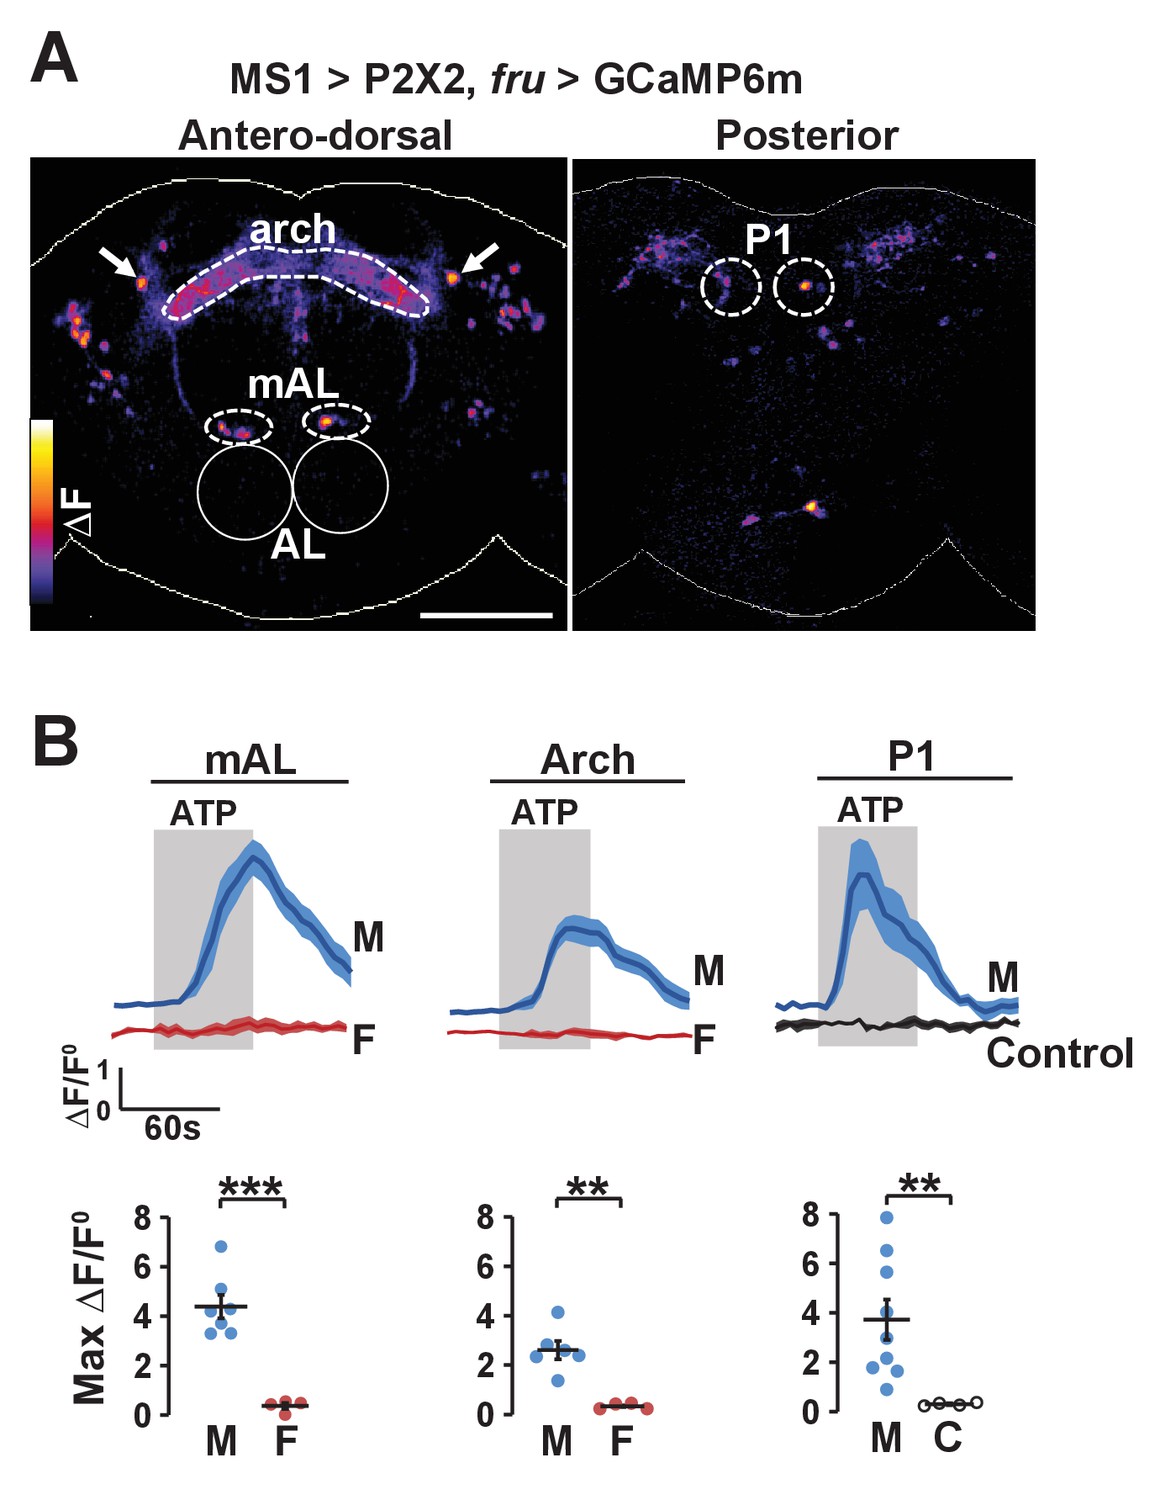
Experimental activation of MS1 neurons elicits calcium responses in FRU neurons.
(A) GCaMP6m increase (△F) in FRU neurons of a dissected male brain in which MS1 neurons are activated by P2X2 expression and ATP perfusion. Antero-dorsal (left) and posterior (right) views are presented using the ‘fire’ look-up table. AL: antennal lobes. Arrows point to a pair of neurons that may be aSP4. Scale bar: 100 µm. (B) Normalized GCaMP6m response (△F/F0) in the cell bodies of mAL and P1 neurons, and the arch region in male (M), female (F), or negative control (C) brains. Female brains do not exhibit calcium responses in P1 neurons because these neurons are male specific. Flies carrying UAS-P2X2, fru-LexA, and LexAop-GCaMP6m, but not MS1-Gal4 served as negative controls. Fluorescence traces (top) and peak responses (bottom) are presented. Gray rectangles indicate 2.5 mM ATP perfusion. N = 4–9. Student’s t test (B).
Figure 6—figure supplement 1
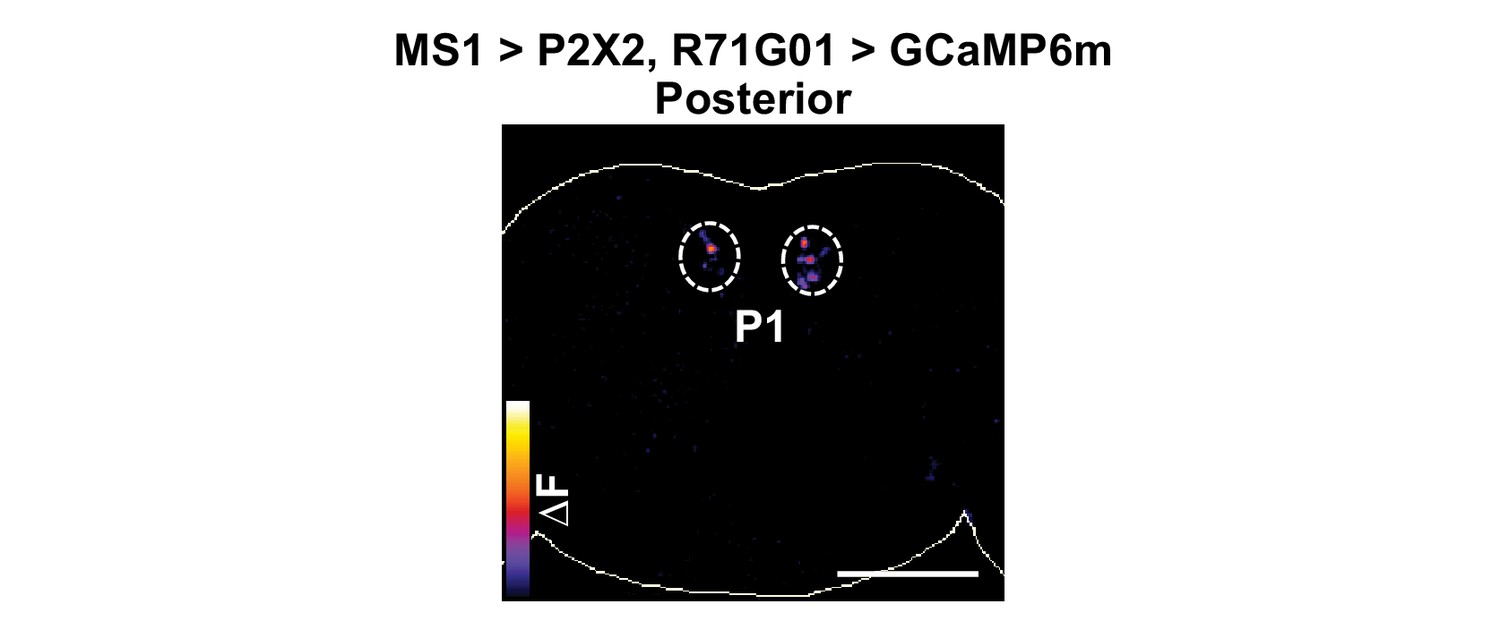
MS1 stimulation induces calcium responses in P1.
P2X2 was expressed under the control of MS1-Gal4, while GCaMP6m was expressed under the control of R71G01-LexA. A posterior view is presented using the ‘fire’ look-up table. Scale bar: 100 µm.
Figure 7
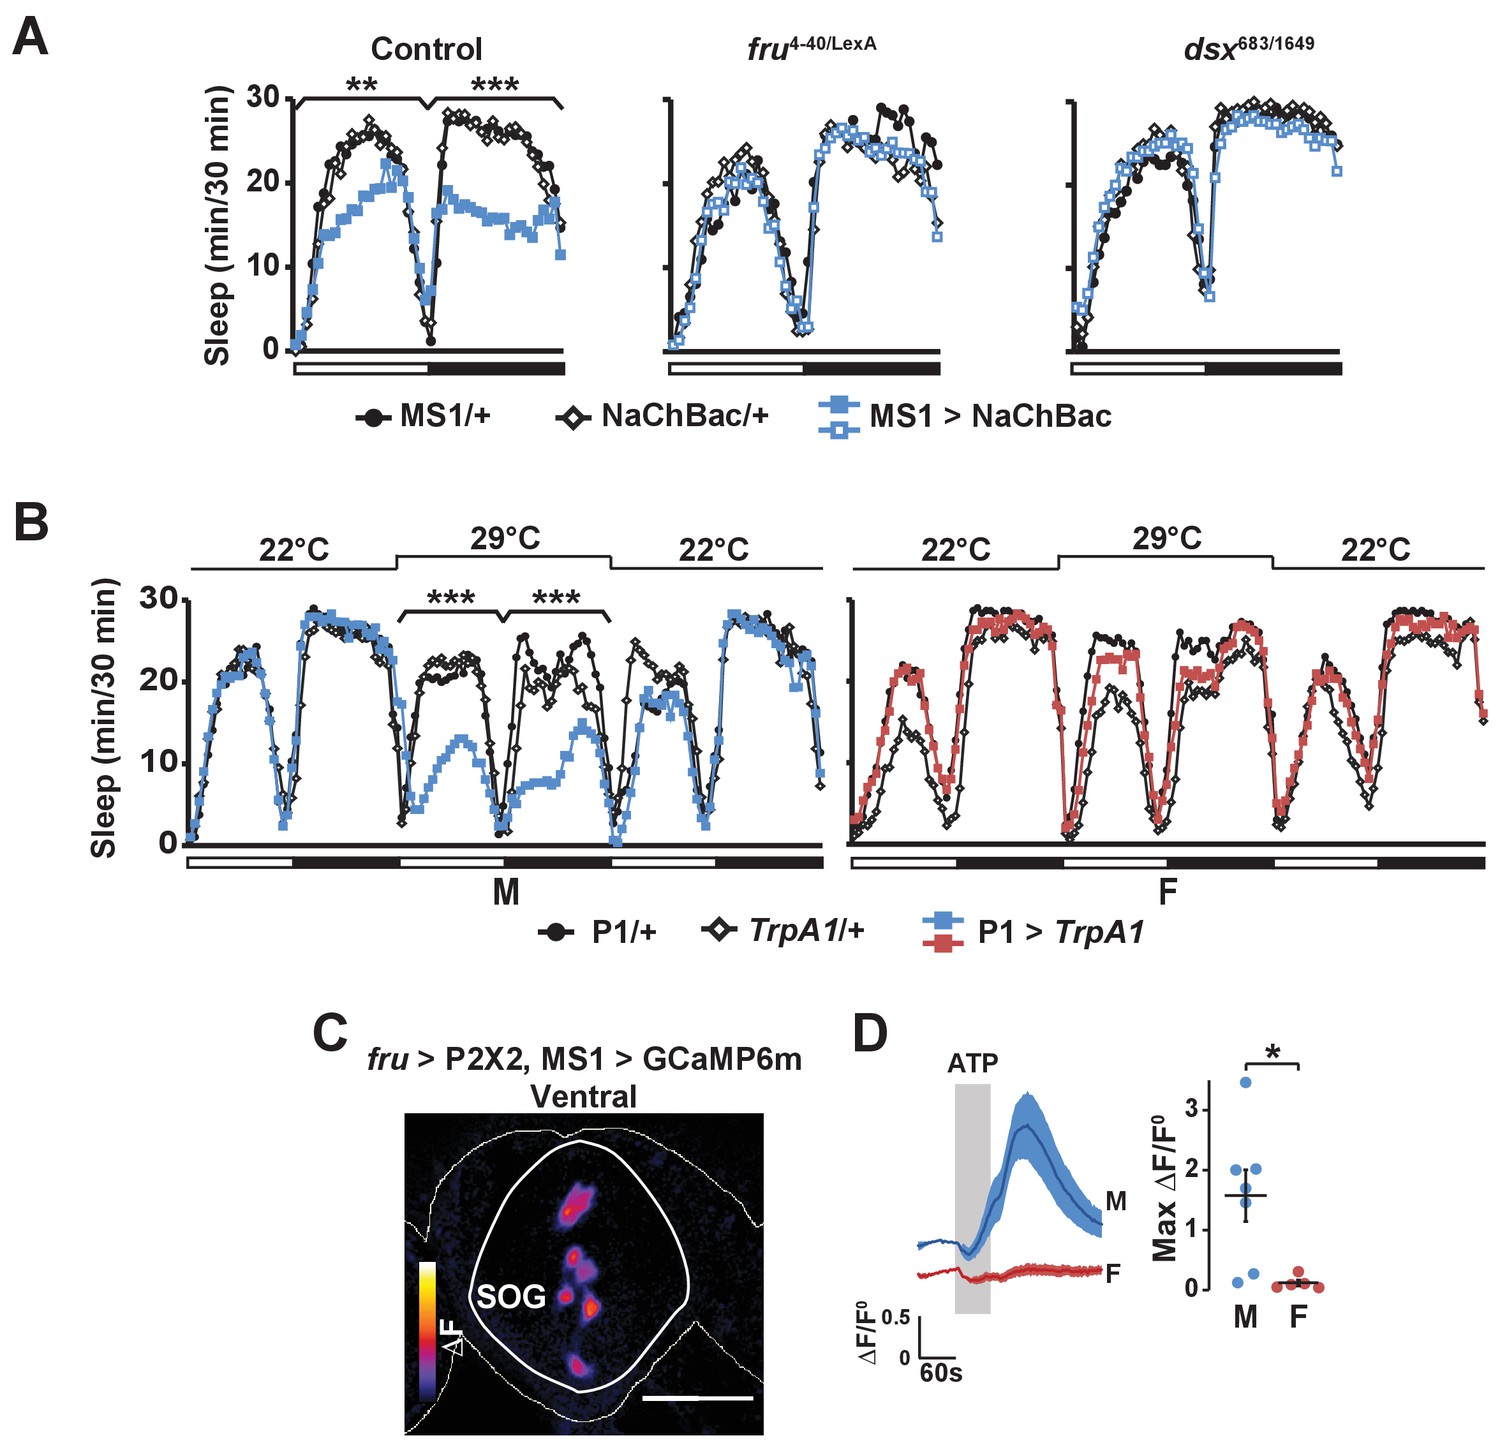
Activation of P1 neurons suppresses male sleep and experimental activation of FRU neurons elicits calcium responses in MS1 neurons.
(A) Sleep profile of males expressing NaChBac in MS1 neurons (MS1>NaChBac) and control males (MS1/+ and NaChBac/+) in an iso31 control (left), fruLexA/4-40 mutant (middle) and dsx683/1649 mutant (right) background. N = 11–83. (B) Sleep profile of male (M) and female (F) flies in which P1-split-Gal4 (Inagaki et al., 2014) was used to drive UAS-TrpA1 (P1 > TrpA1) and parental control flies (P1/+ and TrpA1/+). TrpA1 was activated on the 2nd day by raising the temperature from 22°C to 29°C. N = 82–91. (C) GCaMP6m response to ATP (△F) in MS1 neurons of a male brain in which FRU neurons are activated by P2X2 expression and ATP perfusion. (D) Normalized GCaMP6m response (△F/F0) in the cell bodies of MS1 neurons in males (M) and females (F). N = 5–7. One-way ANOVA followed by Dunnett post hoc tests (A, B); Student’s t test (C, D).
Videos
Video 1
Wild-type male-male (MM) and male-female (MF) pairs at ~ZT18 under infrared light.
While most MM pairs slept, many males paired with females engaged in courtship behaviors including chasing and wing extension.
Video 2
Male flies with activated MS1 neurons (MS1 > TrpA1) and control males (MS1/+ or TrpA1/+) at 29°C.
The flies were recorded at ~ZT17 under infrared light. MS1 activation led to pacing behavior typically observed in awake flies (note one of the control flies exhibiting the same behavior).
Video 3
Male flies with activated P1 neurons and control males (left) as well as male flies with activated MS1 neurons and control males (right) at 29°C.
The flies were recorded ~30 min after the switch from 22°C to 29°C (ZT0.5) under white light. Wing extension is seen in males with activated P1 neurons (top left), but not in males with activated MS1 neurons (top right).
Video 4
Flies shown in Video 3 at ~ZT5 at 29°C.
Males with activated P1 neurons no longer exhibited wing extension, but engaged in behavior typical of awake flies such as pacing, feeding, and grooming.
Download links
A two-part list of links to download the article, or parts of the article, in various formats.
Downloads (link to download the article as PDF)
Open citations (links to open the citations from this article in various online reference manager services)
Cite this article (links to download the citations from this article in formats compatible with various reference manager tools)
Identification of octopaminergic neurons that modulate sleep suppression by male sex drive
eLife 6:e23130.
https://doi.org/10.7554/eLife.23130


