Different TCR-induced T lymphocyte responses are potentiated by stiffness with variable sensitivity
- INSERM U932 & PSL Research University, France
- Université Paris-Diderot and CNRS, France
- Sorbonne Universités, UPMC Université Paris, France
- Institut Cochin & UMR8104, CNRS & Université Paris Descartes, France
Figures
Figure 1 with 1 supplement
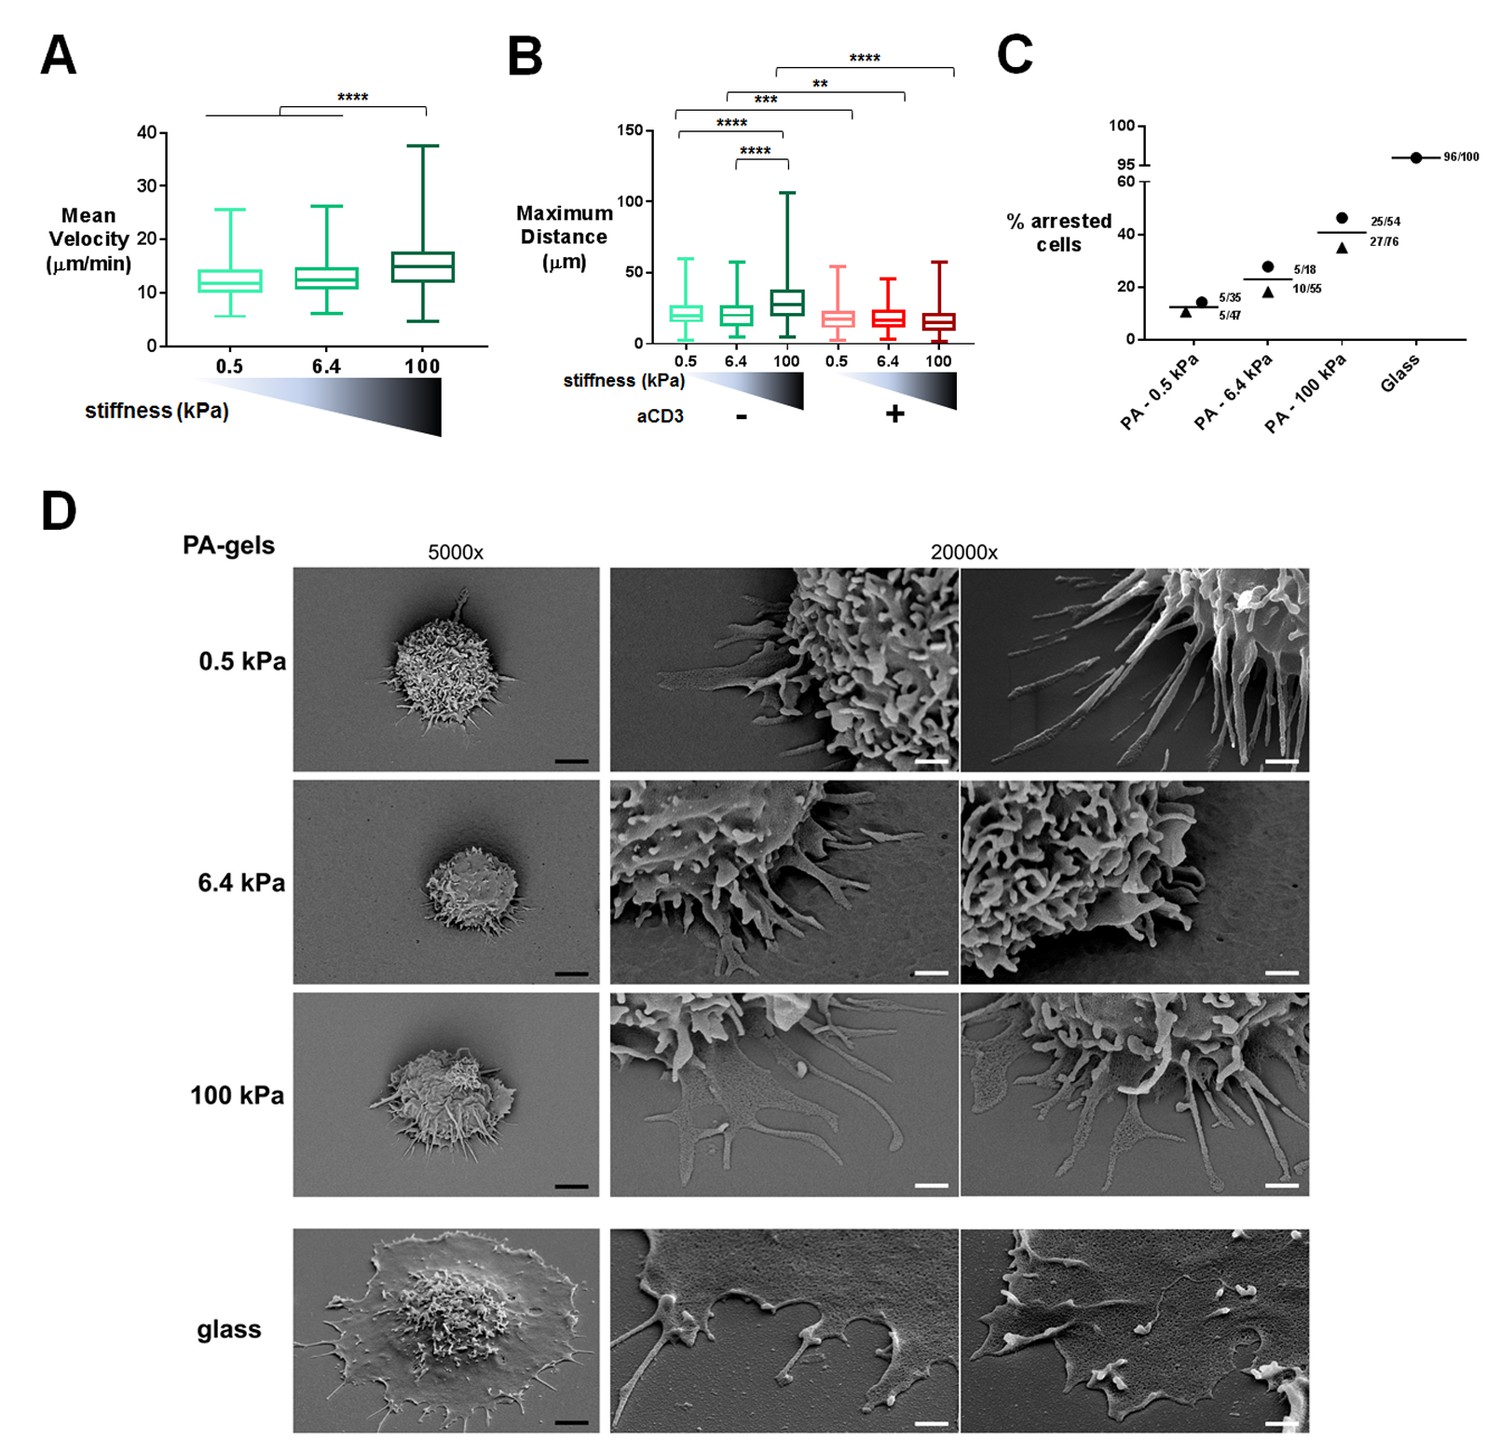
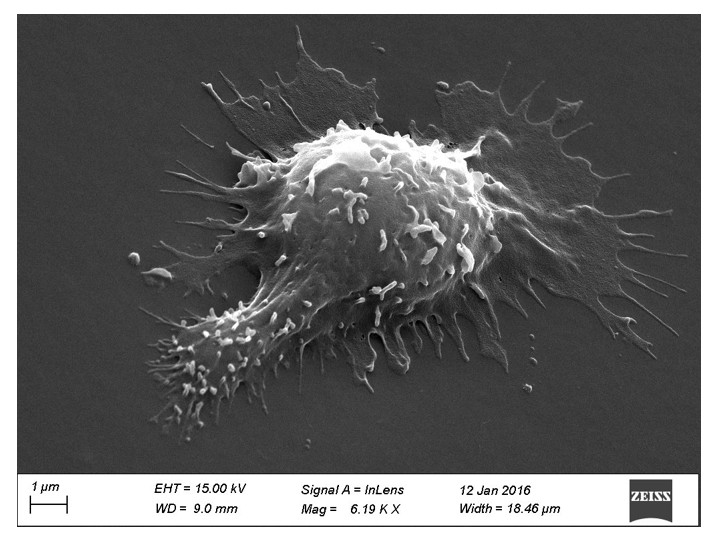
T cell migratory properties and morphology are modulated by substrate stiffness.
(A) Mean instantaneous velocities of migrating T cells on ICAM-1-coated PA-gels of varying stiffness (ncells: 50–100 for each condition from nDonors: 4). (B) Maximum distance travelled by T cells on PA-gels of varying stiffness for a duration of 5 min (ncells: 50–100 for each condition from nDonors: 4). Boxes and whiskers for minimum and maximum are shown. For statistical analysis, unpaired parametric t-tests were performed: ****p-value<0.0001, ***p-value<0.001, **p-value<0.01. (C) Percentage of arrested cells on aCD3+aCD28+ICAM-1 coated PA-gels of varying stiffness. T cell response on glass coated with aCD3+aCD28+ICAM-1 is shown for comparison. Mean values and number of cells per condition are shown (nDonors: 2). (D) Scanning electron microscopy pictures of T cells (representative of ncells: 5 per condition from nDonors: 2) on aCD3+aCD28+ICAM-1-coated substrates for two magnifications (5000x and 20000x). Black scale bars: 2 μm, white scale bars: 500 nm.
Figure 1—figure supplement 1
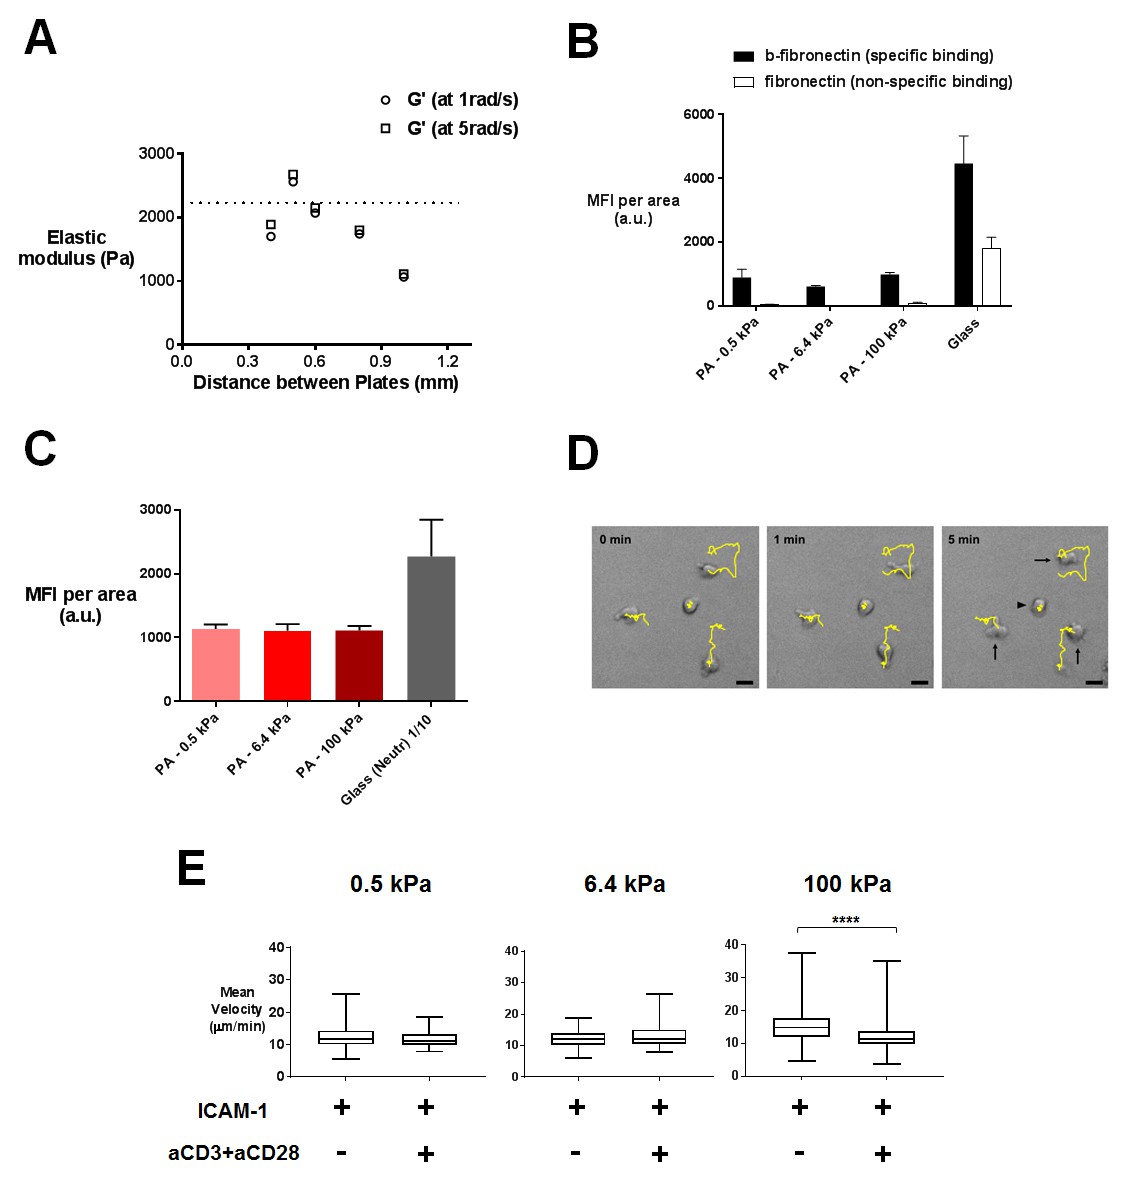
Characterization of PA-gels and additionnal data on migration.
(A) Measurement of the elastic modulus G´ of a PA-gel containing 5% acrylamide and 0.5% bis-acrylamide. The value associated to a given sample corresponds to the maximum of G´ as a function of the distance between the rheometer plates. The dotted line shows the mean value of the elastic shear modulus G´ = 2212 ± 79 Pa for n = 15 different samples of PA-gels at 5% acrylamide and 0.5% bis-acrylamide. (B) Coating of PA-gels and glass coverslips by biotinylated (b-fibronectin) or non biotinylated fibronectin quantified by immunofluorescence labeling. (C) Biotinylated antibody coating on streptavidin containing PA-gels of varying stiffness and neutravidin-coated glass coverslips quantified by immunofluorescence labeling (nsamples: 14). (D) 5 min tracks of individual CD4+ T lymphoblasts on the 100 kPa gels coated with aCD3+aCD28+ICAM-1. Arrows indicate migrating cells and the arrowhead indicates an arrested cell. Scale bar: 10 μm. (E) Mean instantaneous velocities of migrating T cells on PA-gels of varying stiffness, coated with either ICAM-1 or aCD3+aCD28+ICAM-1, for a duration of 5 min (ncells: 50–100 for each condition from nDonors: 4). Boxes and whiskers for minimum and maximum are shown. For statistical analysis, unpaired parametric t-tests were performed: ****p-value<0.0001.
Figure 2
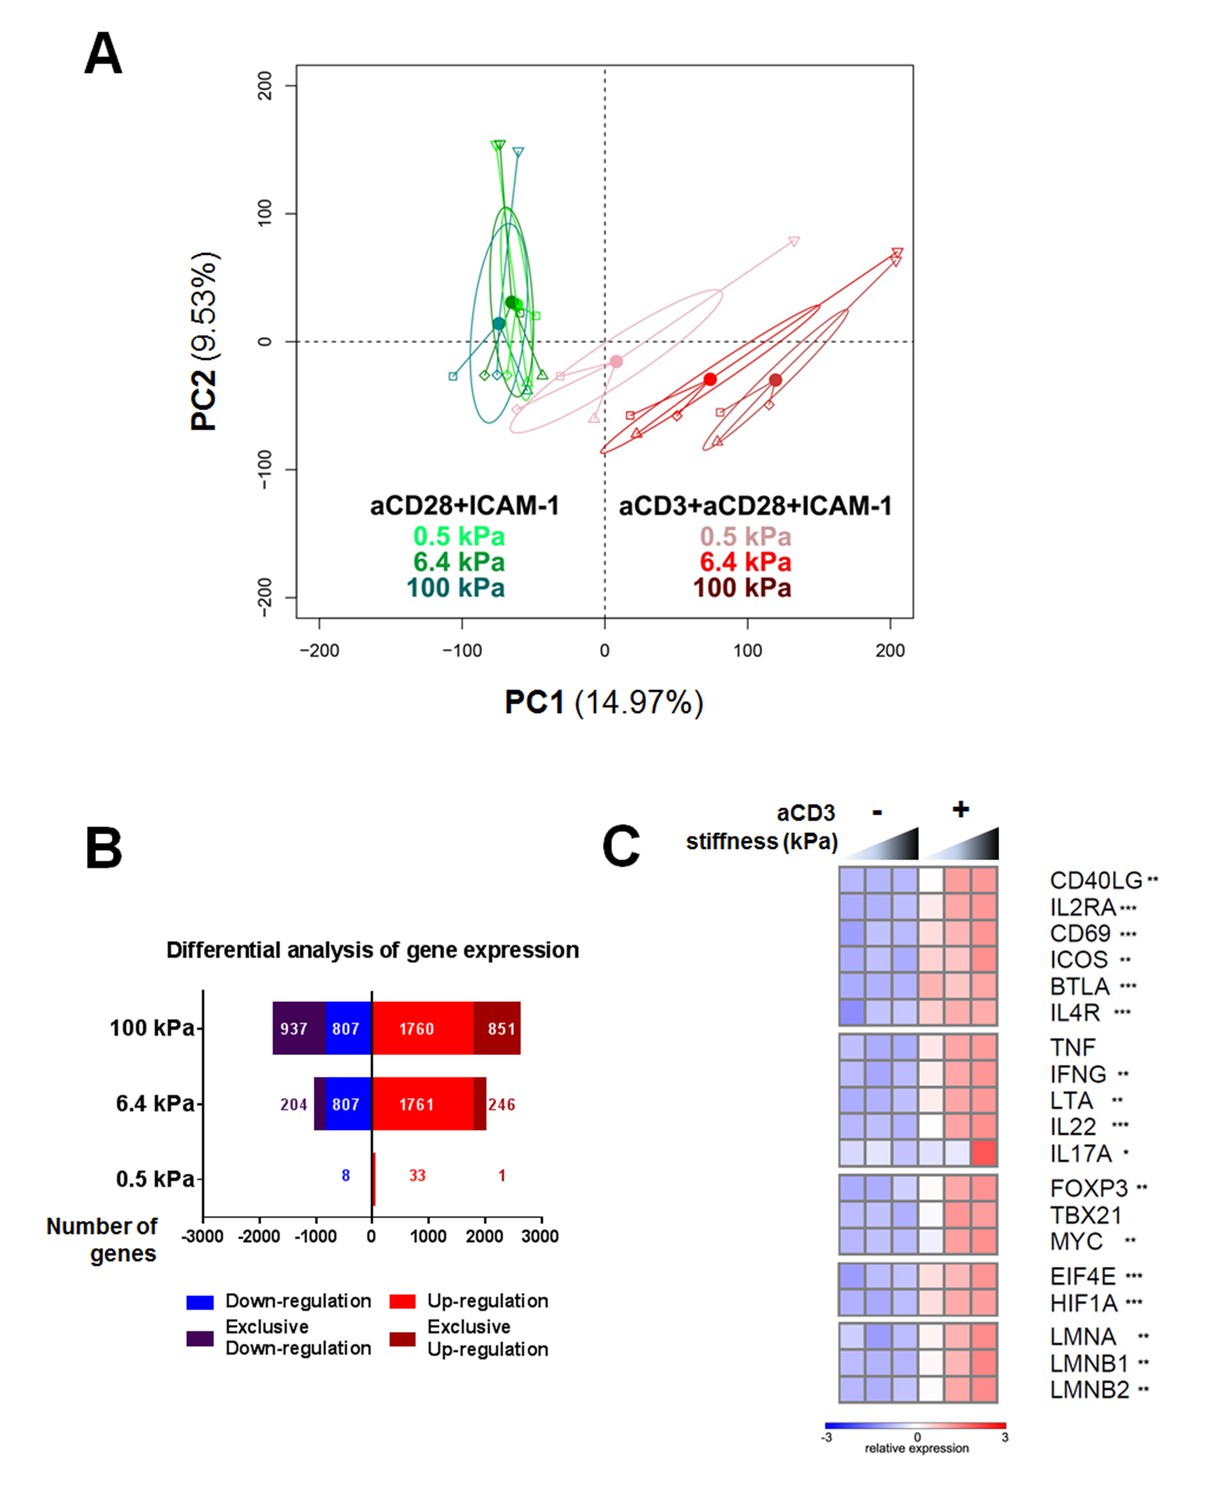
Gene expression of CD4+ T cells shows a graded response to stiffness.
(A) Principal component analysis reveals that gene expression is modulated by T cell substrate stiffness only in presence of aCD3 (nDonors: 4). (B) Number of genes that displayed differential expression between the conditions with and without aCD3 on PA-gels of varying stiffness. ‘Exclusive’ indicates the genes that are found Up- or Down-regulated only at a given stiffness value. (C) Relative expression of T cell related genes following Affymetrix microarray analysis. Asterisks indicate the presence of these genes in the differential analysis: *** for 0.5 to 100 kPa, ** for 6.4 to 100 kPa, * for 100 kPa only.
Figure 3 with 1 supplement
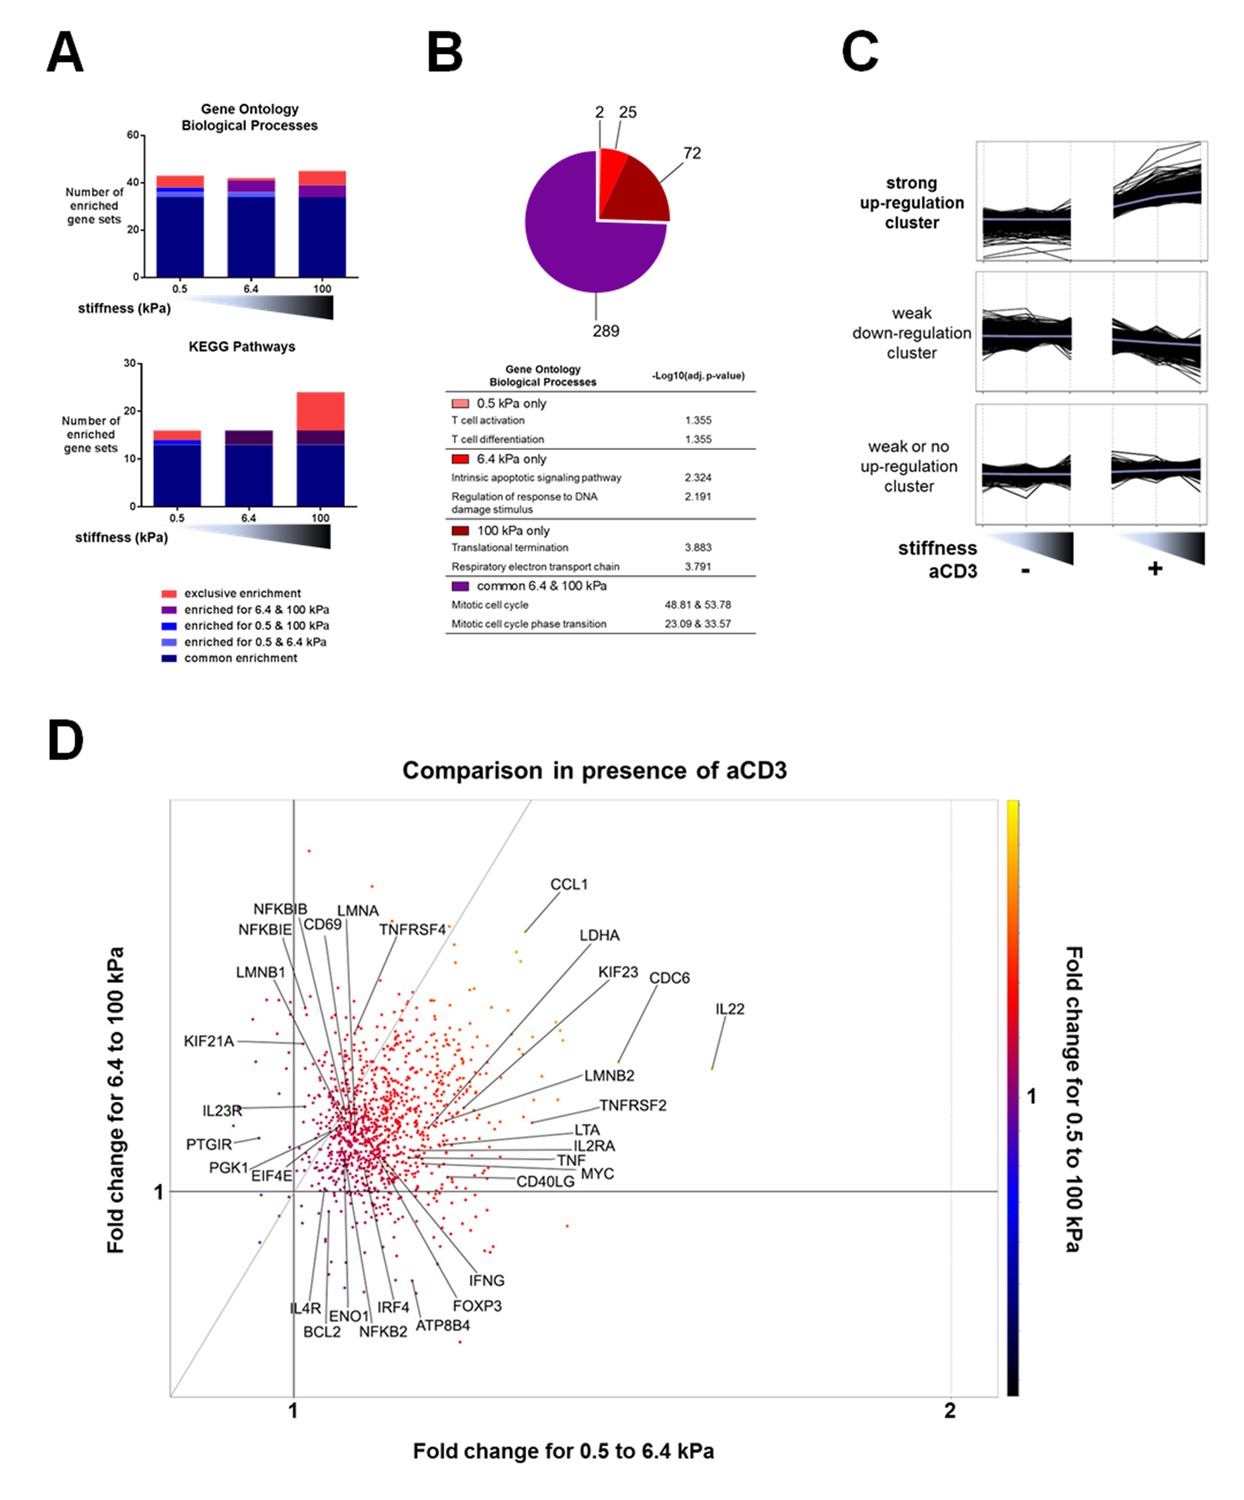
Stiffness potentiates TCR/CD3-induced transcriptional response.
(A) Enrichment of gene sets on PA-gels of varying stiffness for p-values lower than 0.05, false discovery rates lower than 0.25 and NES values higher than 1.75. (B) Pathway analysis with the GO – BP database for differentially expressed genes between the conditions with and without aCD3 on PA gels of varying stiffness. The number of different pathways (pie-chart) and the top 2 hits of the enriched pathways, along with their negative log adjusted p-value (table), are shown. (C) K-means clustering of genes with different expression profiles on PA-gels of varying stiffness demonstrates three different clusters: one with strong up-regulation in the presence of aCD3 (containing 1022 probes), one with weak down-regulation (containing 4412 probes) and one with weak or no up-regulation (containing 5928 probes). (D) Comparison of the relative changes in gene expression in the presence of aCD3 for the strong up-regulation cluster. The x-axis shows the difference in gene expression for the transition of 0.5 to 6.4 kPa, the y-axis for the transition of 6.4 to 100 kPa and the colour gradient for the transition of 0.5 to 100 kPa.
Figure 3—figure supplement 1
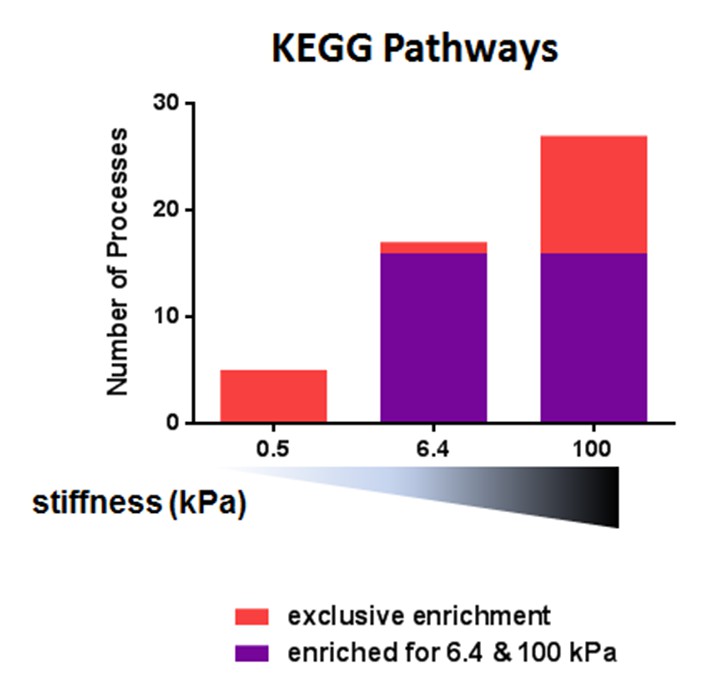
Pathway analysis with the KEGG database for differentially expressed genes between the conditions with and without aCD3 on PA gels of varying stiffness.
https://doi.org/10.7554/eLife.23190.014
Figure 4 with 1 supplement
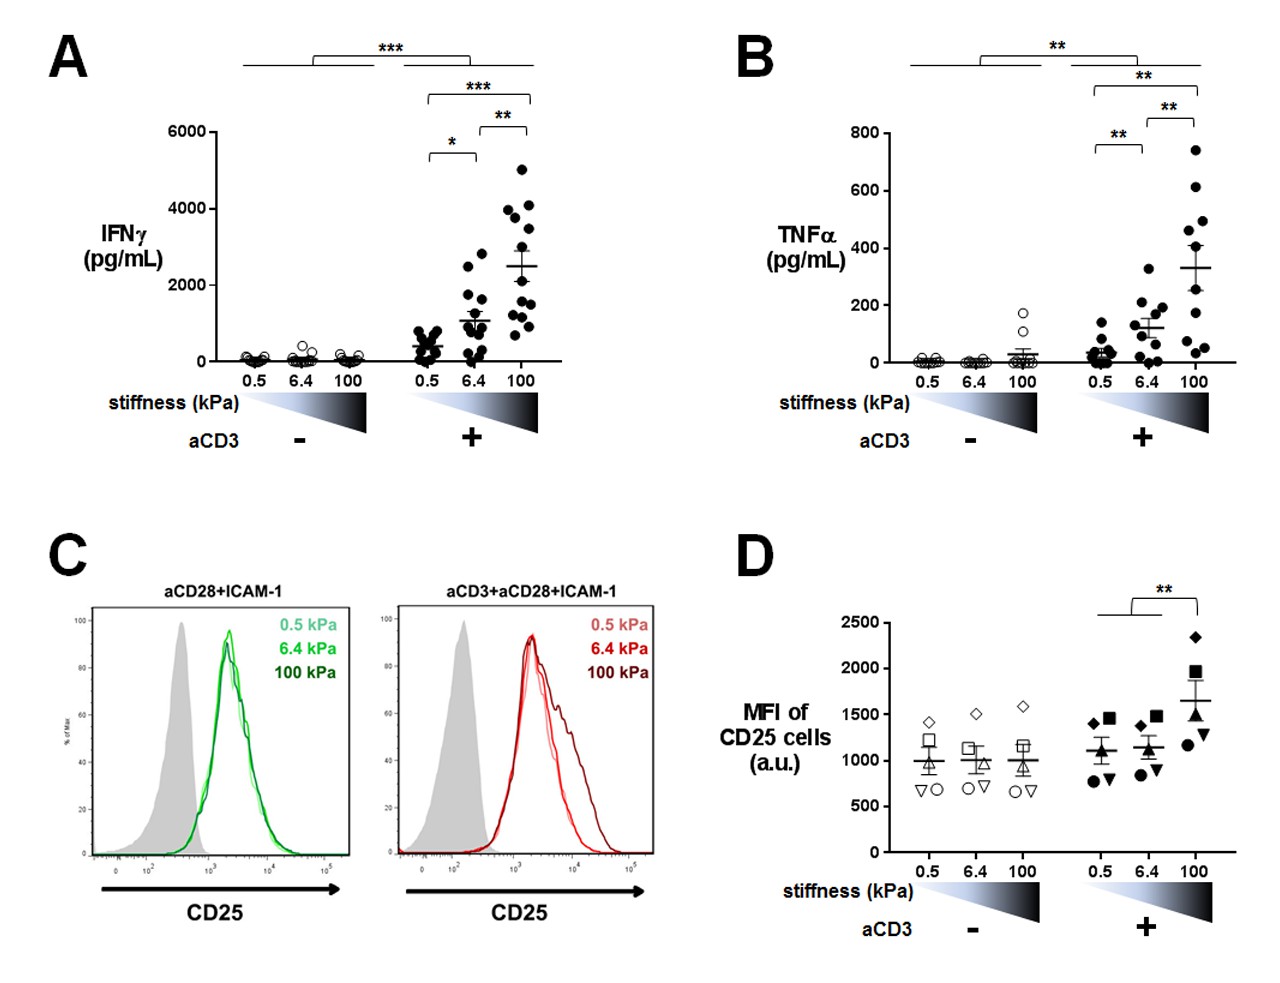
Cytokine production is sensitive to a wide range of stiffness.
Production of (A) IFNγ (nDonors: 13) and (B) TNFα (nDonors: 10) on PA-gels of varying stiffness. In the presence of aCD3, the aCD3:aCD28 coating ratio was 1:10. (C) FACS plot of CD25 staining. A representative experiment is shown. (D) Mean fluorescence intensity of CD25-stained cells (nDonors: 5). Mean values with standard error are shown. For statistical analysis, paired parametric t-tests were performed: ***p-value<0.001, **p-value<0.01, *p-value<0.05.
Figure 4—figure supplement 1
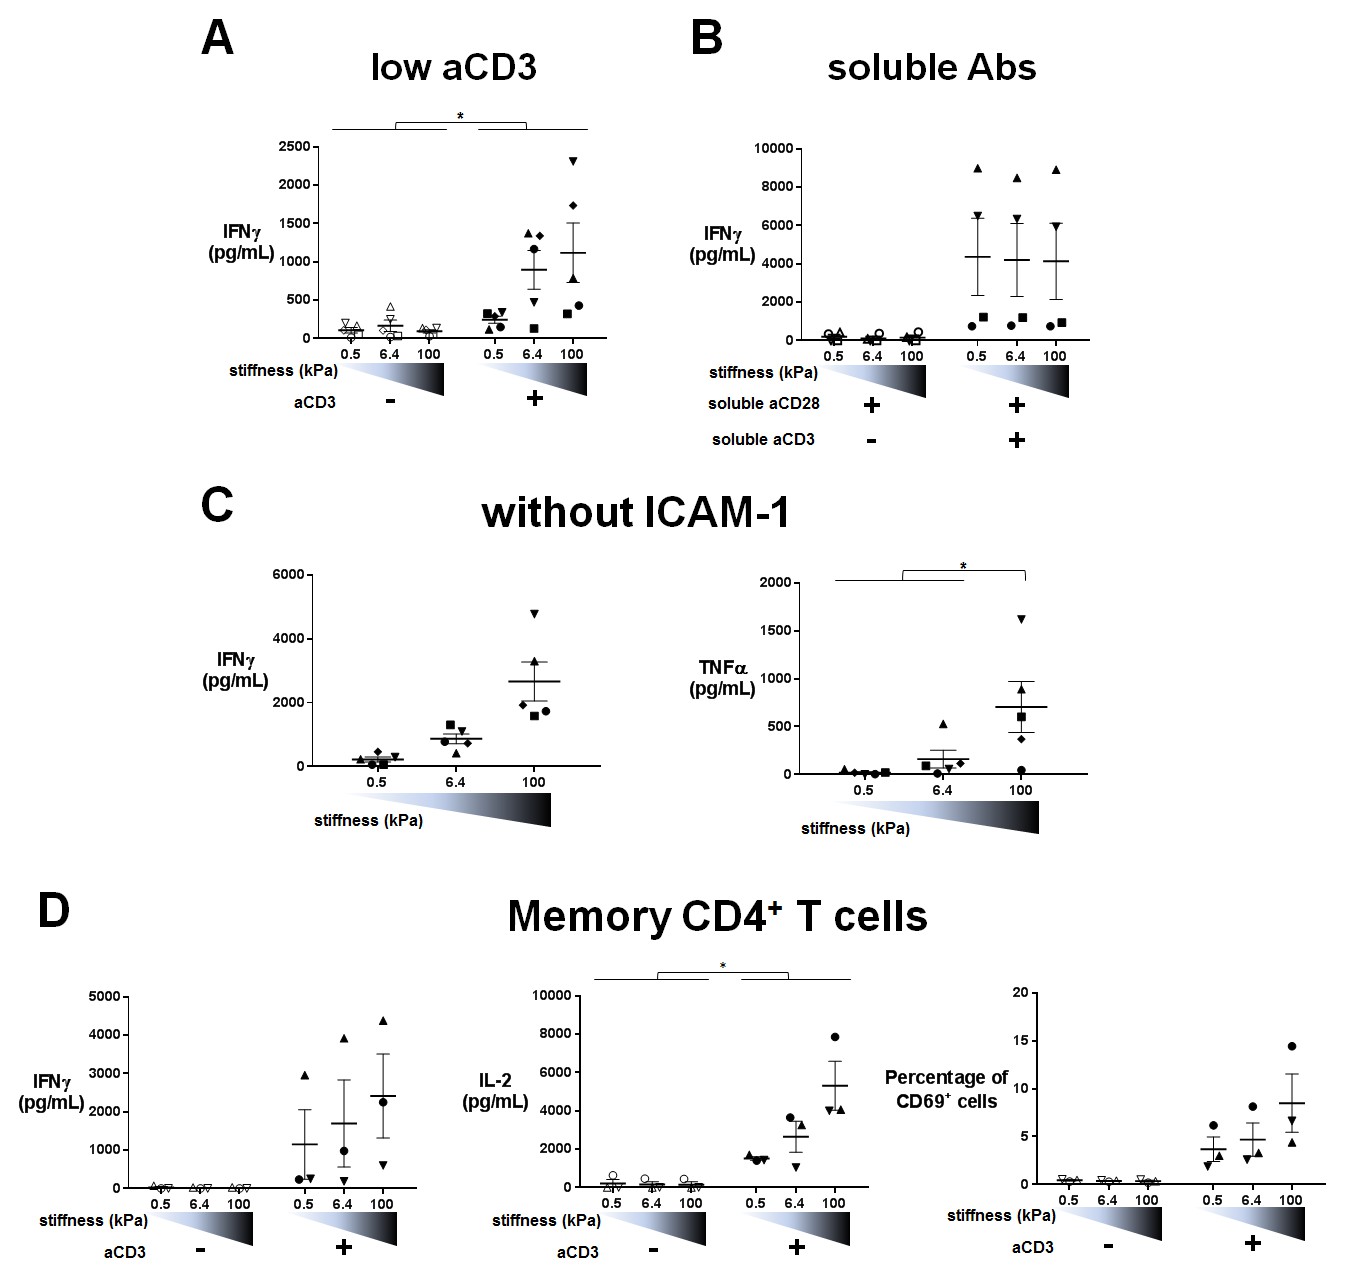
Cytokine production on PA-gels: additionnal data.
(A) Production of IFNγ on PA-gels of varying stiffness; in the presence of aCD3, the aCD3:aCD28 coating ratio was 1:100 (nDonors: 5).
(B) Production of IFNγ on PA-gels of varying stiffness for non-biotinylated soluble aCD3+aCD28 antibodies at concentrations of 1 + 10 μg/mL respectively (nDonors: 4). (C) Production of IFNγ and TNFα on PA-gels of varying stiffness coated with aCD3+aCD28 only. The aCD3:aCD28 coating ratio was 1:10 (nDonors: 5). (D) Production of IFNγ and IL-2 and percentage of CD69+ cells for memory CD4+ T cells cultured on PA-gels of varying stiffness (nDonors: 3). Mean values with standard error are shown. For statistical analysis, paired parametric t-tests were performed: *p-value<0.05.
Figure 5 with 1 supplement
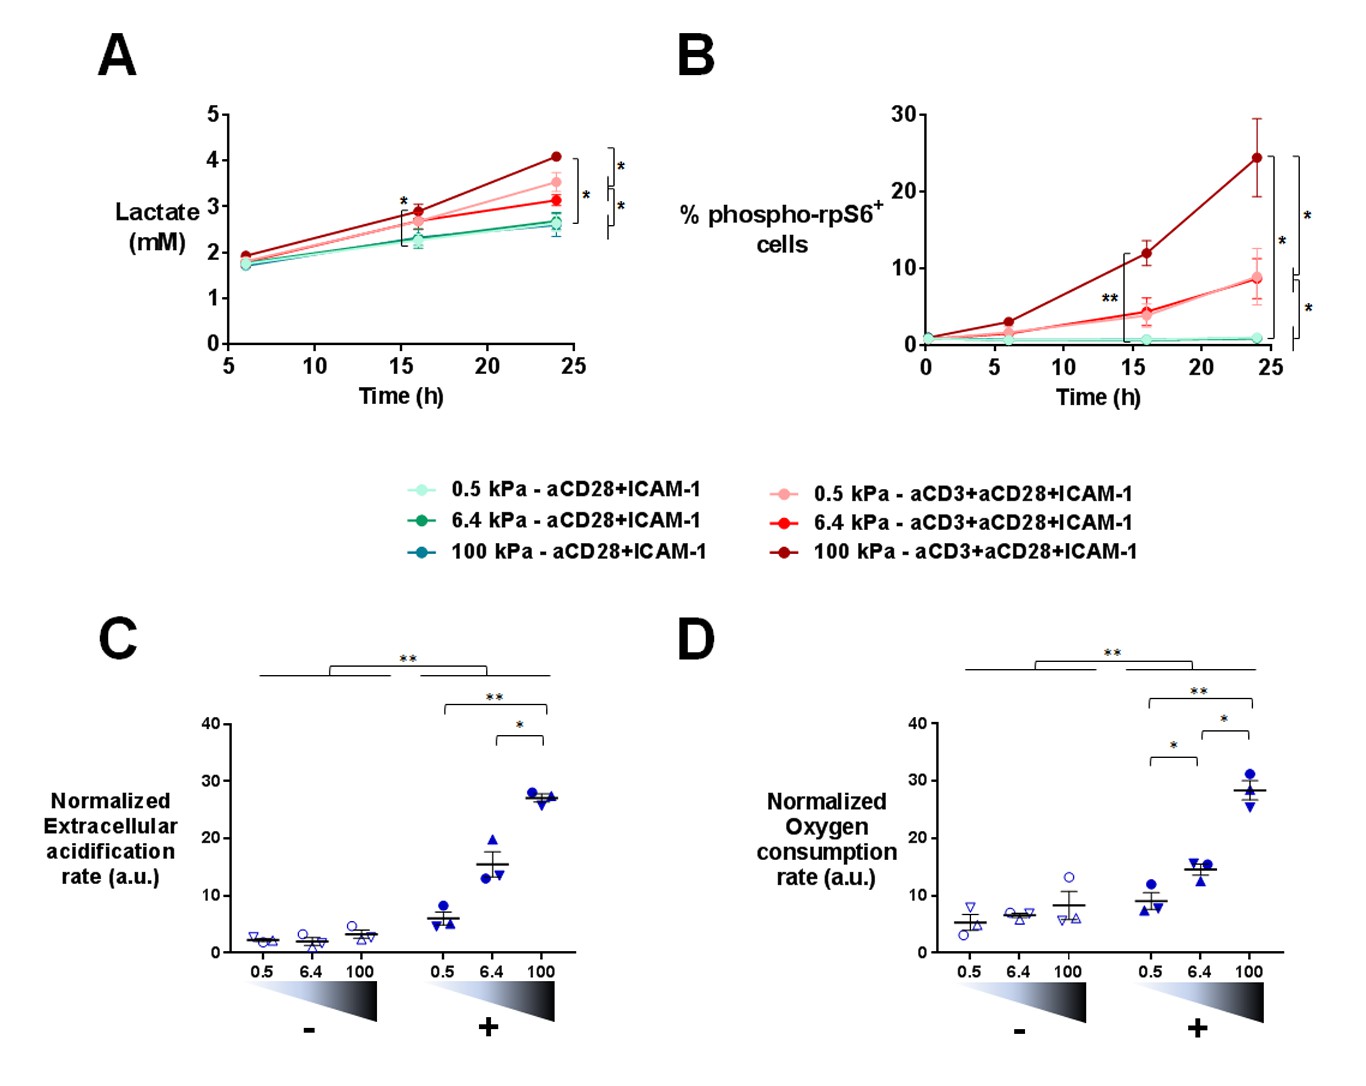
T cell metabolism is modulated by increased stiffness.
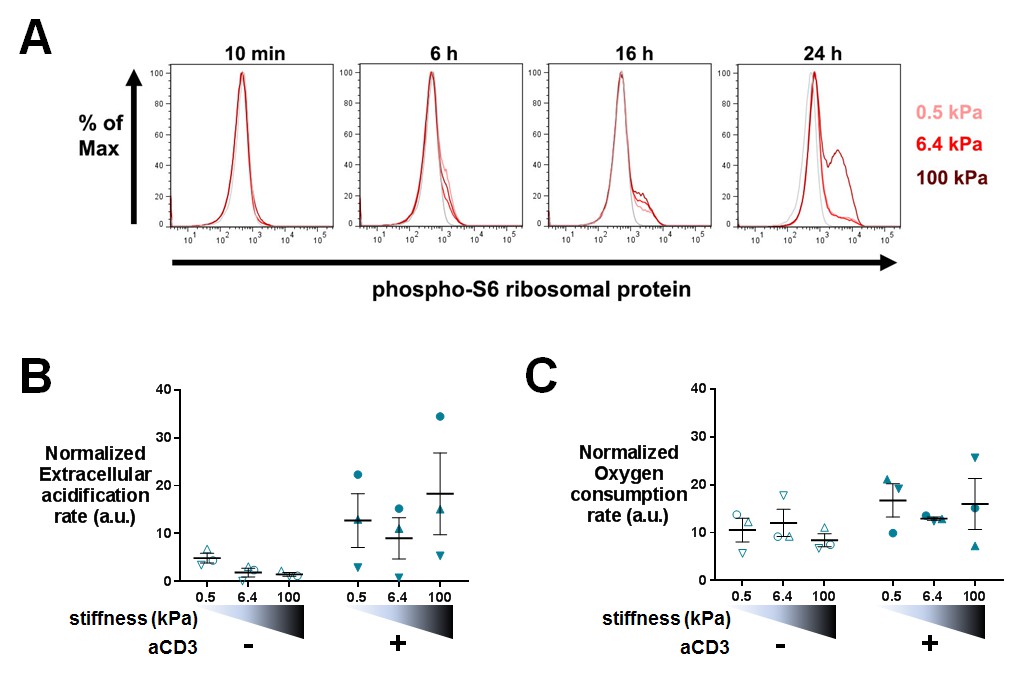
(A) Lactate production in the supernatant of T cell cultures on PA-gels of varying stiffness. (nDonors: 3). (B) Percentage of phospho-rpS6+ T cells cultured on PA-gels of varying stiffness (nDonors: 4). (C) Overall glycolytic capacity of T cells cultured on PA-gels of varying stiffness for 48 hr. The extracellular acidification rate is normalized to the number of cells per well. Mean values with standard error are shown (nDonors: 3). (D) Maximal mitochondrial respiration of T cells following culture on PA-gels of varying stiffness for 48 hr. The oxygen consumption rate is normalized to the number of cells per well. Mean values with standard error are shown (nDonors: 3). For statistical analysis, paired parametric t-tests were performed: **p-value<0.01, *p-value<0.05.
Figure 5—figure supplement 1
Phospho-rpS6 and metabolism: additionnal data.
(A) Representative FACS analysis of phospho-rpS6+ T cells at different culture times on aCD3+aCD28+ICAM-1 coated PA-gels of varying stiffness. (B) Overall glycolytic capacity of T cells following culture on PA-gels of varying stiffness for 24 hr. The extracellular acidification rate is normalized to the number of cells per well. Mean values with standard error are shown (nDonors: 3). (C) Maximal mitochondrial respiration of T cells following culture on PA-gels of varying stiffness for 24 hr. The oxygen consumption rate is normalized to the number of the cells per well. Mean values with standard error are shown (nDonors: 3).
Figure 6 with 1 supplement
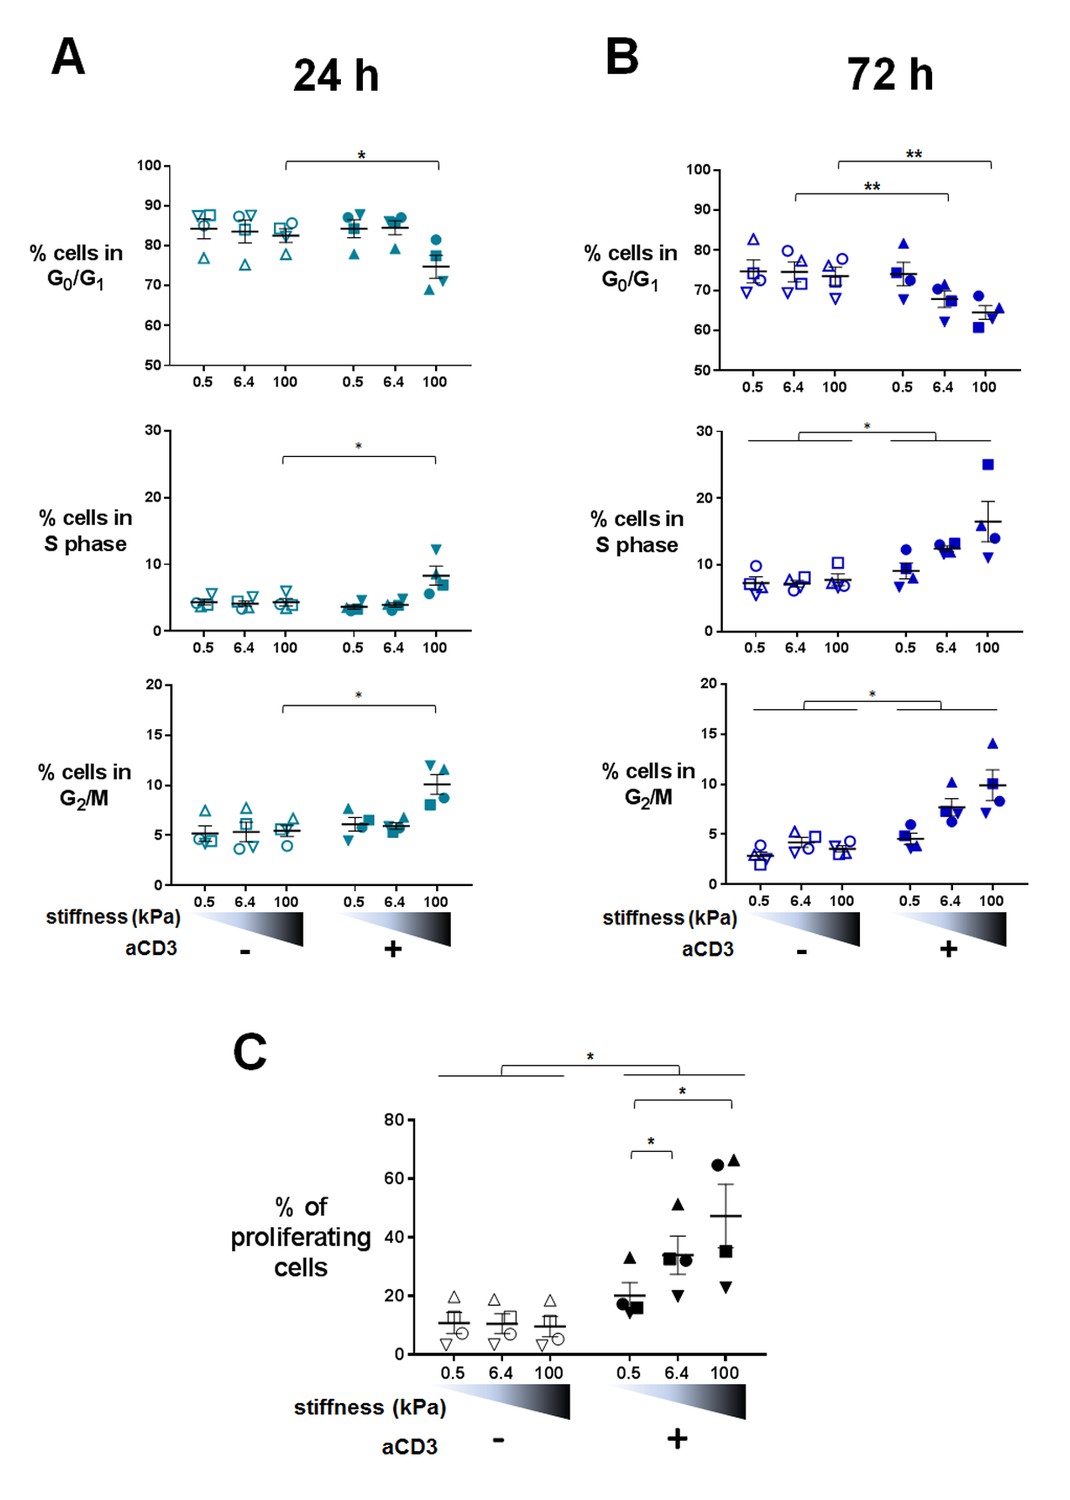
Proliferation and cell cycle progression are potentiated by stiffness in response to TCR/CD3 induced activation.
The percentages of cells in G0/G1, S phase and G2/M are shown for (A) 24 hr (nDonors: 4) and (B) 72 hr (nDonors: 4). (C) Percentage of proliferating T cells following 72 hr culture on PA-gels of varying stiffness. (nDonors: 4). Mean values with standard error are shown. For statistical analysis, paired parametric t-tests were performed: **p-value<0.01, *p-value<0.05.
Figure 6—figure supplement 1
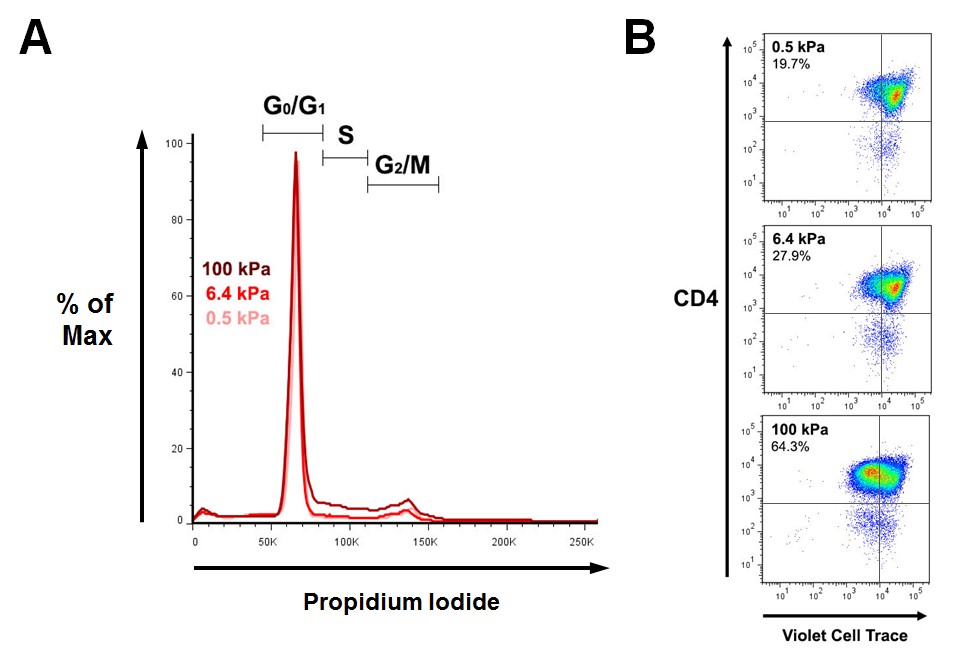
Cell cycle and proliferation: additionnal data.
(A) Representative FACS analysis of propidium iodide staining of T cells following 24 hr culture on PA-gels in the presence of aCD3. (B) Representative dot plot of T cell proliferation following 72 hr culture on PA-gels in the presence of aCD3.
Figure 7 with 1 supplement

T cell activation is potentiated by APC mechanical properties.
(A) HeLa-CIITA cells were grown at confluence on fibronectin coated PDMS gels of varying stiffness and were stained with phalloidin (F-Actin, in red) and cell trace violet (CTV, in cyan) (scale bar: 10 μm). (B) Area of HeLa-CIITA cells cultured on 1.5 kPa (453 ± 14 μm2, ncells = 254) and 28 kPa (569 ± 25 μm2, ncells = 215) PDMS gels. Boxes and whiskers for minimum and maximum are shown. For statistical analysis, unpaired t-tests with Welch's correction were performed: ****p-value<0.0001. (C) Young’s modulus of HeLa-CIITA cells cultured on 1.5 kPa (1.43 ± 0.15 kPa, ncells = 13) and 28 kPa (1.72 ± 0.2 kPa, ncells = 15) PDMS gels. Boxes and whiskers for minimum and maximum are shown. Production of D) IFNγ and E) TNFα by T cells interacting with HeLa-CIITA on PDMS gels of varying stiffness in the presence of different TSST-1 superantigen concentrations. The response for individual donors is shown (nDonors: 8). For statistical analysis, paired parametric t-tests were performed: *p-value<0.05.
Figure 7—figure supplement 1
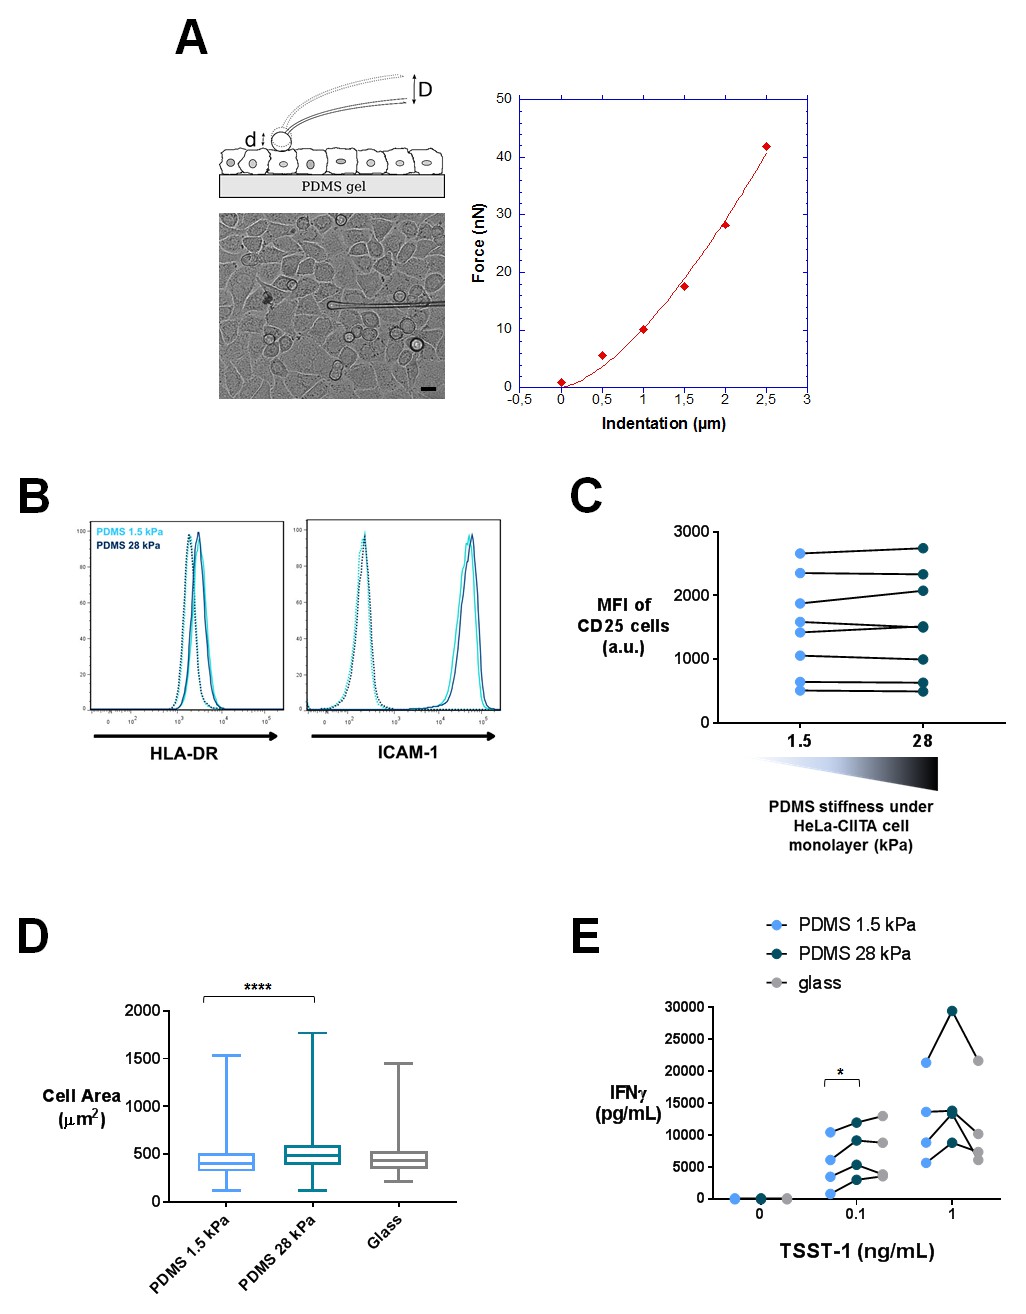
Characterization of APC mechanical properties and T cell activation: additionnal data.
(A) Young’s modulus measurement of HeLa-CIITA cells. Left: principle of measurement and image of the HeLa cell monolayer with the glass probe on top of it (scale bar: 10 μm). When the probe is lowered by a distance D, its tip indents the top of the cell leading to a tip displacement d < D. Thus, the probe is deflected and exerts an elastic force F=k×D-d), where k is the calibrated probe stiffness. Right: force-indentation curve for an individual HeLa cell from a confluent layer, fitted following the Hertz model. (B) FACS plots of HeLa-CIITA cells stained for the APC markers HLA-DR and ICAM-1. Dotted lines display isotype antibody. (C) Mean fluorescence intensity of CD25 stained cells, which were activated for 24 hr by HeLa-CIITA cells grown at confluence on PDMS of varying stiffness in the presence of TSST-1 superantigen (1 ng/mL). The response for individual donors is shown (nDonors: 8). (D) Area of HeLa-CIITA cells cultured on 1.5 kPa (453 ± 14 μm2, ncells = 254), 28 kPa (569 ± 25 μm2, ncells = 215) PDMS gels or glass (473 ± 19 μm2, ncells = 140). Boxes and whiskers for minimum and maximum are shown. (E) Production of IFNγ by T cells interacting with HeLa-CIITA on PDMS gels of varying stiffness or glass in the presence of different TSST-1 superantigen concentrations. The response for individual donors is shown (nDonors: 4). For statistical analysis, paired parametric t-tests were performed: *p-value<0.05.
Author response image 1
Scanning electron microscopy picture of a T cell with migrating morphology on a 0.5 kPa PA-gel coated with aCD3+aCD28+ICAM-1.
https://doi.org/10.7554/eLife.23190.028Videos
Video 1
Live microscopy video of T lymphoblasts on a PA-gel of 0.5 kPa coated with ICAM-1-Fc.
https://doi.org/10.7554/eLife.23190.006
Video 2
Live microscopy video of T lymphoblasts on a PA-gel of 6.4 kPa coated with ICAM-1-Fc.
https://doi.org/10.7554/eLife.23190.007
Video 3
Live microscopy video of T lymphoblasts on a PA-gel of 100 kPa coated with ICAM-1-Fc.
https://doi.org/10.7554/eLife.23190.008
Video 4
Live microscopy video of T lymphoblasts on a PA-gel of 0.5 kPa coated with aCD3+aCD28+ICAM-1-Fc.
https://doi.org/10.7554/eLife.23190.009
Video 5
Live microscopy video of T lymphoblasts on a PA-gel of 6.4 kPa coated with aCD3+aCD28+ICAM-1-Fc.
https://doi.org/10.7554/eLife.23190.010
Video 6
Live microscopy video of T lymphoblasts on a PA-gel of 100 kPa coated with aCD3+aCD28+ICAM-1-Fc.
https://doi.org/10.7554/eLife.23190.011Tables
Table 1
Composition of PA-gels and equivalent elastic modulus values (mean values with standard error).
| Acrylamide (% w/v) | bis-Acrylamide (% w/v) | Young’s modulus E (Pa) |
|---|---|---|
| 3 | 0.2 | 513 ± 48 |
| 5 | 0.5 | 6416 ± 228 |
| 18 | 0.38 | 100,000 * |
-
*(reported in Trappmann et al., 2012)
Additional files
-
Supplementary files 1
Differential Analysis_aCD3 Presence vs absence.
Lists of genes with differential expression comparing absence and presence of aCD3 stimulation on PA-gels of varying stiffness and Venn analysis of the lists.
- https://doi.org/10.7554/eLife.23190.023
-
Supplementary files 2
Gene Set Enrichment Analysis_aCD3 Presence vs Absence.
Gene set enrichment analysis results with GO-BP and KEGG databases comparing absence and presence of aCD3 stimulation on PA-gels of varying stiffness and Venn analysis of the results.
- https://doi.org/10.7554/eLife.23190.024
-
Supplementary files 3
Differential Analysis_GO-BP.
Pathway analysis results for differentially expressed genes using GO-BP database and Venn analysis of the results.
- https://doi.org/10.7554/eLife.23190.025
-
Supplementary files 4
Differential Analysis_KEGG.
Pathway analysis results for differentially expressed genes using KEGG database and Venn analysis of the results.
- https://doi.org/10.7554/eLife.23190.026
-
Supplementary files 5
Up-regulated Cluster.
List of genes in the strongly up-regulated cluster and pathway analysis results with GO-BP and KEGG databases.
- https://doi.org/10.7554/eLife.23190.027
Download links
A two-part list of links to download the article, or parts of the article, in various formats.
Downloads (link to download the article as PDF)
Open citations (links to open the citations from this article in various online reference manager services)
Cite this article (links to download the citations from this article in formats compatible with various reference manager tools)
Different TCR-induced T lymphocyte responses are potentiated by stiffness with variable sensitivity
eLife 6:e23190.
https://doi.org/10.7554/eLife.23190


