Voltage-gated Na+ currents in human dorsal root ganglion neurons
- The Second Hospital of Shandong University, China
- Lilly Research Laboratories, United States
- National Institutes of Health, United States
- University of Pittsburgh School of Medicine, United States
Figures
Figure 1
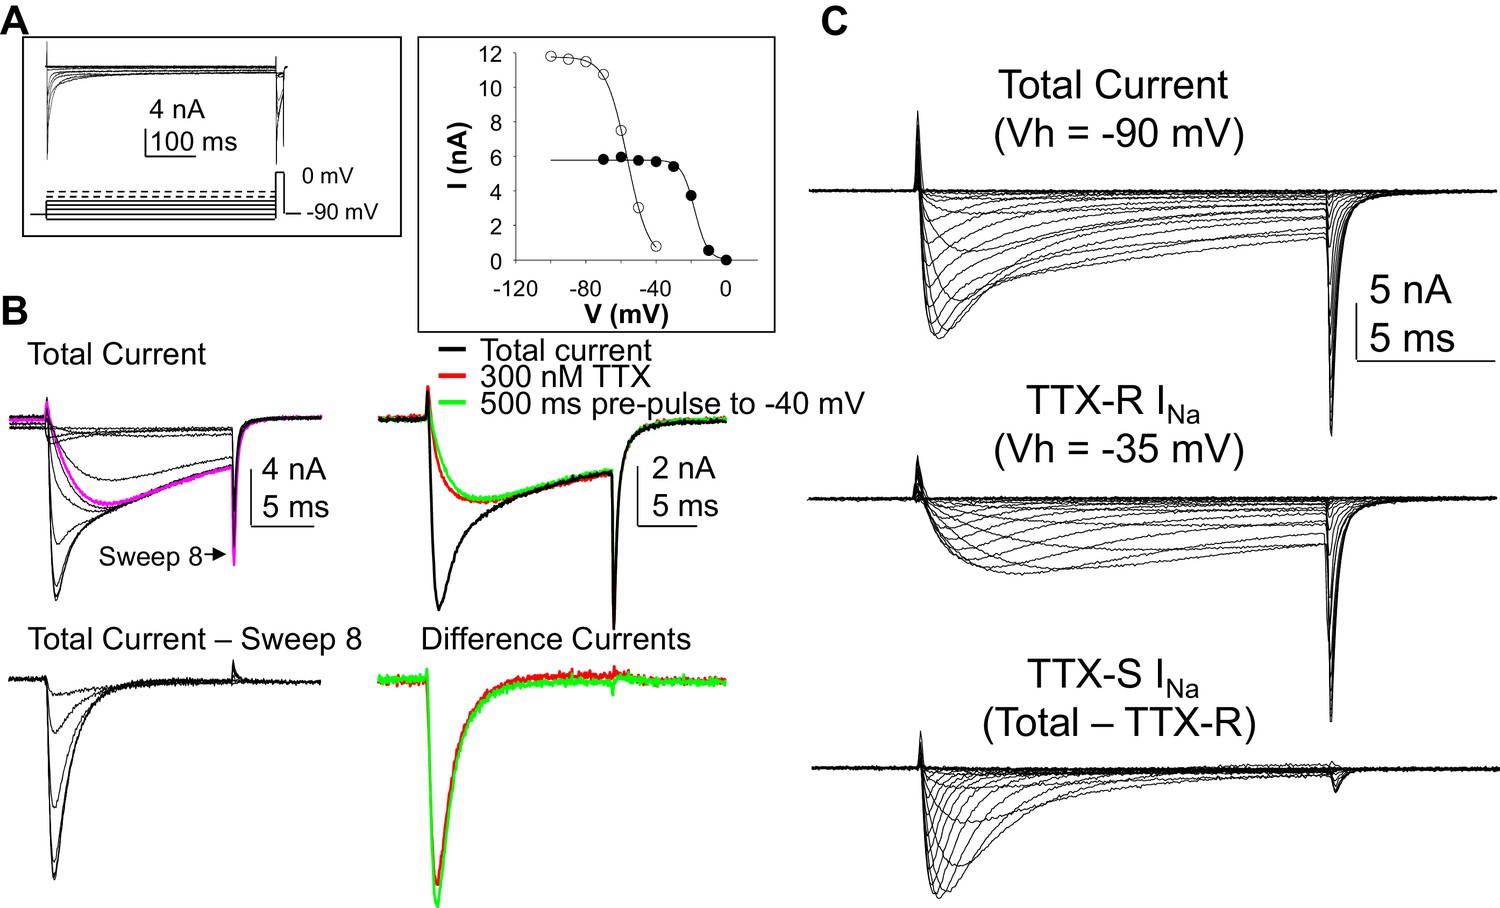
Separation of tetrodotoxin (TTX) sensitive (TTX-S) and resistant (TTX-R) voltage gated Na+ currents in human DRG neurons.
(A) A steady-state availability protocol was used to assess the voltage-dependence of inactivation of TTX-S and TTX-R currents. Left panel: The protocol consisted of a 500 ms pre-pulse to potentials between −100 and +10 mV, followed by test pulse to 0 mV. Right panel: The fast component of the current evoked at 0 mV (open circles), was inactivated over a range of test potentials more hyperpolarized than the range of test potential over which the slow component of the current evoked at 0 mV (closed circles) was inactivated. (B) Left Panel, top traces: Current evoked during the test pulse in A (left panel), plotted on a shorter time scale to more clearly illustrate the fast and slow components of the current evoked at 0 mV. Because the fast component of the current was completely inactivated with a test pulse more hyperpolarized than that at which the slow component began to inactivate, it was possible to digitally isolate the fast component by subtracting the slow component (purple trace), from the total current. Conversely, because the fast component was completely inactivated within ~10 ms of the start of the test pulse, it was possible to generate an availability curve for the slow component across the entire range of pre-pulse potentials. The bottom traces are those of the fast component digitally isolated from the slow component. Right panel, top traces: In another neuron, the steady-state availability protocol used in A, was used to inactivate the fast component of the current evoked at 0 mV. Application of 300 nM TTX removed the same component of the total current as the test pulse to −40 mV. Bottom traces: The difference between the total current and the current evoked at −40 mV, or that evoked in the presence of 300 mM TTX is virtually identical. (C). Current-voltage (I-V) protocols were used to assess current activation, with pre-pulse potentials that were based on steady-state availability data. Thus, total current (top traces) was evoked following a 500 ms pre-pulse to a potential at which currents were fully available for activation (i.e., −100 mV). TTX-R currents (middle traces) were evoked following a 500 ms pre-pulse to a potential at which TTX-S currents were completely inactivated, but TTX-R currents were fully available for activation (i.e, −35 mV). It was then possible to digitally isolate TTX-S currents (Bottom traces) from the total current by subtracting TTX-R current from the total current.
-
Figure 1—source data 1
Data plotted in Figure 1.
Data for Figure B top row on the right in the first columns. TTX-S current isolated by TTX and voltage are in columns J and K. Inactivation data plotted in Figure 1A right are in columns N-Q. Raw data in Figure 1A are in columns S-F, with the expanded time scale of these data in Figure 1B in columns AH-AU. IV data in Figure 1C are in the remaining columns.
- https://doi.org/10.7554/eLife.23235.004
Figure 2

The size distribution of human and rat DRG neurons.
(A) A histogram of the size distribution of all of the human (n = 226) and rat (n = 44) DRG neurons included in this study. Membrane capacitance was used as an indirect measure of cell size, since the capacitance is a reflection of the cell surface area. Capacitance was determined with amplifier circuitry. The average membrane capacitance of human DRG neurons was 116 pF, while that of rat DRG neurons was 36 pF. Inset: The cell size distribution of human DRG neurons from cryosections (20 μm) of paraformaldehyde post-fixed DRG. Data are from 20 sections, collected at 200 μm intervals, from each of three donors. Data from neurons studied with patch-clamp (Recording) have been replotted for comparison, where membrane capacitance was used to estimate cell body diameter based on the assumption that the capacitance of human DRG neurons is one μF/cm2. An example of the tissue counted for this analyses is shown, where the scale bar is 50 μm. (B) In the neurons studied in which peak TTX-S and TTX-R were determined, the ratio of TTX-S to TTX-R current density was significantly greater in human (n = 71) than rat (n = 26) DRG neurons. ** is p<0.01.
-
Figure 2—source data 1
Data plotted in Figure 2.
- https://doi.org/10.7554/eLife.23235.006
Figure 3
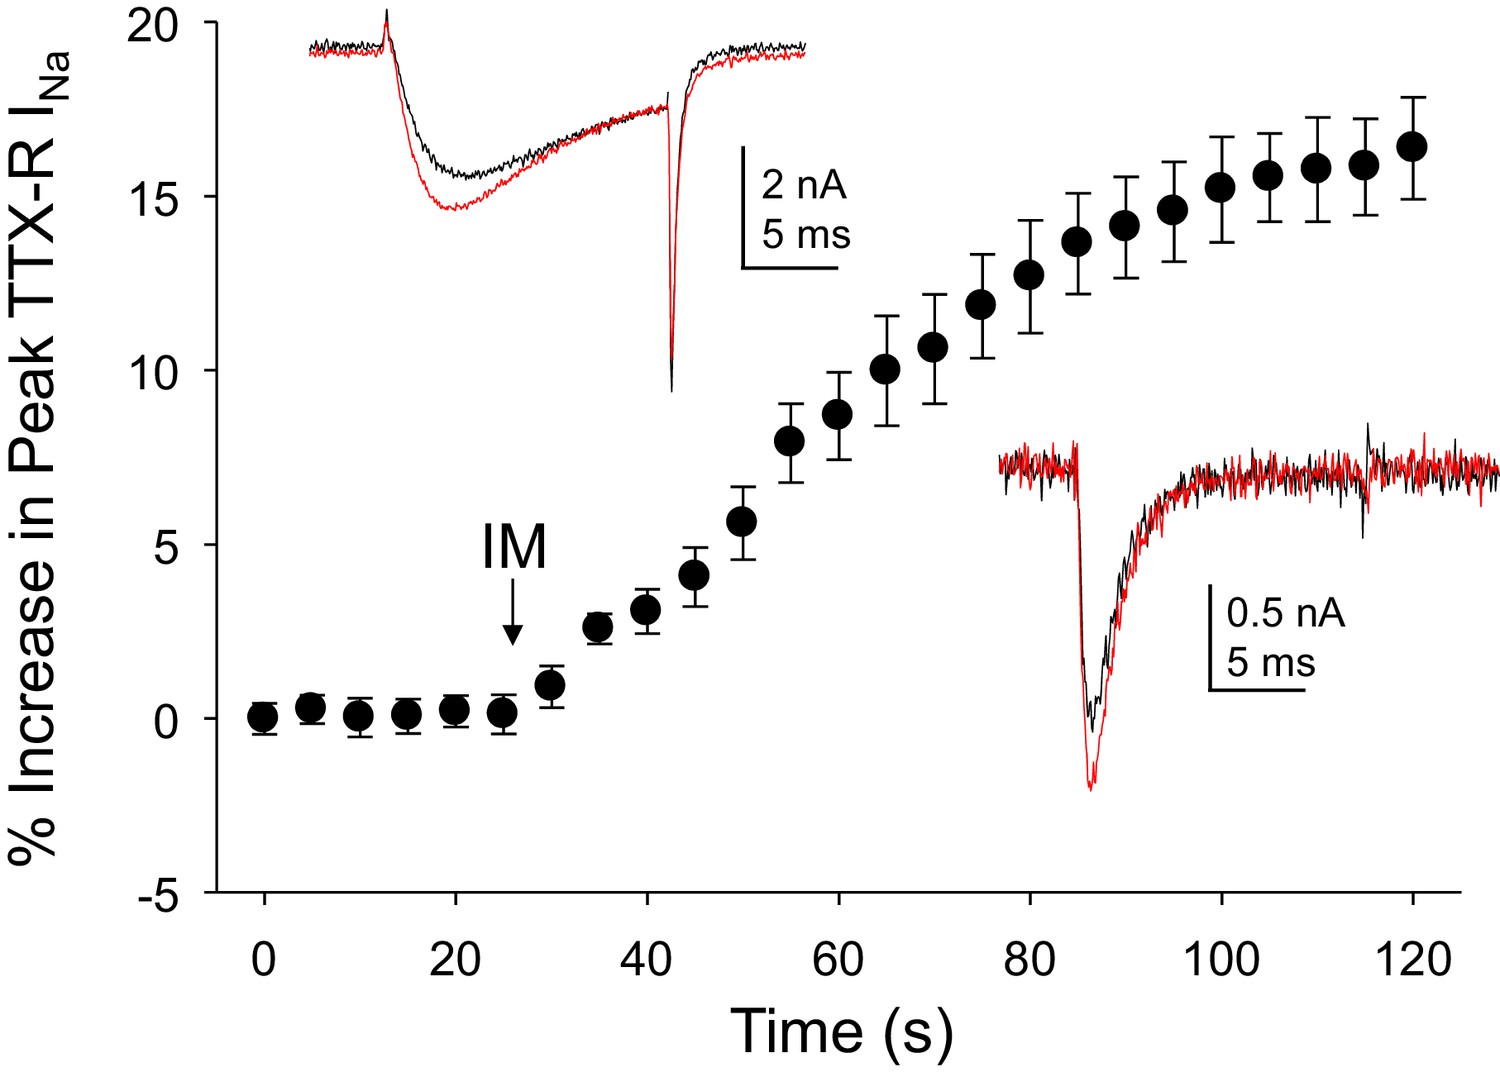
Inflammatory mediators (IM) increase Na+ current in human DRG neurons.
A combination of bradykinin (10 μM), histamine (1 μM) and prostaglandin E2 (1 μM) was bath applied to neurons after establishing the stability of evoked currents. (A) TTX-R currents were increased within seconds of IM application, and this increase was largely saturated within 90 s. In 13 of 17 neurons tested, the average increase in peak TTX-R current was 15 ± 1%. TTX-S currents were increased by 30 ± 6% in four of 10 neurons tested. Insets: Typical traces of TTX-R (above) and TTX-S (below) current evoked with a voltage step to 0 mV before (black) and after (red) IM application, following a 500 ms prepulse to −40 mV or −90 mV, respectively.
-
Figure 3—source data 1
Data plotted in Figure 3.
Data for the TTX-R current in the top inset are in columns B-D. Data for the TTX-S current in the bottom inset in are in columns F-H. Pooled response of TTX-R current to inflammatory mediator are in columns J-L.
- https://doi.org/10.7554/eLife.23235.008
Figure 4
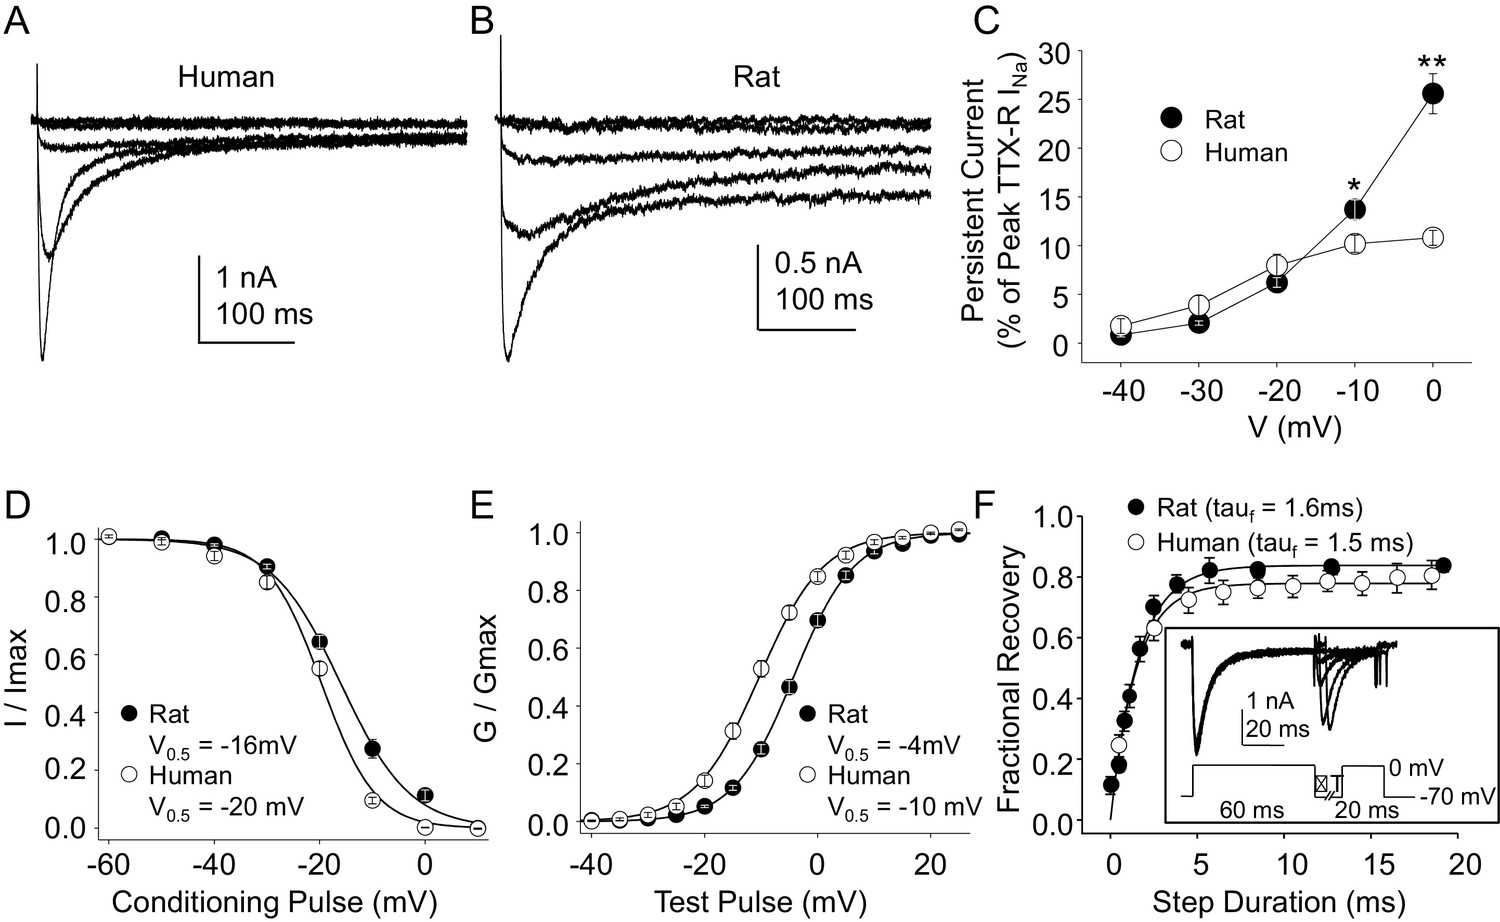
Steady-state biophysical properties of TTX-R currents in human and rat DRG neurons.
(A) A 500 ms test pulse to potentials between −40 and 0 mV from a holding potential of −40 mV was used to assess the presence of persistent TTX-R current in human (A) and rat (B) DRG neurons. (C) The mean (± SEM) of persistent current analyzed as the % of the peak TTX-R current, is plotted relative to the voltage at which the current was evoked in neurons from rat (n = 30) and human (n = 34). (D) Steady-state inactivation of TTX-R current was assessed with the protocol shown in Figure 1. Availability curves were fitted with a modified Boltzmann equation to determine Imax, the slope and the voltage at which TTX-R current were half inactivated (V0.5). Data for each neuron were then normalized to the calculated Imax. There was small but significant difference in the V0.5 of inactivation of TTX-R current in neurons from rat (n = 25) and human (n = 99, although data plotted were 25 neurons to facilitate comparisons with rat data). (E) G-V curves were generated from I-V data and fitted with a modified Boltzmann equation to determine Gmax, the slope, and the voltage (V0.5) at which conductance was half of Gmax. Data for each neuron were normalized to the calculated Gmax. There was a small but significant difference in the V0.5 of activation of TTX-R current in neurons from rat (n = 25) and human (n = 123, although data plotted were again from 25 neurons to facilitate comparisons with rat data). (F) Recovery from inactivation of TTX-R current was assessed with a two pulse protocol shown at the inset, the extent of recovery from inactivation was determined by comparing the peak inward current evoked during the test pulse(second) to that evoked during the conditioning pulse(first). This ratio is plotted relative to the interpulse duration. Recovery curves were fitted with a double exponential. Recovery from inactivation of TTX-R current in neurons from rat (n = 10) and human (n = 13) were comparable.
-
Figure 4—source data 1
Data plotted in Figure 4.
- https://doi.org/10.7554/eLife.23235.010
Figure 5
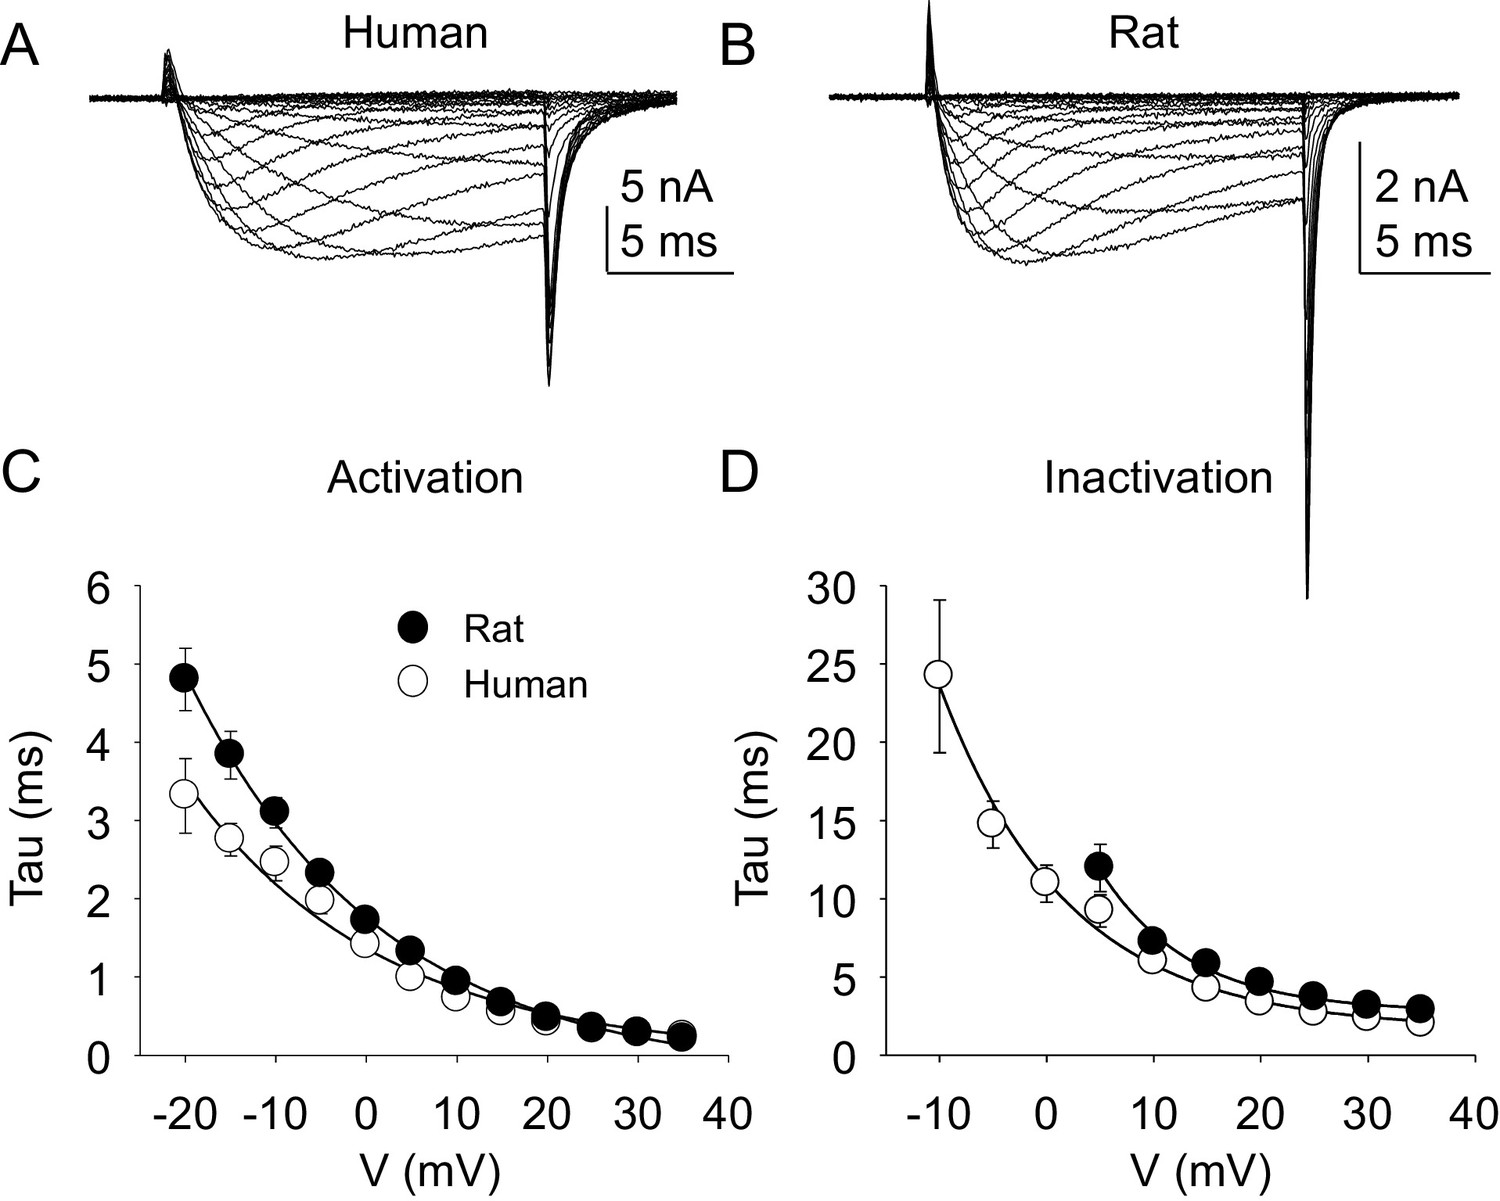
Kinetic properties of TTX-R current in human and rat DRG neurons.
TTX-R I-V data from human (A) and rat (B) DRG neurons was used to assess the voltage-dependence of the rates of current activation (C) and inactivation (D). Currents were evoked with 15 ms voltage steps to potentials ranging between −40 mV and +40 mV, following a 500 ms pre-pulse to a potential at which TTX-S currents were completely inactivated and TTX-R currents were fully available for activation. That potential was −40 mV for the neurons studied in A, and B. The rising phase of TTX-R current at each potential was fitted with a single exponential to determine the rate of current activation. The falling phase of the TTX-R current during each depolarizing voltage step was fitted with a single exponential to determine the rate of current inactivation. Data in each plot are from 25 rat neurons and 27 human neurons.
-
Figure 5—source data 1
Data plotted in Figure 5.
- https://doi.org/10.7554/eLife.23235.012
Figure 6
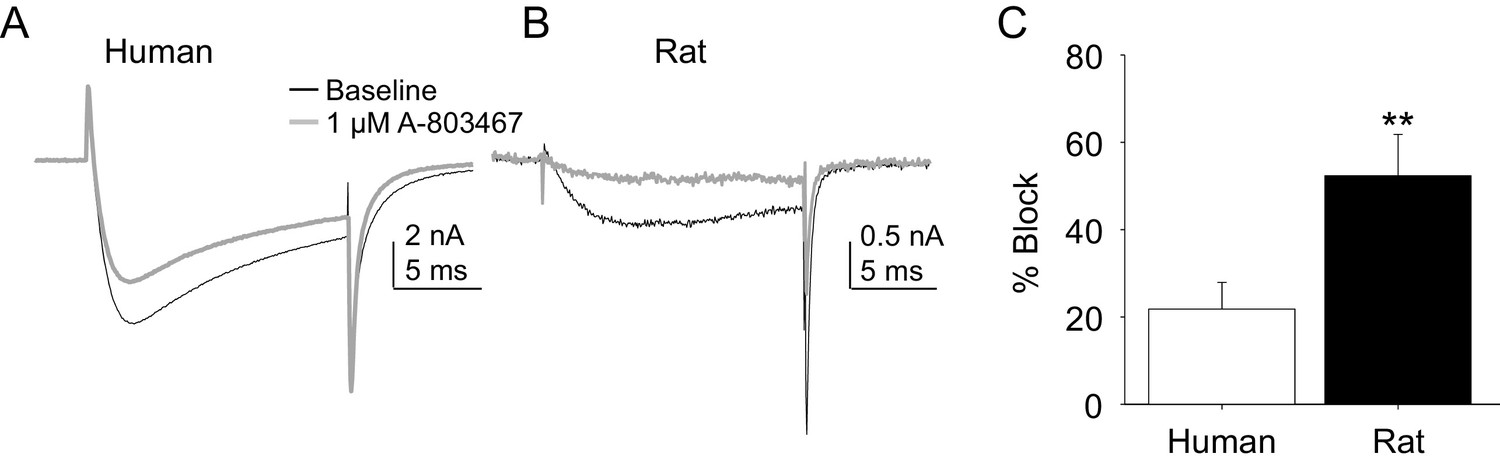
Impact of A-803467 on TTX-R current in human and rat DRG neurons.
TTX-R current was evoked with a 15 ms depolarizing voltage step to 0 mV every 10 s, following a 500 ms prepulse to −65 mV in (A), and −40 mV in (B) Current evoked before (black) and after (grey) application of A-803467 (1 μM) to a human (A) and a rat (B) DRG neuron. Of note, as a prepulse to −65 mV would not inactivate all the TTX-S current in the human DRG neuron, the more rapid current activation likely reflects the contaminating presence of this faster current. Nevertheless, there is only a small reduction in current at the end of the test pulse. (C) The mean block of current in rat neurons (n = 4) was significantly greater than that in human neurons (n = 4). Of note, no detectable block was observed in eight other human neurons tested with lower concentrations of A-803467 (30–300 nM).
-
Figure 6—source data 1
Data plotted in Figure 6.
- https://doi.org/10.7554/eLife.23235.014
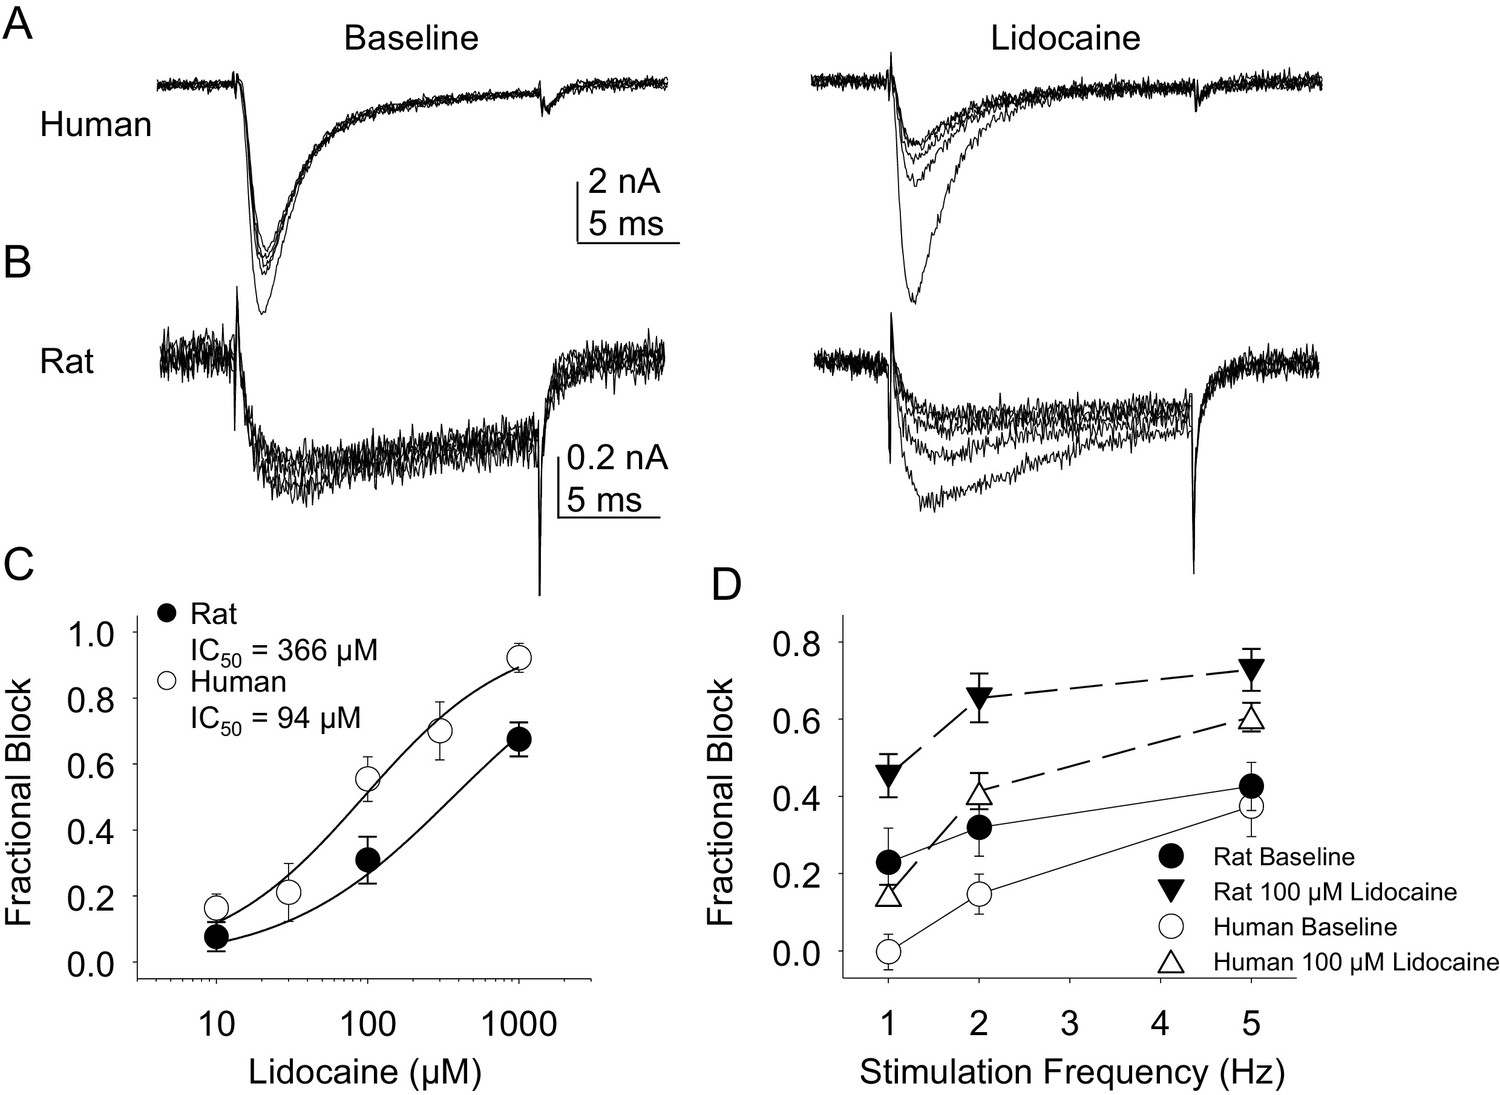
Figure 7
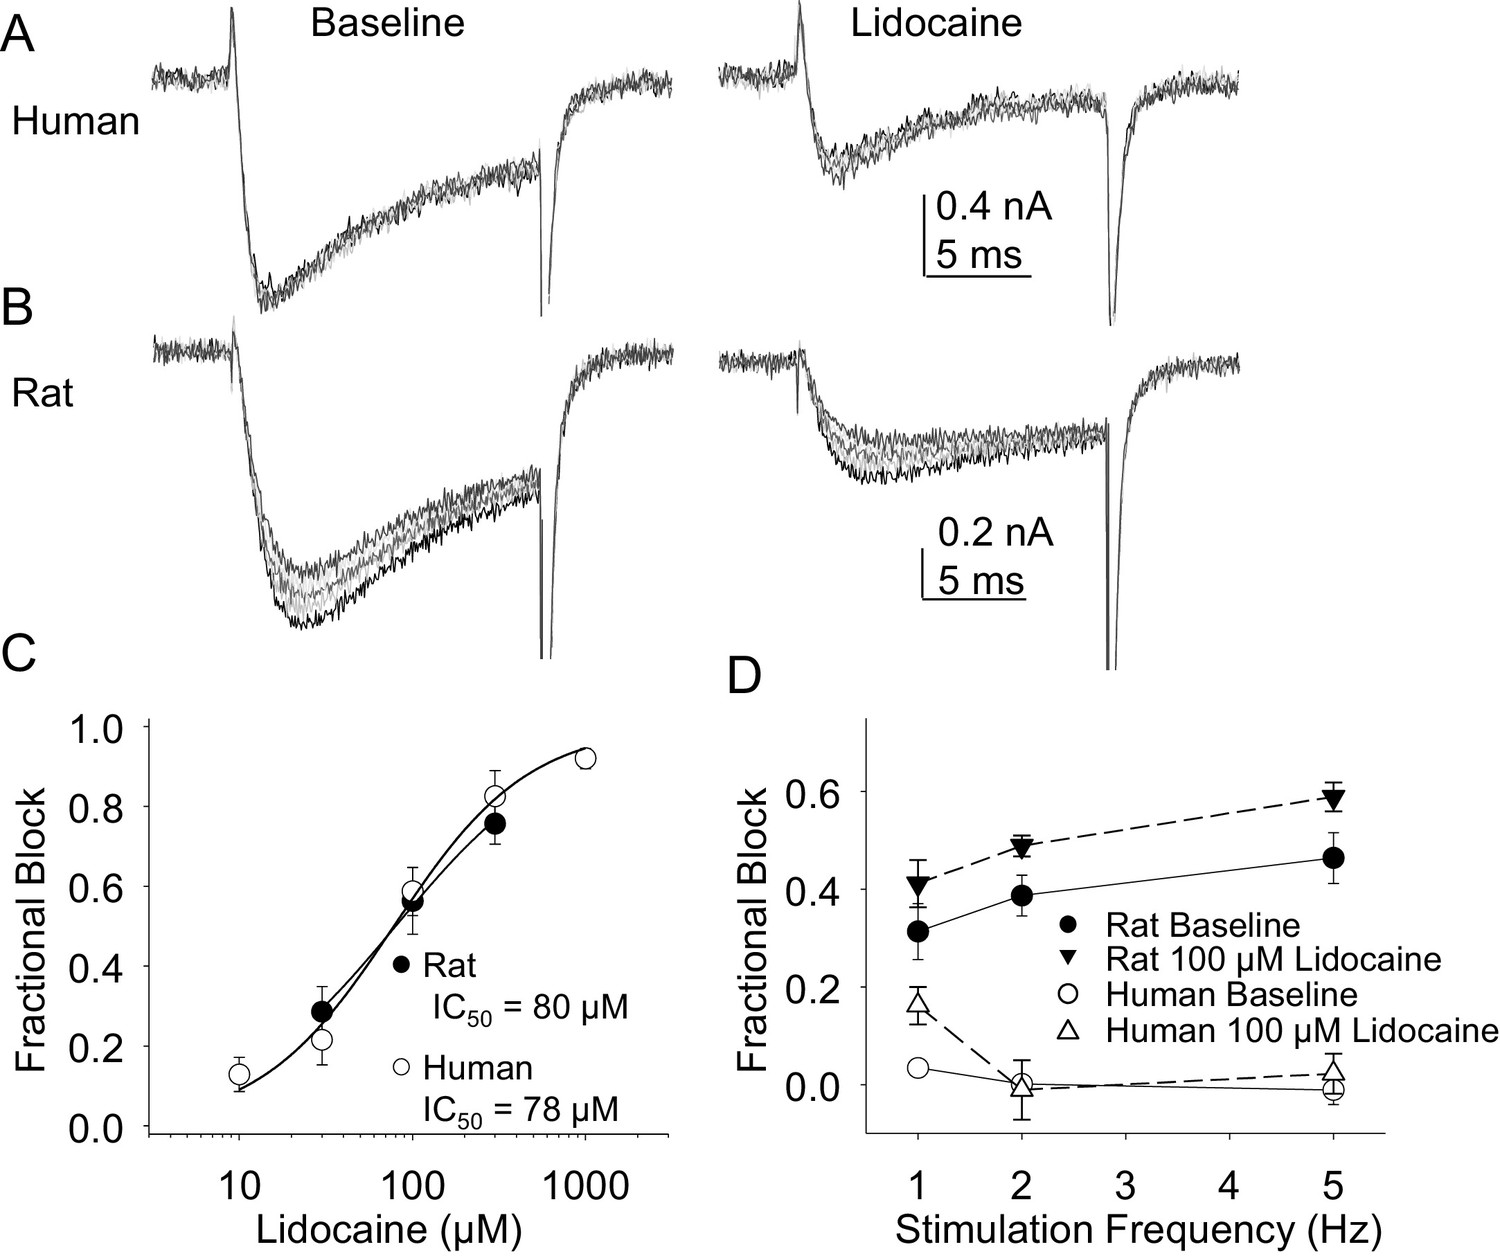
Resting and use-dependent block of TTX-R currents with lidocaine in human and rat DRG neurons.
TTX-R current was evoked twenty times with a voltage step to 0 mV at 1, 2 and 5 Hz before and after the application of lidocaine. The responses to the first five voltage steps evoked at 2 Hz before and after 100 µM lidocaine are shown for a human (A, evoked from a holding potential of −40 mV) and rat (B, evoked from a holding potential of −35 mV) DRG neuron. (C) Lidocaine-induced steady-state block of TTX-R current was assessed ~three minutes after application of each concentration of lidocaine, prior to the initiation of the use-dependent block protocols. The steady-state block of currents in human (n = 9) and rat (n = 10) neurons were comparable. (D) Use-dependent block, calculated as the fraction of current evoked at the 20th pulse relative to that evoked with the first (P20/P1). Use-dependent block of TTX-R current observed in rat DRG neurons was increased in the presence of lidocaine. In contrast, there was little use-dependent block of TTX-R currents in human DRG neurons in the absence of lidocaine, and the only evidence of a lidocaine-induced increase in use-dependent block was observed at a stimulation frequency of 1 Hz.
-
Figure 7—source data 1
Data plotted in Figure 7.
- https://doi.org/10.7554/eLife.23235.016
Figure 8

Steady-state biophysical properties of TTX-S current in human and rat DRG neurons.
TTX-S currents were isolated as described in Figure 1. Steady-state availability (A), activation (B), and recovery from inactivation (C) data were collected for TTX-S currents as described for TTX-R currents in Figure 4, except that the holding and recovery potential were −90 mV. Availability data were from 29 rat neurons and 99 human neurons (although data from only 29 neurons are plotted, to facilitate comparisons between human and rat). G-V data were also from 29 rat neurons, and from 128 human neurons (although data from only 29 neurons is plotted). Recovery data are from the 8seven rat neurons and 8 human neurons. The faction of current recovered with a fast time constant in human neurons was significantly greater than that in rat neurons.
-
Figure 8—source data 1
Data plotted in Figure 8.
- https://doi.org/10.7554/eLife.23235.018
Figure 9
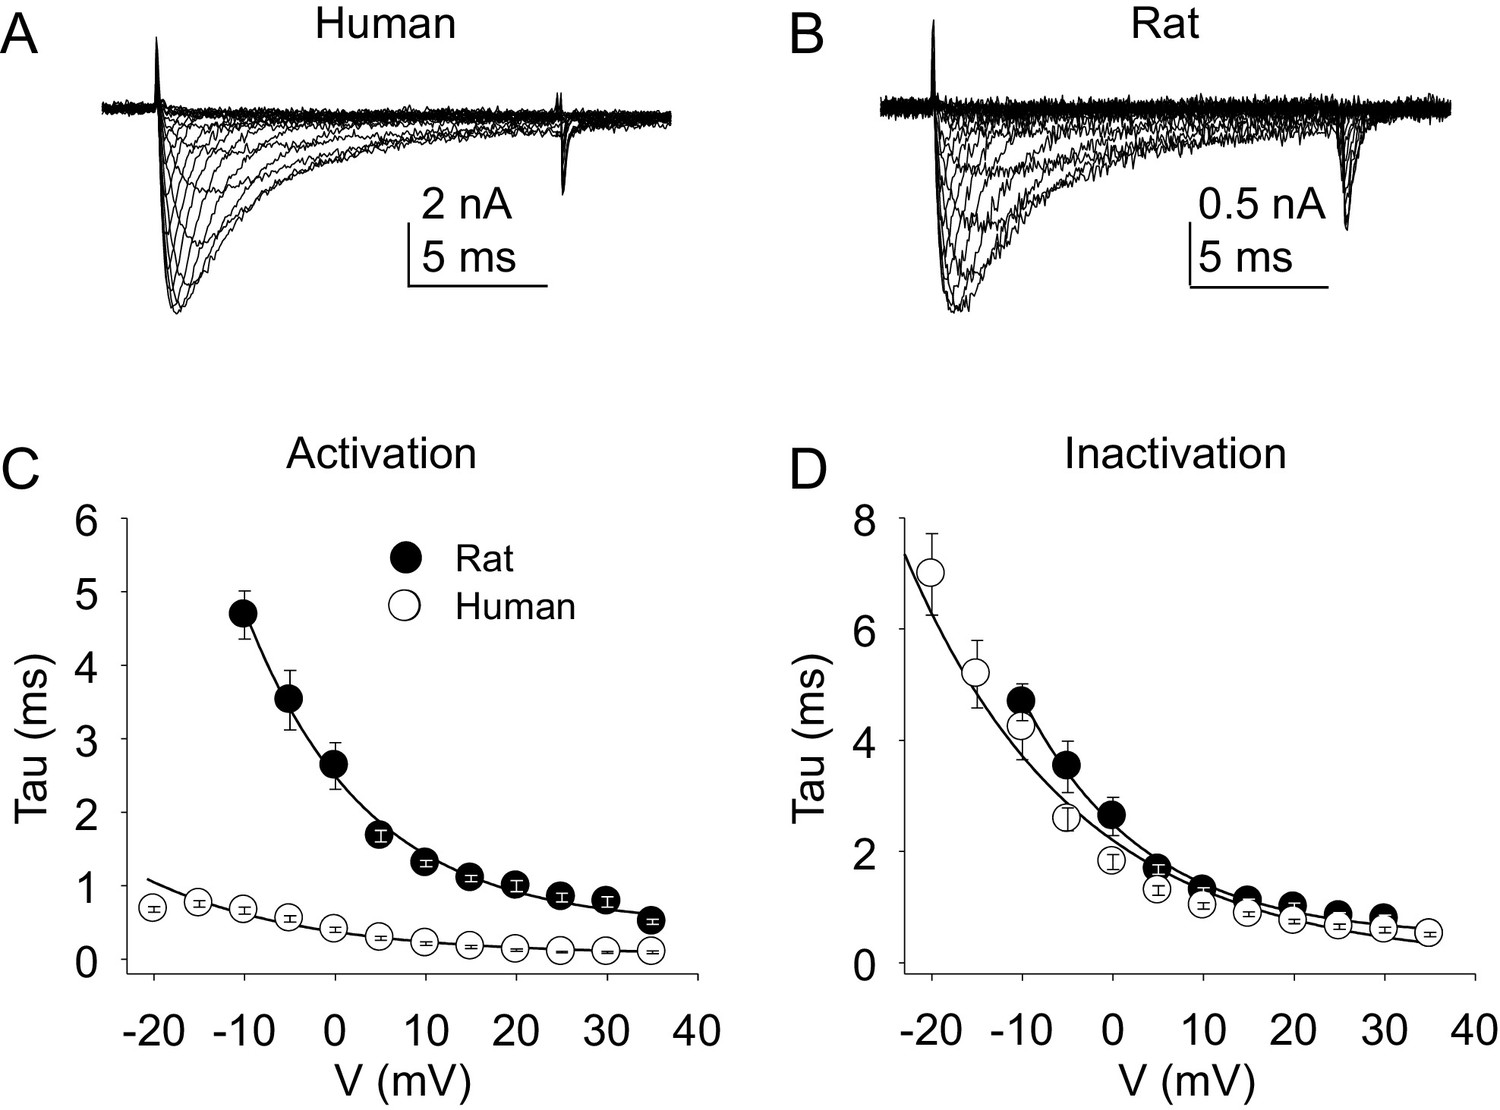
Kinetic properties of TTX-S current in human and rat DRG neurons.
TTX-S I-V data from human (A) and rat (B) DRG neurons was used to assess the voltage-dependence of the rates of current activation (C) and inactivation (D). Current was isolated as described in Figure 1, where in the neurons shown in (A), and (B), the pre-pulse potential was −90 mV to evoke total current, and –35 and –40 mV to inactivate TTX-S currents in the human and rat neuron, respectively. Activation and inactivation rates were determined as described in Figure 5. The activation of currents in human DRG neurons (n = 128, although data from only 29 are plotted to facilitate comparisons with rat data) was significantly faster, and demonstrated significantly less voltage-dependence than TTX-S currents from rat DRG neurons (n = 29). However, inactivation rates and the voltage-dependence of this process was comparable in currents from rat and human neurons.
-
Figure 9—source data 1
Data plotted in Figure 9.
- https://doi.org/10.7554/eLife.23235.020
Figure 10
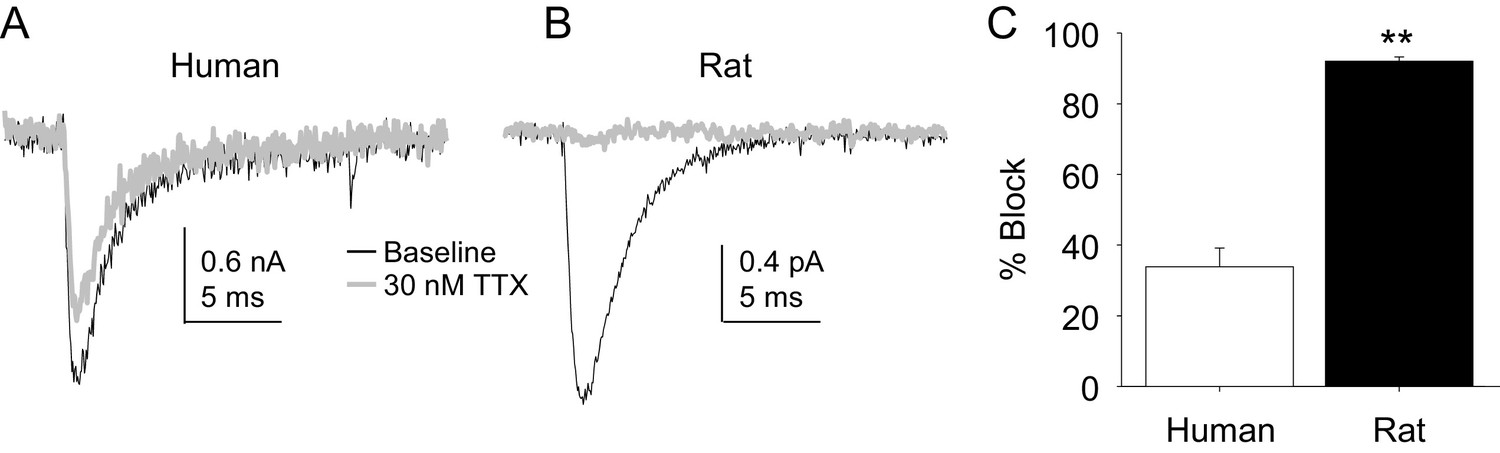
The potency of TTX block of TTX-S currents was lower in human than in rat DRG neurons.
TTX-S currents isolated as described in Figure 1 where in the neurons shown in (A) (human), and (B) (rat), the pre-pulse potential was −90 mV to evoke total current, and −40 mV to inactivate TTX-S currents in both the human and rat neurons shown. Currents were evoked before and after 30 nM TTX application. (C). The fractional block of TTX-S current produced by 30 nM was significantly (p<0.01) greater in rat (n = 9) than in human (n = 8) DRG neurons.
-
Figure 10—source data 1
Data plotted in Figure 10.
Data for human raw currents in Figure 10A are in columns G-I. Data for Figure 10B are in columns B-D. Data for Figure 10C are in columns L-M.
- https://doi.org/10.7554/eLife.23235.022
Figure 11
Resting and use-dependent block of TTX-S currents with lidocaine in human and rat DRG neurons.
Currents were evoked in neurons from human (A) and rat (B), as described in Figure 7 with a voltage step to −25 mV from a holding potential of −90 mV. (C). Lidocaine-induced steady-state block of TTX-S currents was also determined as in Figure 7. However, in contrast to TTX-R currents, the potency of lidocaine-induced block of TTX-S currents in human DRG neurons (n = 8) was significantly higher than that in rat DRG neurons (n = 13). (D). Lidocaine was associated with a significant increase in use-dependent block of TTX-S currents, assessed at 1, 2 and 5 Hz, in both human and rat neurons.
-
Figure 11—source data 1
Data plotted in Figure 11.
Data for Figure 11B are in columns U-AG. Data for Figure 11C are in columns B-F. Data for Figure 11D are in columns I-R.
- https://doi.org/10.7554/eLife.23235.024
Figure 12

The contribution of NaV1.7 to TTX-S currents in human DRG neurons.
(A) Ramp currents were evoked with a voltage-clamp protocol consisting of a depolarization from −100 mV to 0 mV over 500 ms following a 500 ms voltage-step to −90 mV. Peak inward current evoked in response to the ramp was seen at −5.9 ± 0.6 mV (n = 74). (B) Top traces: TTX-S currents evoked at 0 mV, isolated as described in Figure 1 from a human DRG neuron with 500 ms voltage-steps to −90 mV and −35 mV prior to the voltage-step to 0 mV, to activate total current and inactivate TTX-S current, respectively. Currents were evoked before and after 10 nM Pro-Tx II. Comparable data were obtained in 8 other neurons tested. Bottom traces: The same concentration of toxin blocked a fraction of TTX-S currents in a rat DRG neuron, isolated with 500 ms voltage-steps to −90 mV and −40 mV prior to the voltage-step to −5 mV. While the fraction of block was variable, a fraction of TTX-S current was blocked in the five other neurons studied. (C) Pre-incubating human DRG neurons with 100 nM PF-05089771 for 30 min prior to study (left traces) was associated with an almost complete block of TTX-S currents (top traces), as well as a significant reduction in TTX-R currents (bottom traces). TTX-S current isolated from TTX-R current as described in Figure 1, with pre-pulse potential to −90 mV and −35 mV, for both the control neuron (left traces) and the treated neuron (right traces). Control neurons were run in parallel with pre-incubation times in bath solution identical to the neurons pre-incubated with PF-05089771. (D) The inhibition of both TTX-S and TTX-R currents by PF-05089771 was concentration dependent, were the average current density in control neurons run in parallel with treated neurons was used to assess the magnitude of current block. Pooled data are from three donor, with 5–6 neurons per concentration and 13 neurons in the control group. Data were fitted with a modified Hill equation, which yielded an IC50 of 6 nM for block of TTX-S current and 47 nM for block of TTX-R current.
-
Figure 12—source data 1
Data plotted in Figure 12.
Data for human raw currents in Figure 12A are in columns B-C. Data for raw currents in Figure 12B are in columns F-M. Data for XS currents Figure 12C are in columns P-BF. Data for XR currents in Figure 12C are in columns BH-CX. Data for Figure 12D are in columns DC-DI.
- https://doi.org/10.7554/eLife.23235.026
Tables
Table 1
Donor demographics and Na+ current density.
| Sex | Age (yrs) | TTX-R INa Current Density (pA/pF) | TTX-S INa Current Density (pA/pF) |
|---|---|---|---|
| Male (n = 13) | 40.9 ± 4.9 (1 Latin American, 1 African American, 11 Caucasian ) | −42.5 ± 2.7 (n = 69) | −66.2 ± 5.0 (n = 51) |
| Female (n = 8) | 52.3 ± 5.4 (all Caucasian) | −46.1 ± 5.3 (n = 50) | −54.4 ± 8.2 (n = 31) |
-
Data are mean ± SEM. Differences between males and females are not statistically significant (p > 0.05).
Download links
A two-part list of links to download the article, or parts of the article, in various formats.
Downloads (link to download the article as PDF)
Open citations (links to open the citations from this article in various online reference manager services)
Cite this article (links to download the citations from this article in formats compatible with various reference manager tools)
Voltage-gated Na+ currents in human dorsal root ganglion neurons
eLife 6:e23235.
https://doi.org/10.7554/eLife.23235


