Rai1 frees mice from the repression of active wake behaviors by light
- University of Lausanne, Switzerland
Figures
Figure 1 with 1 supplement
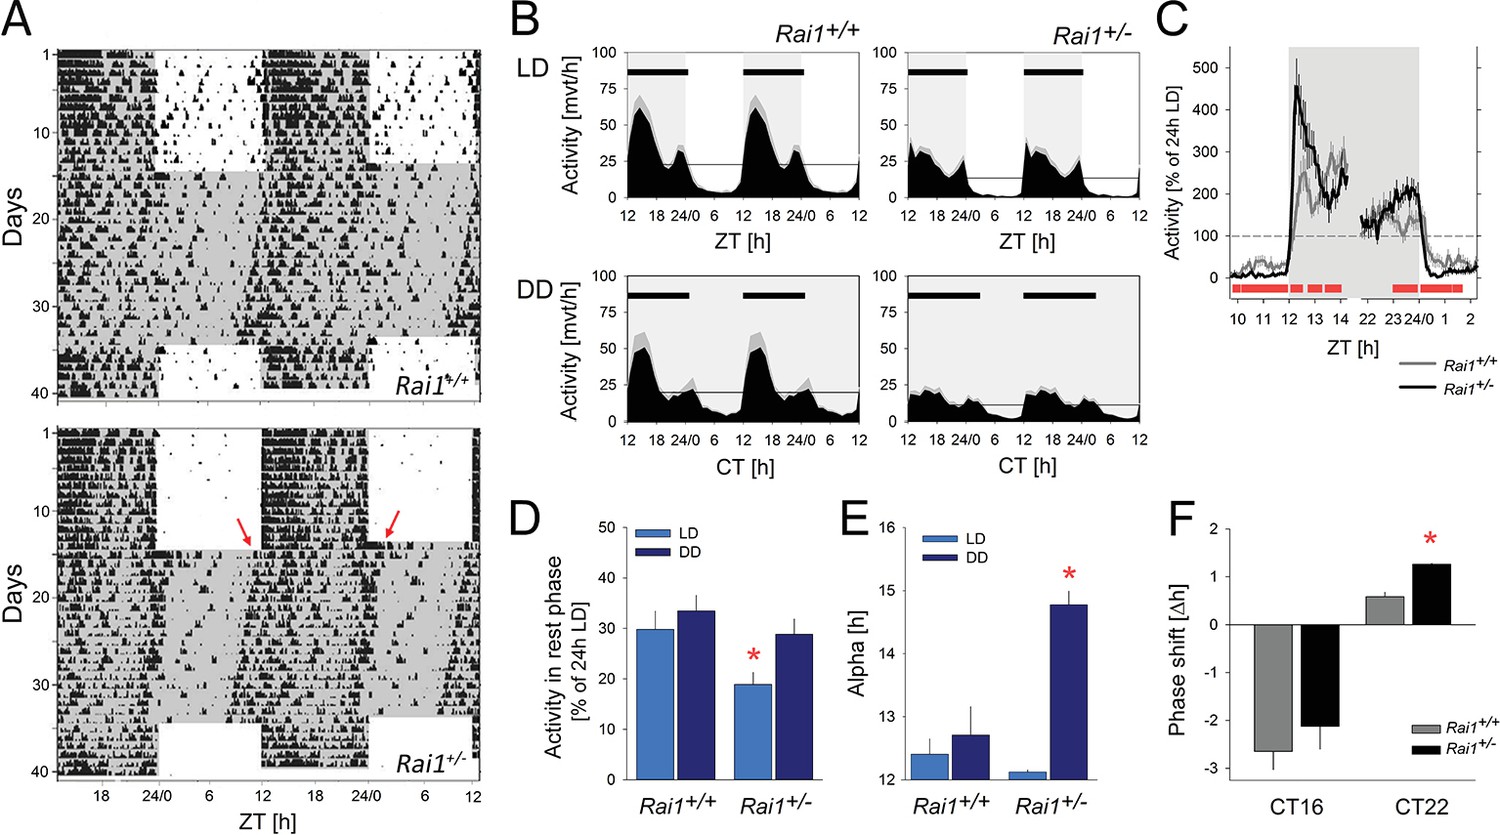
Marked suppression of locomotor activity by light in Rai1+/- mice.
(A) Representative double-plotted actograms of one wild-type Rai1+/+ (top) and one Rai1+/- mouse (bottom panel), under 14 days of LD12:12 and 20 days of constant darkness (DD). Grey areas mark darkness. Note that in Rai1+/- mice activity is restricted to the dark periods under LD12:12 and that after the transition into DD its active period (alpha) expands with an earlier onset and a delayed offset (red arrows) of activity. (B) Average profiles of hourly activity values (black area with SEM in grey) under LD12:12 (top) and DD (bottom panels) for Rai1+/+ (left; n = 11) and Rai1+/- (right panels; n = 12). Light-grey areas denote periods of darkness. Horizontal black bars indicate mean active periods (alpha or α; see also Panel E). Note the alpha expansion under DD and overall lower activity in Rai1+/- mice. Horizontal lines indicate average 24 hr activity levels for each genotype under each condition. The LD12:12 average activity levels were used in Panels C and D to correct for genotype differences in overall activity levels. (C) The suppression of activity by light in Rai1+/- mice under LD12:12 was abrupt and the relative increase in activity immediately following dark onset and immediately preceding light onset were ~2 fold larger than in wild-type mice. Values were expressed as % of each animal’s 24 hr average activity under LD12:12 conditions (=100% dashed horizontal line). (D) Even after correcting for individual differences in overall activity (set to 100% as in C), activity in the 12 hr light periods remains lower in Rai1+/- mice compared to wild-type littermates (light blue bars; p<0.05, t-test) and also compared to their own activity during the rest phase under DD (rho or ρ; dark blue bars; *p<0.01, paired t-test). (E) Comparison of alpha under LD12:12 and DD conditions. Alpha expansion was observed only in Rai1+/- mice (*p<0.001, paired t-test). (F) A light pulse at CT22 elicited a ~ 1 hr larger phase advance in Rai1+/- mice compared to wild-type littermates (*p<0.005, t-test), while a light pulse administered at CT16 resulted in the expected phase delay. Note that this experiment was performed in a separate cohort of mice (Rai1+/- n = 4; Rai1+/+ n = 5). Error bars represent SEMs.
-
Figure 1—source data 1
Excel file with data sheets corresponding to each figure panel containing the numerical values on which Figure 1 and Figure 1—figure supplement 1 are based.
For Figure 1 panels D-F and Figure 1—figure supplement 1 individual data are provided as well.
- https://doi.org/10.7554/eLife.23292.003
Figure 1—figure supplement 1
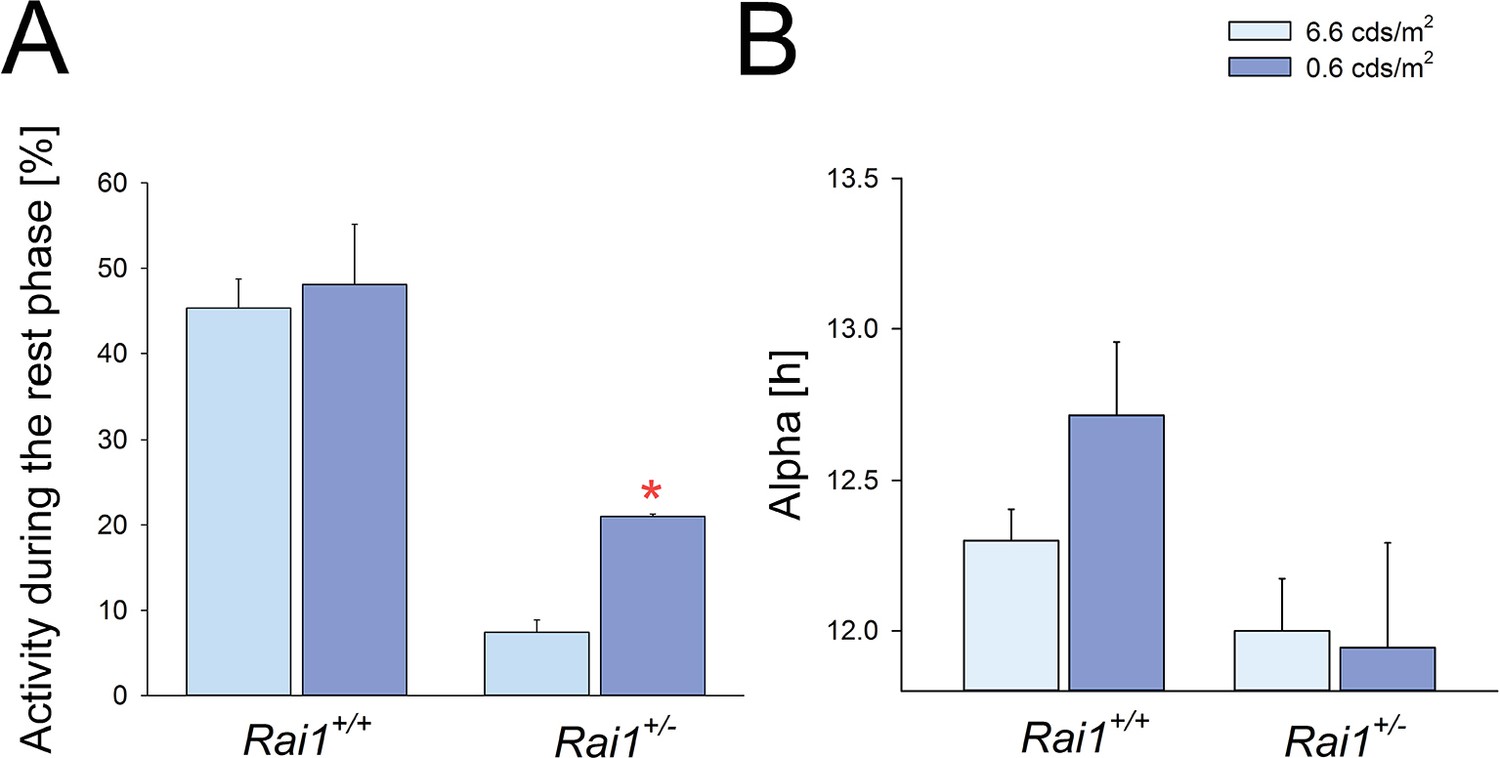
The effects of lowering light intensity on duration of the active phase (alpha) and locomotor activity.
(A) The level of locomotor activity during the light phase of the LD12:12 schedule did not differ between low-light intensity (0.6 cdm/m2) and the habitual (6.6 cdm/m2) light intensity in wild-type mice. In Rai1+/- mice the level of locomotor activity was higher under 0.6 compared to 6.6 cdm/m2 (*p<0.01; t-test). Despite this increase, activity during the rest or light phase in Rai1+/- mice was still reduced compared to wild-type (p<0.05; t-test), also at the low light intensity. Relative activity is calculated as % of the individual total 24 hr activity under LD12:12 at 6.6 cdm/m2. (B) In neither genotype was alpha significantly affected by lowering light intensity and in Rai1+/- mice did not differ from 12 hr; that is, the length of the dark phase (Rai1+/- n = 3; Rai1+/+ n = 5).
Figure 2
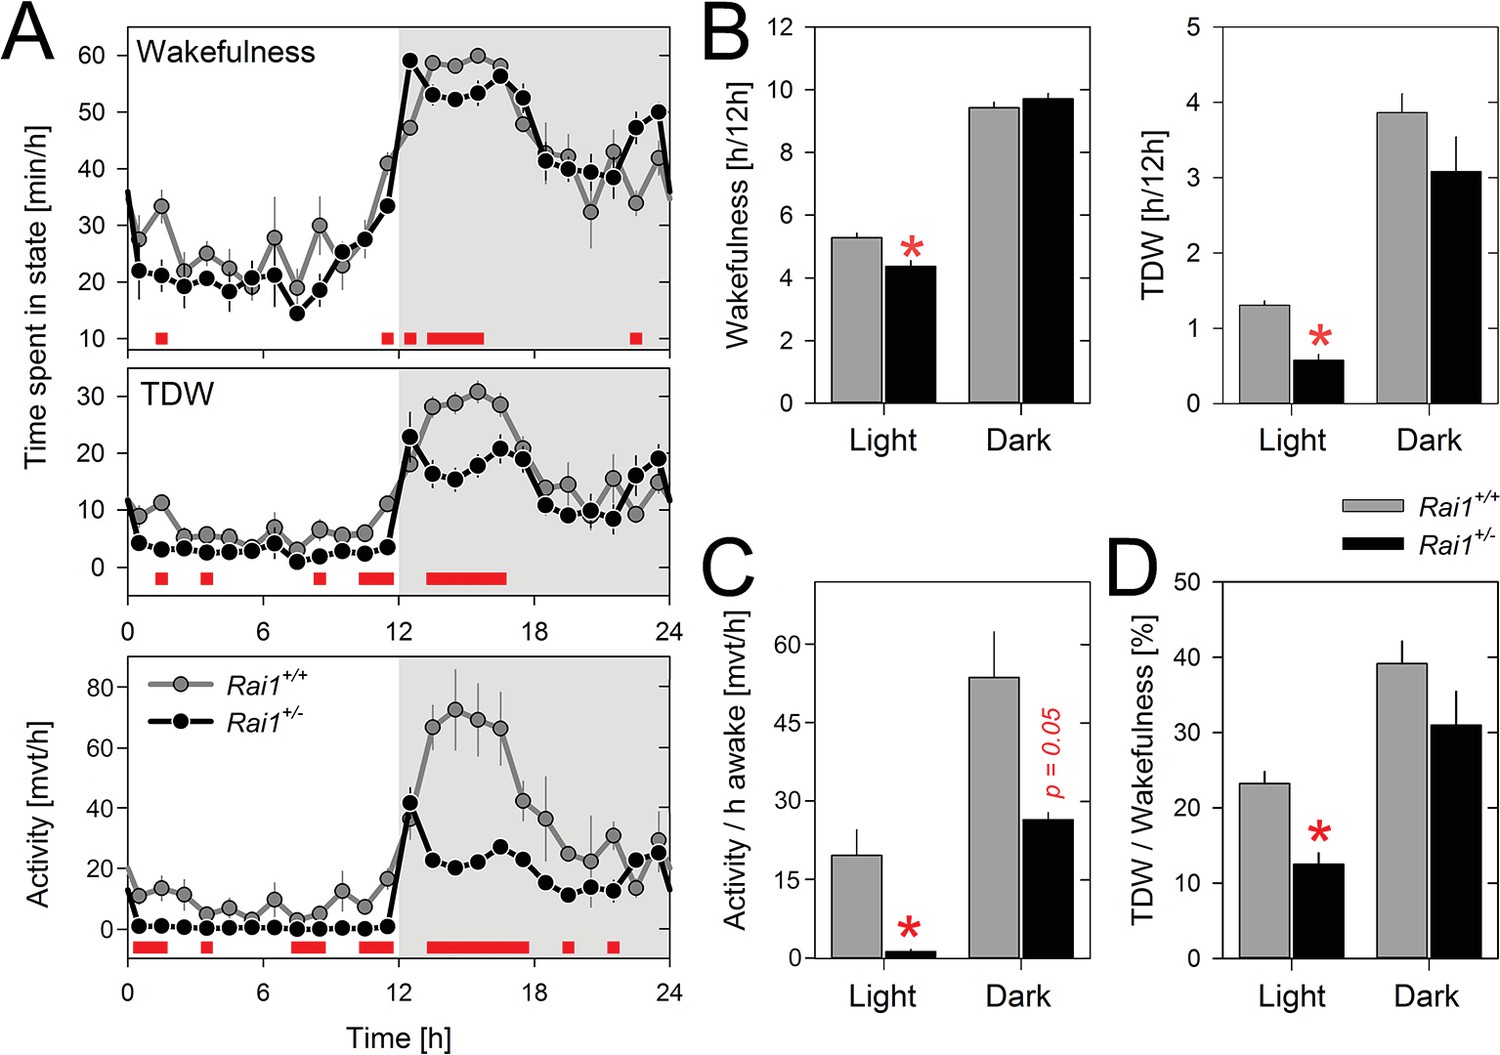
Theta-dominated wakefulness (TDW), but not total time-spent-awake, is profoundly suppressed by light in Rai1+/- mice.
(A) Average profile of mean 1 hr values of wakefulness (total wakefulness including TDW), TDW (middle), and locomotor activity (bottom panels) under LD12:12 conditions (n = 4/genotype). Values of two 24 hr baseline days were averaged. Although Rai1+/- mice are awake longer than their littermates immediately after dark onset and before light onset, the two genotypes did not differ in time-spent-awake over 24 hr. TDW and activity levels were, however, generally below those observed in wild-type mice (red bars; p<0.05; t-tests). Note that while Rai1+/- mice did not show any evidence of dark anticipation in TDW and locomotor activity, we did observe this for wakefulness. In wild-type, levels of wakefulness, TDW, and activity all increase in the hour preceding dark onset. (B) Although 24 hr values of total time-spent-awake did not differ between genotypes, we did observe a slight, but significant reduction in Rai1+/- mice during the 12 hr light period (*p<0.05, t-test; left panel). Similarly, TDW levels in the light were reduced (*p<0.001; t-test, right panel) but unlike for wakefulness, we did observe an overall reduction in TDW (p<0.05; t-test), compared to wild type. (C) Number of movements expressed per hour of total wakefulness were profoundly reduced in Rai1+/- mice, especially during the light phase (*p<0.001; t-test) and (D) this result was paralleled by a reduction in TDW expressed as a percentage of total wakefulness during the light period, in Rai1+/- mice (*p<0.05; t-test). Error bars represent SEMs.
-
Figure 2—source data 1
Twenty-four hour values for total wakefulness, theta-dominated wakefulness (TDW), NREM sleep, and REM sleep under LD12:12 conditions.
n = 4/genotype.
- https://doi.org/10.7554/eLife.23292.006
-
Figure 2—source data 2
Excel file with data sheets corresponding to each figure panel containing the numerical values on which the Figure 2 graphs are based.
For all panels individual data are provided as well.
- https://doi.org/10.7554/eLife.23292.007
Figure 3
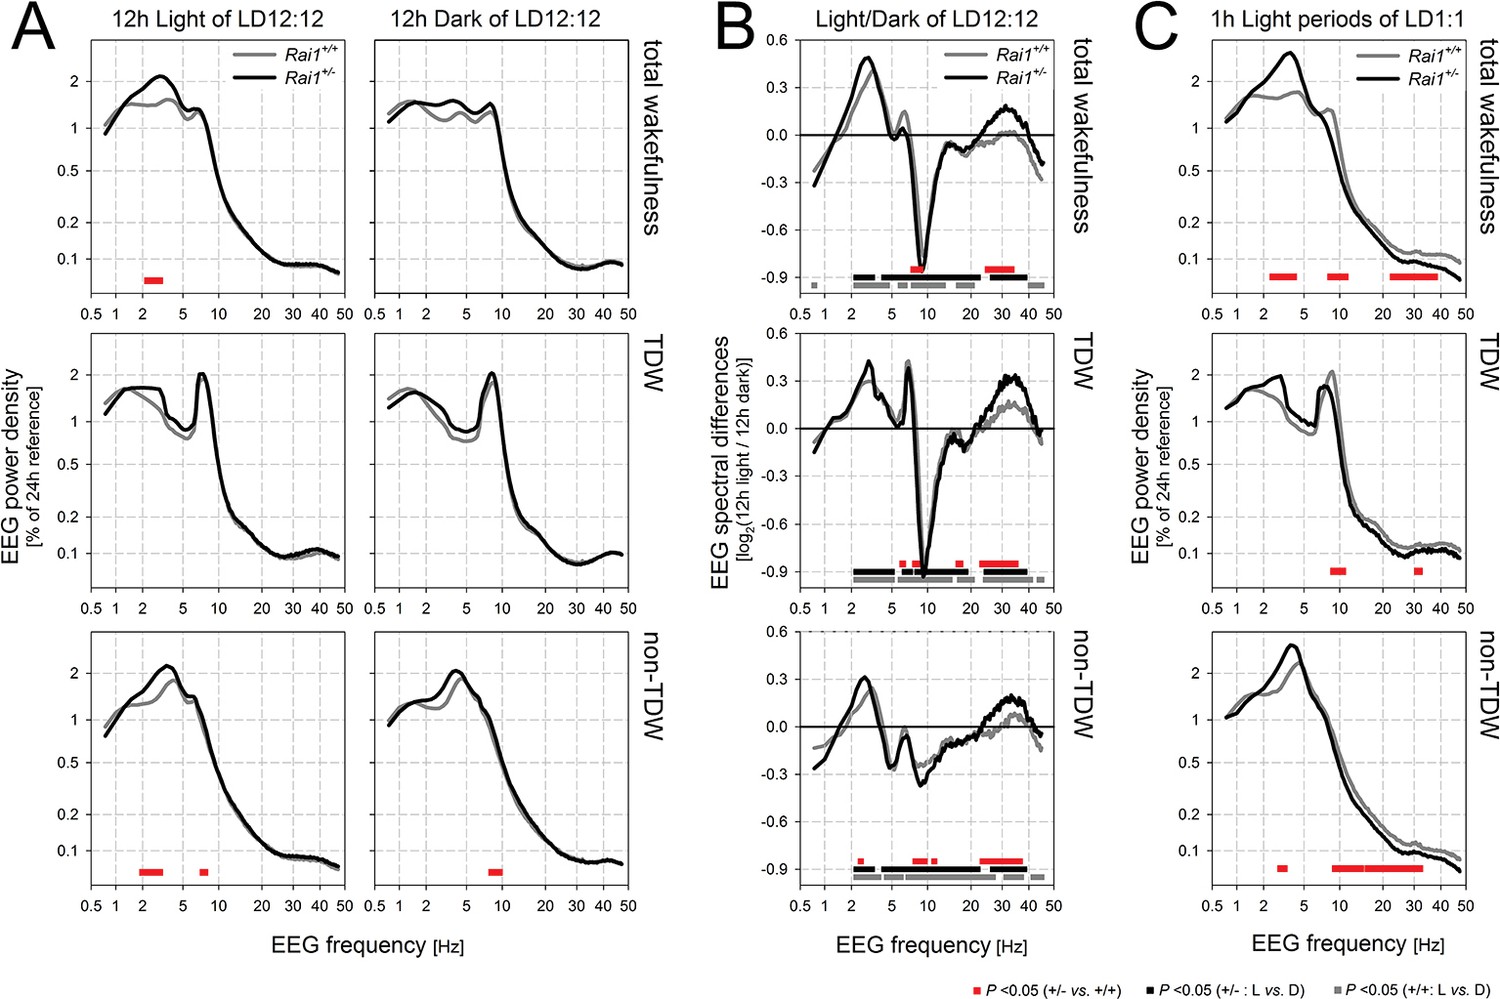
Spectral analysis of the waking EEG of Rai1+/- mice show an increased activity within the high delta band.
(A) Mean waking EEG spectra during total wakefulness (top), theta dominated wakefulness (TDW; middle), and the remaining wakefulness (non-TDW; lower panels) under the 12 hr light (left) and 12 hr dark (right panels) portion of two baseline days. Rai1+/-: black lines and symbols (n = 7); Rai1+/+: grey lines and symbols (n = 8). Red bars; p<0.05; t-tests. While the TDW EEG did not differ, in non-TDW (‘quiet’ waking) power density in the 2–3 Hz range was increased in Rai1+/- mice. (B) EEG spectral light/dark ratios for total wakefulness (top), TDW (middle), and non-TDW (lower panels). Zero levels in each panel represent the EEG activity during the 12 hr dark periods. Both genotypes show light-dark differences in EEG spectral profiles over a large frequency range (Rai1+/-: black bars; Rai1+/+: grey bars; p<0.05; t-tests). These light-dark differences were modulated by genotype only within the high-delta band and for frequencies between 25–40 Hz (red bars; p<0.05; t-tests). Note that both the prominent downward deflection, maximal close to 10 Hz, and the smaller upward deflection, peaking at around 7 Hz, observed in both genotypes are entirely due to a ~ 0.75 Hz faster TDW theta peak frequency in the dark compared to the light period. (C) The analysis under (A) was repeated for the 24 1h-light pulses under the 48 hr LD1:1 protocol. Again, non-TDW EEG activity in 2–3 Hz range increased when Rai1+/- mice were exposed to light arguing against circadian factors contributing to the results under (A).
Figure 4
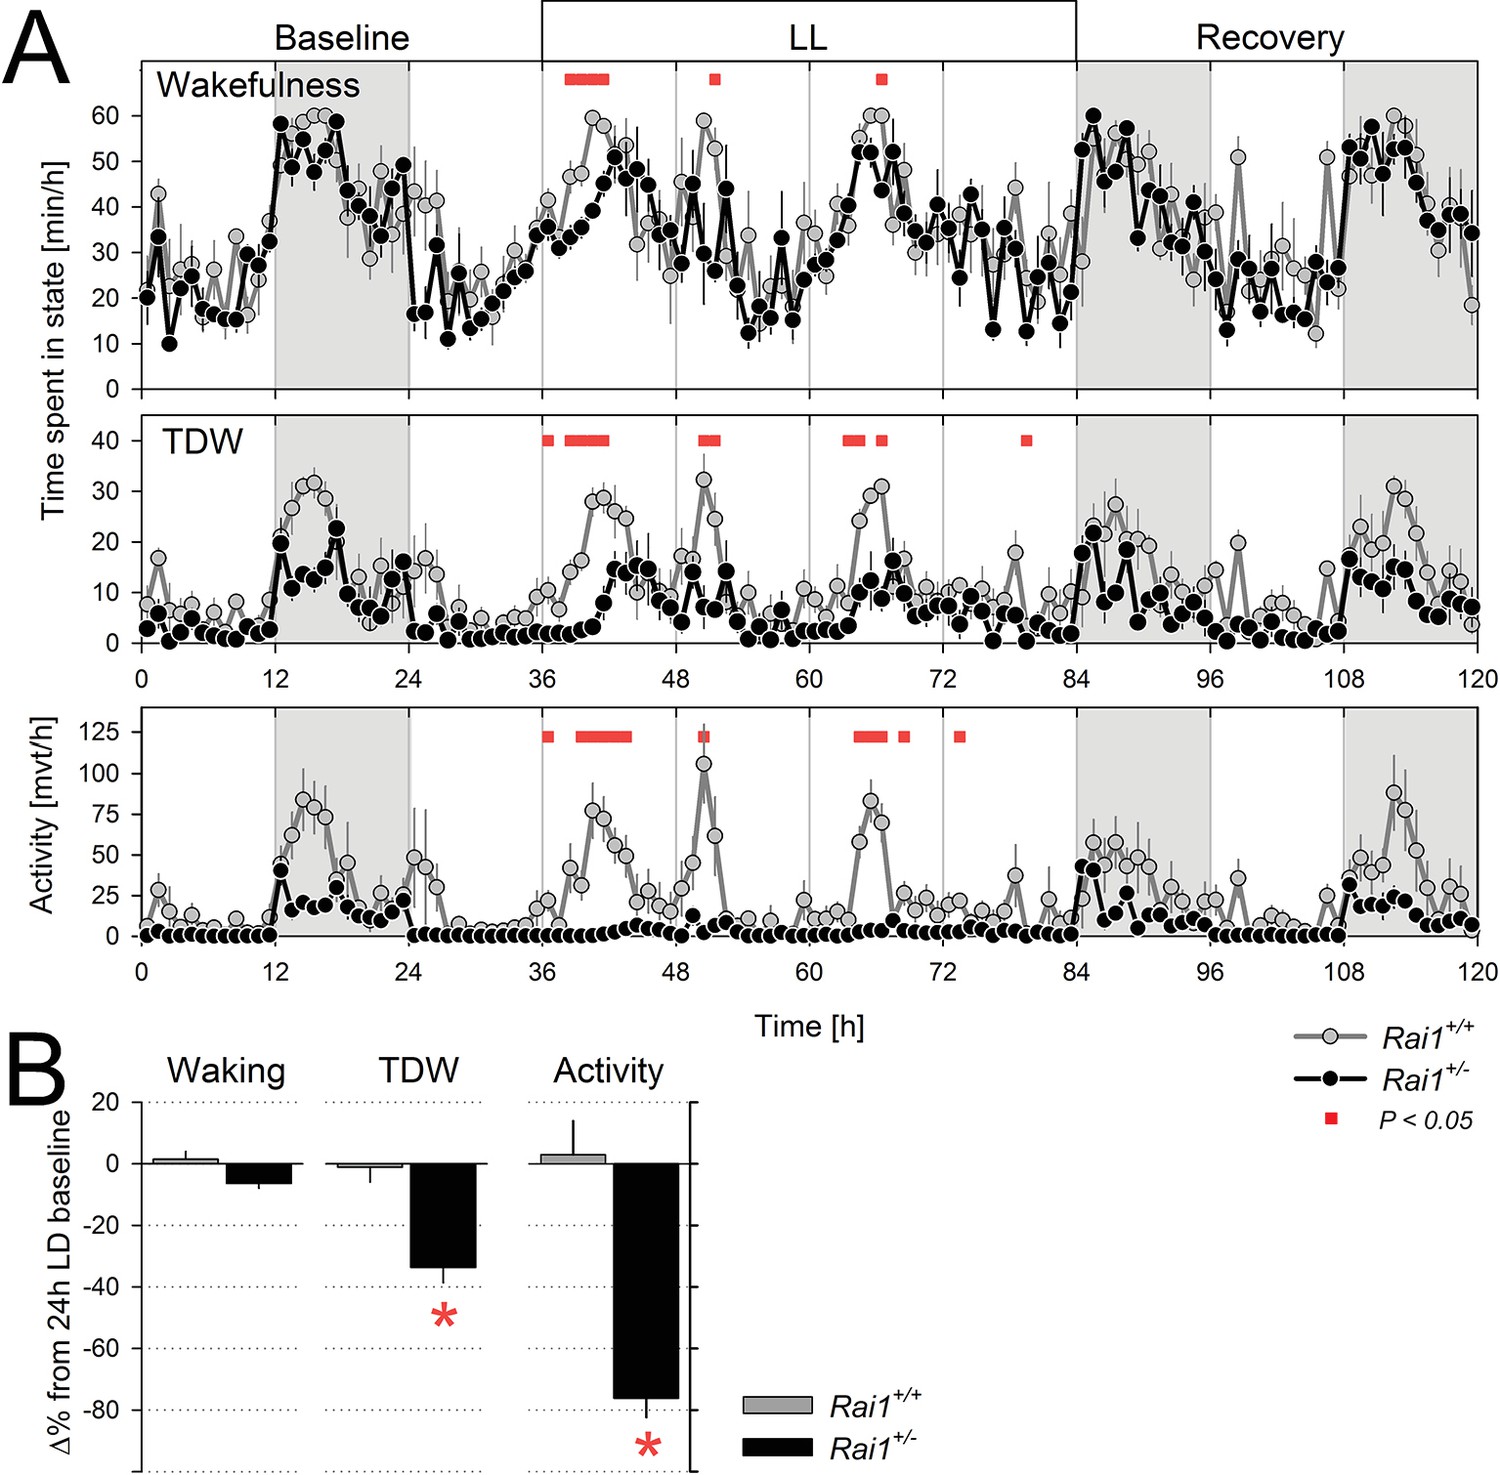
Sustained light suppression of locomotor activity and TDW, but not total time-spent-awake, in Rai1+/- mice under constant light (LL) conditions.
(A) Average profiles of mean hourly values of wakefulness (top), TDW (middle), and locomotor activity (bottom panels), under 48 hr LL in Rai1+/+ (grey lines and symbols) and Rai1+/- (black lines and symbols) mice (n = 4/genotype). In Rai1+/- mice LL resulted in a sustained and profound suppression of activity and TDW, leaving wakefulness largely unaffected (red bars; p<0.05; t-tests). Statistical analysis is shown only for the LL condition (for LD12:12 condition see Figure 2A) and not for baseline and recovery. (B) Wakefulness (left), TDW (middle), and locomotor activity (right panels) expressed as % difference from their 24 hr levels reached under the preceding LD12:12 (=0%). In wild-type mice no suppression of any of the three variables was observed while in Rai1+/- mice LL greatly reduced both time spent in TDW and locomotor activity but not total wakefulness (*p<0.005; t-test). Errors bars represent SEMs.
-
Figure 4—source data 1
Excel file with data sheets corresponding to figure panels A and B containing the numerical values on which the Figure 4 graphs are based.
For both panels individual data are provided as well.
- https://doi.org/10.7554/eLife.23292.010
Figure 5 with 2 supplements
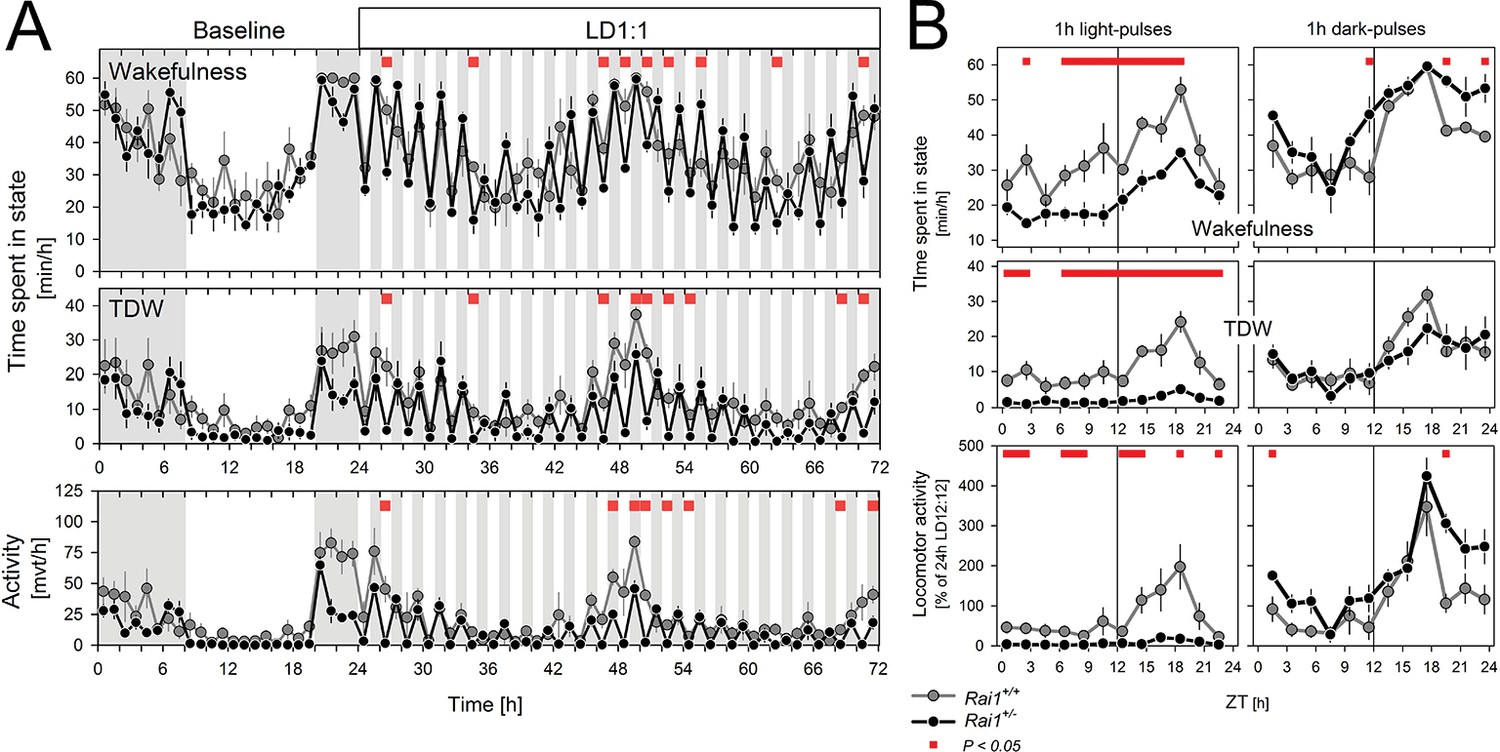
Light pulses acutely suppressed locomotor activity and TDW in Rai1+/- mice independent of circadian phase.
(A) Average profile of mean hourly values of total wakefulness (top), TDW (middle), and locomotor activity (bottom panels) under 48 hr LD1:1 in Rai1+/+ (grey lines and symbols) and Rai1+/- (black lines and symbols) mice (red bars; p<0.05; t-tests; n = 4/genotype). Note the ‘saw-tooth’ pattern for all three variables in Rai1+/- mice, with TDW and activity reaching near 0 levels during the 1-hr-light pulses. (B) Wakefulness (top), TDW (middle), and locomotor activity (bottom panels) during the 1-hr-light (left) and 1-hr-dark pulses (right panels) averaged for the 2 days under LD1:1. Relative activity is calculated as % of the individual’s total activity under the preceding day under LD12:12. Levels of activity and TDW during the 1-hr-light pulses follow a circadian pattern in Rai1+/+ (grey lines and symbols), but not in Rai1+/- (black lines and symbols) mice. Under LD1:1 also wakefulness is suppressed to a higher degree in Rai1+/- mice compared to wild-type (red bars; p<0.05; t-tests). Wakefulness, TDW, and activity levels during the 1h-dark pulses were less affected by genotype, although wakefulness and relative activity levels were generally higher in Rai1+/- mice than wild-type mice, indicating increased acute activation by darkness.
-
Figure 5—source data 1
Excel file with data sheets corresponding to figure panels A and B containing the numerical values on which the Figure 4 graphs are based.
For both panels individual data are provided as well.
- https://doi.org/10.7554/eLife.23292.012
Figure 5—figure supplement 1
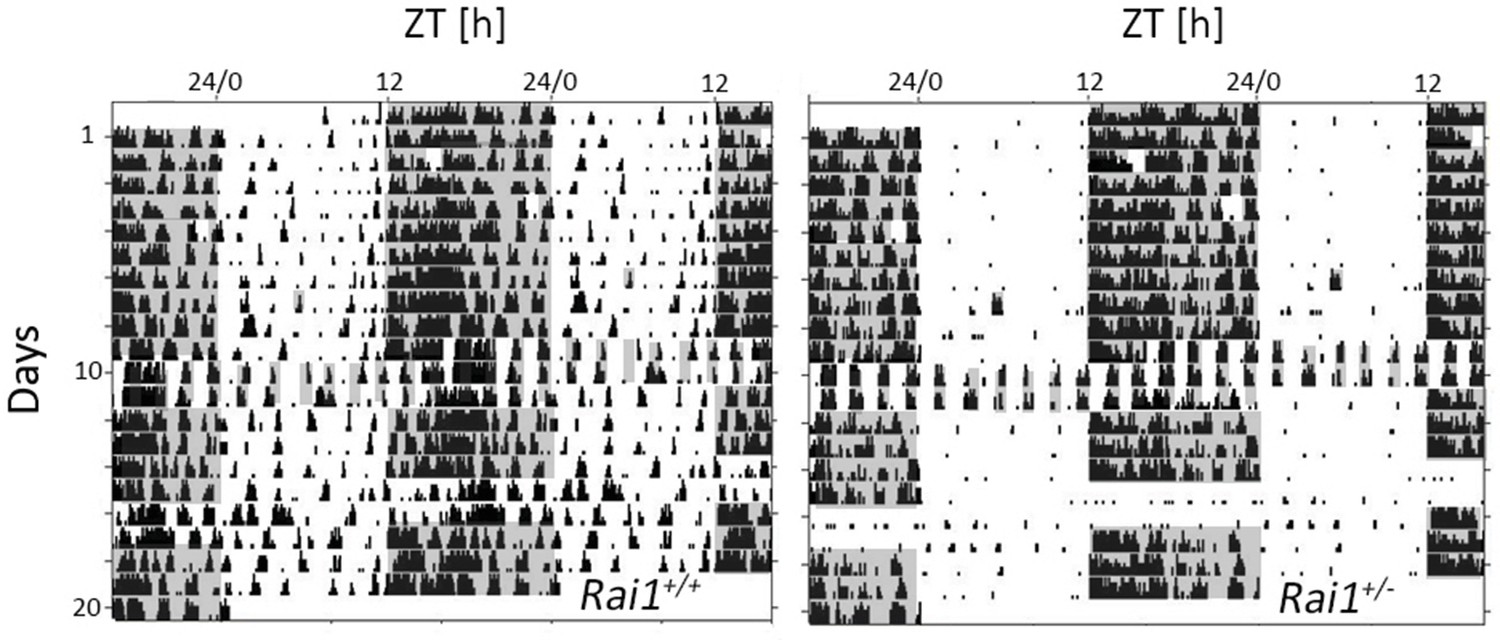
Illustration of the acute and sustained suppression of activity by light in Rai1+/- mice under different lighting regimens (LD12:12, LD1:1, and LL).
Double plotted actogram throughout the entire experiment of one Rai1+/+ (left) and one Rai1+/- (right panel) mouse. Note the complete absence of activity during the light in the Rai1+/- mouse under each of the three lighting conditions. Also note the 1-hr-light pulses given at days 3 and 5 and the 1-hr-dark pulse on day 9 the results of which are not included here.
Figure 5—figure supplement 2

Summary of locomotor activity differences during light exposure for the three lighting conditions.
Activity during light exposure under LD12:12 (dark-blue), LD1:1 (hatched), and LL (light-blue bar; mean and SEM) expressed as a percentage of each animal’s 24 hr mean activity levels under LD12:12. In wild-type mice, activity is lower during the light phase of LD12:12, when it coincides with the circadian rest phase, than under the other two lighting conditions (*p<0.01; t-test). However, in Rai1+/- mice, activity during the light pulses under LD1:1, is as low as during light under LD12:12 (*p<0.001; t-test) further confirming that light suppression does not depend on circadian phase.
Figure 6
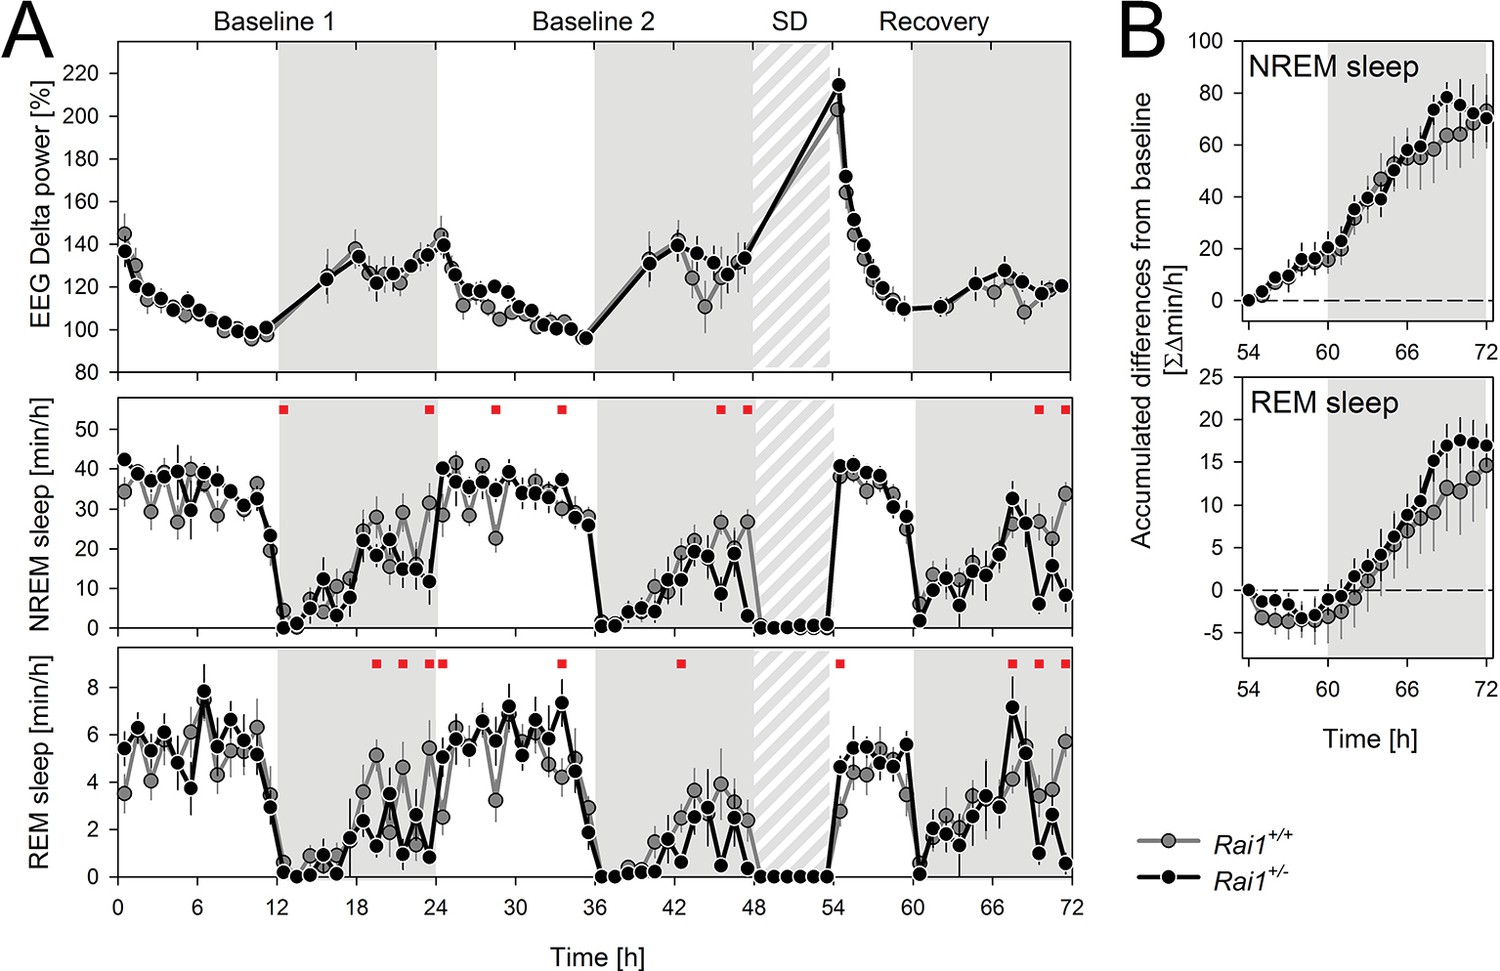
Sleep homeostasis is not altered in Rai1+/- mice.
(A) Average time course of EEG delta power (1–4 Hz) in NREM sleep (top), time spent in NREM sleep (middle) and in REM sleep (bottom panel) under LD12:12. After 2 baseline days (0–48 hr), animals were sleep deprived for 6 hr (48–54 hr) by gentle handling starting at light onset. Recovery was monitored over the remaining 18 hr of the 3-day recording (54–72 hr). Rai1+/+: grey lines and symbols; Rai1+/-: black lines and symbols. Red squares above data mark significant genotype differences (p<0.05; t-tests). (B) Mean hourly accumulation of differences from baseline in time spent in NREM (top) and REM (bottom panel) sleep during the 18 hr of recovery sleep after the SD (54–72 hr) did not differ between genotypes. Rai1+/- n = 7; Rai1+/+ n = 8.
Figure 7
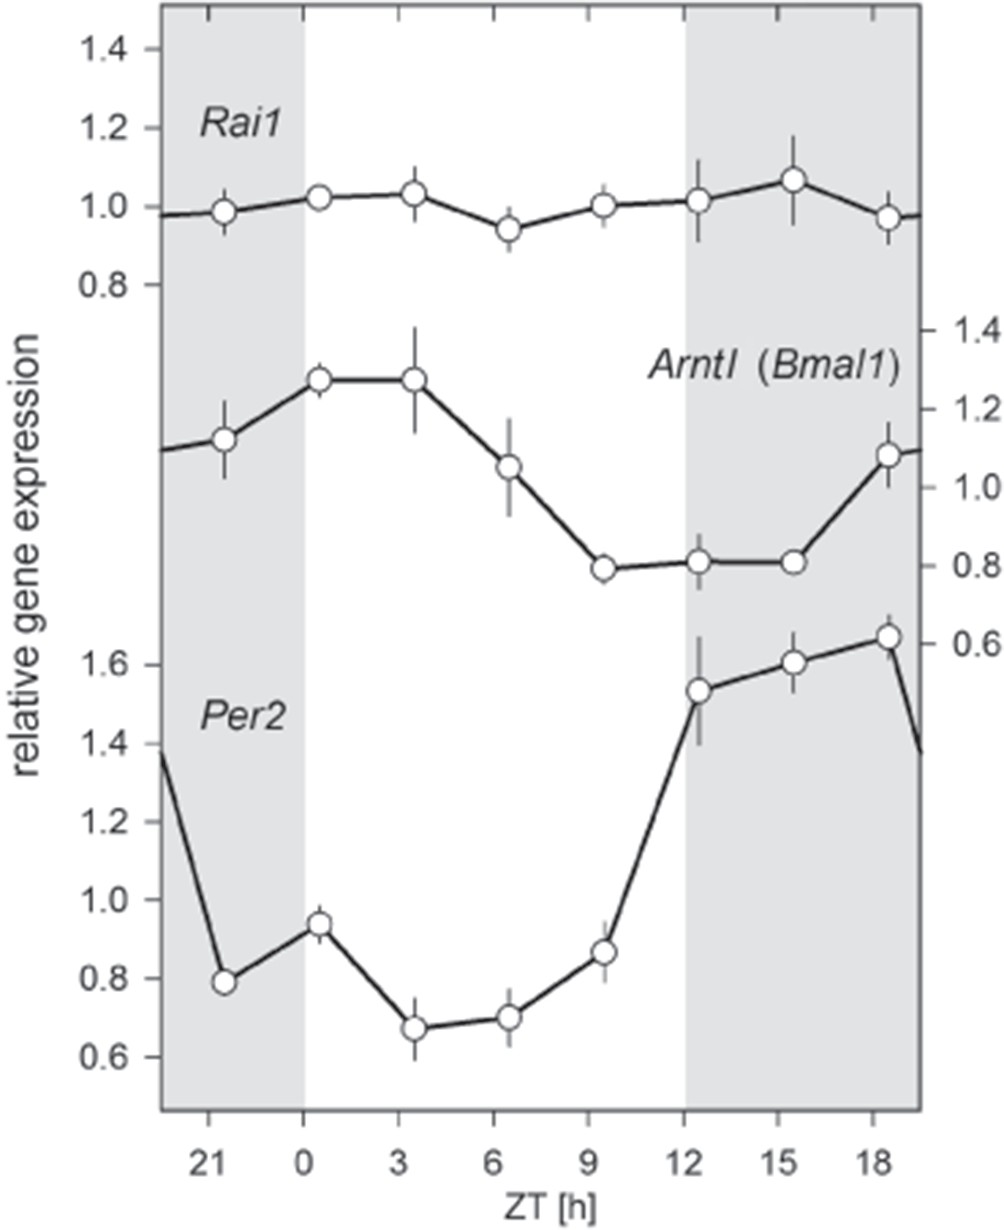
Twenty-four hour brain expression profiles for Rai1, Arntl, (Bmal1), and Per2 in wild-type mice.
While Bmal1 and Per2 expression showed their well-known anti-phasic circadian expression profiles, Rai1 expression was remarkable indifferent to time-of-day and lighting condition. Samples were taken at 3 hr intervals (total n = 23; that is, n = 3/interval, except for ZT18: n = 2).
Figure 8
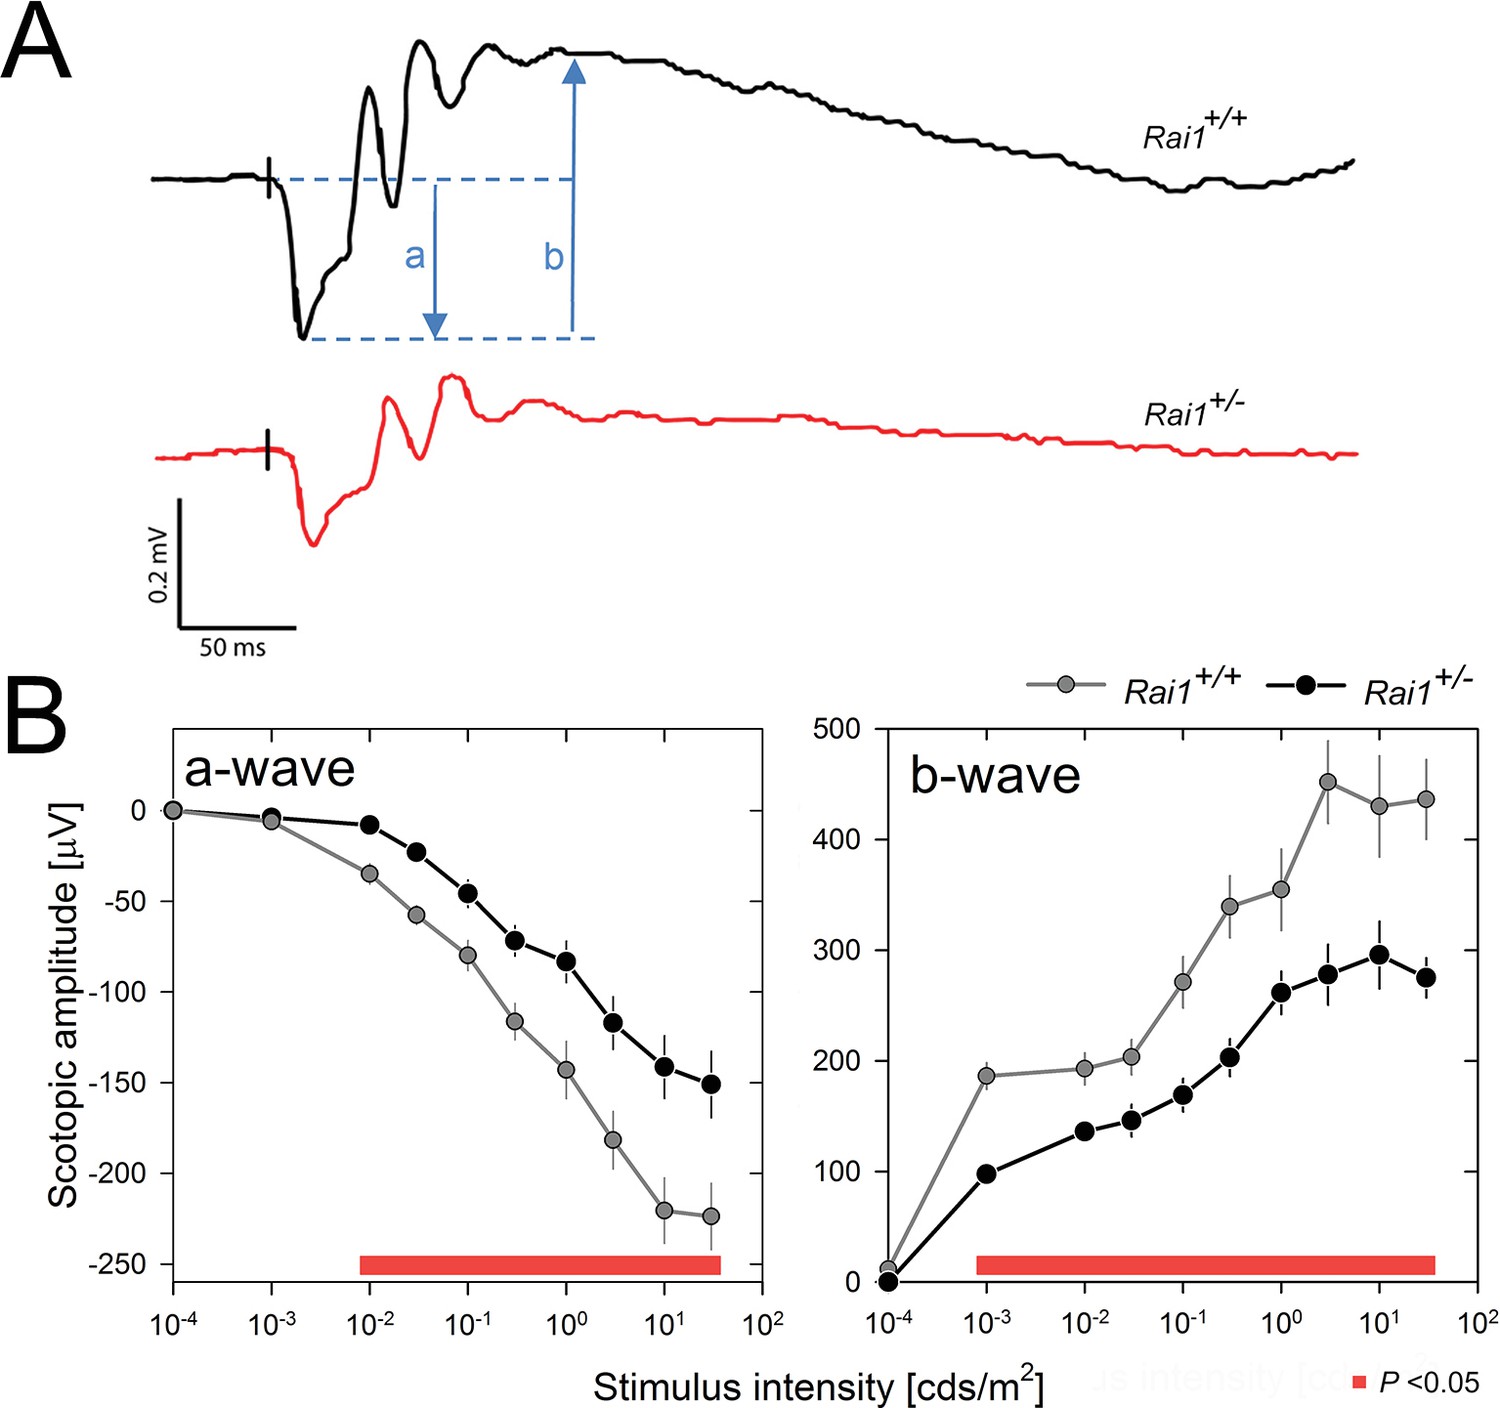
Decreased light-induced retinal activity in Rai1 haplo-insufficient mice.
(A) Representative example of ERG responses of a Rai1+/+ mice (upper panel; black line) and a Rai1+/- mice (lower panel; red line) to single flashes of 30 cds/m2 recorded under scotopic conditions. The letters ‘a’ and ‘b’ represent a- and b-wave amplitudes, respectively. Vertical black tick marks just prior the a-wave indicate timing of the light stimuli. Scale bars, horizontal: 50 ms, vertical: 0.2 mV. (B) Rai1+/- mice (black symbols and lines) displayed a significantly smaller ERG response compared to Rai1+/+ mice (grey symbols and lines), due to both a smaller (less negative) a-wave (left) and b-wave (right panels) amplitude over a broad range of stimulus intensities (red bars; p<0.05; t-test).
-
Figure 8—source data 1
Excel file with two data sheets corresponding to Figure 8 panel B a-wave and b-wave values, respectively.
For both panels individual data are provided.
- https://doi.org/10.7554/eLife.23292.018
Figure 9
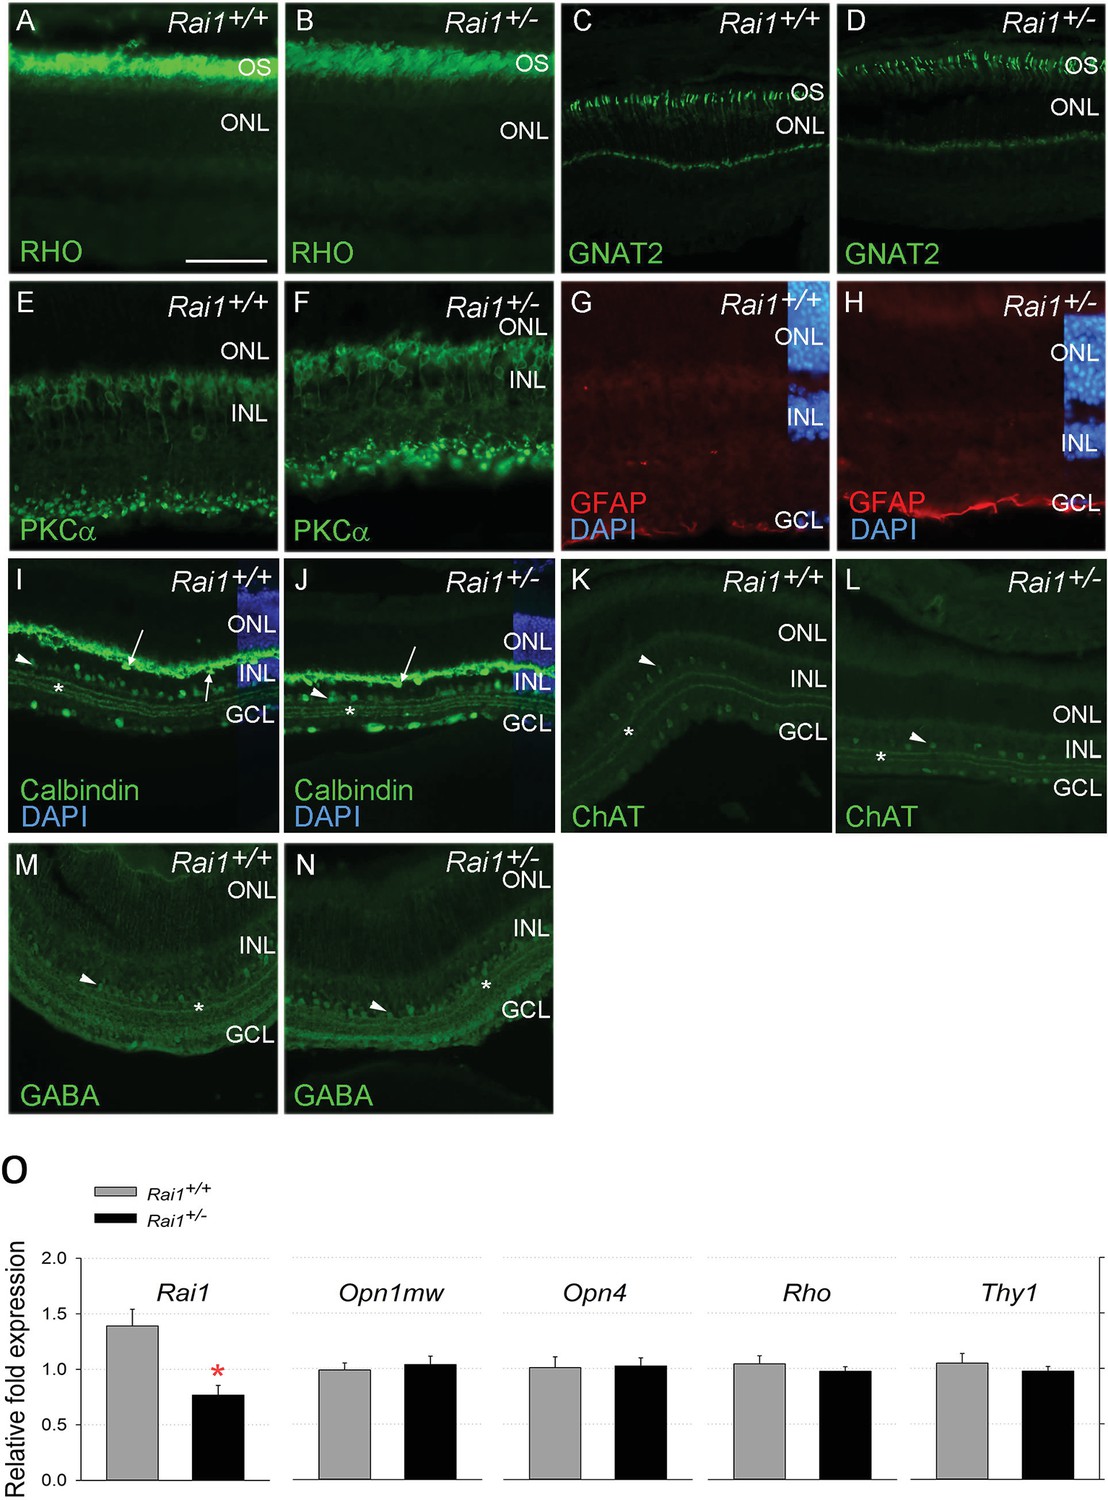
Retinal protein and gene expression levels were normal in Rai1+/- mice.
Immunostaining for Rhodopsin protein (A, B), the cone protein GNAT2 (C, D), the bipolar protein PKCa (E, F), the Müller cell protein GFAP (G, H), and Calbindin (I, J), ChAT (K, L), and GABA (M, N) markers did not differ between Rai1+/- (B, D, F, H, J, L, N) and Rai1+/+ mice (A, C, E, G, I, K, M). As expected, rhodopsin was mainly localized in outer-segments of rods (A, B) and GNAT2 in cone cells (C, D). PKCa labeled whole ON bipolar cells with both dendrite and synapse structure (E, F). GFAP expression was restricted to the foot of Müller cells not extending to their cell bodies that show no activation in these retinal cells (G, H). Calbindin was expressed in horizontal cells (arrows) and some amacrine cells (arrowhead) as well as in ganglion cells located in the GCL (I, J). Three strata of connections (star) were well labeled by calbindin in both genotypes in the layer connecting the INL and GCL layers. Both ChAT (K, L) and GABA (M, N) labeled subpopulations of amacrine cells (arrowheads) and different strata of connections (star) in a pattern similar for Rai1+/- (L, N) and Rai1+/+ (K, M) mice. White horizontal bars represents 50 µm in A, B, E, F, G, and H and 100 µm in C, D, and I through M. OS: outer-segments; ONL: outer-nuclear layer; INL: inner-nuclear layer; GCL: ganglion cell layer; RHO: rhodopsin in green; GNAT2: G-protein subunit alpha transducin two in green; PKCa: Protein kinase C alpha in green; GFAP: gGlial fibrillary acidic protein in red; DAPI: 4',6-diamidino-2-phenylindole in blue; ChAT: choline acetyltransferase ChAT in green; GABA: γ-aminobutyric acid in green. (O) Quantitative RT-PCR showed that expression of M-opsin (Opn1mw; cones), melanopsin (Opn4, ipRGCs), rhodopsin (Rho; rods), and the retinal ganglion cell marker Thy1 was normal in Rai1+/- mice. Rai1 expression was decreased by 50% in Rai1+/- mice, as could have been expected.
Figure 10
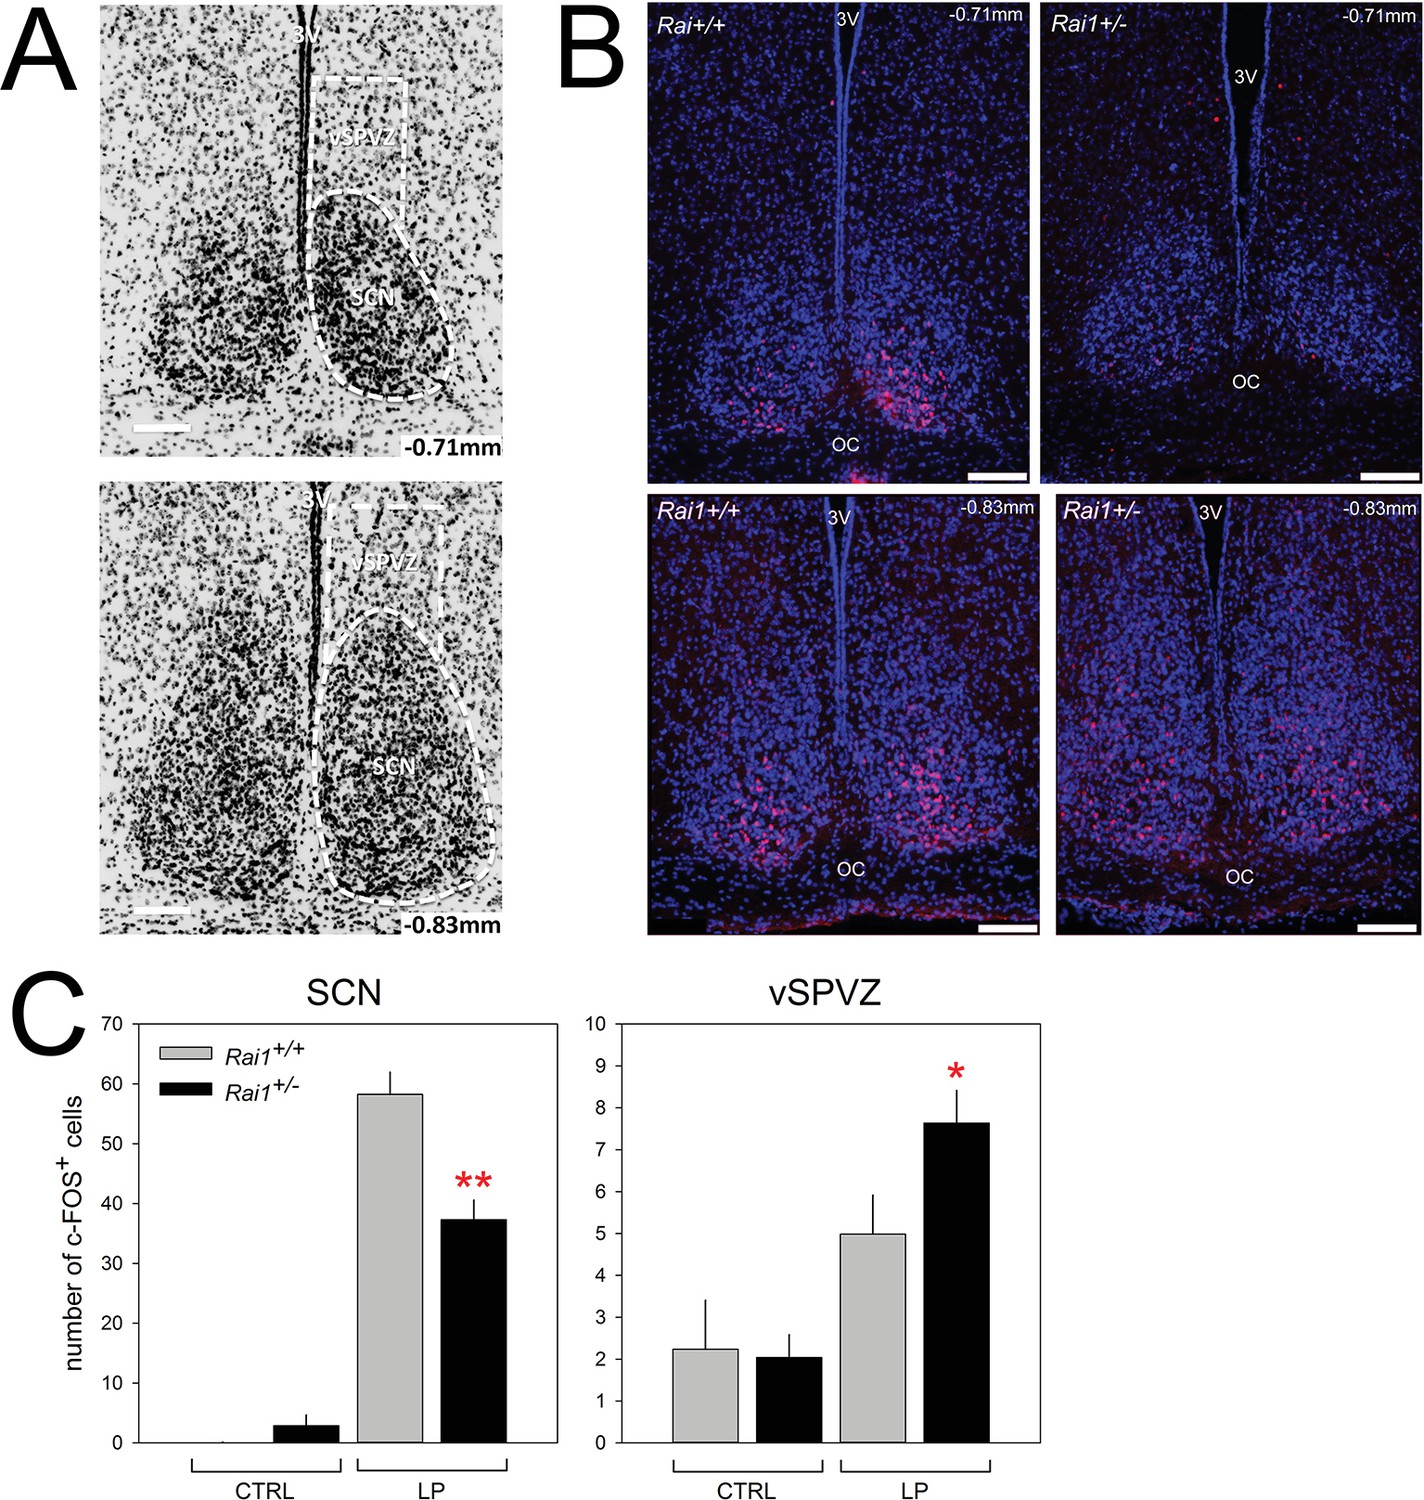
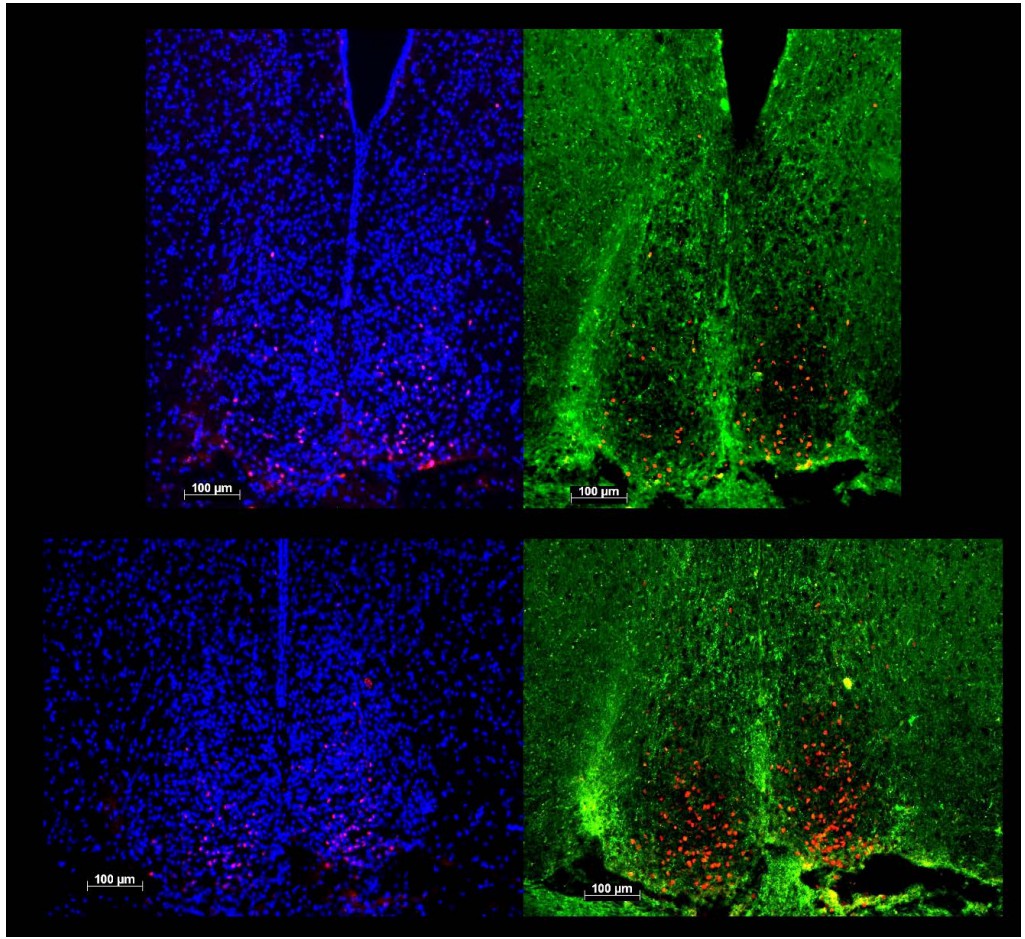
Decreased SCN activation and increased vSPVZ activation by light in Rai1 haplo-insufficient mice.
(A) Illustration of anatomical delimitation (white dashed lines) of SCN and vSPVZ regions at bregma ~ −0.71 mm and ~ −0.83 mm used to count c-FOS-positive (c-FOS+) cells in B and C. SCN contour is readably visible by the marked density of cells within the SCN. DAPI staining in black labels cell nuclei. The vSPVZ contour was defined following published coordinates (Paxinos and Franklin, 2013). Note that top photo in A is identical to top-left photo in B with DAPI in blue on black background allowing visualization of c-FOS immunofluorescence in red in the ventral retinorecipient SCN core (B) Example of representative immunofluorescence staining of four sections (upper two panels at −0.71 mm, lower 2–0.83 mm) of two wild-type (left) and two Rai1+/- heterozygous (right panels) mice. White horizontal bars in each photo of Panels A and B mark 100 μm. (C) A 1-hr-light pulse (LP) produced a smaller c-FOS immunoreactivity response in the SCN of Rai1+/- mice compared to wild-type littermates. This is reflected by a reduced number of c-FOS-positive cells (left panel; **p<0.005; t-tests). In the vSPVZ, a 1-hr-light pulse produced a larger response in c-FOS immunoreactivity in Rai1+/- mice (right panel; *p<0.05; t-test; n = 6 and 7 in Rai1+/- and Rai1+/+ mice). Two control groups did not receive a light pulse (CTRL: n = 3/genotype). Note the different scaling for the SCN and vSPVZ panels. c-FOS immunoreactivity was averaged for the −0.71 and −0.83 mm sections within animals.
-
Figure 10—source data 1
Excel file with two data sheets corresponding to Figure 10 panel C SCN and vSPVZ number of cFOS-positive cells, respectively.
For both structures individual data are provided.
- https://doi.org/10.7554/eLife.23292.021
Figure 11
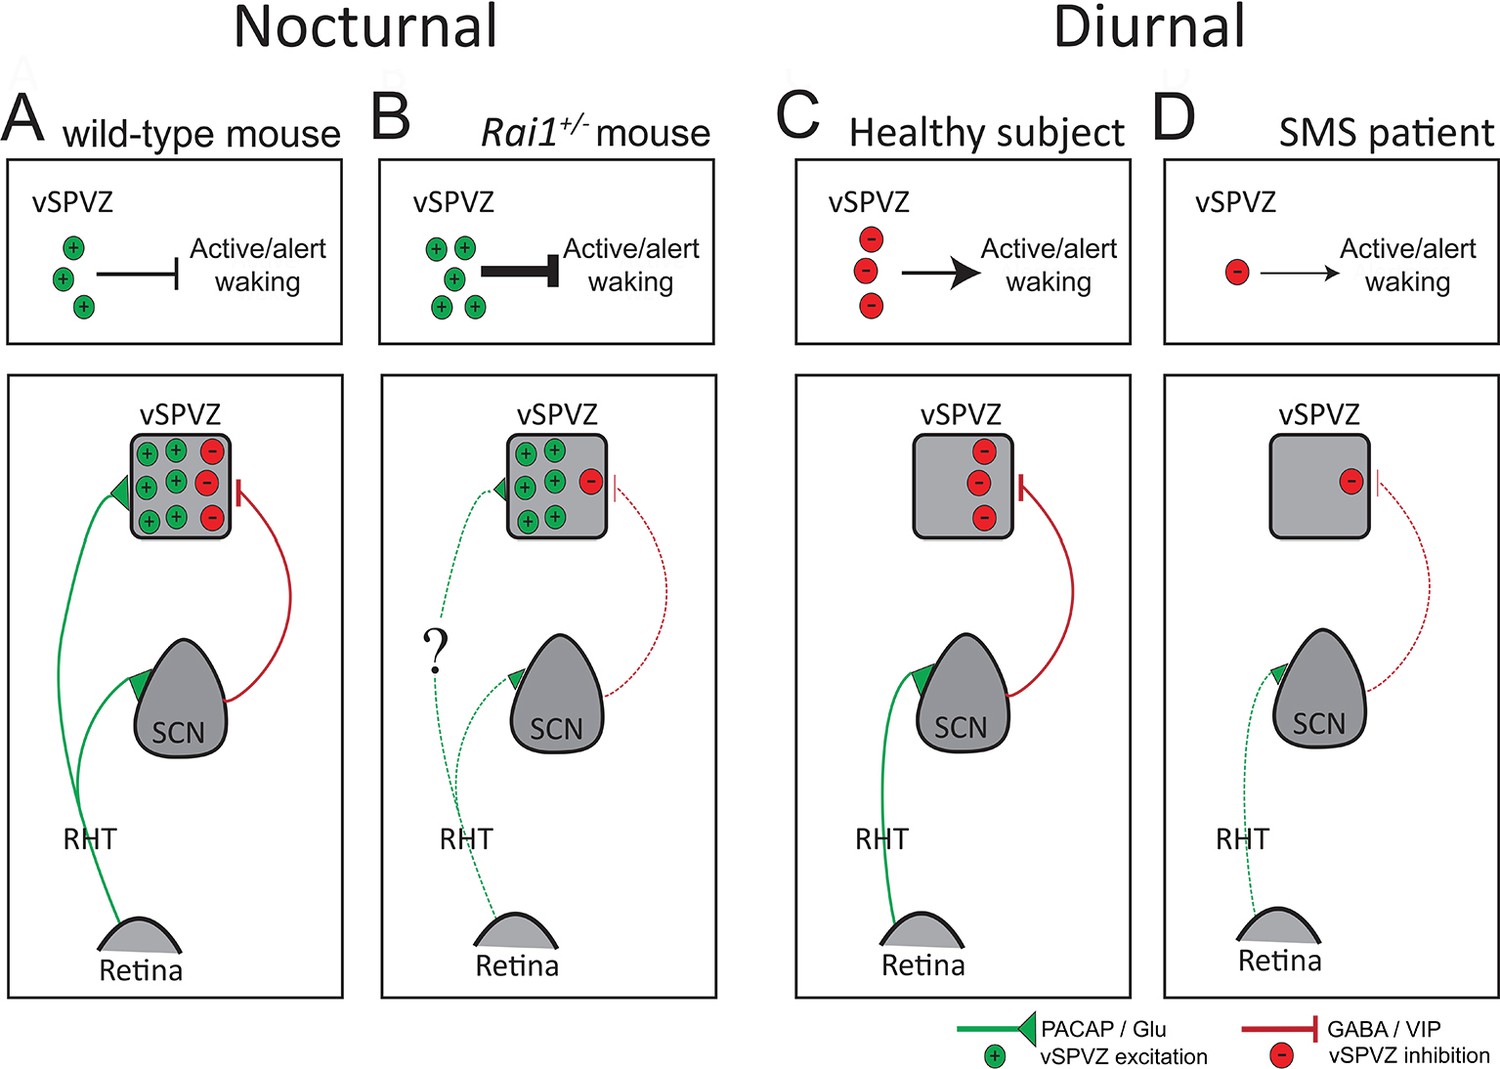
Diagram illustrating a hypothesis explaining the differential response to light, from retina to behavior, in SMS mice and patients.
(A) In the intact, nocturnal mouse light stimulates the retina and, through the PACAP and GLU excitatory projections (green) of the retinohypothalamic tract (RHT), activates both the SCN and the vSPVZ. Upon activation, the SCN, in turn, inhibits the vSPVZ through GABA/VIP inhibitory projections (red). RHT activation outweighs SCN inhibition resulting in a net activation of the vSPVZ causing suppression of active wake behaviors and locomotor activity during a light pulse. The four upper panels illustrate the net excitatory-inhibitory balance in the vSPVZ as number of green (+, excitatory) or red (-, inhibitory) circles and the effect on active/alert wake behaviors. (B) In Rai1+/- mice, despite a reduced retinal response to light, excitatory inputs received from the RHT are somehow (‘?’) sufficient to correctly activate the vSPVZ (see Figure 10C). However, SCN activation by the RHT is impaired resulting in a weaker inhibition of the vSPVZ (bottom panel). The net effect of normal excitation and impaired inhibition of the vSPVZ is an over-activation explaining the exacerbated suppression of locomotor activity (upper panel). (C) In humans, light information encoded in the retina and transmitted by the RHT, activates only the SCN as the retinal-vSPVZ projections are thought not to be functionally important in diurnal species (Todd et al., 2012). In turn, the SCN will inhibit the vSPVZ (bottom) thus promoting active wake behaviors (upper panel). (D) In SMS patients, as in the mouse model, a reduced retinal response to light might lead to a reduced SCN stimulation and a reduced suppression of the vSPVZ (bottom) and reduced promotion of active/alert wake behaviours during the day (upper panel). PACAP: Pituitary adenylate cyclase-activating polypeptide; GLU: Glutamate; GABA: γ-aminobutyric acid; VIP: vasoactive intestinal peptide; dotted green/red lines: weaker stimulation/inhibition. Inspired by Todd et al., 2012).
Author response image 1
Download links
A two-part list of links to download the article, or parts of the article, in various formats.
Downloads (link to download the article as PDF)
Open citations (links to open the citations from this article in various online reference manager services)
Cite this article (links to download the citations from this article in formats compatible with various reference manager tools)
Rai1 frees mice from the repression of active wake behaviors by light
eLife 6:e23292.
https://doi.org/10.7554/eLife.23292


