Long-range projection neurons in the taste circuit of Drosophila
- University of California, Berkeley, United States
Figures
Figure 1 with 1 supplement
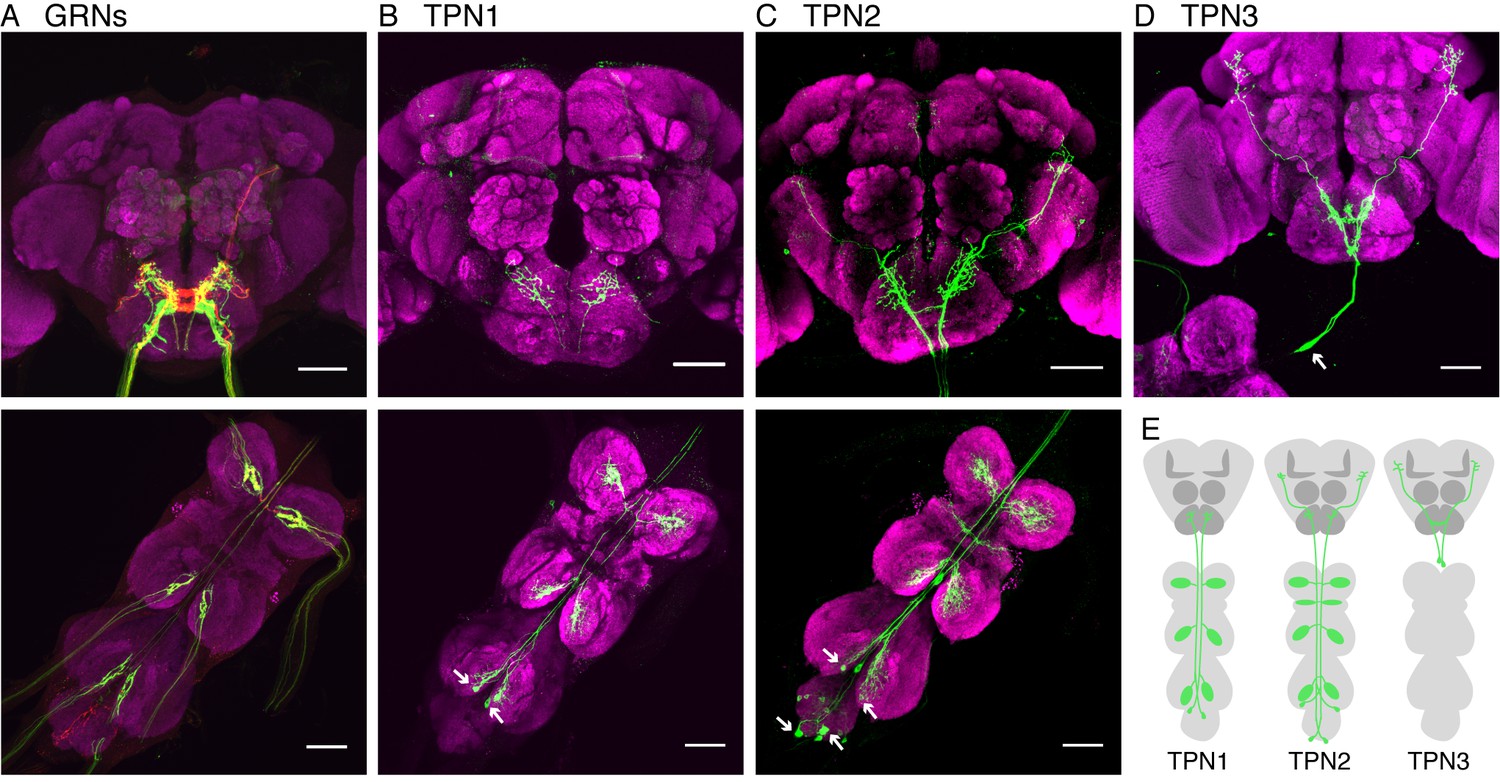
Identification of taste projection neurons.
(A) Projection pattern of bitter (red) and sugar (green) GRNs into the SEZ (top) and VNC (bottom). For A-D, magenta indicates neuropil; arrows indicate cell bodies; and scale bar, 50 μm. (B) Full expression of R30A08-Gal4, showing TPN1 fibers (green) in SEZ (top) and cell bodies and fibers in the VNC (bottom). (C) Full expression of VT57358-Gal4, showing TPN2 fibers (green) in SEZ and protocerebrum (top) and cell bodies and fibers in the VNC (bottom). (D) Single-cell clone of C220-Gal4, showing anatomy of TPN3 (green). (E) Schematic of anatomical patterns of the taste projection neurons.
Figure 1—figure supplement 1
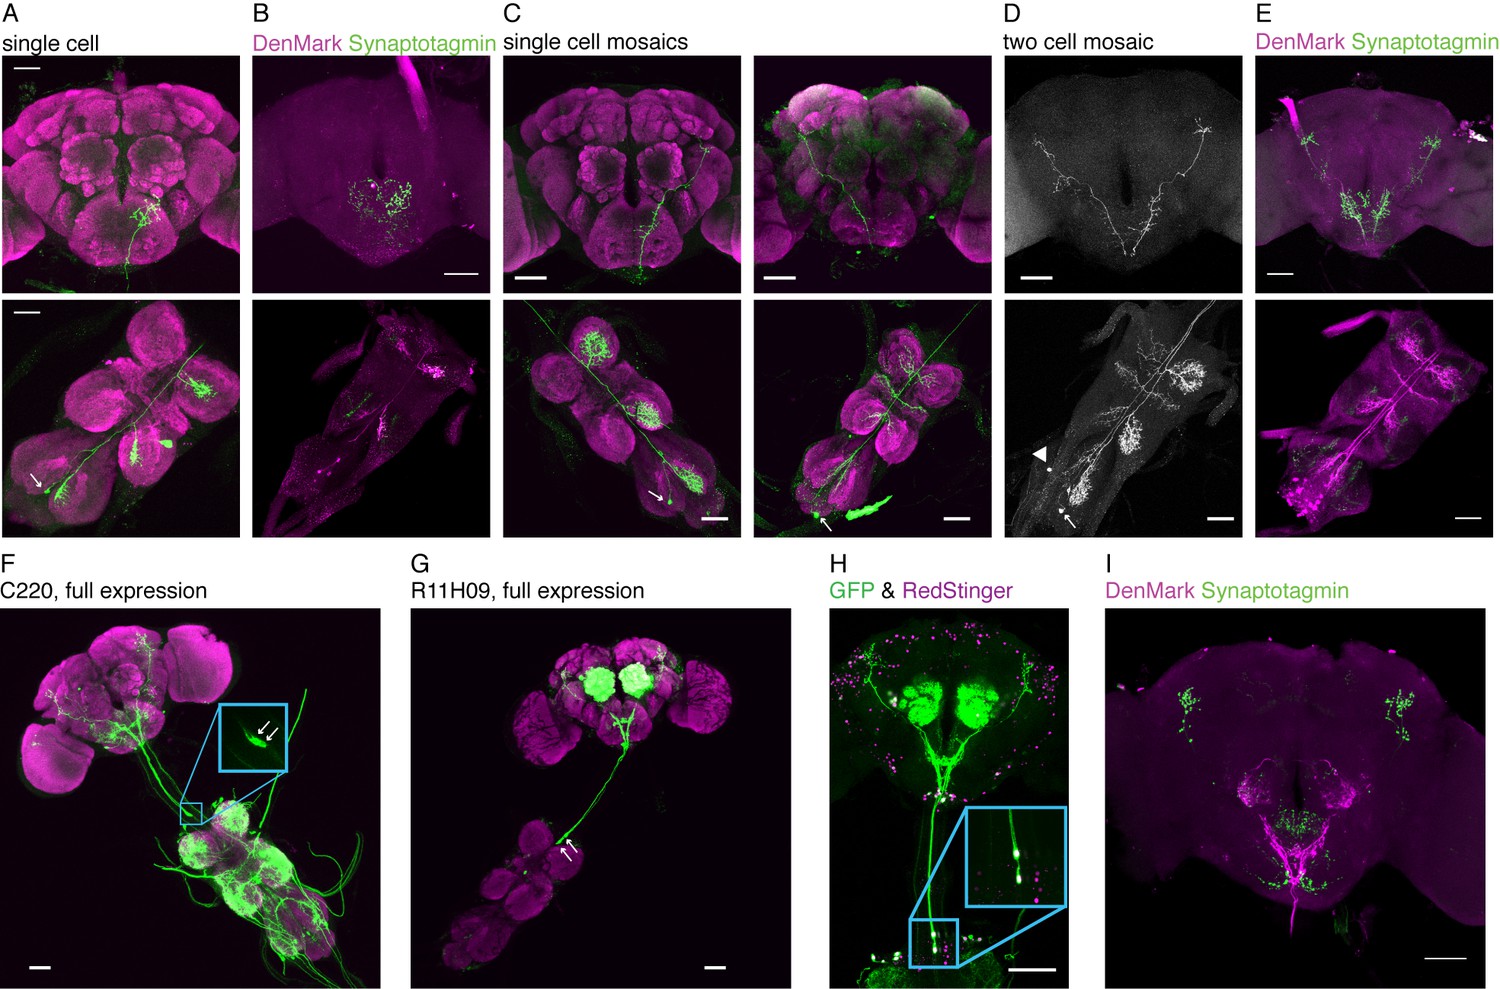
Detailed anatomy of TPNs.
(A) Single cell example of TPN1 (R30A08-Gal4 stochastically labels a single TPN1 neuron). TPN1 cell bodies are on the ventral surface of the third neuromere in the VNC. Each TPN1 cell (arrow) sends projections that arborize in the contralateral three leg neuromeres and SEZ. (B) DenMark (dendritic marker - magenta) and synaptotagmin (presynaptic marker - green) staining of TPN1 indicates dendrites are in the VNC and axon termini are in the SEZ. (C) Single cell mosaic examples of cells in class TPN2 (VT57358-Gal4). Left: example unilateral neuron has cell body on dorsal surface of the third neuromere and dendritic projections unilaterally in all three neuromeres and axonal projection in central brain. Right: example bilateral neuron has cell bodies in the abdominal segment and dendritic projections bilaterally in all three neuromeres and wing margin and unilateral axonal projection in central brain. Arrows indicate cell bodies. (D) Two-cell mosaic example of one bilateral (cell body: arrow) and one unilateral (cell body: arrowhead) TPN2 neuron displays similar higher brain projection patterns. (E) DenMark and synaptotagmin staining of TPN2 indicates dendrite are in the VNC and axon termini in SEZ and higher brain. (F) Full expression of C220-Gal4, line that includes TPN3 and other VNC projections. Inset: highlighting the two cell bodies. (G) Full expression of R11H09-Gal4, line that has TPN3 and antennal interneurons. (H) Both TPN3 Gal4s drive expression in the same two TPN3 neurons as only two neurons are labeled when both drivers (C220 and R11H09) express both UAS-cd8GFP and UAS-RedStinger. (I) DenMark and synaptotagmin staining of TPN3 shows dendrites in the SEZ and axons in the higher brain. Green staining seen in the SEZ is aberrant UAS-Synaptotagmin-eGFP expression, also seen in B and E. Scale bar, 50 µm.
Figure 2 with 1 supplement
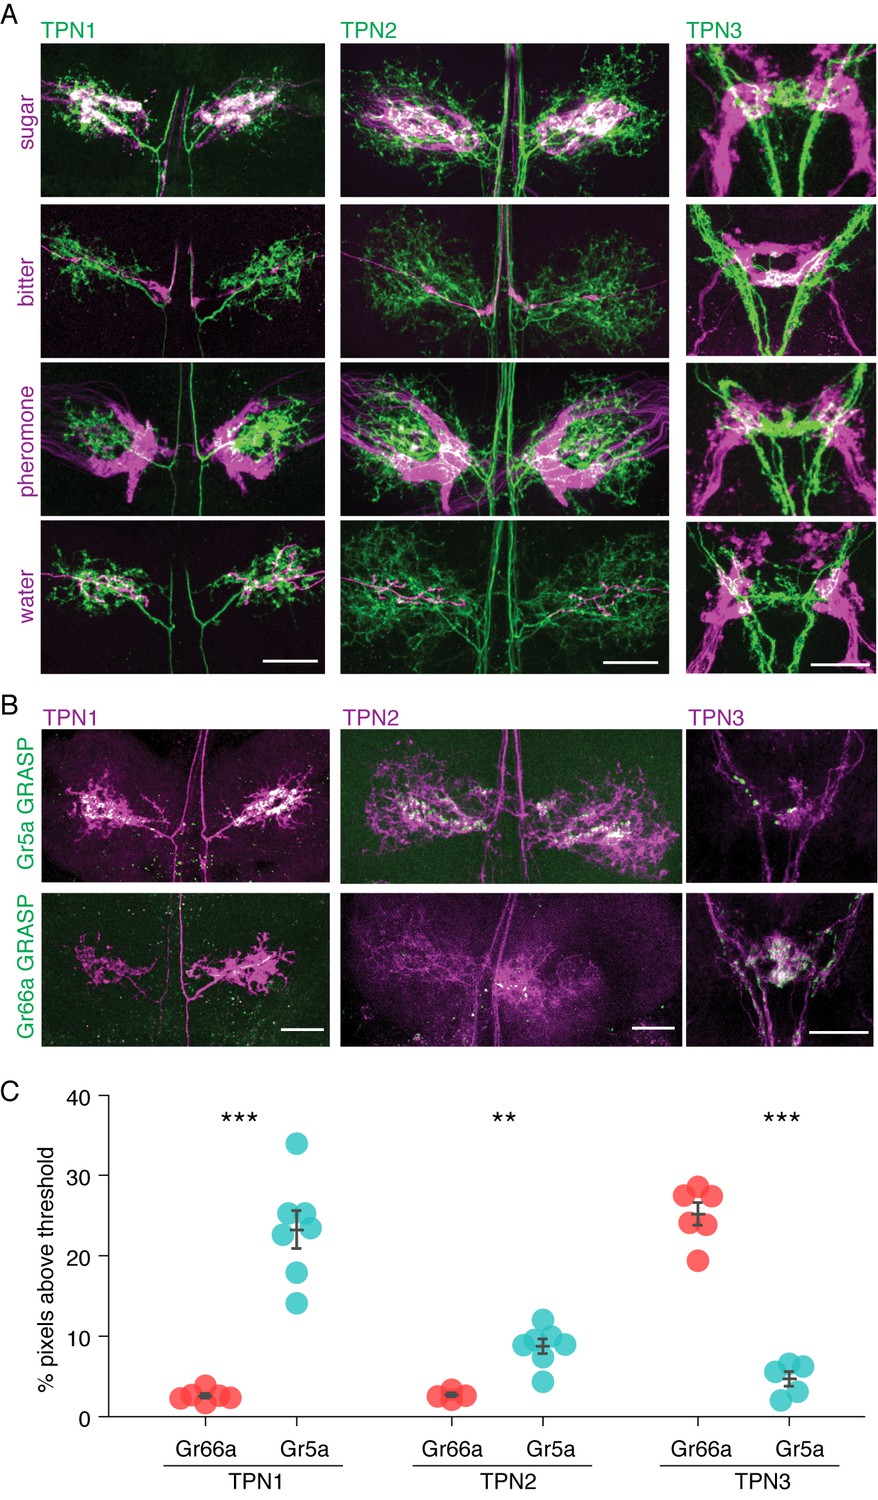
TPNs are in close proximity to gustatory projections.
(A) Double labeling of TPNs (green) with sugar, bitter, pheromone, or water GRNs (magenta). Shown are the projections of TPN1 and TPN2 in the first leg ganglia of the VNC and the projections of TPN3 in the SEZ. TPN1 and TPN2 fibers show strong overlap with sugar but not other GRNs in the VNC. TPN3 shows strong overlap with bitter but not other GRNs in the SEZ. Images shown are z-stacks of the entire preparation and single-plane images are shown in Figure 2—figure supplement 1. Scale bar, 25 μm. (B) Gr5a (sugar GRN) and Gr66a (bitter GRN) GRASP with TPNs. TPN1 and TPN2 show strong GRASP (green) with sugar GRNs in the VNC while TPN3 shows strong GRASP with bitter GRNs in the SEZ. TPNs are labeled with cd8-tdTomato (magenta). Scale bar, 25 μm. (C) Quantification of GRASP (green) signal within the dendritic arbors of the TPNs. Significantly more pixels exceed threshold for sugar (Gr5a) compared to bitter (Gr66a) GRASP for both TPN1 and TPN2. Conversely, significantly more pixels exceed threshold for bitter GRASP for TPN3. n = 4–7. Error bars indicate mean ± SEM. Wilcoxon rank sum test: **p<0.01, ***p<0.005.
Figure 2—figure supplement 1
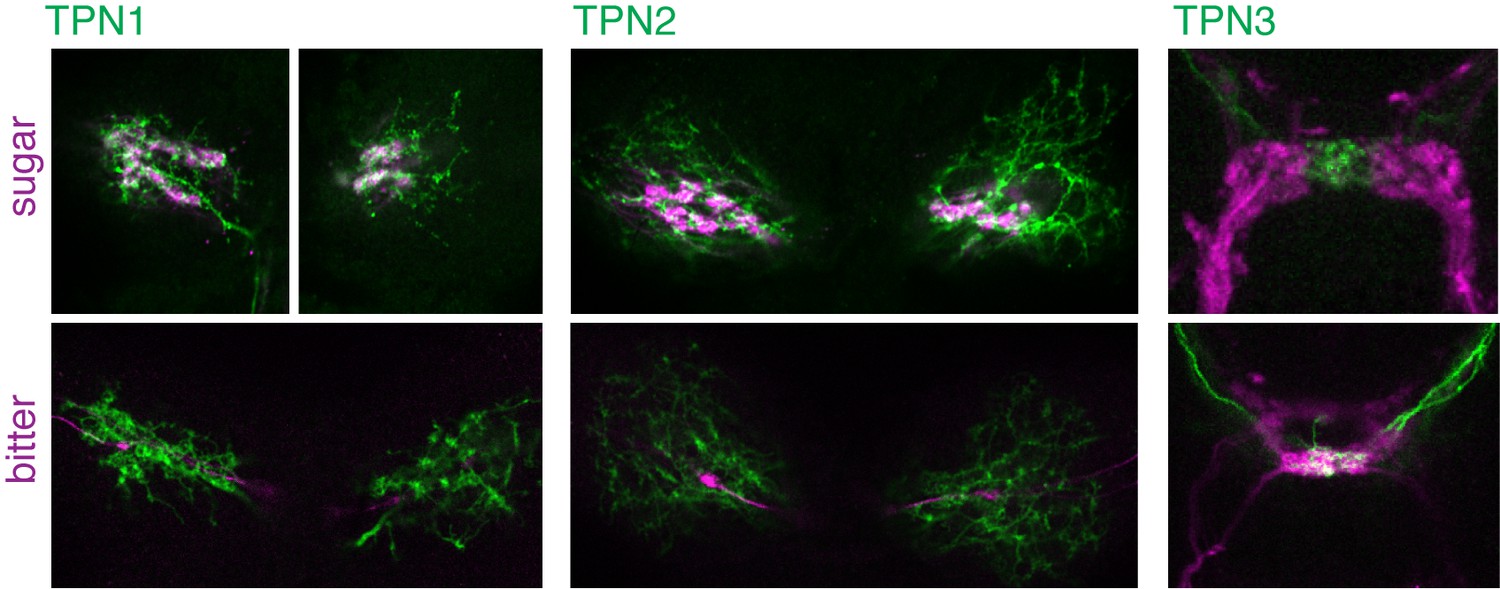
Single plane examples of TPNs and gustatory projections.
Single plane images of TPNs (green) and sugar or bitter GRNs (magenta). Single planes (4.6 µm optical sections) are from the same specimens shown in Figure 2A.
Figure 3 with 1 supplement
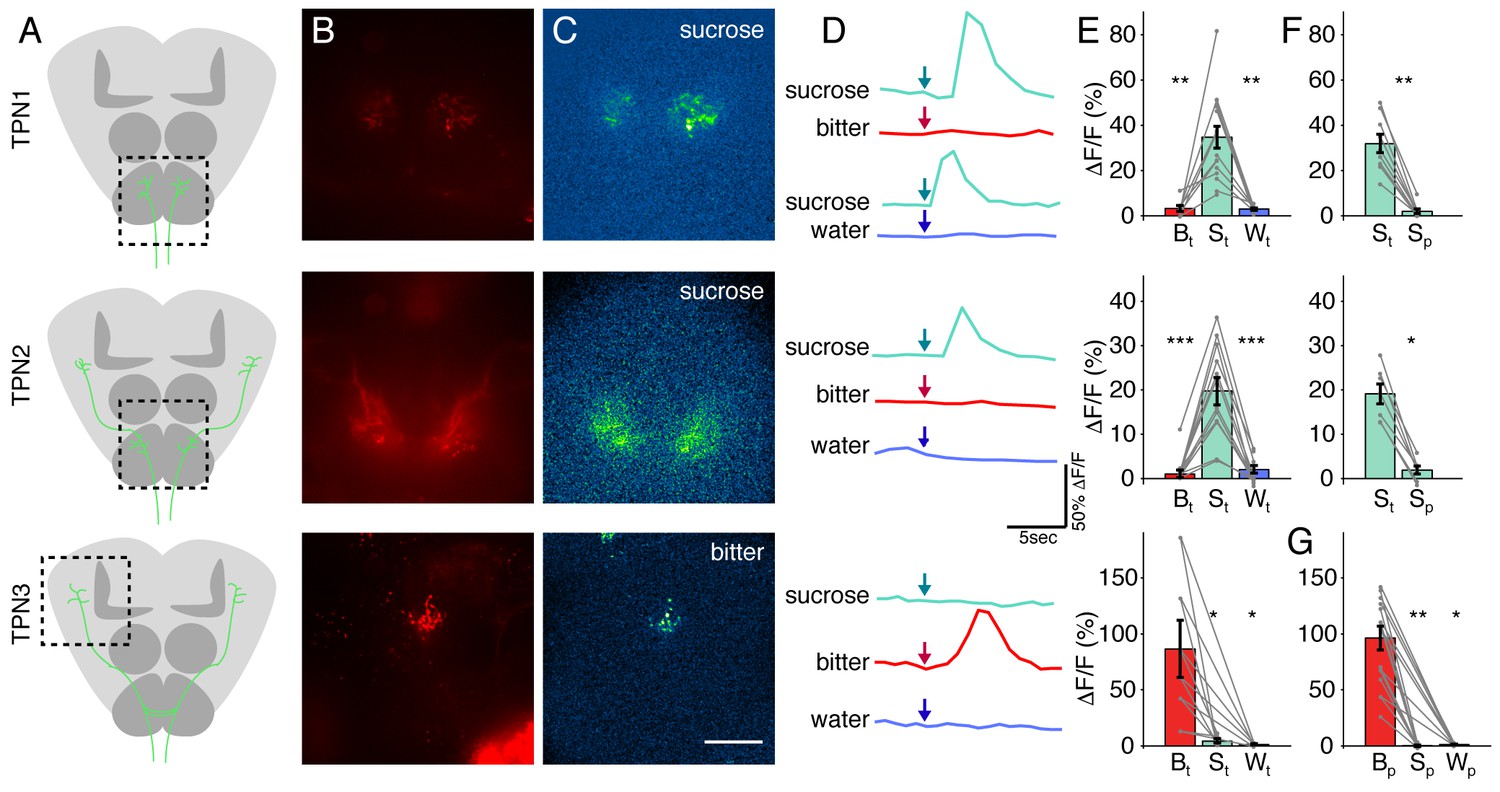
TPNs respond to taste compounds.
(A) Schematic brains showing anatomy of TPNs (green) and approximate region of calcium imaging (dashed box). (B) UAS-cd8-tdTomato signal used to locate axonal arbors of each neuron type. (C) △F signal in response to sucrose (TPN1 and TPN2) or bitter solution (TPN3). Scale bar, 50 μm. (D) Example △F/F traces in response to various tastants. Arrows indicate time at which each tastant was presented. (E) Summary max △F/F for leg stimulation with each tastant. TPN1 and TPN2 respond only to sucrose, while TPN3 responds only to bitter solution. (F) Summary max △F/F for sucrose presentation to legs or proboscis for TPN1 and TPN2. Responses to sucrose are organ specific; both TPN1 and TPN2 only respond to sucrose presentation to the legs. (G) Summary max △F/F for proboscis stimulation of each tastant for TPN3. TPN3 shows strong selectivity for bitter presentation to the proboscis as well. For E-G, S: sucrose; B: bitter; W: water; t: tarsi (legs); p: proboscis. Error bars indicate mean +/-± SEM. n = 6–12. Paired Wilcoxon tests: *p<0.05, **p<0.01, ***p<0.001.
Figure 3—figure supplement 1
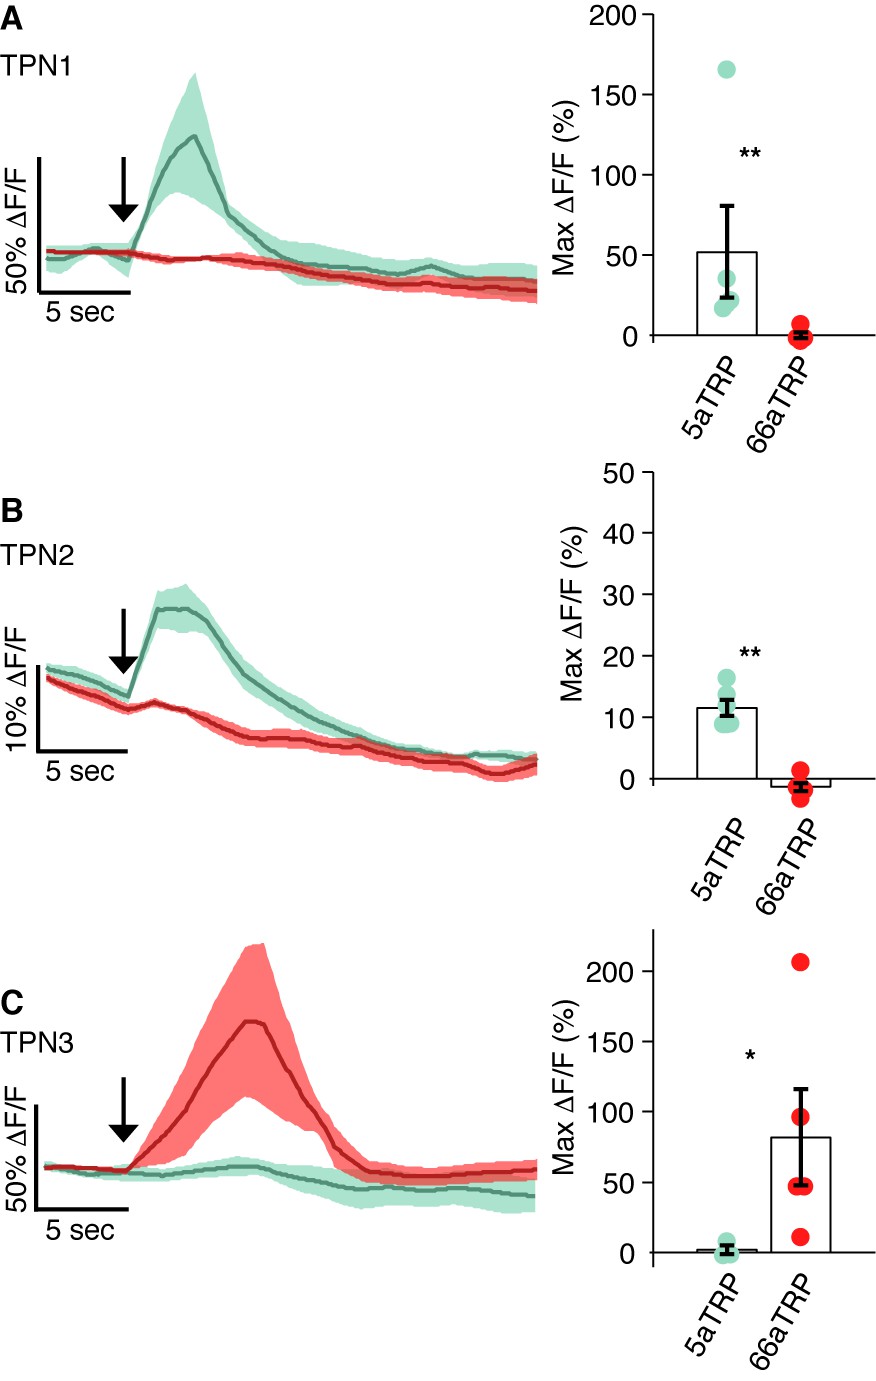
Calcium Imaging of TPNs with ectopic activation of GRNs.
Calcium responses in each TPN class were observed using GCaMP5 while a heat-activated channel (LexAop-dTRPA1) was expressed in either sugar GRNs (Gr5a-LexA) or bitter GRNs (Gr66a-LexA). In all panels, left shows trace of average △F/F signal with shaded SEM and right shows max △F/F values. (A) TPN1 shows robust response to heat when dTRPA1 is expressed in sugar GRNs (green), but not bitter GRNs (red) (p=0.0079). (B) TPN2 shows robust response to heat when dTRPA1 is expressed in sugar GRNs (green), but not bitter GRNs (red) (p=0.0022). (C) TPN3 shows robust response to heat when dTRPA1 is expressed in bitter GRNs (red), but not sugar GRNs (green) (p=0.0357). (A–C) Error bars are SEMs. n = 3–6. Statistical tests are Wilcoxon rank-sum.
Figure 4
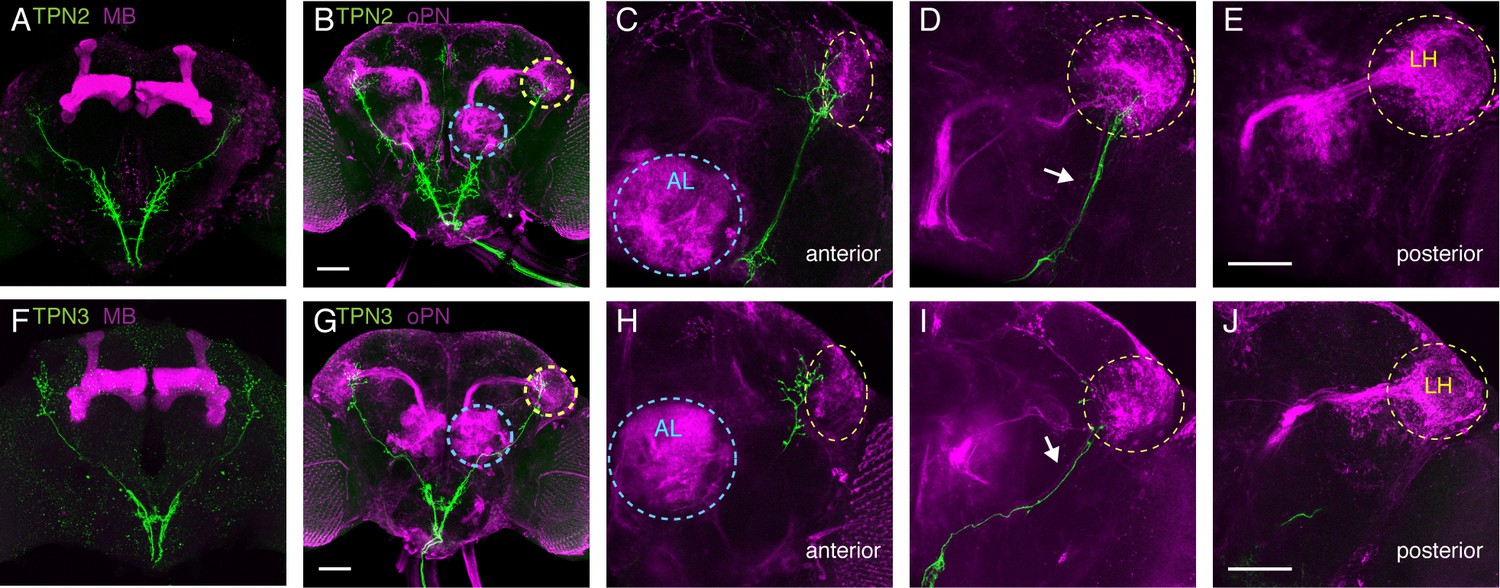
TPNs arborize near olfactory projection neurons.
(A) Co-labeling of TPN2 (green) and mushroom bodies (magenta) shows no overlap. (B) Co-labeling of TPN2 (green) and olfactory projection neurons (magenta) shows overlap in lateral horn (LH). Blue circles indicate antennal lobes (AL), yellow circles indicate LH. (C–E) Anterior to posterior sections of (B). White arrow points to lALT, running parallel to the TPN2 axon. (F) Co-labeling of TPN3 (green) and mushroom bodies (magenta) shows no overlap. (G) Co-labeling of TPN3 (green) and olfactory projection neurons (magenta) shows overlap in LH. (H–J) Anterior to posterior sections of (G). Scale bar, 50 μm.
Figure 5 with 1 supplement

Taste projection neurons influence proboscis extension.
(A) PER to activation with CsChrimson, in absence of a taste stimulus. Activation of sugar GRNs (Gr64f), TPN1, and TPN2 increase PER, compared to no retinal controls. For Gal4 control and Gr64f-Gal4, n = 17–24. For TPNs, n = 38–53. Fisher’s exact tests, **p<0.01, ***p<0.001. (B) PER to simultaneous CsChrimson activation and 100 mM sucrose presentation. Strong enhancement of PER was observed upon sugar GRN activation, but not TPN1 or TPN2 activation. Strong suppression of PER was observed for both bitter GRN (Gr66a) and TPN3 activation. PER suppression by TPN3 was observed with both Gal4 drivers. n = 42–58. Error bars indicate mean +/-± SEM. Wilcoxon rank-sum tests, ***p<0.001. (C) TPNs were conditionally silenced with Shits and PER was tested to a sweet solution (100 mM sucrose). Silencing TPNs did not affect PER to sweet solutions. n = 50–63. Error bars indicate mean +/-± SEM. Paired Wilcoxon tests. (D) TPNs were conditionally silenced with Shits and PER was tested to a sweet-bitter mixture (100 mM sucrose, 25 mM caffeine, and 0.5 mM denatonium). Small increases in PER rate in some experiments were not consistently found across conditions. n = 50–63. Error bars indicate mean +/-± SEM. Paired Wilcoxon tests, *p<0.05, **p<0.01.
Figure 5—figure supplement 1

Genetic controls for PER experiments.
(A) Genetic controls for Figure 5a: PER responses to red light. No significant effect on PER was observed. Fisher’s exact tests. n = 51–55. (B) Genetic controls for Figure 5b: PER rate to simultaneous red light and 100 mM sucrose stimulation. No significant effect on PER was observed. n = 14–57. Error bars indicate mean +/-± SEM. Wilcoxon rank-sum tests. (C) Genetic controls for Figure 5c. PER to sugar solution (500 mM sucrose). No significant effect on PER was observed. n = 48–59. Error bars indicate mean ± SEM. Paired Wilcoxon tests. (D) Genetic controls for Figure 5d. PER to sugar-bitter mixture (500 mM sucrose, 25 mM caffeine, and 0.5 mM denatonium). No significant effect on PER was observed. n = 48–59. Error bars indicate mean ± SEM. Paired Wilcoxon tests.
Figure 6 with 1 supplement

Taste projection neurons are essential for conditioned taste aversion.
(A) Schematic of aversive taste memory protocol experiments with flies expressing Shits in TPN1, TPN2 or TPN3. Flies were initially presented with 500 mM sucrose (pre-test) and only flies that showed reliable PER were included for the remainder of the experiment. Next, flies were presented with sucrose on their legs and their proboscis was touched with bitter 50 mM quinine upon PER (pairing). Finally, flies were presented with sucrose to the legs in 5 min intervals to test memory after pairing. (B) Aversive taste memory upon conditional silencing of TPN1 shows unimpaired memory at restrictive (30°C) temperature (red) when compared to permissive room temperature flies (gray), indicating TPN1 is not required for memory. (C) Conditional silencing of TPN2 shows impaired memory at restrictive temperature, specifically in tests after pairing, suggesting TPN2 is required for memory. (D) Conditional silencing of TPN3 produces defects during training and post-training, showing TPN3 is required for memory. (E) Schematic of aversive taste memory protocol experiments with flies expressing CsChrimson in TPN3. Experiments were conducted as described in A, except during pairing: proboscis stimulation with quinine was replaced with red light stimulation (i.e. activation of TPN3). (F) Activating TPN3 with CsChrimson, which replaces bitter application during training, serves as a US to produce robust learning. For B,C,D,F, error bars are 95% CI; for each CS presentation, the difference between the control and experimental conditions (e.g. gray and colored data points) were tested with Fisher’s Exact Tests with Bonferroni adjusted alpha levels of *p<0.005 (0.05/10), **p<0.001 (0.01/10), ***p<0.0001 (0.001/10).
Figure 6—figure supplement 1

Memory experiment controls.
(A–B) Shibire and CsChrimson aversive memory experiments for second TPN3 Gal4 line (C220) shows qualitatively similar results to first Gal4 line (Figure 6D and F). Error bars are 95% CI; Fisher’s Exact Tests with Bonferroni adjusted alpha levels of *p<0.005 (0.05/10), **p<0.001 (0.01/10), ***p<0.0001 (0.001/10).
Figure 7
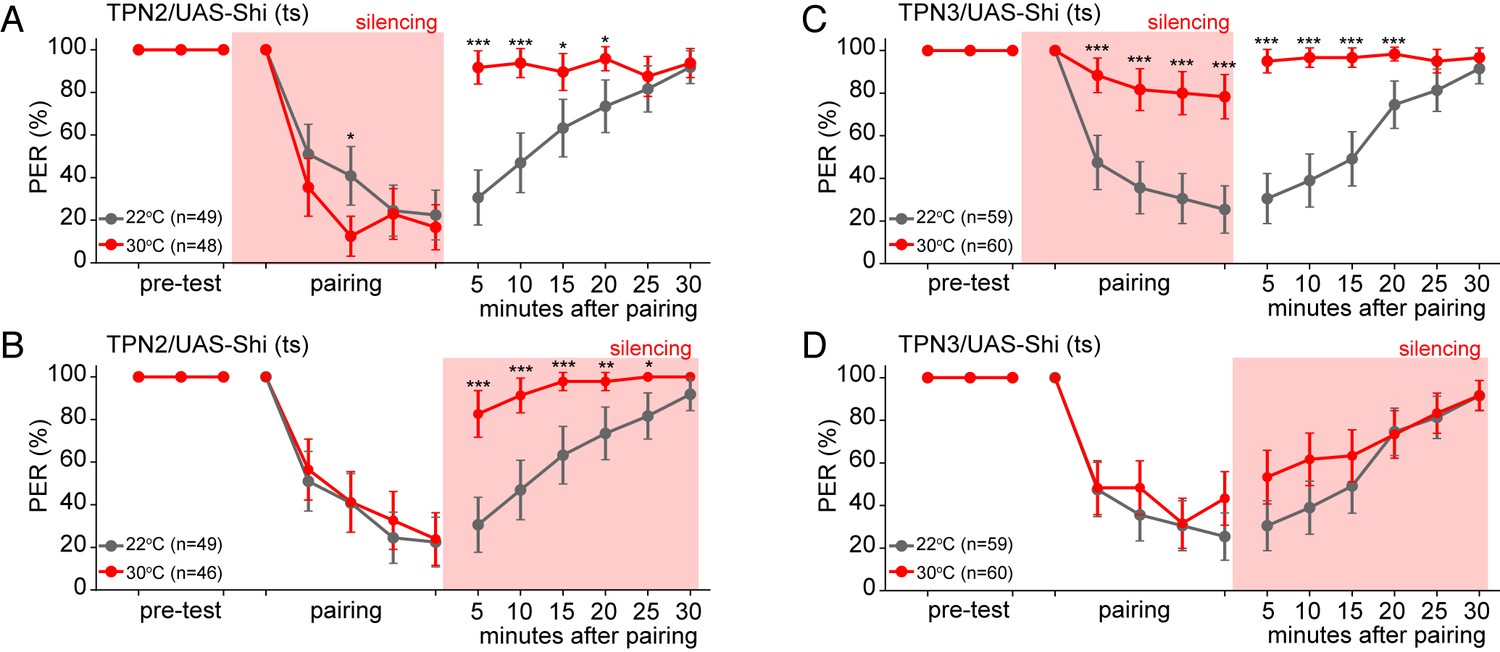
TPN2 carries the CS signal, while TPN3 carries the US signal.
A and B. Aversive taste memory is impaired upon conditional silencing of TPN2 during either the pairing (A) or the testing/retrieval (B) phases, suggesting TPN2 carries the CS signal. (C) Conditional silencing of TPN3 during the pairing phase shows the inability to form a memory, suggesting TPN3 carries the US signal. (D) Conditional silencing of TPN3 during the testing phase has no impact on memory. Error bars are 95% CI; Fisher’s Exact Tests with Bonferroni adjusted alpha levels of *p<0.005 (0.05/10), **p<0.001 (0.01/10), ***p<0.0001 (0.001/10).
Figure 8 with 1 supplement
TPNs act upstream of mushroom bodies to influence learned behaviors.
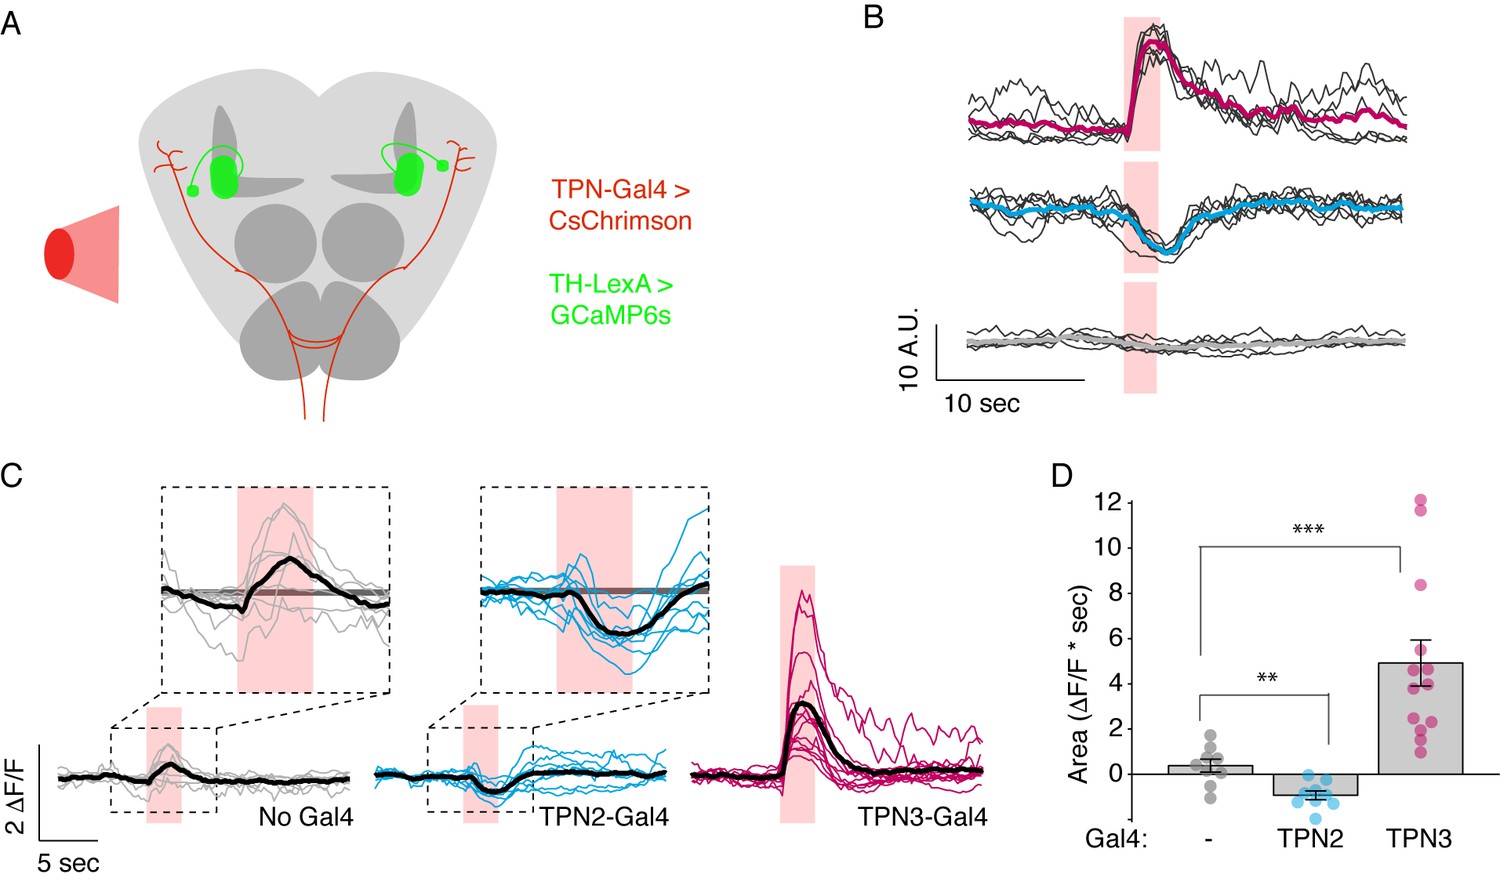
(A) Schematic for imaging calcium responses of PPL1-MV1 neurons to CsChrimson activation of TPN2 and TPN3. (B) Example single-animal light-triggered averages of PPL1-MV1 calcium responses to red light activation of TPN3 (top trace), TPN2 (middle trace), and control (bottom trace). Pink background indicates 3 s of red-light stimulation. Individual trails are shown with thin black lines, average trace with thick colored lines. TPN3 activation causes robust increases in PPL1 activity, while TPN2 activation causes a decrease in PPL1 activity. (C) Average PPL1-MV1 calcium responses across multiple animals. Thin colored traces are PPL1-MV1 recordings from individual animals, thick black traces are averages. (D) Average area under the curve. Compared to no Gal4 controls, TPN2 and TPN3 show significant decreases and increases in calcium signal, respectively. Error bars indicate mean ± SEM. n = 9–13. Wilcoxon rank-sum: **p<0.01, ***p<0.001.
Figure 8—figure supplement 1

Controls for PPL1 imaging experiments.
(A–B) Imaging calcium responses of PPL1-MV neurons to CsChrimson activation of second TPN3 Gal4 line (C220) shows qualitatively similar results to first Gal4 line (Figure 8B and D). n = 9–11. Error bars indicate mean ± SEM. Wilcoxon rank-sum: ***p<0.001. (C) Ex vivo calcium imaging of PPL1-MV1 neurons to CsChrimson activation of TPN2. PPL1-MV response across multiple animals (thin blue lines) shown with mean (thick black line) and standard deviation (gray area). (D) Ex vivo calcium imaging of PPL1-MV1 neurons to CsChrimson activation of TPN3. PPL1-MV response across multiple animals (thin pink lines) shown with mean (thick black line) and standard deviation (gray area). (E) Average area under the curve. TPN2 activation does not show reliable increase or decrease in PPL1-MV calcium signal (unlike in the in vivo experiments – Figure 8C,D). TPN3 activation shows reliable PPL1-MV1 activation (though smaller in magnitude compared to in vivo experiments). n = 6–7. Error bars indicate mean +/-± SEM. Wilcoxon rank-sum: **p<0.01.
Figure 9
TPNs action on all PPL1 lobes.
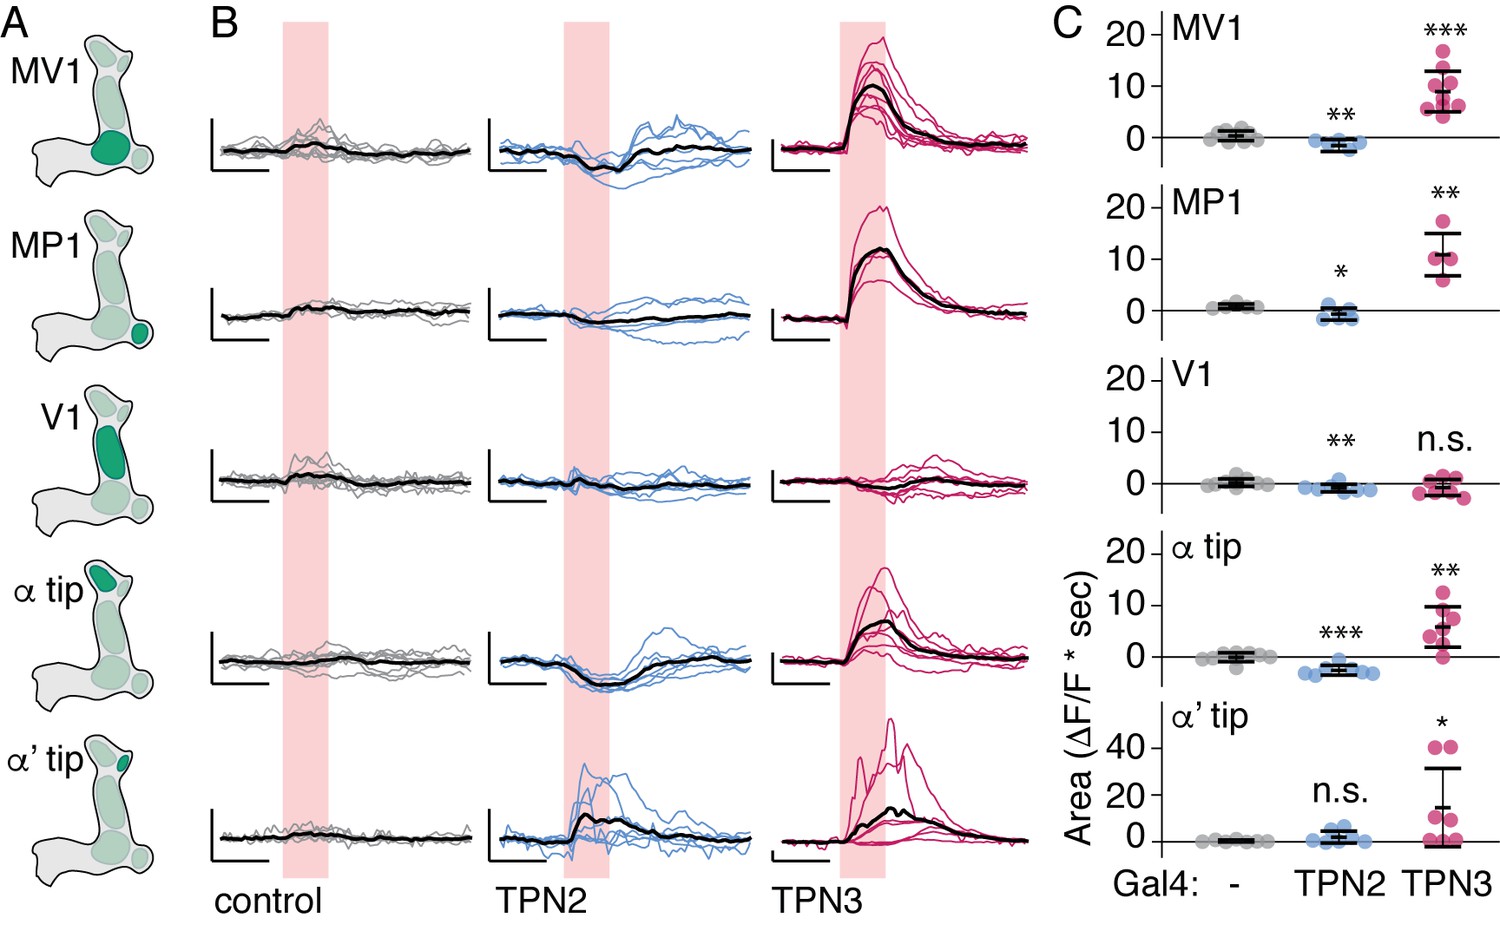
(A) Schematic specifying PPL1 region focused on for calcium imaging, with CsChrimson activation of TPN2 or TPN3. (B) Average response (black line) and individual traces (gray, blue, and red lines) of PPL1 regions to red light (no Gal4 driver control, TPN2 activation, and TPN3 activation, respectively). Control animals show no responses to red light, while activation of TPN3 generally increases calcium signals in all PPL1, and activation of TPN2 generally results in small but reliable decreases in calcium signal. Pink bar indicates time of laser stimulation. Horizontal scale bar = 5 s. Vertical scale bar = 1 △F/F. (C) Average area under the curve. Compared to no Gal4 controls, TPN2 and TPN3 show significant decreases and increases in calcium signal, respectively. Error bars indicate mean +/-± SEM. n = 9–13. Wilcoxon rank-sum: *p<0.05, **p<0.01, ***p<0.001.
Figure 10
TPN3 is not the only relay for bitter information to mushroom bodies .
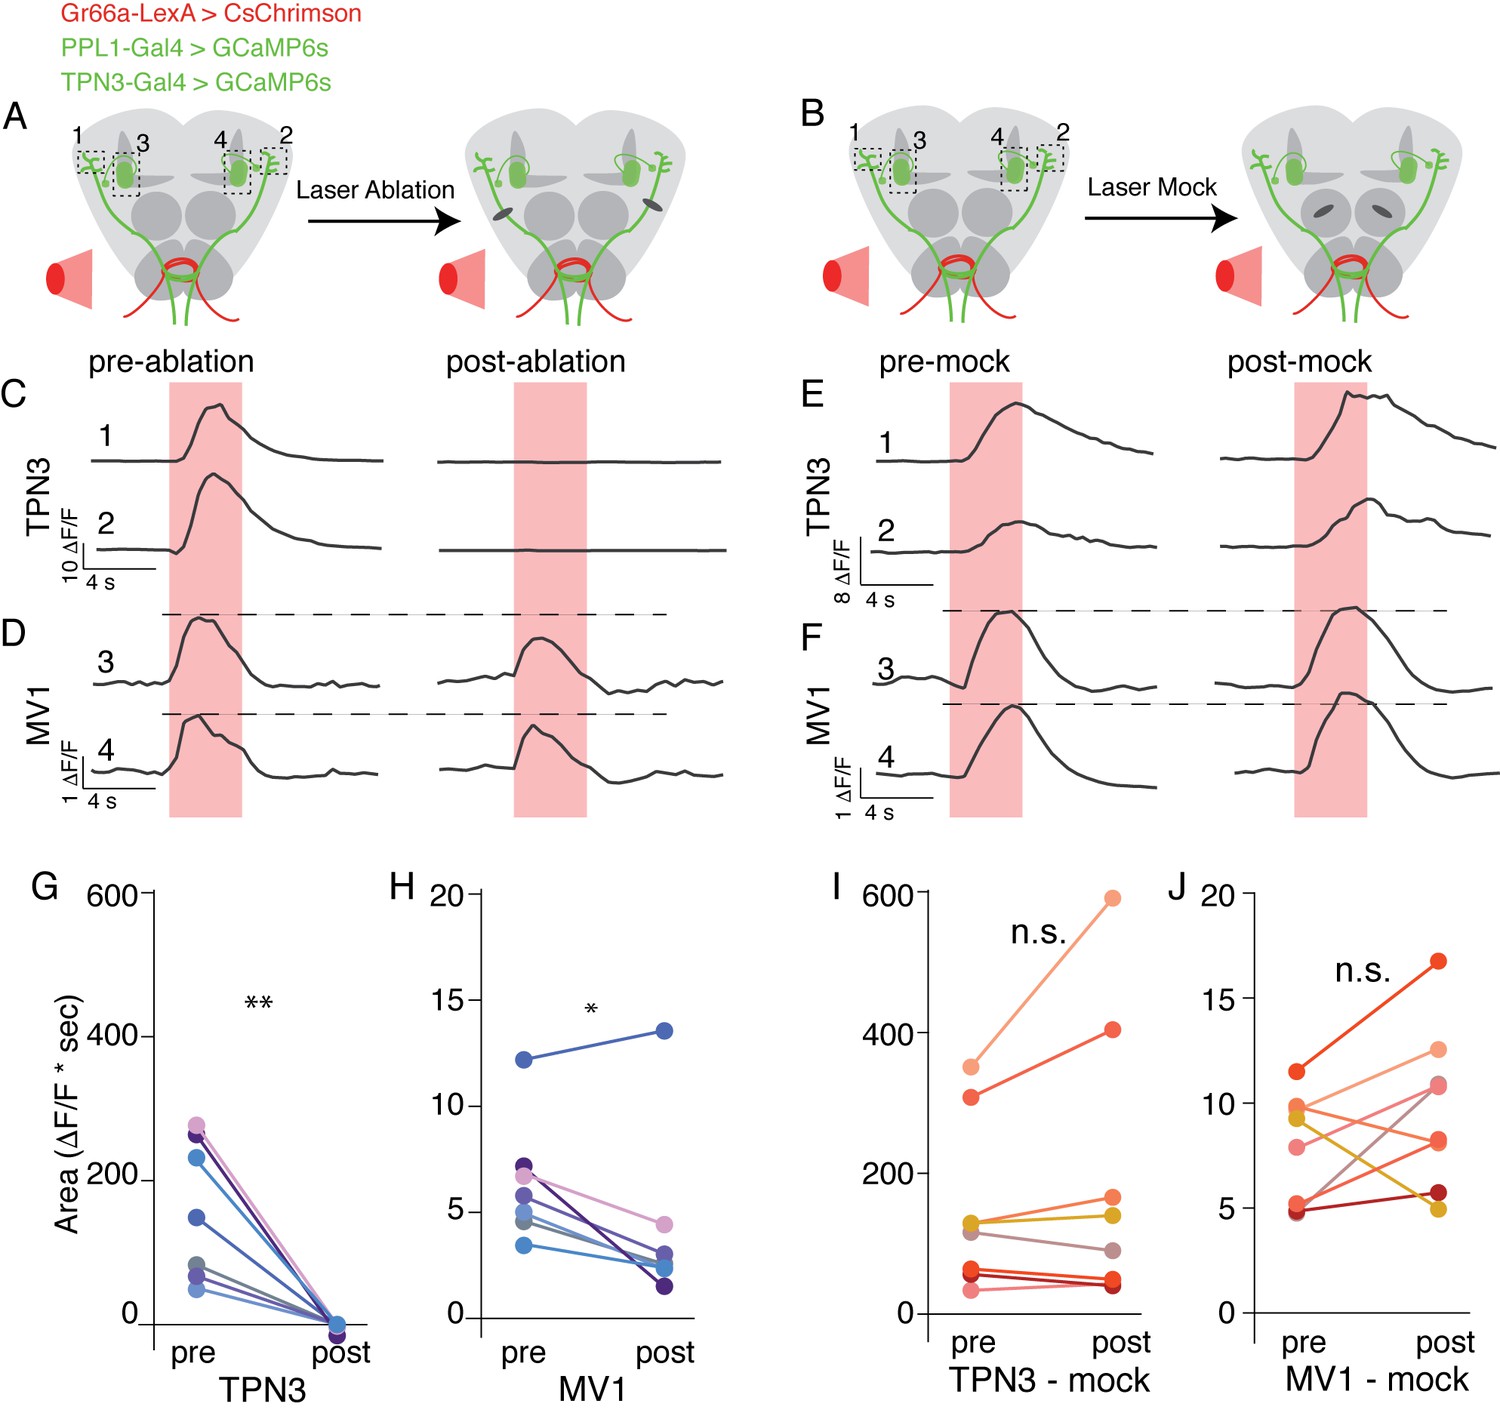
(A and B) Schematic of imaging and nerve-cut experiment. Bitter GRNs are activated via CsChrimson and calcium responses of TPN3 and the PPL1-MV1 cluster are imaged. Dashed boxes indicate approximate imaging window. (A) TPN3 axon is cut with multi-photon laser ablation and resection is verified with calcium imaging. (B) The multi-photon laser ablation is directed at the antennal lobe for a “mock ablation.” (C) Single animal example traces of calcium responses of TPN3 to red light stimulation of bitter GRN. Strong TPN3 response of red light pre-ablation (left) is completely abolished with axon resection of TPN3 (right). (D) Single animal example trace of calcium responses of PPL1-MV1 to red light stimulation of bitter GRN. Responses in PPL1-MV1 persist, but are reduced after TPN3 axon resection. Same animal as C. Horizontal dashed line indicates peak of pre-ablation response. (C and D) Trace numbers correspond to dashed boxes in A. Pink region indicates time of light stimulation. (E and F) Single animal example traces of calcium responses of TPN3 (E) and PPL1-MV1 (F) to red light stimulation of bitter GRN, before and after mock ablation. Responses of TPN3 and PPL1-MV1 do not change substantially after mock ablation. Trace numbers correspond to dashed boxes in B. Pink region indicates time of light stimulation. (G and H) Summary quantification of data with area under the curve for before and after TPN3 nerve cut. All animals showed complete loss of calcium response in TPN3 neurons (G) after laser ablation of nerve. Most animals showed an attenuation of response in PPL1-MV1 cluster after TPN3 laser ablation (H). n = 7. Wilcoxon rank-sum: *p<0.05, **p<0.01. Matched colors in G and H indicate the same animal. (I and J) Summary quantification of data before and after mock ablation. No significant change was observed in calcium response in TPN3 neurons (I) or PPL1-MV1 cluster (J) after mock ablation. n = 8. Wilcoxon rank-sum: n.s. = not significant. Matched colors in I & J indicate the same animal.
Tables
Table 1
Genotypes of Experimental Flies
| Figure | Description | Genotype |
|---|---|---|
| 1A | GRN anatomy | Gr66a-Gal4/CyO; UAS-cd8-tdTomato/Gr64fLexA, LexAop-cd2-GFP |
| 1B | TPN1 anatomy | UAS-GFP/+; R30A08-Gal4/+ |
| 1C | TPN2 anatomy | UAS-GFP/+; VT57358-Gal4/+ |
| 1D | TPN3 anatomy | tub>Gal80>/X; UAS-GFP/+; C220-Gal4/hsFLP, MKRS |
| 1 – fs1A | TPN1 single | UAS-GFP/+; R30A08-Gal4/+ |
| 1 - fs1B | TPN1 dendrite/axon | +/CyO; R30A08-Gal4/UAS-DenMark, UAS-synaptotagmin-eGFP |
| 1 - fs1C & D | TPN2 mosaics | tub>Gal80>/X; UAS-GFP/+; VT57358-Gal4/ hsFLP, MKRS |
| 1 - fs1E | TPN2 dendrite/axon | +/CyO; VT57358-Gal4/UAS-DenMark, UAS-synaptotagmin-eGFP |
| 1 - fs1F | TPN3 – 2nd Gal4 | UAS-GFP/+; C220-Gal4/+ |
| 1 - fs1G | TPN3 – 1st Gal4 | UAS-GFP/+; R11H09-Gal4/+ |
| 1 - fs1H | TPN3 – 2 cells only | UAS-GFP/UAS-RedStinger; C220-Gal4/R11H09-Gal4 |
| 1 - fs1I | TPN3 dendrite/axon | +/CyO; C220-Gal4/UAS-DenMark, UAS-synaptotagmin-eGFP |
| 2A & 2 – fs1 | Sugar GRN doubles | UAS-cd8tdTomato/CyO; R30A08-Gal4 / Gr64fLexA, LexAop-cd2-GFP UAS-cd8tdTomato/CyO; VT57358-Gal4 / Gr64fLexA, LexAop-cd2-GFP UAS-cd8tdTomato/CyO; C220-Gal4 / Gr64fLexA, LexAop-cd2-GFP |
| 2A & 2 – fs1 | Bitter GRN doubles | UAS-cd8tdTomato/Gr66a-LexA; R30A08-Gal4 / LexAop-cd2-GFP UAS-cd8tdTomato/Gr66a-LexA; VT57358-Gal4 / LexAop-cd2-GFP UAS-cd8tdTomato/Gr66a-LexA; C220-Gal4 / LexAop-cd2-GFP |
| 2A | Pheromone GRN doubles | UAS-cd8tdTomato/ppk23-LexA; R30A08-Gal4 / LexAop-cd2-GFP UAS-cd8tdTomato/ppk23-LexA; VT57358-Gal4 / LexAop-cd2-GFP UAS-cd8tdTomato/ppk23-LexA; C220-Gal4 / LexAop-cd2-GFP |
| 2A | Water GRN doubles | UAS-cd8tdTomato/ppk28-LexA, LexAop-cd2-GFP; R30A08-Gal4 / TM2 or 6b UAS-cd8tdTomato/ppk28-LexA, LexAop-cd2-GFP; VT57358-Gal4 / TM2 or 6b UAS-cd8tdTomato/ppk28-LexA, LexAop-cd2-GFP; C220-Gal4 / TM2 or 6b |
| 2B | Sugar GRN GRASP | Gr5a-LexA/X; UAS-cd8tdTomato/LexAop-CD4::spGFP11; R30A08-Gal4 or VT57358-Gal4 or C220-Gal4/UAS-CD4::spGFP1-10 |
| 2B | Bitter GRN GRASP | Gr66a-LexA/X; UAS-cd8tdTomato/LexAop-CD4::spGFP11; R30A08-Gal4 or VT57358-Gal4 or C220-Gal4/UAS-CD4::spGFP1-10 |
| 3 A-F top | TPN1 GCaMP | UAS-cd8tdTomato/UAS-GCaMP6s; R30A08-Gal4/UAS-GCaMP6s |
| 3 A-F middle | TPN2 GCaMP | UAS-cd8tdTomato/UAS-GCaMP6s; VT57358-Gal4/UAS-GCaMP6s |
| 3 A-E bottom and G | TPN3 GCaMP | UAS-cd8tdTomato/UAS-GCaMP6s; R11H09-Gal4/UAS-GCaMP6s |
| 3 – fs1 A | TPN1-GCaMP sugar-TRP | Gr5a-LexA/X; UAS-GCaMP5/UAS-cd8tdTomato; R30A08-Gal4/LexAop-dTRP |
| TPN1-GCaMP bitter-TRP | Gr66a-LexA/X; UAS-GCaMP5/UAS-cd8tdTomato; R30A08-Gal4 /LexAop-dTRP | |
| 3 – fs1 B | TPN2-GCaMP sugar-TRP | Gr5a-LexA/X; UAS-GCaMP5/UAS-cd8tdTomato; VT57358-Gal4 /LexAop-dTRP |
| TPN2-GCaMP bitter-TRP | Gr66a-LexA/X; UAS-GCaMP5/UAS-cd8tdTomato; VT57358-Gal4 /LexAop-dTRP | |
| 3 – fs1 C | TPN3-GCaMP sugar-TRP | Gr5a-LexA/X; UAS-GCaMP5/UAS-cd8tdTomato; C220-Gal4/LexAop-dTRP |
| TPN3-GCaMP bitter-TRP | Gr66a-LexA/X; UAS-GCaMP5/UAS-cd8tdTomato; C220-Gal4/LexAop-dTRP | |
| 4A | TPN2 & MB | MB-dsRed/UAS-GFP; VT57358-Gal4/ TM2 or 6b |
| 4F | TPN3 & MB | MB-dsRed/UAS-GFP; R11H09-Gal4/TM2 or 6b |
| 4 B-E | TPN2 & olfactory PN | GH146-QUAS, QUAS-mtdTomato / UAS-GFP; VT57358-Gal4/+ |
| 4 G-J | TPN3 & olfactory PN | GH146-QUAS, QUAS-mtdTomato / UAS-GFP; R11H09-Gal4/+ |
| 5 A & B | PER: noGal4 | UAS-CsChRimson/X; +; + |
| 5 A & B | PER: GR Gal4s | UAS-CsChRimson/X; Gr64f-Gal4/+; TM2 or TM6b/+ UAS-CsChRimson/X; Gr66a-Gal4/+; TM2 or TM6b/+ |
| 5 A & B | PER: TPN Gal4s | UAS-CsChRimson/X; +; R30A08-Gal4/+ UAS-CsChRimson/X; +; VT57358-Gal4/+ UAS-CsChRimson/X; +; R11H09-Gal4/+ |
| 5 C & D | Shi PER behavior | + / UAS- Shibire(ts) R30A08-Gal4/UAS-Shibire(ts) VT57358-Gal4/UAS-Shibire(ts) R30A08-Gal4, VT57358-Gal4/UAS-Shibire(ts) R11H09-Gal4/UAS-Shibire(ts) C220-Gal4/UAS-Shibire(ts) |
| 5 – fs1A & B | Gr-Gal4s | Gr64f-Gal4/+; TM2 or TM6b/+ Gr66a-Gal4/+; TM2 or TM6b/+ |
| 5 – fs1A & B | TPN-Gal4s | R30A08-Gal4/+ VT57358-Gal4/+ R11H09-Gal4/+ C220-Gal4/+ |
| 5 – fs1 C & D | TPN-Gal4s (controls for PER with Shi) | R30A08-Gal4/+ VT57358-Gal4/+ R11H09-Gal4/+ C220-Gal4/+ |
| 6B | Memory – TPN1 Shi | R30A08-Gal4/UAS-Shibire(ts) |
| 6C | Memory – TPN2 Shi | VT57358-Gal4/UAS-Shibire(ts) |
| 6D | Memory – TPN3 Shi | R11H09-Gal4/UAS-Shibire(ts) |
| 6F | Memory – TPN3 Chrimson | UAS-CsChRimson/X; +; R11H09-Gal4/+ |
| 6 – fs1A | TPN3 – 2nd Gal4 | X; +; C220-Gal4/UAS-Shibire(ts) |
| 6 – fs1B | TPN3 – 2nd Gal4 | UAS-CsChRimson/X; +; C220-Gal4/+ |
| 7 A & B | Memory – TPN2 Shi | VT57358-Gal4/UAS-Shibire(ts) |
| 7 C & D | Memory – TPN3 Shi | R11H09-Gal4/UAS-Shibire(ts) |
| 8 & 9 | PPL1 - control | UAS-CsChRimson/X; LexAop-GCaMP6s; TH-LexA/TM3-ser |
| 8 & 9 | PPL1 – TPN2 | UAS-CsChRimson/X; LexAop-GCaMP6s; TH-LexA/ VT57358-Gal4 |
| 8 & 9 | PPL1 – TPN3 | UAS-CsChRimson/X; LexAop-GCaMP6s; TH-LexA/ R11H09-Gal4 |
| 8 – fs1A | PPL1 imaging | UAS-CsChRimson/X; LexAop-GCaMP6s; TH-LexA/C220-Gal4 |
| 8 – fs1B | PPL1 imaging | UAS-CsChRimson/X; LexAop-GCaMP6s; TH-LexA/TM3-ser UAS-CsChRimson/X; LexAop-GCaMP6s; TH-LexA/C220-Gal4 |
| 8 – fs1C-E | PPL1 ex vivo imaging | UAS-CsChRimson/X; LexAop-GCaMP6s; TH-LexA/ VT57358-Gal4 UAS-CsChRimson/X; LexAop-GCaMP6s; TH-LexA/ R11H09-Gal4 |
| 10 | Gr66a-LexA, LexAop-CsChrimson / UAS-CD8-tdTomato; UAS-GCaMP6s / MB065B-Gal4 AD; R11H09-Gal4, UAS-GCaMP6s / MB065B-Gal4 DBD |
Download links
A two-part list of links to download the article, or parts of the article, in various formats.
Downloads (link to download the article as PDF)
Open citations (links to open the citations from this article in various online reference manager services)
Cite this article (links to download the citations from this article in formats compatible with various reference manager tools)
Long-range projection neurons in the taste circuit of Drosophila
eLife 6:e23386.
https://doi.org/10.7554/eLife.23386


