A novel Drosophila injury model reveals severed axons are cleared through a Draper/MMP-1 signaling cascade
- Oregon Health and Science University, United States
- The University of Melbourne, Australia
Figures
Figure 1
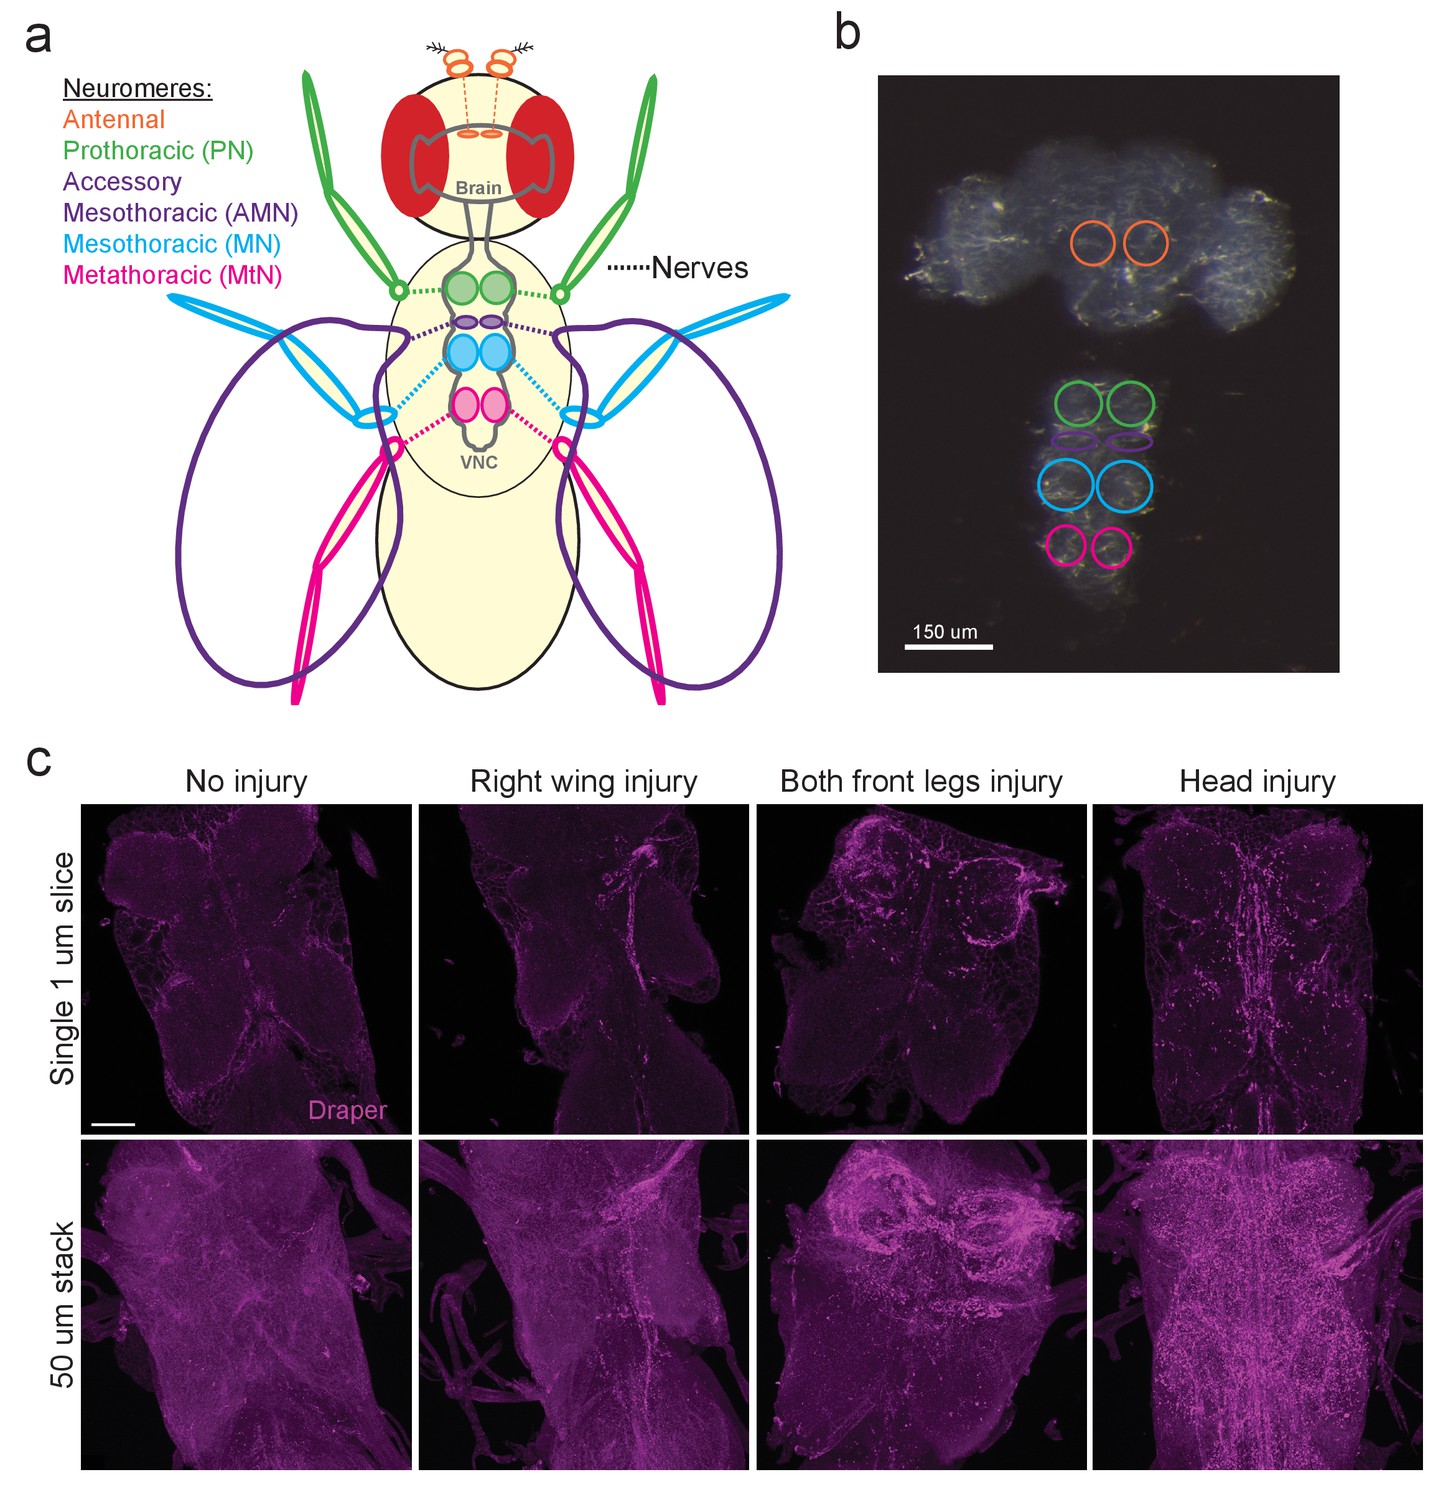
The Drosophila VNC serves as a new model to study glial responses to acute axotomy.
(a) Schematic representation of Drosophila brain and VNC showing major neuromere regions as uniquely colored circled regions in the CNS. Color of appendages (antennae, legs, wings) correspond to the neuromere through which the nerves from each structure project. (b) DIC image of adult brain and VNC with the corresponding neuropil regions from (a) highlighted with color-coded circles. (c) Representative Draper immunostainings of uninjured VNC and one day after right wing severing, both front legs severed and head removal. Top images show single one-micron slice, while bottom images display 50 μm maximum intensity projection. Unless otherwise noted, scale bar = 30 μm. Genotypes: Figure 1c: w1118.
Figure 2
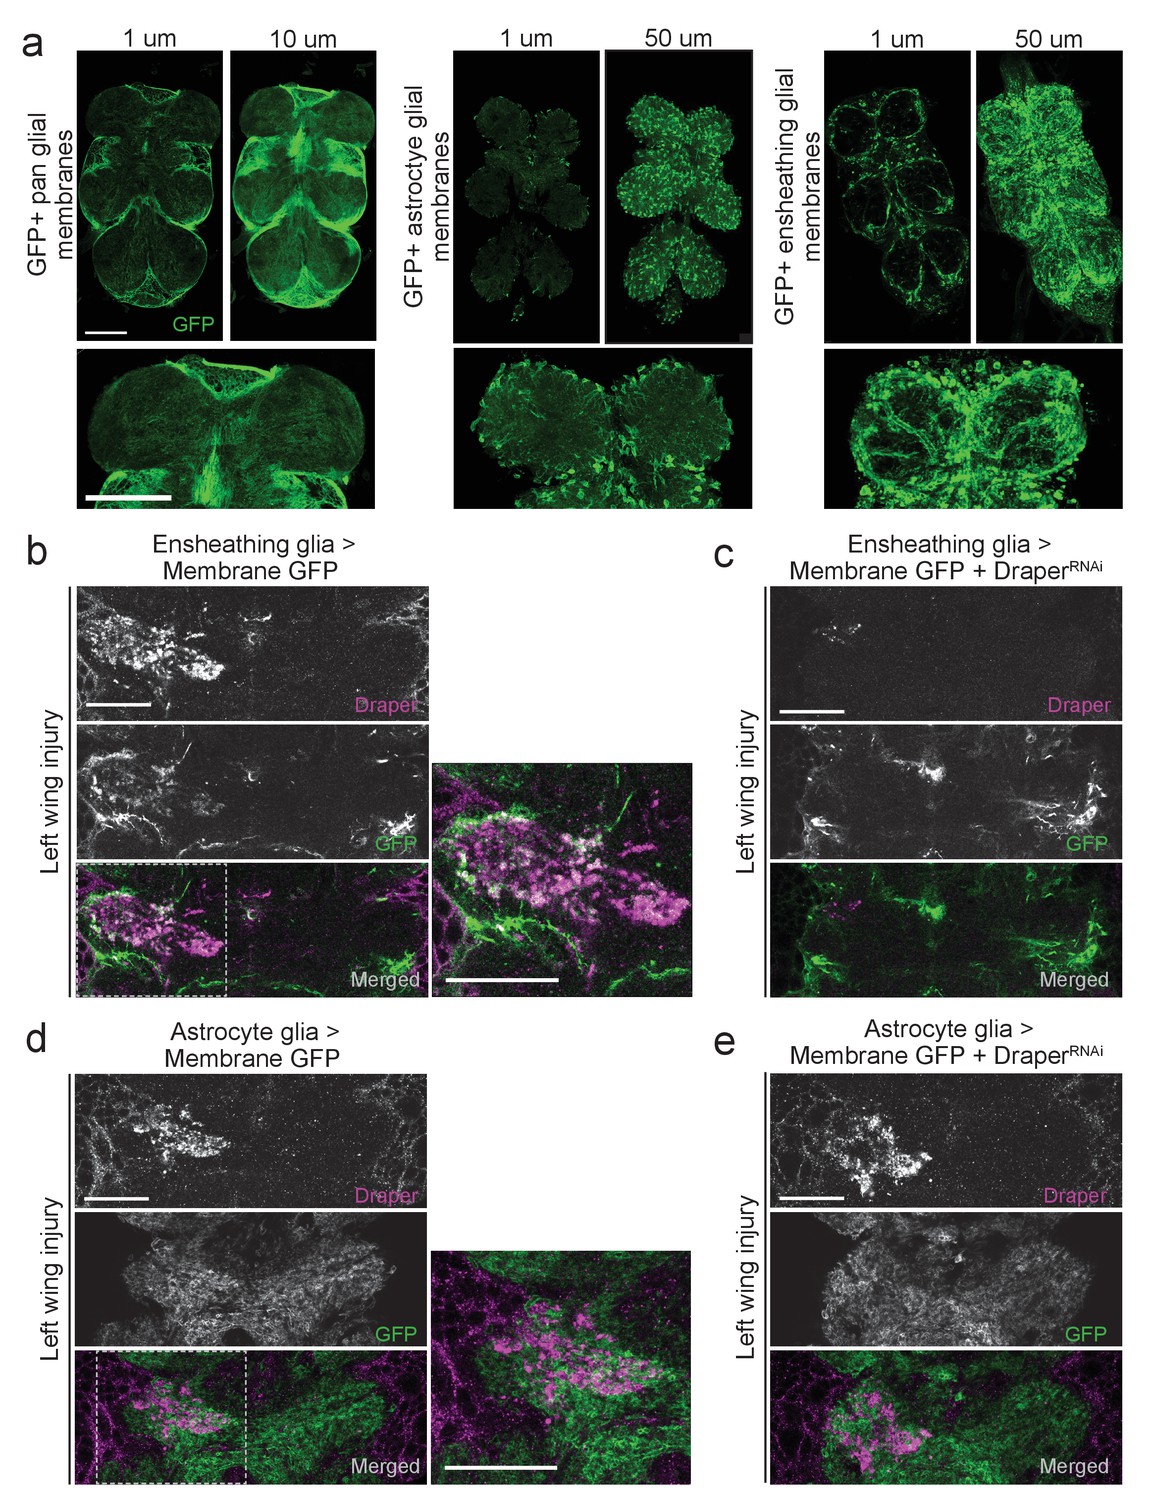
Draper and ensheathing glial membranes are recruited to injury sites in the adult VNC after peripheral axotomy.
(a) Membrane-tethered GFP (UAS-mCD8::GFP) was expressed under the control of a pan glial driver (left), astrocyte-specific driver (middle), or ensheathing glial driver (right). Images depict single micron slices ~15 μm deep into the VNC. 10 μm (pan-glial) or 50 μm (astrocytes and ensheathing glia) Z-stack projections are also shown. Lower images depict 5 μm (pan glial) or 20 μm (astrocytes, ensheathing glia) higher magnification projections of the prothoracic neuromeres. (b-d) One-micron single confocal slice images showing GFP-labeled glial membranes (mCD8::GFP) and Draper immunostaining of the AMN neuropil region after left wing injury. (b, c) Ensheathing glia expressing mCD8::GFP alone (b) or co-expressing DraperRNAi animals (c). (d, e) Astrocyte glia expressing mCD8::GFP alone (b)or co-expressing DraperRNAi animals. High magnification merged images in (b) and (d) show regions outlined with dotted line. Scale bars = 30 μm. Genotypes: Figure 2a: pan glial: repo-Gal4,UAS-mCD8::GFP/TM3. astrocytes: UAS-mCD8::GFP/CyO; alrm-Gal4/TM3. ensheathing glia: UAS-mCD8::GFP/CyO; TIFR-Gal4/TM3. Figure 2b: UAS-mCD8::GFP/CyO; TIFR-Gal4/TM3. Figure 2c: UAS-mCD8::GFP/CyO; TIFR-Gal4/DraperRNAi. Figure 2d: UAS-mCD8::GFP/CyO; alrm- Gal4/TM3. Figure 2e: UAS-mCD8::GFP/CyO; alrm-Gal4/DraperRNAi.
Figure 3
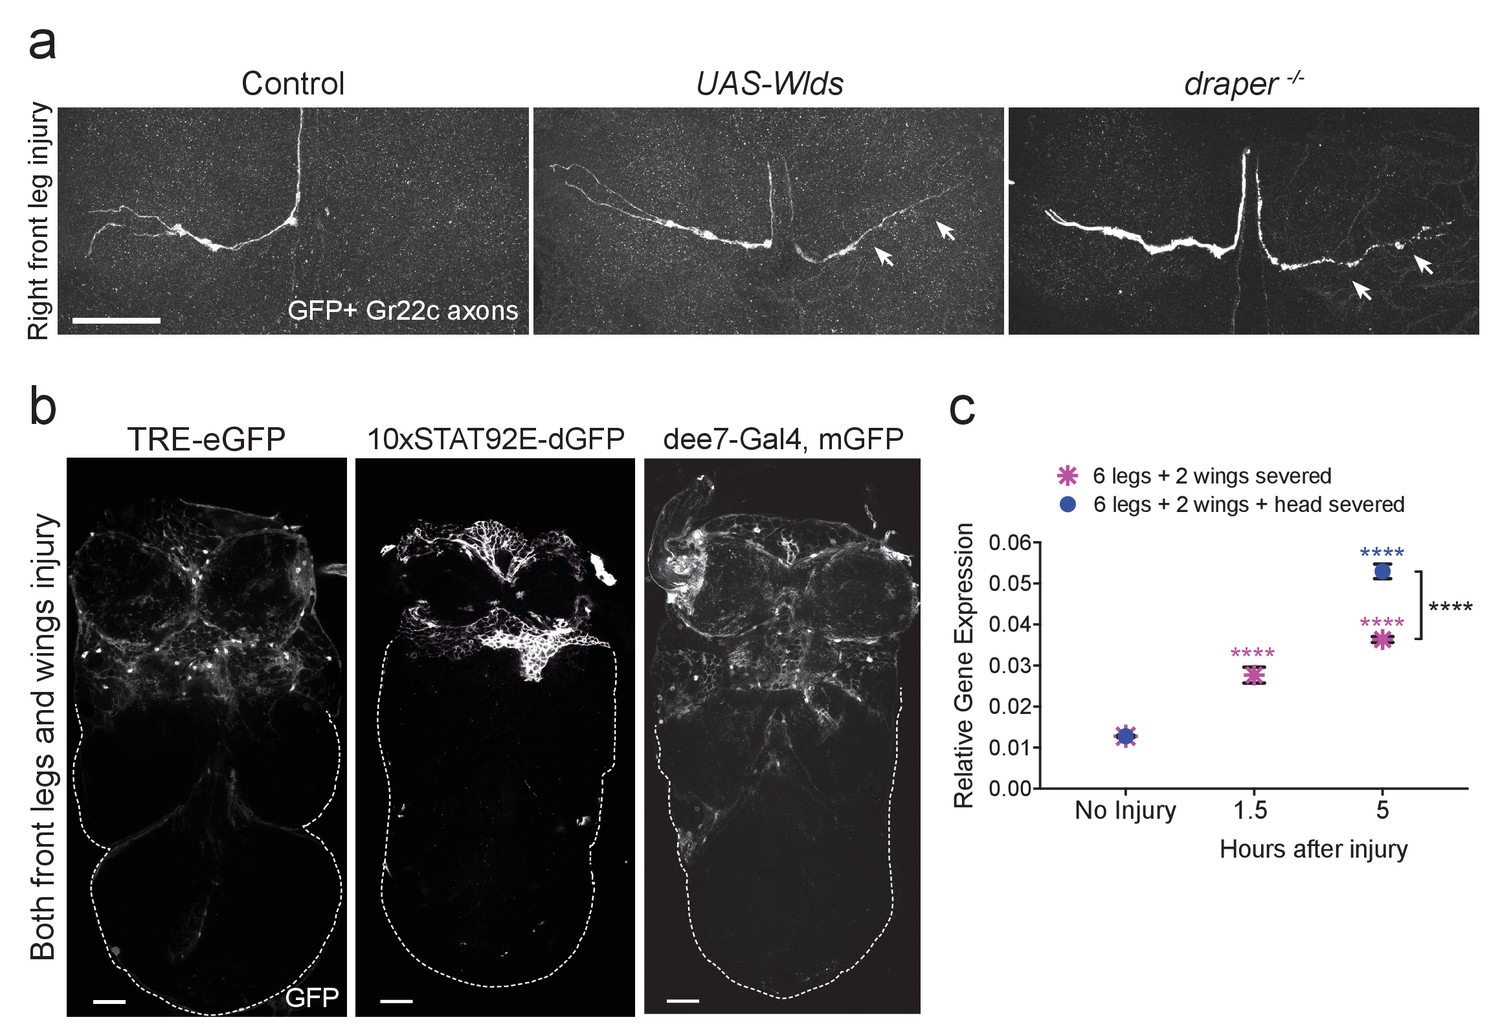
Draper is required for clearance of sensory neuron axons undergoing Wallerian degeneration in the adult VNC.
(a) Representative confocal images of the prothoracic neuromere (PN) region two days after the front right leg injury are shown. GFP-labeled Gr22c gustatory axons in the PN region of control flies (left), with co-expression of Wlds (center), or in a draper mutant background (right). Arrows point to axon that failed to degenerate in Wlds-expressing axons or degenerating axons that remained uncleared in draper mutants. (b) Representative one micron images of adult VNCs from flies that carry the AP-1 reporter TRE-eGFP, 10XSTAT92E-dGFP, or the Draper reporter dee7-GFP. Reporter activation was largely restricted to the PN and AMN regions after injury to both front legs and wings. Dotted line shows outline of the posterior VNC tissue housing uninjured projections. (c) Quantitative real-time PCR of normalized expression levels of draper-I transcript in VNCs following injury to all legs and both wings (magenta asterisks) or following injury to all legs, both wings, and head decapitation (blue circles). Draper threshold cycle (Ct) values were normalized to ribosomal protein L32. Biological replicates: 6 legs + 2 wings: No Injury N = 8; 1.5 hr N = 3; 5 hr N = 3. 6 legs + 2 wings+head: No Injury N = 8; 5 hr N = 7. Mean ± SEM plotted; ****p<0.0001; Two-way ANOVA with Sidak post hoc test. Each injury group was compared to uninjured in the same group. Black asterisks depict comparison between the two injury groups at the 5 hr time point. Scale bars = 30 μm. Genotypes: Figure 3a: Control: Gr22c-Gal4/+; UAS-mCD8::GFP/+. Wlds: UAS-Wlds/+; Gr22c-Gal4/+; UAS-mCD8::GFP/+. draper-/-: Gr22c-Gal4/UAS-mCD8::GFP; draperΔ5rec9/draperΔ5rec9. Figure 3b: TRE-eGFP: TRE-eGFP/TRE-eGFP (on II); 10xSTAT92E-dGFP: 10xSTAT92E-dGFP/10xSTAT92E-dGFP (on II); dee7-Gal4, mGFP: dee7-Gal4, UAS-mCD8::GFP/CyO. Figure 3c: w1118.
Figure 4
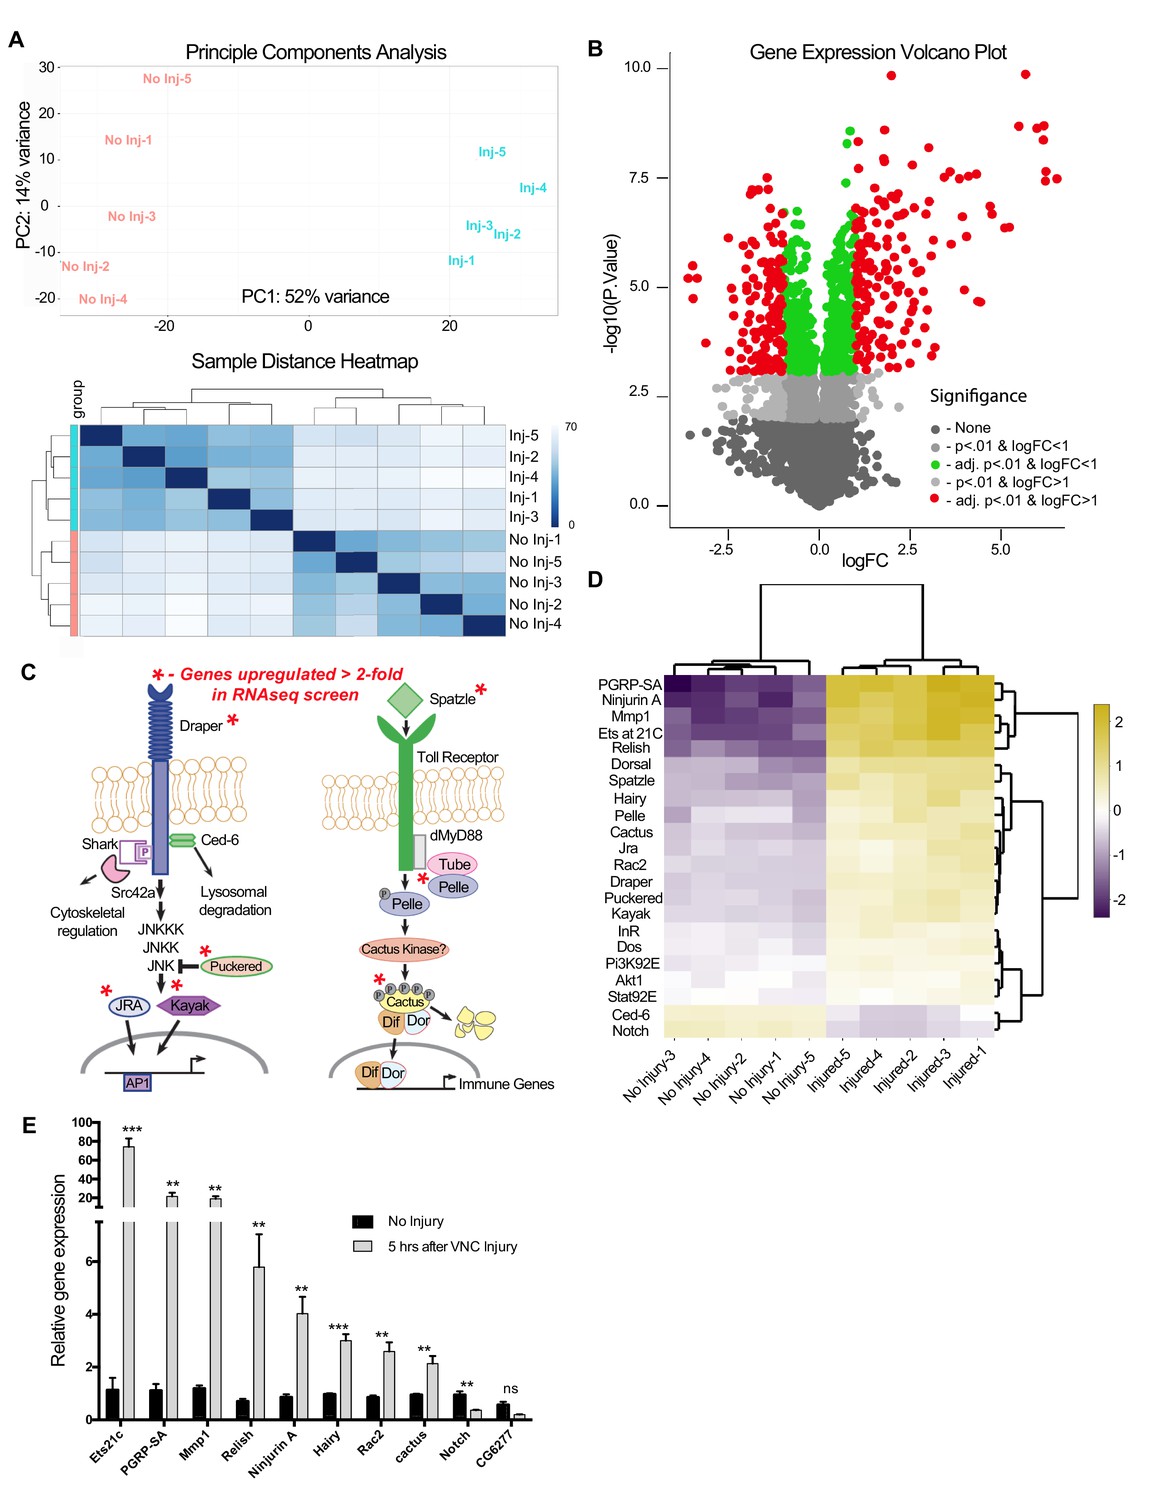
RNA-seq analysis reveals functionally discrete groups of injury-induced genes in the adult VNC.
(a) A Principal Component Analysis (top) and Sample Distance Heatmap (bottom) of all biological replicates (uninjured and injured) generated in START for genes expressed at >2 TPM (9364 genes). (b) Volcano plot of the gene expression analysis generated in START. The threshold for differential expression was set at 2-fold change (log2 = 1) with an adjusted p-value<0.01. logFC = log of fold change. adj. = adjusted (for multiple comparisons by Benjamin-Hochberg procedure). (c) Analysis of injury-induced gene expression revealed known members of the highly conserved Draper/AP-1 and Toll pathways. Genes upregulated ≥2.0 fold in VNC post-injury are noted with red asterisks. (d) START-generated heat map for a small set of hand-selected genes, including genes highlighted in panels (c) and (e), as well as genes previously identified as requisite factors during glial clearance of severed axons (see Figure 4—source data 5). Top dendrogram depicts hierarchical clustering of sample distances calculated from gene listed on left side of map. Right dendrogram was generated according to fold-change (uninjured versus injured). Genes at the top of the list were strongly upregulated in injured samples. (e) Quantitative real-time PCR validation of a subset of upregulated or downregulated genes from RNA-seq screen. N ≥ 3 biological replicates; mean ±. SEM plotted; ***p<0.001; **p<0.01; ns = not significant; Students t-test. Genotypes: Figure 4e: w1118.
-
Figure 4—source data 1
RNA assessment, sequencing and alignment metrics.
- https://doi.org/10.7554/eLife.23611.006
-
Figure 4—source data 2
Read counts, Transcripts per Kilobase Million (TPM), biological replicates correlation matrices, and differentially expressed genes.
- https://doi.org/10.7554/eLife.23611.007
-
Figure 4—source data 3
Overall DIOPT analysis for differentially expressed genes.
- https://doi.org/10.7554/eLife.23611.008
-
Figure 4—source data 4
Previously identified Drosophila genes functionally implicated in glial responses to axon injury.
- https://doi.org/10.7554/eLife.23611.009
-
Figure 4—source data 5
Comparison of fold change as measured via RNA-seq and RT-PCR methods (Pearson correlation).
- https://doi.org/10.7554/eLife.23611.010
Figure 5 with 1 supplement
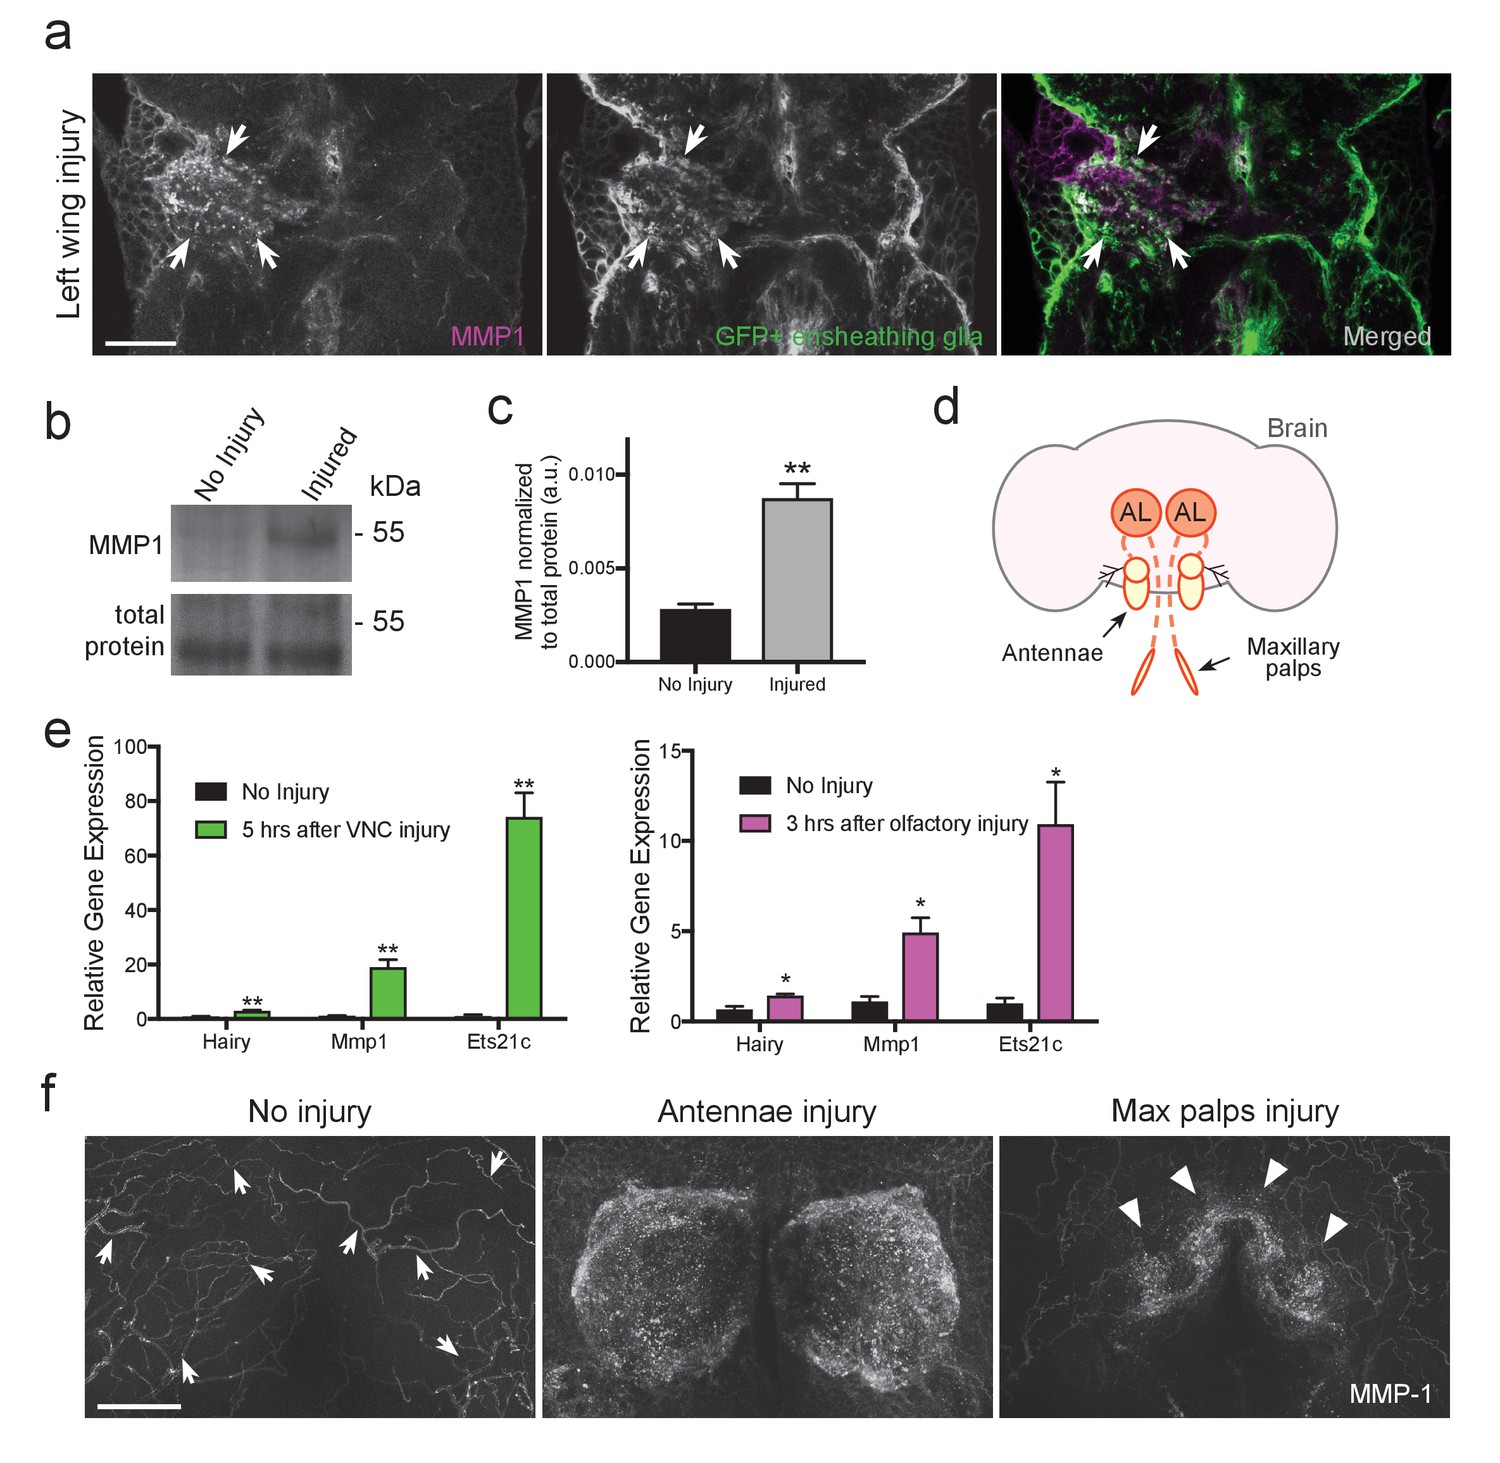
MMP-1 is upregulated in the adult VNC and the antennal lobes in response to axon neurodegeneration.
(a) Representative one-micron confocal images of the anterior VNC expressing membrane-tethered GFP in ensheathing glia and immunostained for MMP-1 after left wing injury. White arrows point regions of increased Draper and glial membrane GFP on the side of injury. (b) Western blot stained with anti-MMP-1 (top panel) and total protein stain (bottom). VNC lysates from uninjured and injured (all legs and both wings) w1118 flies. (c) Quantification of MMP-1 Western blots shown in panel b; **p<0.01; unpaired t-test; N = 4 biological replicates. (d) Schematic representation of the adult olfactory nerve injury assay. Olfactory neurons within the antennae and maxillary palps project into the antennal lobes (dark orange circles labeled as AL). (e) Comparative Q-PCR analysis of three select upregulated genes from RNA-seq screen (hairy, MMP-1 and ets21c) in injured VNCs (legs, wings, and head) (left) and in the central brain after bilateral antennal and maxillary nerve axotomy (right). Values were normalized to ribosomal protein L32. N = 3 biological replicates per group. Mean ± SEM plotted; **p<0.01; *p<0.05; unpaired t-test. (f) Maximum intensity projections (25 μm) of MMP-1 immunostaining in the antennal lobe region of adult brains. In uninjured animals MMP-1 expression is localized to the trachea (arrows). Robust MMP-1 activity is observed in flies after a bilateral antennal injury. Specific accumulation of MMP-1 on maxillary palp axons and glomeruli after bilateral maxillary nerve axotomy indicated by arrowheads. Scale bars = 30 μm. Genotypes: Figure 5a: UAS-mCD8::GFP/CyO; TIFR-Gal4/TM3. Figure 5b–f: w1118.
Figure 5—figure supplement 1
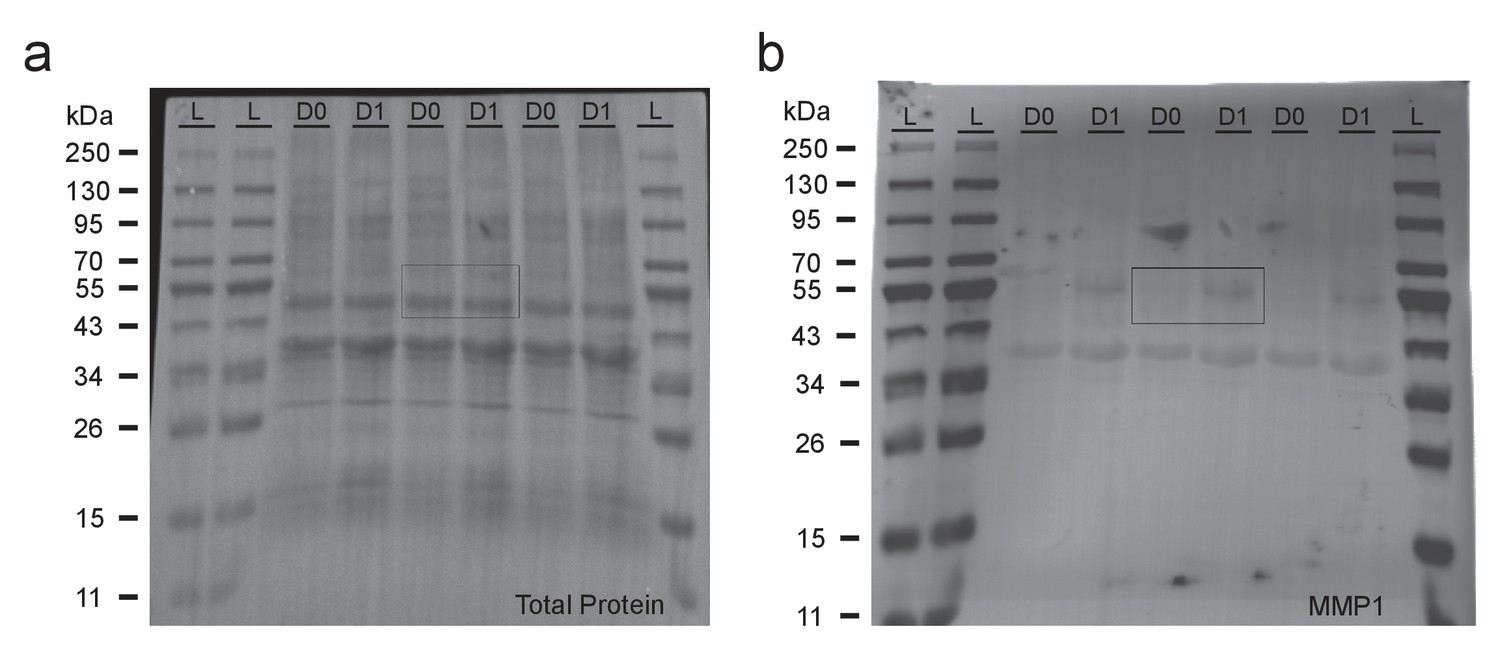
Uncropped Western blots shown in Figure 5b.
(a) Total protein blot displaying three biological replicates for uninjured (D0) and injured (D1) samples. Legs and wings were removed 24 hr prior to dissections for injured samples. (b) Fluorescence image of the blot displayed in (a) probed for MMP-1. Boxes highlight cropped areas in Figure 5b.
Figure 6

MMP-1 largely overlaps with ensheathing glia and degenerating axons after olfactory nerve injury.
(a–d) Representative high magnification images of MMP-1 expression three days after antennal nerve injury in flies expressing membrane tethered GFP in discrete antennal lobe cell types. The same antennal lobe region for each uninjured and injured sample is shown. (a) After injury, MMP-1 (magenta) co-localizes with expanding GFP-labeled ensheathing glial membranes (green) (arrows). (b) GFP-labeled astrocyte glial membranes (green) display little overlap with MMP-1 (magenta) after injury. (c,d) After antennal nerve injury, MMP-1 (magenta) is void in glomeruli that contain uninjured GFP-labeled OR85e maxillary palp axons (green, dotted outline). (d) Pan-ORN expression of GFP (green) shows MMP-1 (magenta) accumulation in regions of degenerating ORN material (arrowheads) and lack of MMP-1 in areas that house maxillary palp ORNs (dotted outlines). Scale bars = 10 μm. One micron slice shown for all panels. Genotypes: Figure 6a: UAS-mCD8::GFP/Cyo; TIFR-Gal4/TM3; Figure 6b: UAS-mCD8::GFP/CyO; alrm-Gal4/TM3; Figure 6c: OR85e-mCD8::GFP/CyO; Figure 6d: w1118; orco-Gal4/UAS-mCD8::GFP.
Figure 7
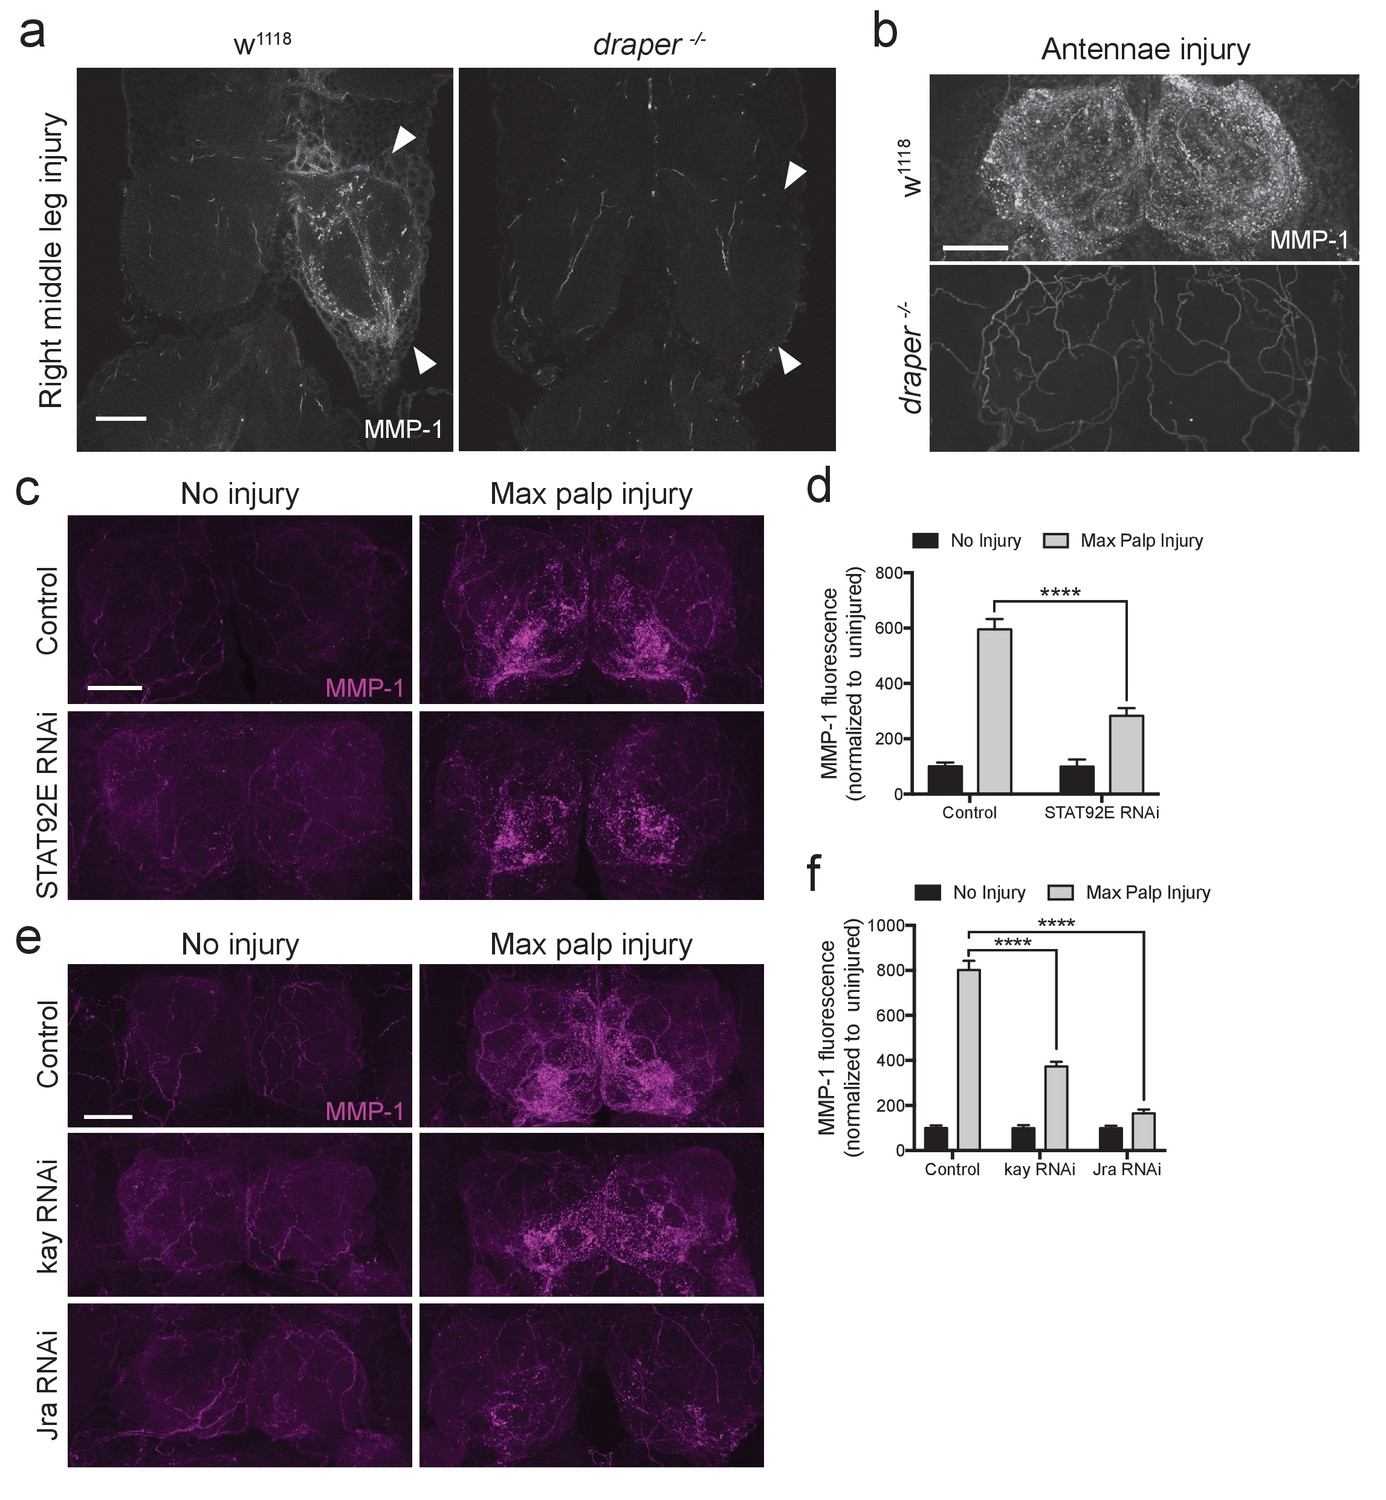
Draper/STAT92E/AP-1 are required for MMP-1 upregulation after injury.
(a) Representative images of control and draper null animals one day after right middle leg injury. One-micron slices shown. Arrowheads point to neuropil that contain injured projections. (b) Representative images of control and draper null animals one day after bilateral antennal nerve axotomy. Maximum intensity projections shown (25 um). (c) Adult specific knockdown of STAT92E in glial cells leads to attenuated MMP-1 response to maxillary palp injury. Maximum intensity projections (25 μm) of MMP-1 immunostainings in control and STAT92ERNAi flies. (d) Quantification of MMP-1 fluorescence in (c). Antennal lobes quantified: Control: No Injury N = 17; MP Injury N = 22. STAT92eRNAi: No Injury N = 10; MP Injury N = 14. Mean ± SEM plotted; ****p<0.0001; One-way ANOVA with Sidak post hoc test. (e) Adult specific knock down of kay and Jra in glial cells leads to attenuated MMP-1 response to maxillary palp injury. Maximum intensity projections (25 μm) of MMP-1 immunostainings in control and RNAi-expressing flies. (f) Quantification of MMP-1 fluorescence in (e). Antennal lobes quantified: Control: No Injury N = 22; MP Injury N = 24. kayRNAi: No Injury N = 24; MP Injury N = 28. JraRNAi: No Injury N = 22; MP Injury N = 30. Mean ±SEM plotted; ****p<0.0001; One-way ANOVA with Sidak post hoc test. Scale bars = 30 μm. Genotypes: Figure 6a,b: w1118 and draper -/-: draperΔ5rec9/draperΔ5rec9; Figure 6c–f: Control: w1118; OR85e-mCD8::GFP, tubulin-Gal80ts/+; repo-Gal4/+. STAT92ERNAi: w1118; OR85e-mCD8::GFP, tubulin-Gal80ts, UAS-STAT92ERNAi; repo-Gal4/+. kayRNAi: w1118; OR85e-mCD8::GFP, tubulin-Gal80ts/+; repo-Gal4/UAS-kayRNAi. JraRNAi: w1118; OR85e-mCD8::GFP, tubulin-Gal80ts/+; repo-Gal4/UAS-JraRNAi.
Figure 8
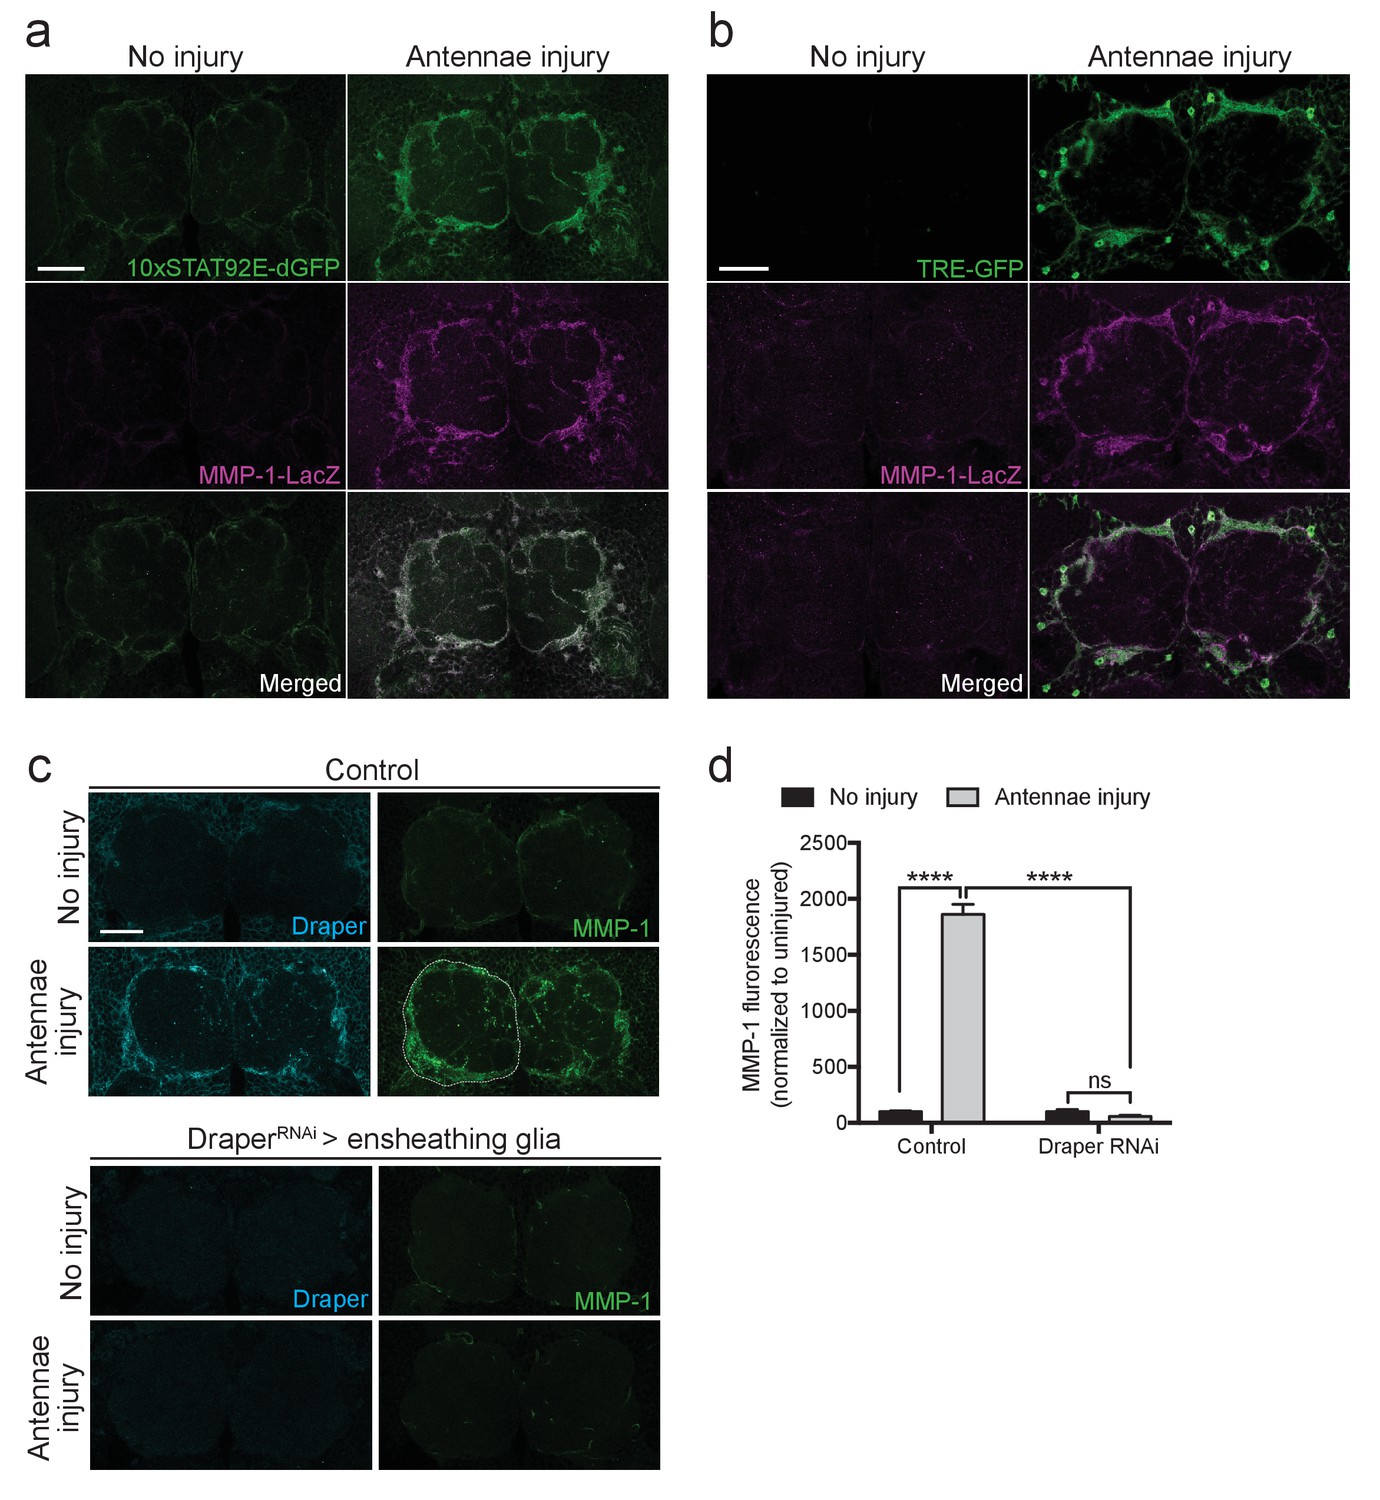
Ensheathing glia produce MMP-1 in response to axon injury.
(a) Representative one micron confocal slices of the antennal lobe region showing STAT92E-dependent activation of dGFP (green) and MMP-1-LacZ transcriptional activity (β-gal in magenta) within the same cells one day after antennal nerve injury. (b) Representative one micron confocal slices of antennal lobes showing AP-1 activation (green) and MMP-1-LacZ transcriptional activity (β-gal in magenta) within the same cells one day after antennal injury. (c) Representative Draper (cyan) and MMP-1 (green) immunostainings in control animals or following ensheathing glial knockdown of Draper before and after antennal nerve injury. White dotted outline in control injured MMP-1 panel shows representative ROI for quantification. (d) Quantification of MMP-1 before and one day after nerve injury in control and DraperRNAi-expressing flies. Antennal lobes quantified: Control: No Injury N = 24; Antennae Injury N = 29. DraperRNAi: No Injury N = 12. Antennae Injury N = 24. Mean ± SEM plotted; ****p<0.0001; ns = not significant; Two-way. ANOVA with Sidak post hoc test. Scale bars = 30 μm. Genotypes: Figure 7a: 10xSTAT92E-dGFP/MMP-1-LacZ. Figure 7b: TRE-GFP/MMP-1-LacZ. Figure 7c: Control: TIFR-Gal4/+. DraperRNAi: TIFR-Gal4/UAS-DraperRNAi.
Figure 9 with 2 supplements

Injury-induced glial membrane expansion is attenuated in MMP-1-depleted animals.
(a) Glial membranes are labeled with membrane-tethered GFP (green). Representative one micron confocal images of the antennal lobe regions show GFP and MMP-1 immunostaining (magenta) in control and glial-MMP-1RNAi animals. (b) Quantification of MMP-1 in control animals one and three days after antennal nerve injury inside the antennal lobe (Inside AL), at the AL border (AL Border), and in the cortex region (Cortex). Antennal lobes quantified: Day 1: N = 26 antennal lobes; Day 3: N = 21 antennal lobes. Mean ±SD plotted; ****p<0.0001; ns = not significant; unpaired t-test. (c) Quantification of GFP+ glial membrane expansion one day after antennal nerve injury in control and MMP-1RNAi flies; Antennal lobes quantified: Control: No Injury N = 34; Day 1 N = 30. MMP-1RNAi: No Injury N = 12; Day 1 N = 24. Mean ±SEM plotted; ****p<0.0001; Two-way ANOVA with Sidak post hoc test. Scale bars = 30 μm. Genotypes: Figure 8a–c: Control: repo-Gal4, UAS-mCD8::GFP/+. MMP-1 RNAi: UAS-MMP-1RNAi/+; repo-Gal4, UAS-mCD8::GFP/+.
Figure 9—figure supplement 1
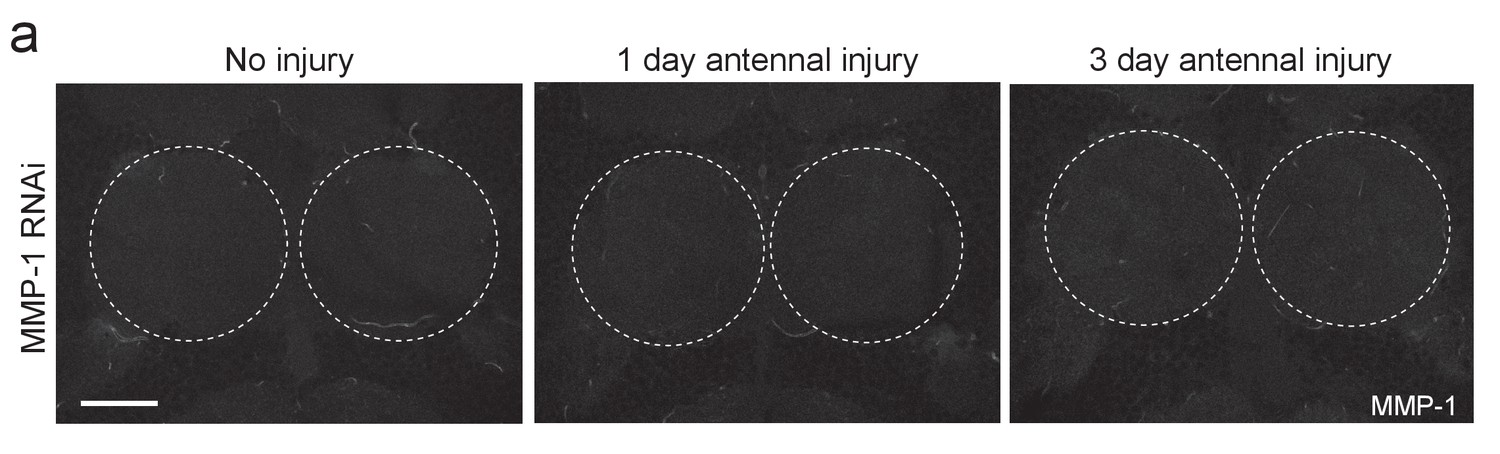
Adult specific glial expression of MMP-1RNAi leads to efficient glial MMP-1 knockdown.
(a) Single confocal slices of the antennal lobes region showing MMP-1 fluorescence in brains from uninjured animals or one or three days after antennal nerve injury in flies expressing MMP-1RNAi in glia. Dotted circles outline the antennal lobe region. No MMP-1 expression is observed in response to injury in flies expressing MMP-1 dsRNA. Scale bar = 30 μm. Genotypes: Control: repo-Gal4, UAS-mCD8::GFP/+. MMP-1 RNAi: UAS-MMP-1RNAi/+; repo-Gal4, UAS-mCD8::GFP/+.
Figure 9—figure supplement 2
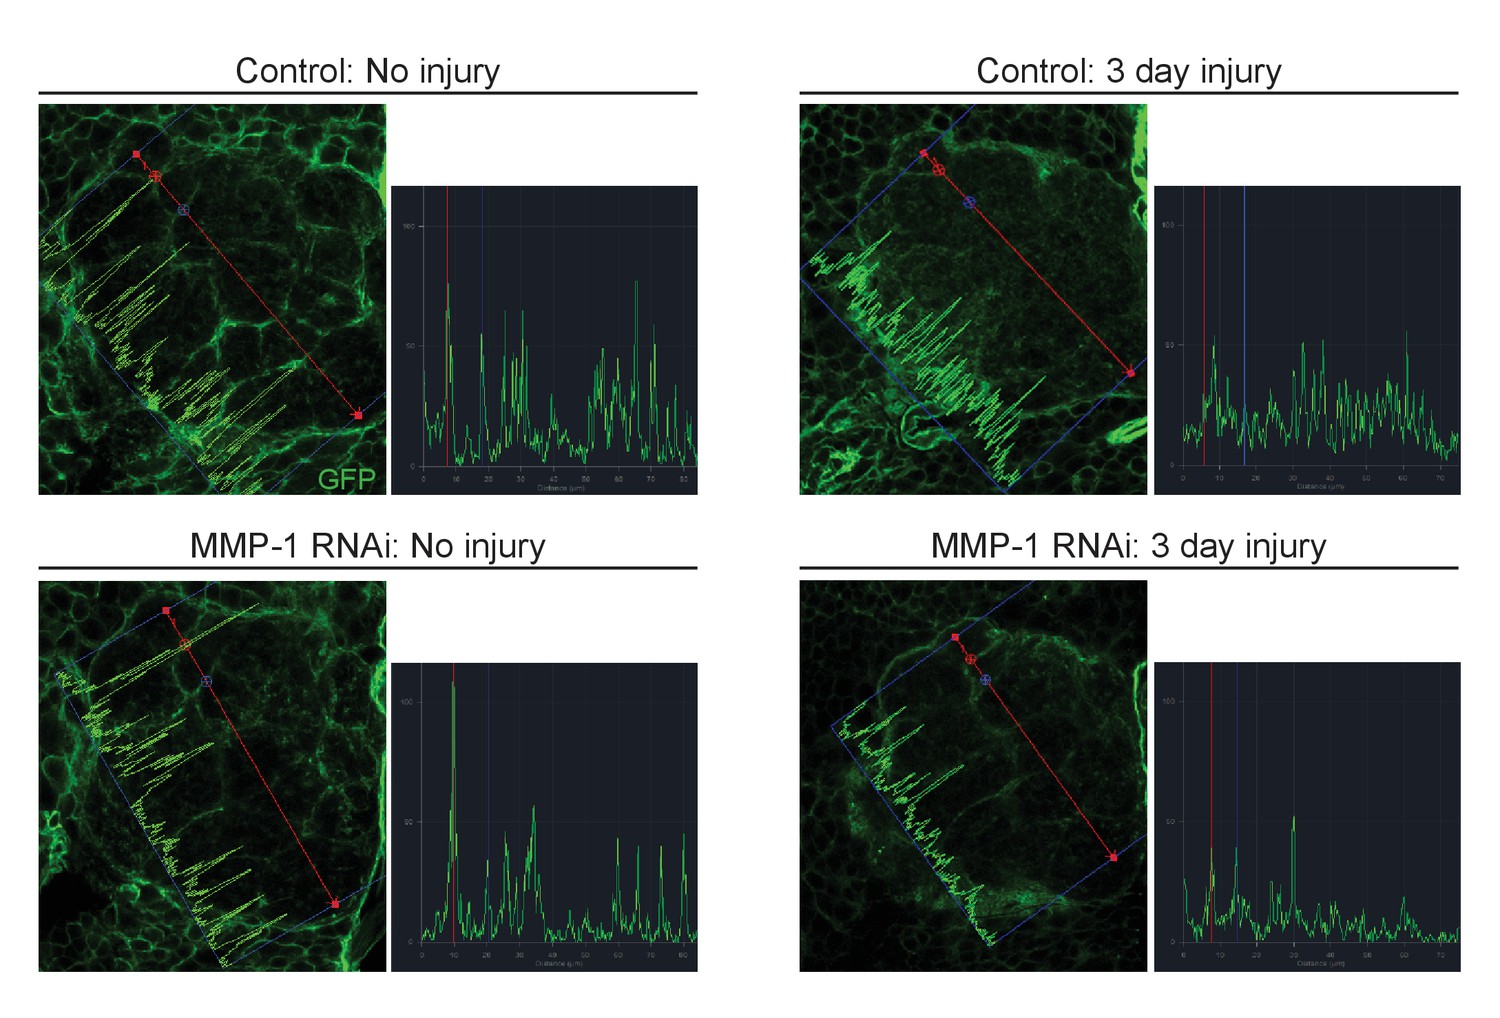
Glial membrane expansion in the neuropil region is attenuated three days after antennal injury in glial knockdown of MMP-1.
Representative antennal lobe images of control and MMP-1RNAi animals expressing membrane-tethered GFP in glia. Line scan through the antennal lobe shows fluorescence intensity profile. Red and blue dots in the image correspond to the red and blue lines in the corresponding traces. The red and blue dots show fluorescence intensity at the same two glomeruli positions. In uninjured control and. MMP-1RNAi animals, glial membranes inside the antennal lobes are restricted to wrapping around entire distinct glomeruli. Three days after injury, control glial membranes expand within the antennal lobes and the distinct glomerular wrapping pattern is no longer discernable. In MMP-1RNAi animals, three days after injury the glial membrane segmentation of glomeruli is still visible, and fluorescence intensity peaks at glomeruli edges are still robust. Genotypes. Control: repo-Gal4, UAS-mCD8::GFP/+. MMP-1 RNAi: UAS-MMP-1RNAi/+; repo-Gal4, UAS-mCD8::GFP/+.
Figure 10
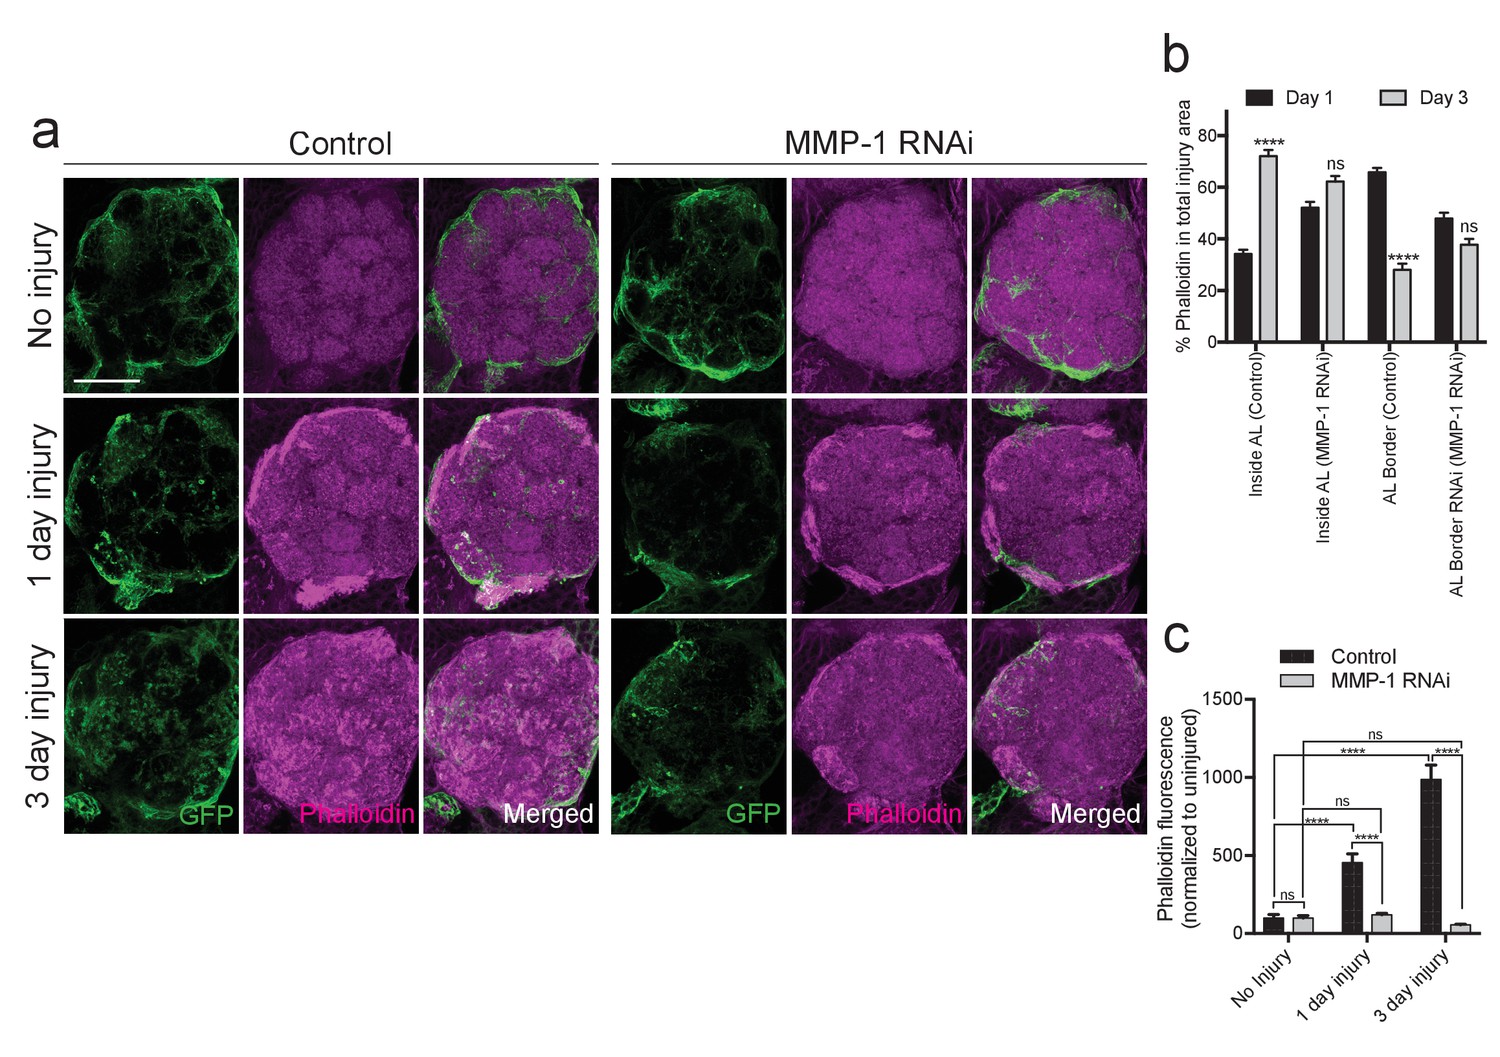
Injury-induced ensheathing glial membrane expansion and actin dynamics are attenuated after antennal injury in MMP-1-depleted animals.
(a) Representative single antennal lobe immunostainings of Phalloidin-TRITC (magenta) in control and MMP-1RNAi animals (uninjured flies and one or three days after antennal injury). Ensheathing glial membranes labeled with membrane tethered-GFP (green). Representative maximum intensity projections shown (5 μm). (b) Quantification of Phalloidin-TRITC expression one and three days after injury inside the antennal lobe and within the AL border in control and MMP-1RNAi flies. Antennal lobes quantified: Control: Day 1 N = 18; Day 3 N = 18. MMP-1RNAi: Day 1 N = 17; Day 3 N = 12. Mean ± SD plotted; ****p<0.0001; ns = not significant; unpaired t-test. (c) Quantification of total Phalloidin-TRITC within the antennal lobes shown in (a); antennal lobes quantified: Control: No Injury N = 22; Day 1 N = 16; Day 3 N = 18; MMP-1RNAi: No Injury N = 18; Day 1 N = 18; Day 3 N = 12. Mean ± SEM plotted; ns = not significant, ****p<0.0001; Two-way ANOVA with Sidak post hoc test. Scale bars = 30 μm. Genotypes: Figure 9a–c: Control: TIFR-Gal4/+. MMP-1 RNAi: TIFR-Gal4/UAS-MMP-1RNAi.
Figure 11
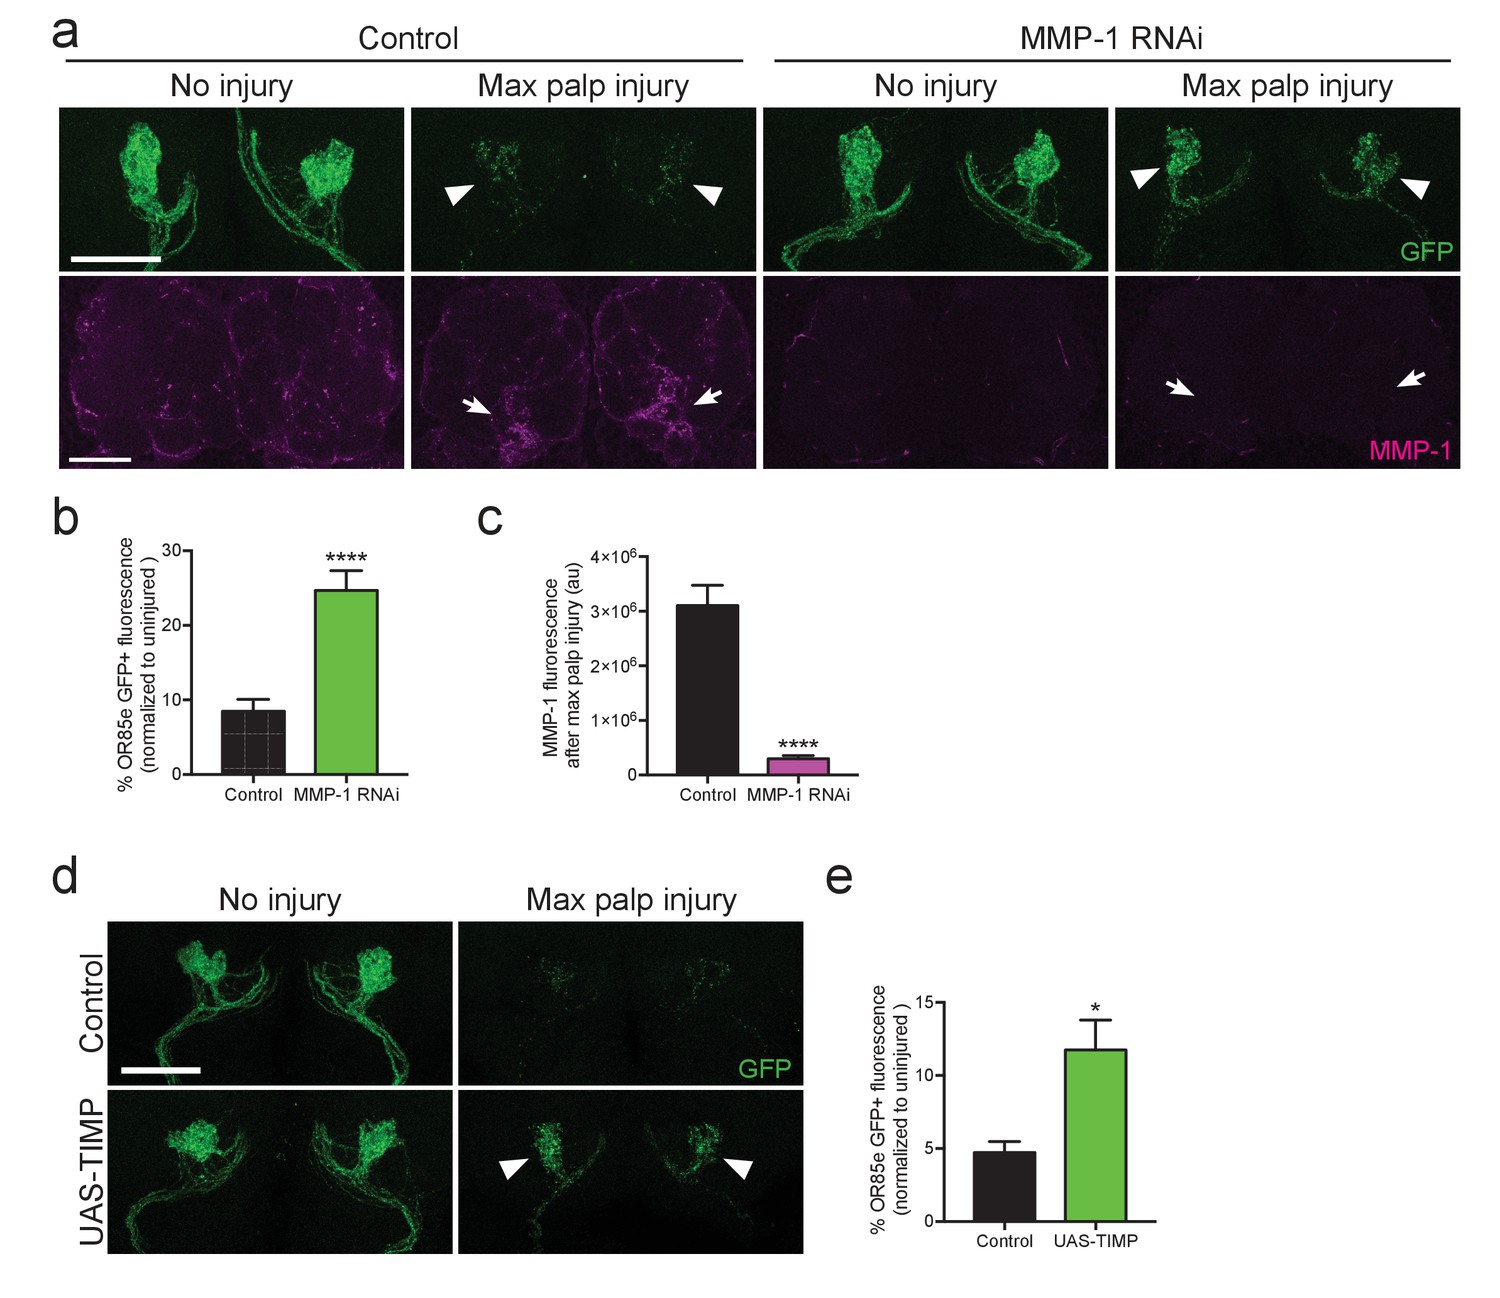
Adult specific inhibition of MMP-1 in glia leads to delayed clearance of adult degenerating axons.
(a) GFP-labeled maxillary ORN axons. (green) before and three days after maxillary palp nerve axotomy in control animals and following adult specific glial knockdown of MMP-1. Arrowheads point to glomeruli quantified in (b). MMP-1 immunostainings in same brains (at lower magnification) shown in bottom panels (magenta). Arrows point to OR85e glomeruli regions quantified for MMP-1 fluorescence in (c). (b) Quantification of axon clearance three days after injury. Antennal lobes quantified: Control: N = 22. MMP-1RNAi: N = 30. Mean ±SEM plotted; ****p<0.0001; unpaired t test. (c). Quantification of MMP-1 fluorescence in (a). Antennal lobes quantified: Control. N = 27; MMP-1RNAi: N = 30. Mean ±SEM plotted; ****p<0.0001; unpaired t test. (d) GFP-labeled maxillary ORN axons before and three days after maxillary palp nerve axotomy in control animals and adult specific glial overexpression of TIMP. Arrowheads point to perdurance of axon debris in TIMP-expressing flies after axon injury. (e) Quantification of OR85e axon clearance three days after axotomy. Antennal lobes quantified: Control: N = 20; UAS-TIMP: N = 32. Mean ±. SEM plotted; *p<0.05; unpaired t test. Scale bars = 30 μm. Genotypes: Figure 10a: Control: w1118; OR85e-mCD8::GFP, tubulin-Gal80ts/+; repo-Gal4/+. MMP-1 RNAi: w1118; OR85e-mCD8::GFP, tubulin-Gal80ts/UAS-MMP-1RNAi; repo-Gal4/+. Figure 10d: Control: w1118; OR85e-mCD8::GFP, tubulin-Gal80ts/+; repo-Gal4/+. UAS-TIMP: w1118; OR85e-mCD8::GFP, tubulin-Gal80ts/+; repo-Gal4/UAS-TIMP.
Tables
Table 1
Annokey analysis results of upregulated genes associated with glial membrane expansion and movement. (a) List of terms used in Annokey analysis. (b) Top ten hits associated with our Annokey key terms in Drosophila, mouse, and human. MMP-1/MMP-14 (red bold) is included in the top ten list for each species.
| Table 1a | Table 1b | |||||
|---|---|---|---|---|---|---|
| Annokey Search Terms | Top 10 Annokey Results | |||||
| [Ff]ilopodia | Drosophila | Mouse | Human | |||
| [Ff]ilopodium | Gene | Matched Entries | Gene | Matched Entries | Gene | Matched Entries |
| [Ii]nvadopodia | Fasciclin 3 (CADM4) | 131 | Rac1 | 297 | MMP14 | 709 |
| [Ii]nvadopodium | Tubb3 | 268 | RAC1 | 699 | ||
| [Pp]odosome(s) | puckered (DUSP10) | 77 | Mmp14 | 191 | PAK1 | 240 |
| [Mm]igration | lethal (2) giant larvae (LLG1) | 73 | Itga4 | 117 | MYC | 229 |
| ECM | Rac2 (RAC1) | 64 | Nfkb1 | 116 | RELA | 207 |
| [Ee]xtracellular matrix | scab (ITGA4) | 54 | Jun | 89 | JUN | 195 |
| [Ii]nvadosome | rhomboid (RHBDL3) | 52 | Myc | 87 | ITGA4 | 132 |
| [Ii]nvasive | dorsal (RELA) | 51 | Vcl | 83 | TFPI2 | 114 |
| [Mm]etastasize | Jun-related antigen (JUN) | 32 | Ptgs2 | 62 | FLNA | 112 |
| [Mm]etastasis | kayak (FOSL2) | 32 | Flna | 49 | VCL | 53 |
| [Cc]ell invasion | ||||||
-
Table 1—source data 1
Human HTML Annokey search results that include hyperlinks to NCBI Gene, GeneRIF and Pubmed databases.
- https://doi.org/10.7554/eLife.23611.012
-
Table 1—source code 1
Drosophila HTML Annokey results, including hyperlinks to NCBI gene, GeneRIF, and PubMed databases.
- https://doi.org/10.7554/eLife.23611.013
-
Table 1—source code 2
Mouse HTML Annokey results, including hyperlinks to NCBI Gene, GeneRIF,pu and PubMed databases.
- https://doi.org/10.7554/eLife.23611.014
-
Table 1—source code 3
Human HTML Annokey results, including hyperlinks to NCBI Gene, GeneRIF, and PubMed databases.
- https://doi.org/10.7554/eLife.23611.015
Download links
A two-part list of links to download the article, or parts of the article, in various formats.
Downloads (link to download the article as PDF)
Open citations (links to open the citations from this article in various online reference manager services)
Cite this article (links to download the citations from this article in formats compatible with various reference manager tools)
A novel Drosophila injury model reveals severed axons are cleared through a Draper/MMP-1 signaling cascade
eLife 6:e23611.
https://doi.org/10.7554/eLife.23611


