The step-wise pathway of septin hetero-octamer assembly in budding yeast
- University of Colorado Anschutz Medical Campus, United States
Figures
Figure 1 with 3 supplements
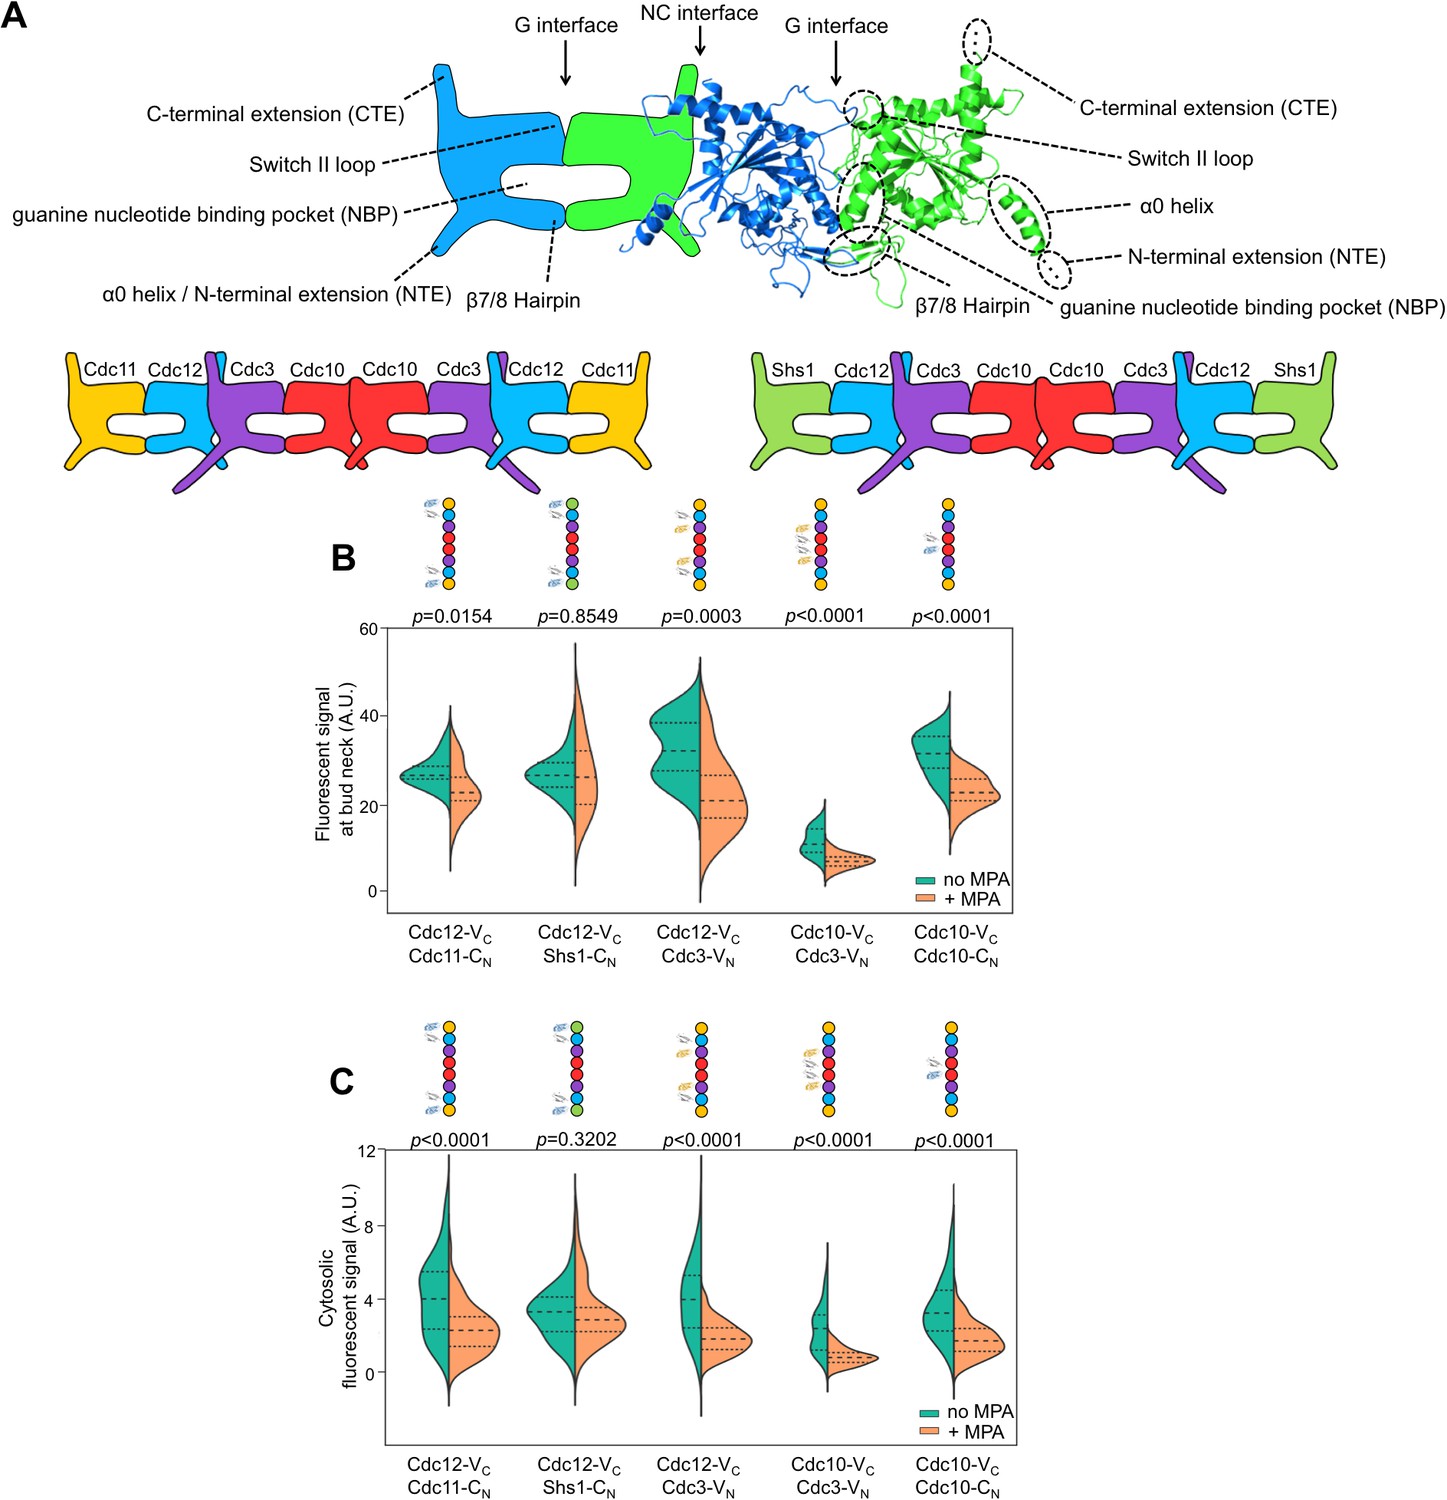
Depletion of guanine nucleotides with MPA perturbs both the G and NC septin-septin interfaces.
(A) Diagrams illustrating septin structural elements referred to in this work, as well as the two septin protofilament species in mitotic S. cerevisiae cells. (B–C) Violin plots of BiFC signal measured at the bud necks (B) or in the cytosol (C) of cells expressing the indicated BiFC fusions, in the presence and absence of MPA. p-Values were calculated using two-tailed t-test or Mann-Whitney test, as appropriate for the distributions of the relevant data sets, which was determined by Pearson-D’Agostino normality test. Dashed lines separate quartiles. (B) From left to right, n = 17, 18, 26, 22, 14, 25, 10, 24, 27, and 47. (C) From left to right, n = 80, 54, 143, 44, 68, 79, 61, 36, 150, and 150. Strains used were: 12-VC/11-CN, 12-VC/S-CN, 12-VC/3-VN, 10-VC/3-VN, and 10-VC/10-CN.
Figure 1—figure supplement 1

Experimental workflow illustrating data acquisition, kernel density estimation, and violin plots.
(A) Fluorescent signal is measured either at bud necks by determining maximum pixel intensity, or in the cytosol by averaging pixel intensity in a small, uniform region of interest as described in the Materials and methods. (B) A kernel density estimate (KDE) is generated using the Spyder Python IDE and the Seaborn visualization library. Fluorescent signals are plotted on a rug plot, and Gaussian kernels are placed at each data point. Kernel bandwidth is assigned using Scott’s rule. Kernels are summed to create the KDE. (C) Violin plots are generated, also using Seaborn. Kernel density estimates are rotated 90° and displayed as a violin plot, with control and experimental groups abutting one another for ease of comparison. Dashed lines separate quartiles.
Figure 1—figure supplement 2
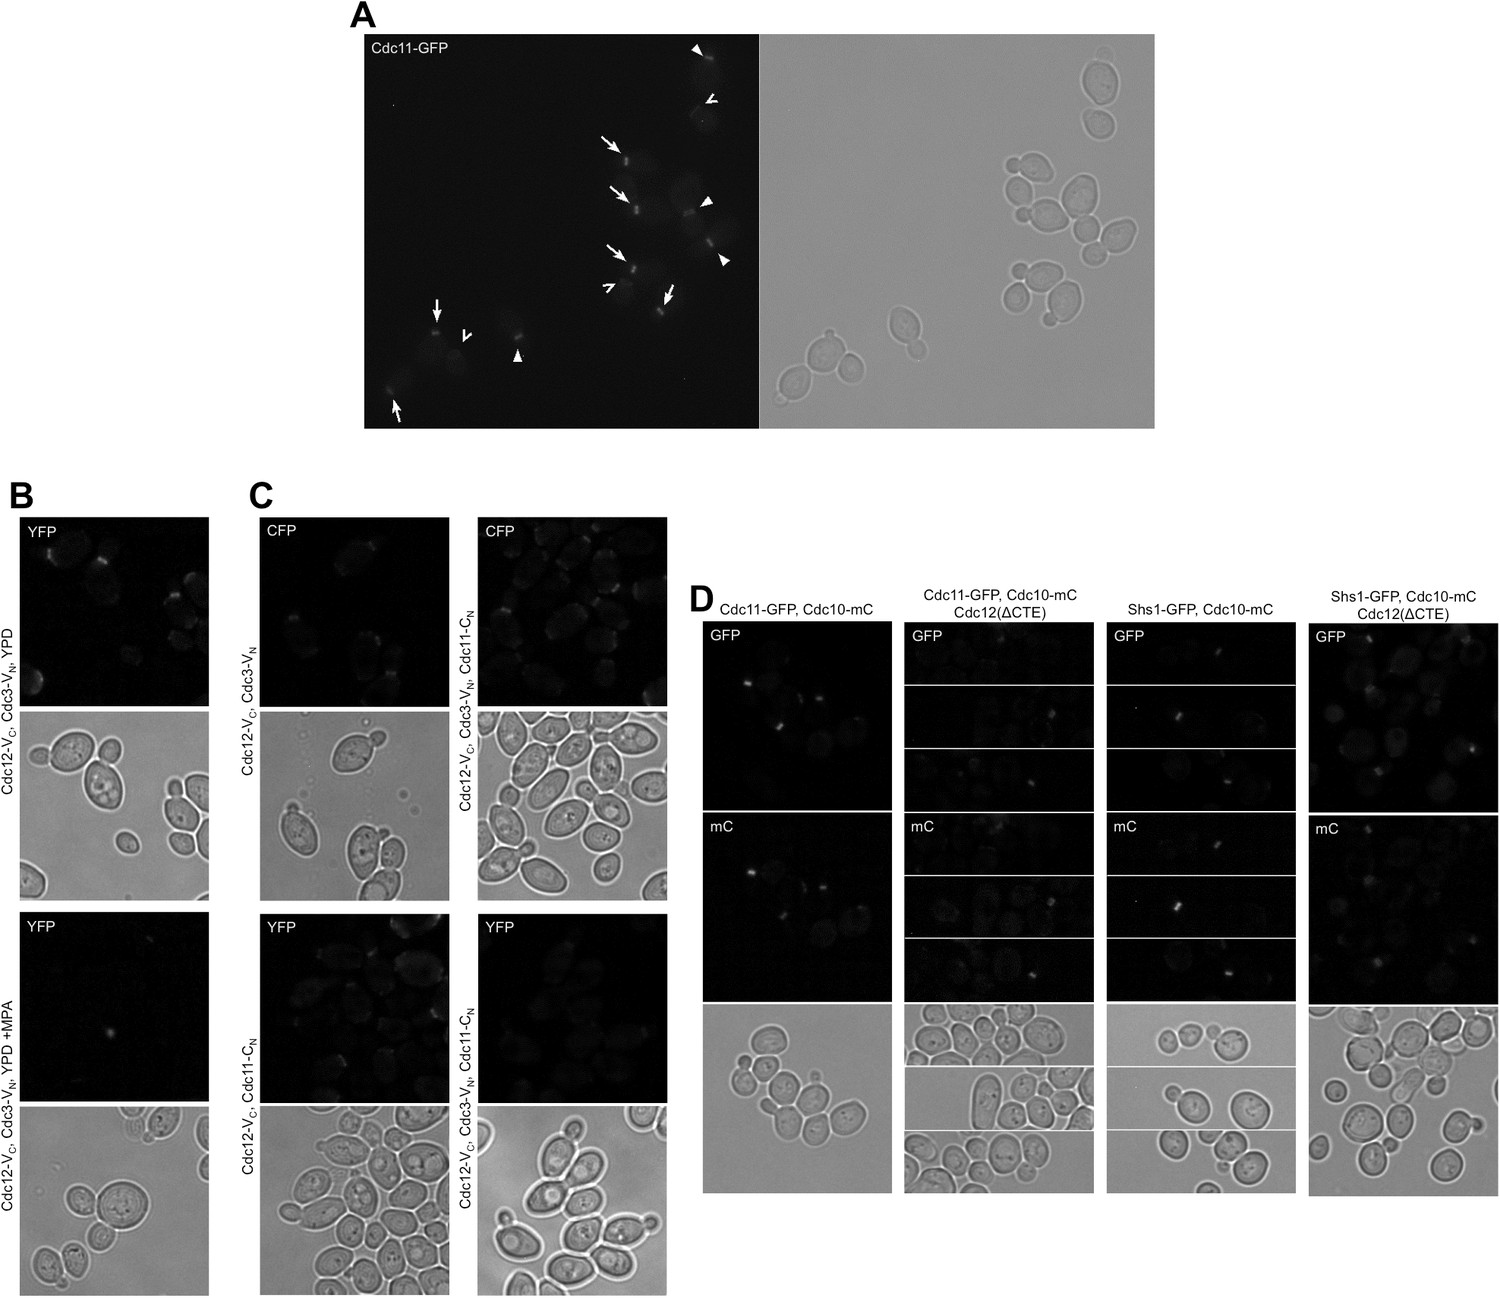
Representative micrographs for all quantitative microscopy methods used in this work.
(A) Illustration of selection criteria for bud neck signal measurement: arrows, ‘early rings’, which are measured; filled arrowheads, other septin structures (collars, split rings, and rings associated with larger buds) that are not measured; open arrowheads (chevrons), old rings from previous divisions, also not measured. (B) Micrographs representative of BiFC experiments. (C) Micrographs representative of CSD-BiFC experiments. (D) Micrographs representative of a GFP-to-mCherry ratio experiment.
Figure 1—figure supplement 3
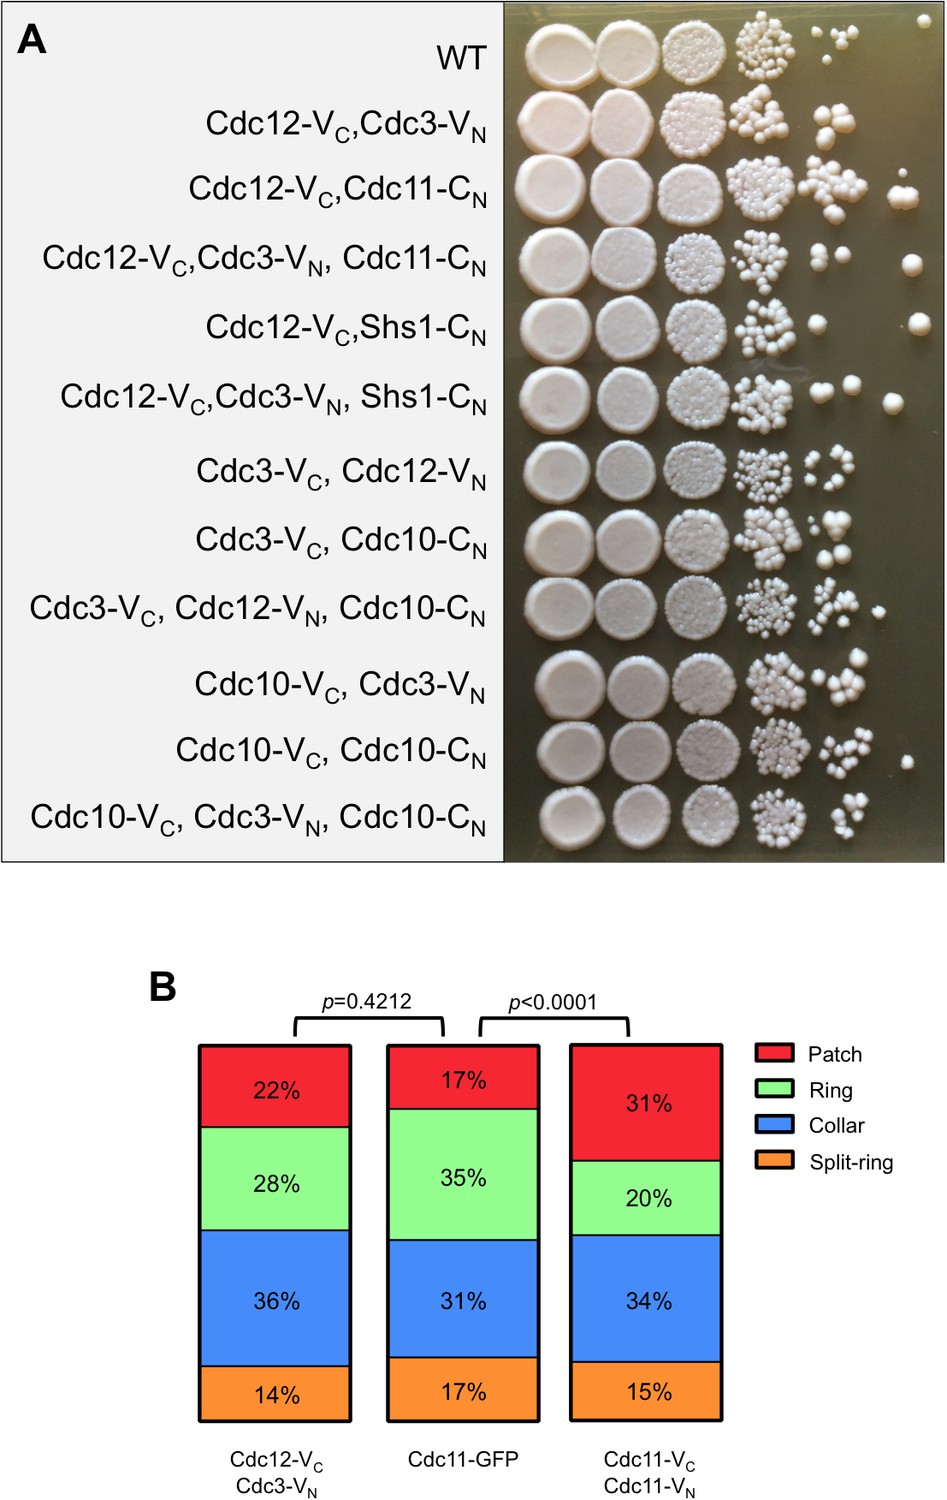
Septin-BiFC fusions used in this study do not compromise viability or crosslink filaments.
(A) Dilution series on solid YPD medium of all septin BiFC and CSD-BiFC strains used in Figures 1 and 2, compared to WT (BY4741). Cells were incubated at 22°C for 3 days prior to imaging. (B) A septin ring index describing the progression of structural changes to septin rings during the mitotic cell cycle. In cells engineered to crosslink septin protofilaments via their termini (co-expressing Cdc11-VC and Cdc11-VN, which should only generate BiFC events once pre-assembled protofilaments encounter each other at the bud neck) the septin patch-to-ring transition is significantly prolonged, whereas in cells in which neighboring subunits are tagged (Cdc12-VC, Cdc3-VN) no significant delays were observed, suggesting that crosslinking in these cells is rare. Since targeted exocytosis is thought to drive the patch-to-ring transition by delivering septin-free membrane in the center of the septin patch (Okada et al., 2013), it may be the case that end-to-end-crosslinked protofilaments formed in Cdc11-VC-, Cdc11-VN-expressing cells are less easily displaced by exocytic delivery than are ‘free’ protofilaments, slowing clearance from the center of the patch. In summary, for the BiFC strains on which the conclusions of our study are based, the majority of BiFC signals reflect events that occurred during protofilament assembly in the cytosol, rather than inter-protofilament encounters at the membrane.
Figure 2 with 3 supplements
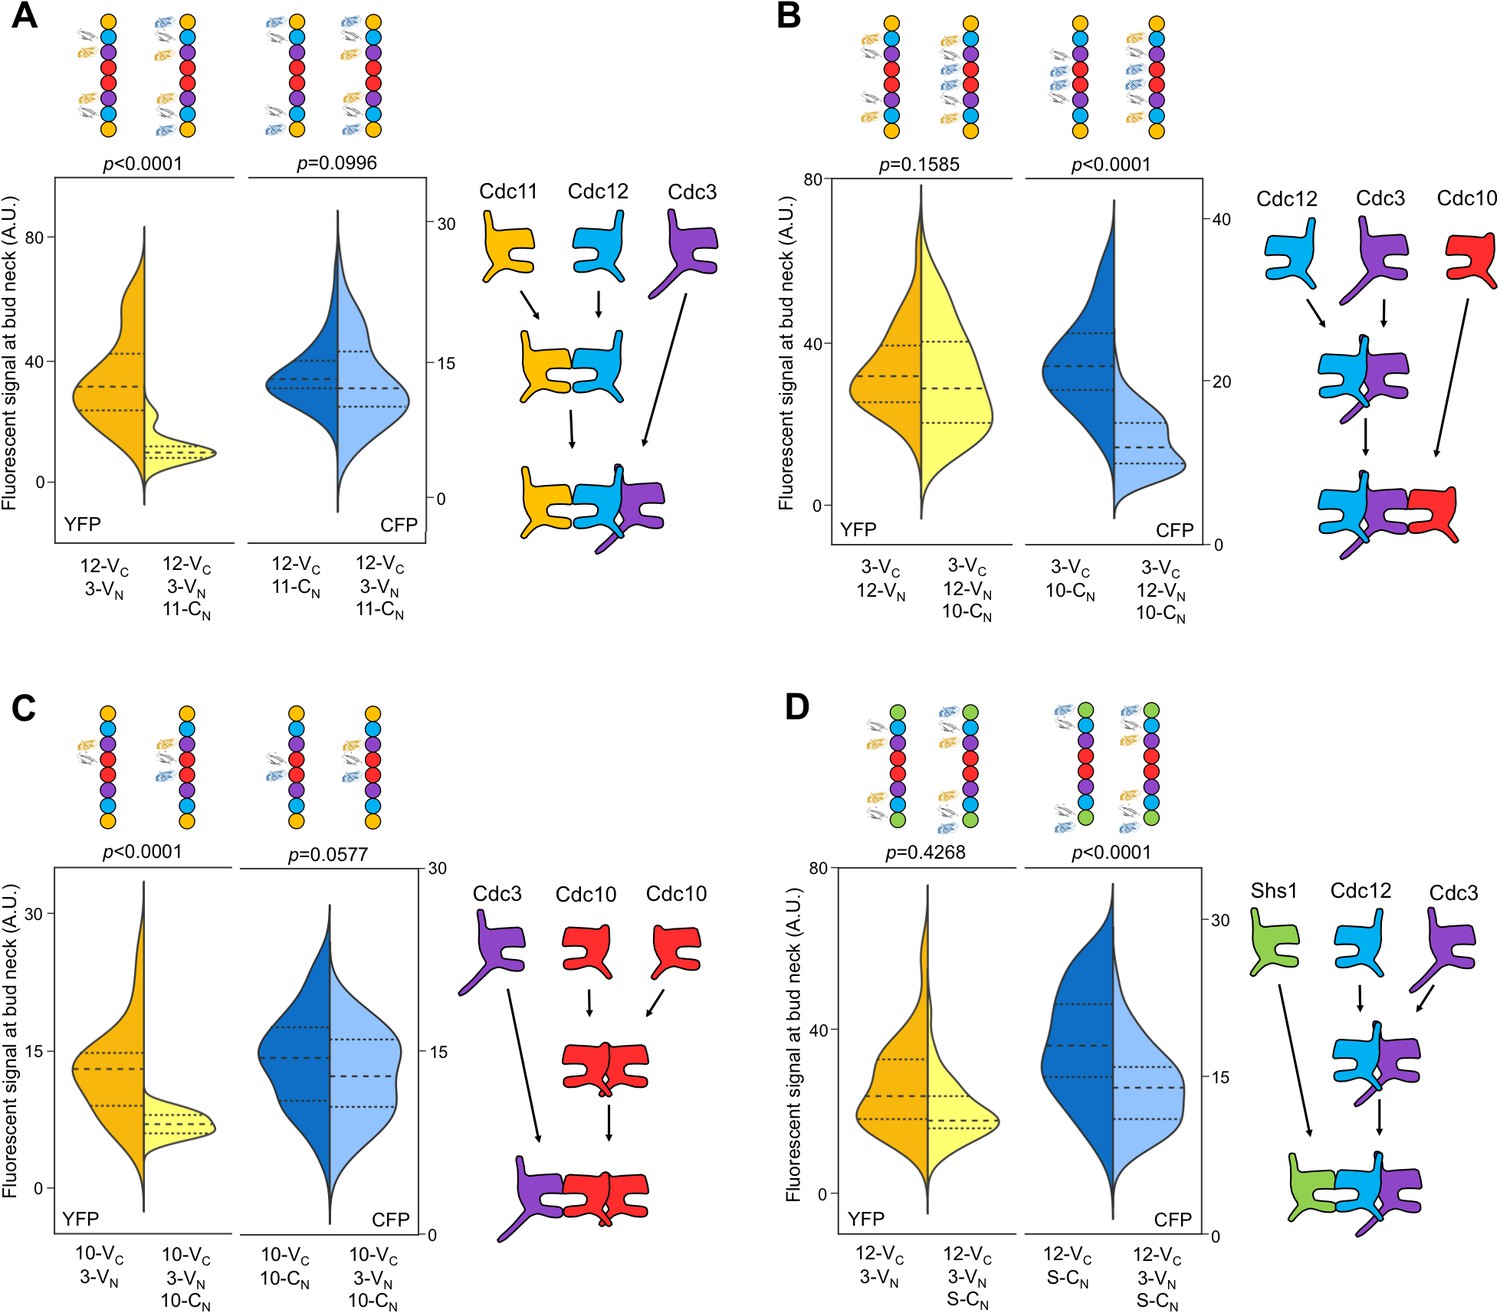
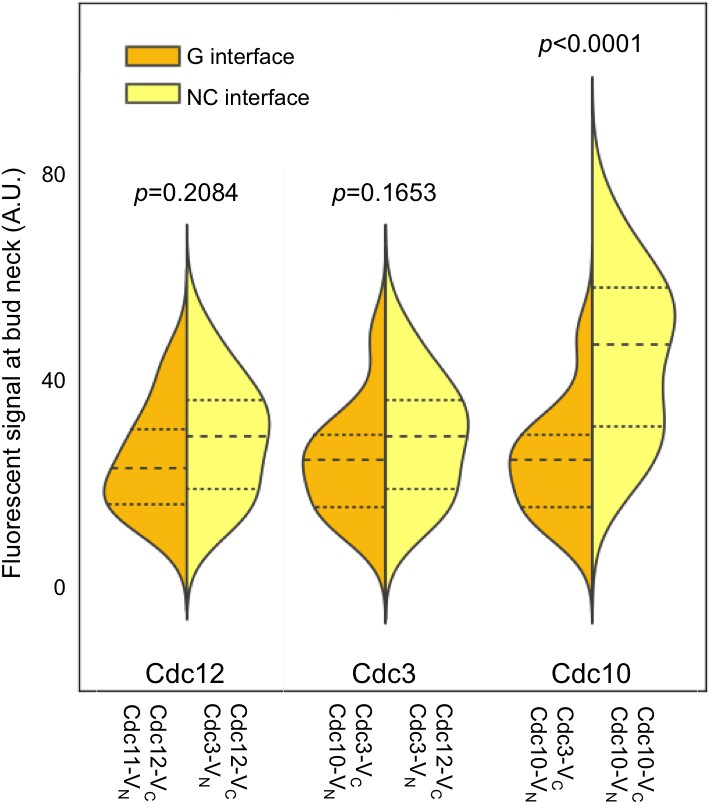
The order of septin-septin interactions during de novo assembly, according to CSD-BiFC.
(A–D) As in Figure 1B, but for untreated cells expressing the indicated BiFC fusions, and showing YFP or CFP fluorescence. ‘3’, Cdc3; ‘10’, Cdc10; ‘11’, Cdc11; ‘12’, Cdc12; ‘S’, Shs1. Diagrams provide the interpretation of the results in cartoon form. (A) From left to right, n = 40, 38, 57, and 45. (B) From left to right, n = 70, 64, 54, and 54. (C) From left to right, n = 26, 21, 60, and 39. (D) From left to right, n = 42, 41, 78, and 40. Strains used were: 12-VC/3-VN, 12-VC/11-CN, 12-VC/3-VN/11CN, 3-VC/12-VN, 3-VC/10-CN, 3-VC/12-VN/10-CN, 10-VC/3-VN, 10-VC/10-CN, 12-VC/S-CN, and 12VC/3-VN/S-CN.
Figure 2—figure supplement 1
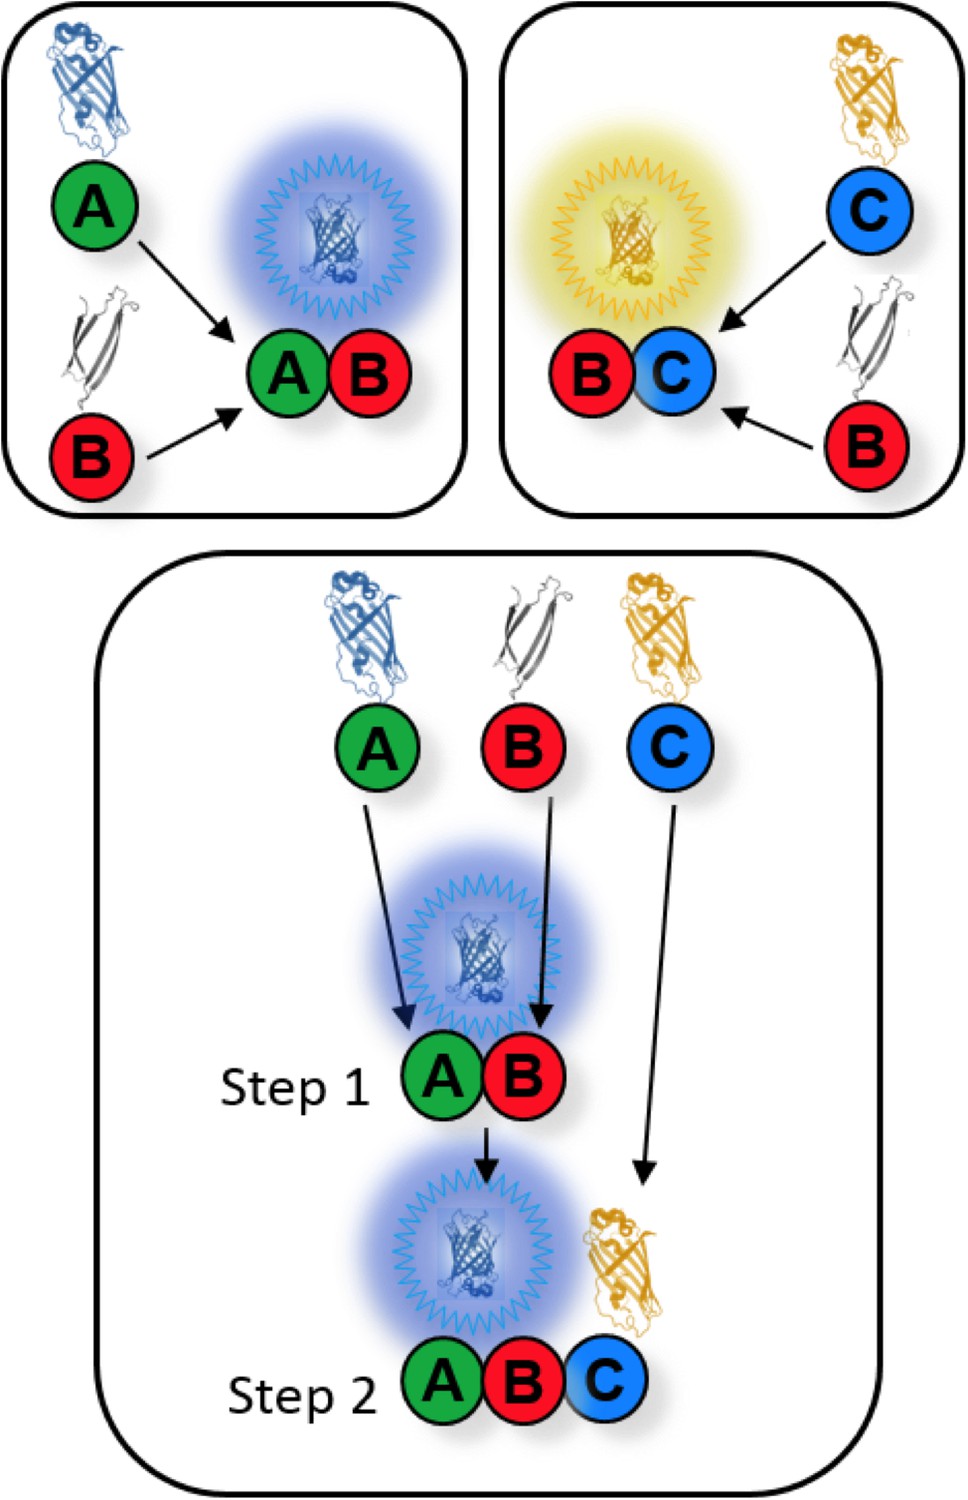
Conceptual layout of a CSD-BiFC experiment.
If protein B forms a complex with both proteins A and C, CSD-BiFC allows the determination of B’s order of interaction with A and C. A strain carrying only B-VC and A-CN alleles (as in the upper-left box) will generate a blue BiFC signal once B and A interact. Similarly, a strain carrying only B-VC and C-VN will generate a yellow signal. However, in a strain where all three alleles are present (as in the lower box), the interaction that occurs first will generate its corresponding signal (in this case the blue signal from the A-B interaction) while the second interaction (the yellow signal from BC) will be unable to generate signal due to the unavailability of B’s VC tag, which irreversibly folded with A’s CN tag. The order of interaction is elucidated by comparing the blue and yellow signals of the two-allele control groups (upper boxes) with the blue and yellow signals of the three-allele experimental group (lower box). The color that maintained signal strength between control and experimental strains occurs first, while the signal that shows significant depletion occurs second. If both signals were depleted, then either interaction could occur first, and there was no preferred order of interaction between B, A, and C. All fluorescence data are gathered in diploid cells carrying one tagged and one un-tagged allele to mitigate any negative effects produced by the fusions. Because of this, depleted signals will never be fully depleted, as first binding to an untagged partner will allow later signal generation regardless of interaction order. Importantly, all data consistently presented as singly or mutually depleted, allowing reliable interpretation of results.
Figure 2—figure supplement 2

The complete pathway of budding yeast septin protofilament assembly, according to CSD-BiFC.
Results from Figure 2 were compiled and illustrated in cartoon form.
Figure 2—figure supplement 3
C-terminal septin-BiFC fusions do not bias toward NC interactions.
As in Figure 1B, with cells of the indicated genotypes. BiFC signal strengths were similar regardless of whether the interaction reflected a G or NC interface. Cdc10–Cdc10 BiFC signals were strongest because no untagged Cdc10 was present in these cells, thus more protofilaments were fluorescent. Note that septin C-terminal extensions (CTEs) are long and flexible: GFP fused to the C terminus of the nematode septin UNC-61 rotates ~180˚ at a radius of ~10 nm from the ~4 nm-wide globular UNC-61 GTPase domain (John et al., 2007). Yeast septin CTEs, measured from the end of the α6 helix (Sirajuddin et al., 2007), are similarly long: that of UNC-61 is 100 residues, and those of Cdc3, Cdc11, Cdc12, and Shs1 are 110, 118, 94, and 233 residues, respectively. Thus, although the NC interface involves α6 residues, for the CTE-containing septins Cdc3, Cdc11, Cdc12, and Shs1, the Venus fragments will be located far from both the NC and G interfaces, and interactions across either interface should generate BiFC signals of similar strengths, as experimentally demonstrated here.
Figure 3
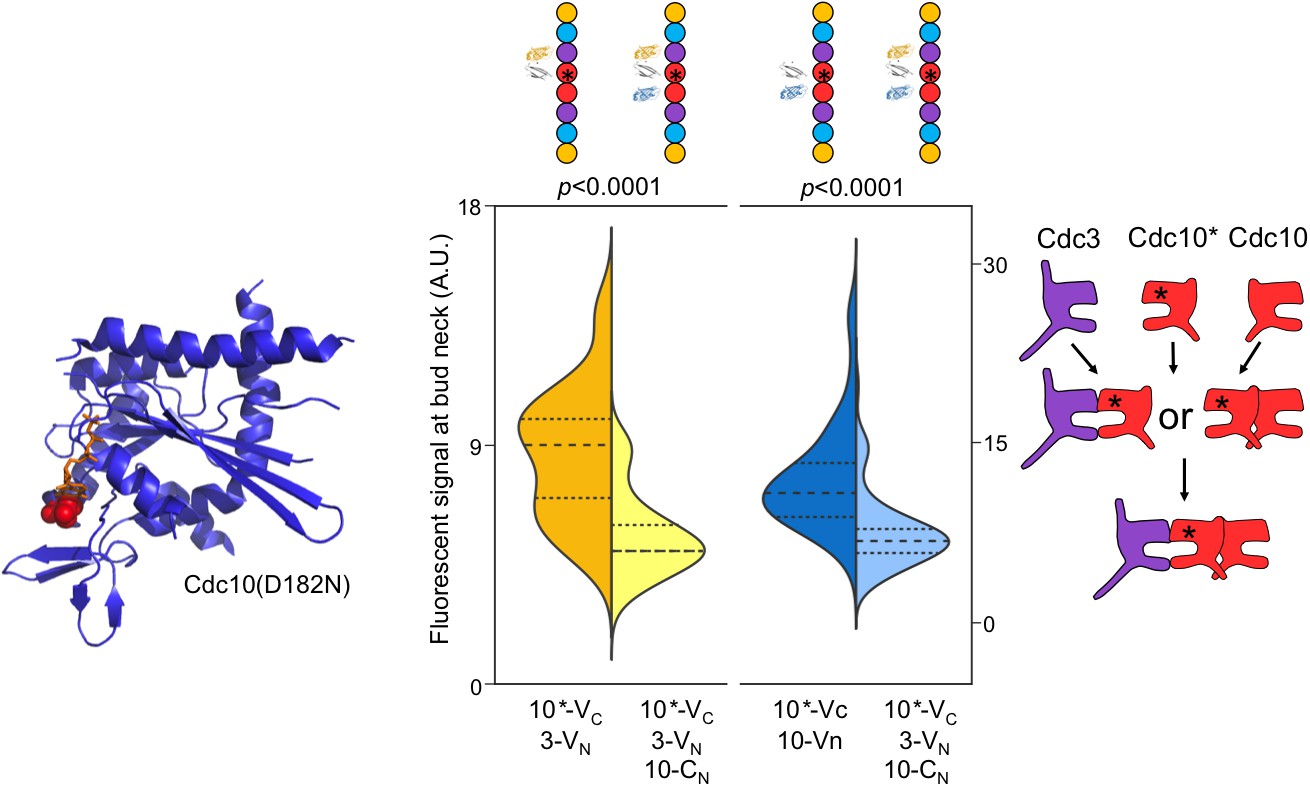
Perturbing GTP binding by Cdc10 disrupts the order of interactions with Cdc3.
Left, ribbon diagram of Sept2-GppNHp (PDB 3FTQ) models the location of the mutated Asp residue (red spheres) and bound nucleotide (orange). Center, violin plot of CSD-BiFC results, as in Figure 2C but with Cdc10(D182N)-VC (‘10*-VC’, ‘Cdc10*'). Right, cartoon of inferred order of assembly. From left to right, n = 60, 51, 95, and 62. Strains used were: 10(D182N)-VC/3-VN, 10(D182N)/10-CN, and 10(D182N)-VC/3-VN/10CN.
Figure 4 with 2 supplements

Cdc12 nucleotide state dictates the specificity of Cdc11/Shs1 recruitment via the Cdc12 Switch II loop.
(A) Violin plot of BiFC signal at the bud necks of cells expressing Cdc11-VN or Shs1-VN (strains YEF5691 or YEF5693) and carrying a plasmid encoding Cdc12-VC (YCpUK-Cdc12-VC) or Cdc12(ΔCTE)-VC (YCpUK-Cdc12(ΔCTE)-VC). From left to right, n = 50, 31, 47, and 27. (B–F) Violin plots of Cdc11-GFP or Shs1-GFP signal at bud necks expressed as a ratio over Cdc10mCherry (‘mC’) bud neck signal. (B) Cdc11-GFP/Cdc10-mC (strain JTY5396) and Shs1GFP/Cdc10-mC (strain JTY5397) cells over-expressing from high-copy plasmids either WT Cdc12 (pMVB49) or Cdc12(ΔCTE) (pMVB54). From left to right, n = 38, 24, 40, and 42. (C) ‘Cdc11’, Cdc11-GFP/Cdc10-mCherry strain JTY5396 carrying either an empty vector plasmid (pRS316, ‘Control’) or a Cdc11-GFP plasmid (pSB5, ‘Overexpression’).”Shs1’, Shs1GFP/Cdc10-mCherry strain JTY5397 carrying either an empty vector plasmid (pRS316, ‘Control’) or an Shs1-GFP plasmid (pRS316-Shs1-GFP, ‘Overexpression’). (D) Cdc11-GFP/Cdc10-mC (strain JTY5396) and Shs1GFP/Cdc10-mCherry (strain JTY5397) cells overexpressing from plasmids either WT Cdc12 (pFM650) or Cdc12(T75A) (pFM829). From left to right, n = 20, 23, 28, and 32. (E) Cdc11-GFP/Cdc10-mCherry or Shs1-GFP/Cdc10-mCherry cells carrying either the WT or cdc12(G268R) mutant allele at the CDC12 locus (strains used were diploids derived from mating JTY5396 or JTY5397 to the mutant strain JPTA1435 [G268R], or BY4742 as control). From left to right, n = 42, 39, 23, and 52. (F) Cdc11-GFP/Cdc10-mCherry or Shs1-GFP/Cdc10-mCherry cells carrying either WT or D104A Cdc12 plasmids (strains used were JTY5396 and JTY5397, carrying either pFM650 or YCpL-Cdc12(D104A)). From left to right, n = 39, 48, 52, and 44. Ribbon diagrams below (D–F) illustrate the locations of the mutations, as in Figure 3.
Figure 4—figure supplement 1
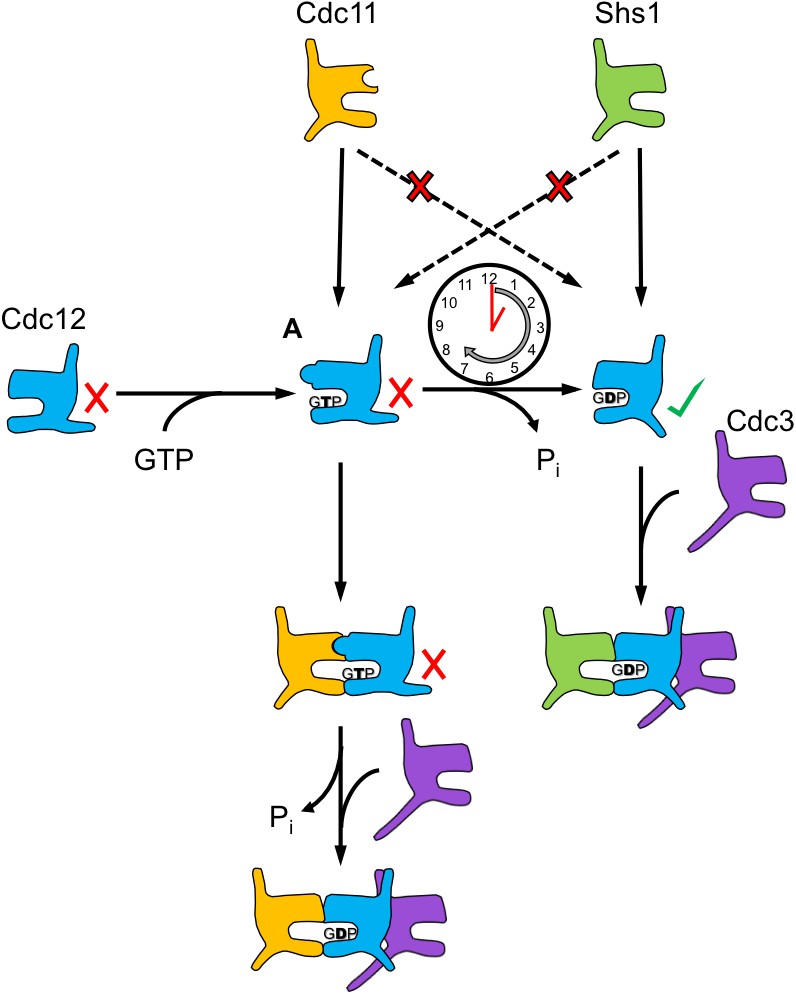
The Cdc12 oligomerization pathway is coordinated by a GTP hydrolysis timer.
This model illustrates how, upon binding GTP, the Cdc12 Switch II loop may adopt a conformation conducive to G dimerization with Cdc11, and not with Shs1. The majority of Cdc12 monomers dimerize with Cdc11 at this point, going on to hydrolyze GTP and NC oligomerization with Cdc3. Other Cdc12 monomers successfully hydrolyze GTP independently, generating a pool of free Cdc12 competent to NC dimerize with Cdc3 and G dimerize with Shs1. Cdc12’s slow rate of GTP hydrolysis relative to Cdc10 allows for the creation of these two pools of monomeric Cdc12, which possess distinct preference for Cdc11 or Shs1.
Figure 4—figure supplement 2
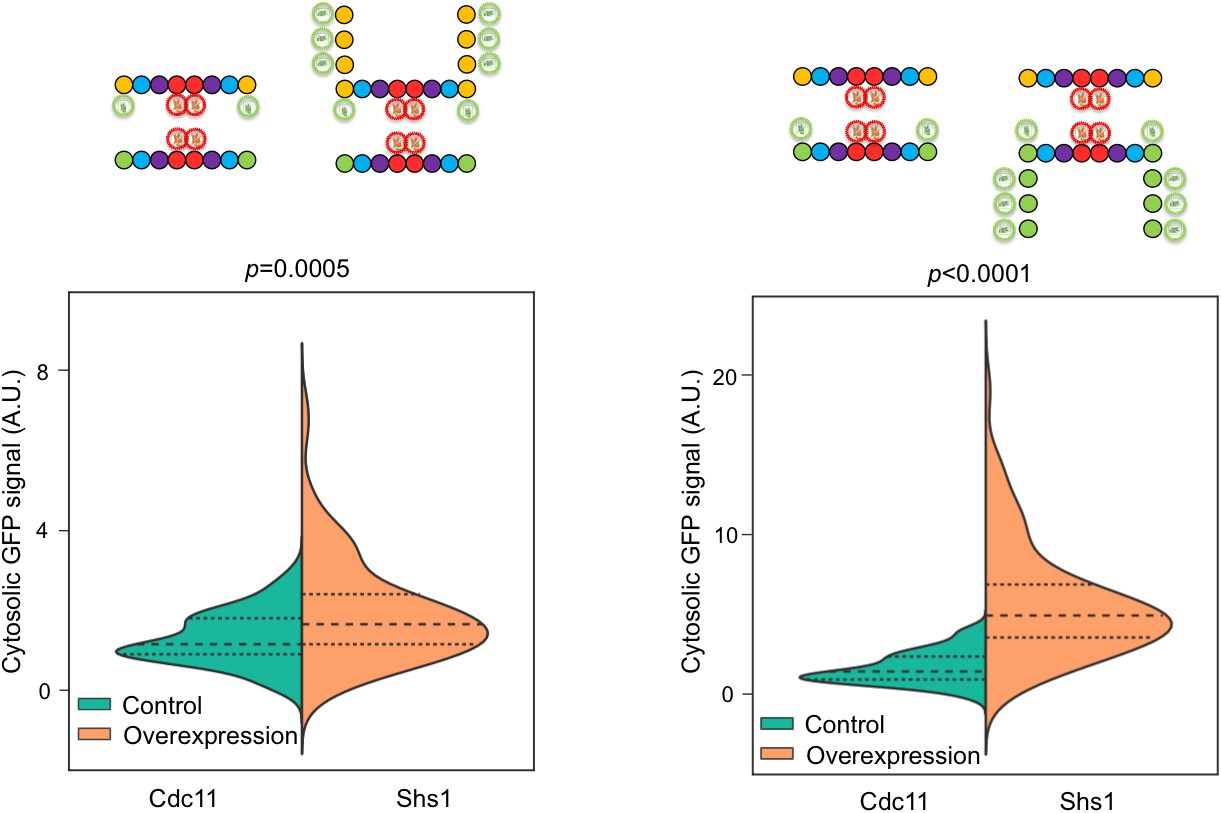
Cdc11-GFP and Shs1-GFP overexpression increases fluorescent signal in the cytosol.
Violin plots showing cytosolic GFP signal with and without overexpression of Cdc11-GFP from plasmid pSB5 in JTY5396 and Shs1-GFP from plasmid pRS316-Shs1-GFP in JTY5397, as in Figure 4C. Controls carried empty vector pRS316. From left to right, n = 87, 93, 91, and 81.
Figure 5 with 3 supplements

The order of Cdc3 oligomerization is controlled by the Cdc3 N-terminal extension.
(A) Violin plot showing bud neck fluorescence for the indicated GFP-tagged alleles of Cdc10 or Cdc3 expressed from plasmids in WT cells (strain BY4741, plasmids pLA10, pCdc10-1-GFP, pCdc3-GFP, and YCpL-Cdc3(D289N)-GFP) cultured at 22°C to mid-log phase prior to imaging. From left to right, n = 14, 11, 14, and 10. (B) As in (A), but including plasmids (pCdc3-GFP, YCpL-Cdc3(D289N)-GFP, YCpL-Cdc3(Δ1–56)-GFP, YCpL-Cdc3(D289N, Δ1–56)-GFP, YCpL-Cdc3(Δ1100)-GFP, or YCpL-Cdc3(D289N, Δ1–100)-GFP) encoding Cdc3-GFP alleles with D289N and/or the indicated truncations of the NTE. From left to right, n = 35, 30, 25, 16, 28, and 27. (C) Dilution series of cdc10∆ cells (strain JTY5104 w/ Cdc3 covering plasmid pMVB100) carrying the plasmids from (B) grown on rich medium incubated at the indicated temperature. (D–E) CSD-BiFC experiment and interpretation as in Figure 2B, but with different strains (YEF5692, MMY0191, or 12-VN/10-CN) and Cdc3-VC or Cdc3(ΔNTE)-VC expressed from plasmids (YCpHU-Cdc3-VC or YCpHU-Cdc3(Δ1–100)-VC). (D) From left to right, n = 22, 37, 43, and 33. (E) From left to right, n = 37, 66, 42, and 57.
Figure 5—figure supplement 1

Proposed G-occlusion model of Cdc3 NTE function in septin oligomerization.
While monomeric, Cdc3’s long NTE occludes the Cdc3 GTP-binding pocket and G interface, as evidenced by the ability of the NTE to mask mutations at the G interface from exclusion upon co-expression with WT Cdc3 (see Figure 5B). Monomeric Cdc3 thus interacts with a septin binding partner (e.g. Cdc12) at its ‘open’ NC interface, but not its occluded G interface. Following NC oligomerization with a Cdc12–Cdc11 or Cdc12–Shs1 dimer, Cdc12 recruits the Cdc3 NTE out of its G-occluding conformation, allowing Cdc3–Cdc10 interaction across the G interface.
Figure 5—figure supplement 2
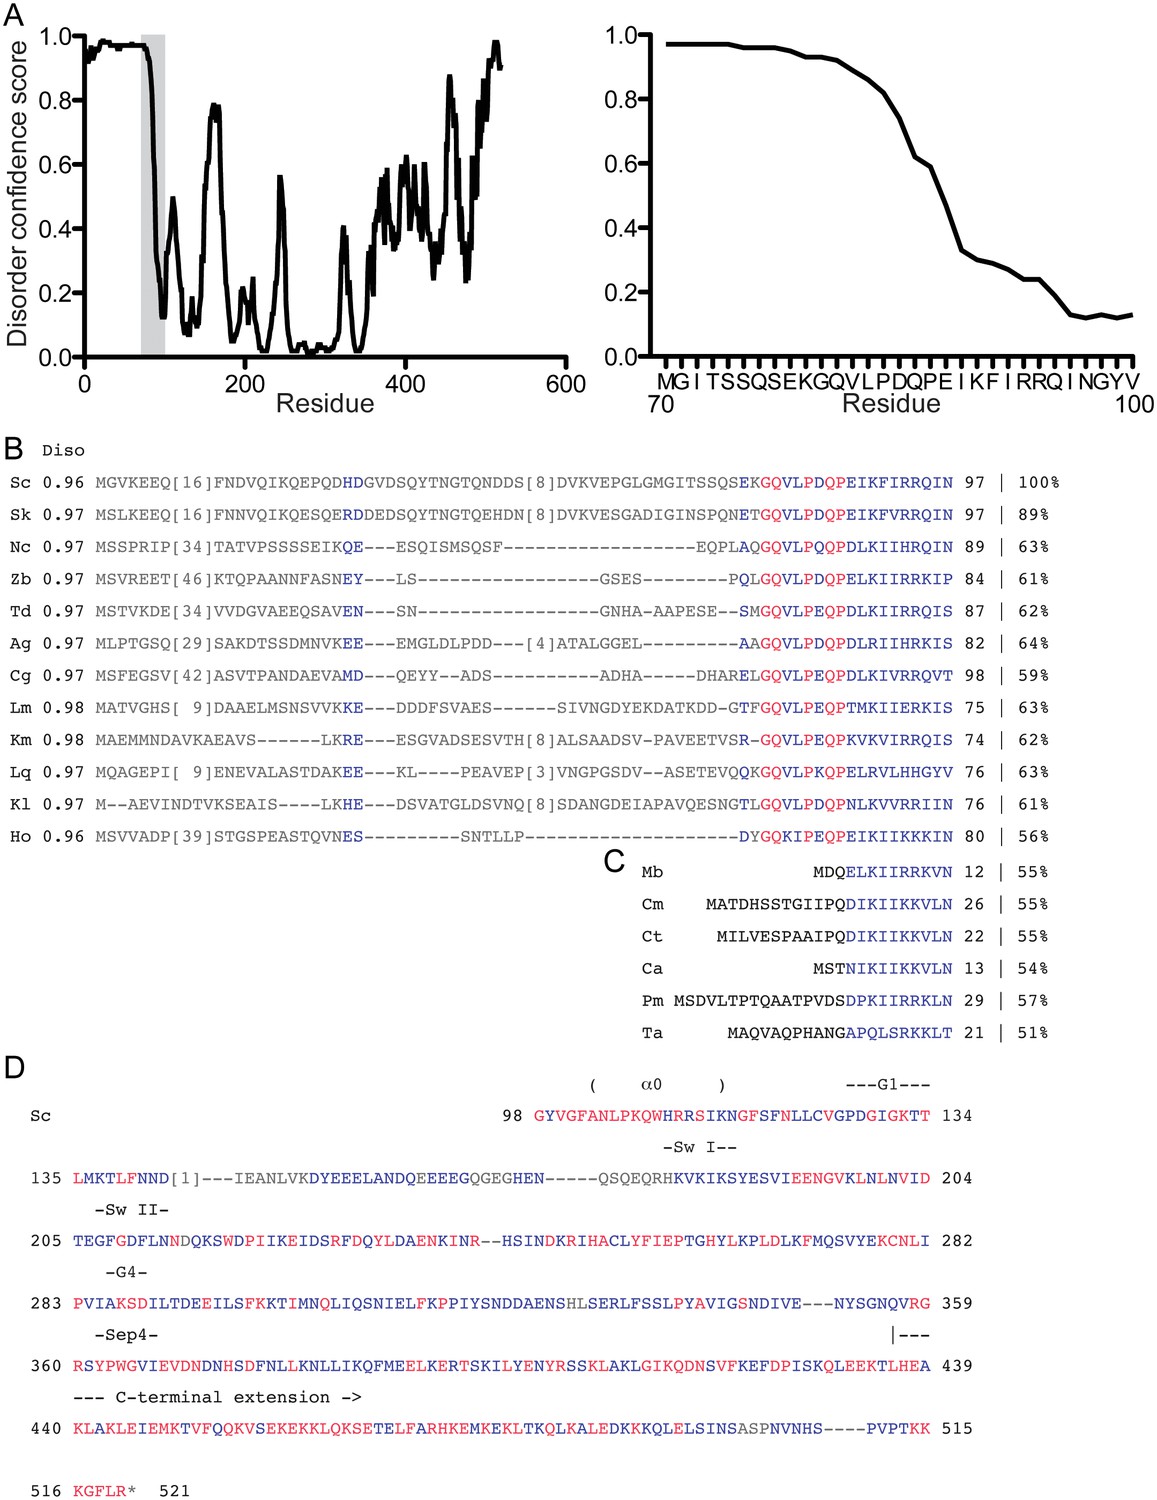
Predicted disorder and conservation in the Cdc3 NTE.
(A) The full Cdc3 sequence was analyzed by DISOPRED3 for predicted disorder. Plots show confidence scores for predicted disorder for each residue. The shaded area of the plot at left is expanded in the plot at right. (B) Sequence alignment of the first 97 amino acids of S. cerevisiae Cdc3 (ScCdc3) with Cdc3 homologs from other fungal species that have an obvious NTE. Average DISOPRED3 scores for each NTE (residues Nterminal to the conserved motif) are given in the column labeled ‘Diso’. The percentage value at far right gives the percent identity compared to ScCdc3 residues 88–520. Blue and red indicate similar and identical residues, respectively. Species and accession numbers: Sk, S. kudriavzevii, EJT44570.1; Nc, Naumovozyma castellii, XP_003675929.1; Zb, Zygosaccharomyces bailii, CDF90019.1; Td, Torulaspora delbrueckii, XP_003682181.1; Ag, Ashbya gossypii, NP_985658.2; Cg,Candida glabrata, KTA97432.1; Lm, Lachancea mirantina, SCV04072.1; Km, Kluyveromyces marxianus, BAO38302.1; Lq, Lachancea quebecensis, CUS21187.1; Kl, Kluyveromyces lactis XP_453247.1; Ho, Hanseniaspora osmophila, OEJ91001.1. (C) As in (B), but with fungal species that lack an NTE. Consequently, no DISOPRED3 score is given. Species and accession numbers: Mb, Metschnikowia bicuspidata, XP_018712407.1; Cm, Candida maltosa, EMG46918.1; Ct, C. tropicalis, XP_002550438.1; Ca, C. albicans, P39826.1; Pm, Pichia membranifaciens, XP_019015360.1; Ta, Tilletiaria anomala, XP_013243186.1. (D) The remainder of the ScCdc3 protein sequence is given with the color scheme as in (B) showing similarity and identity with the species in (B). Notable structural features are indicated above the sequence.
Figure 5—figure supplement 3
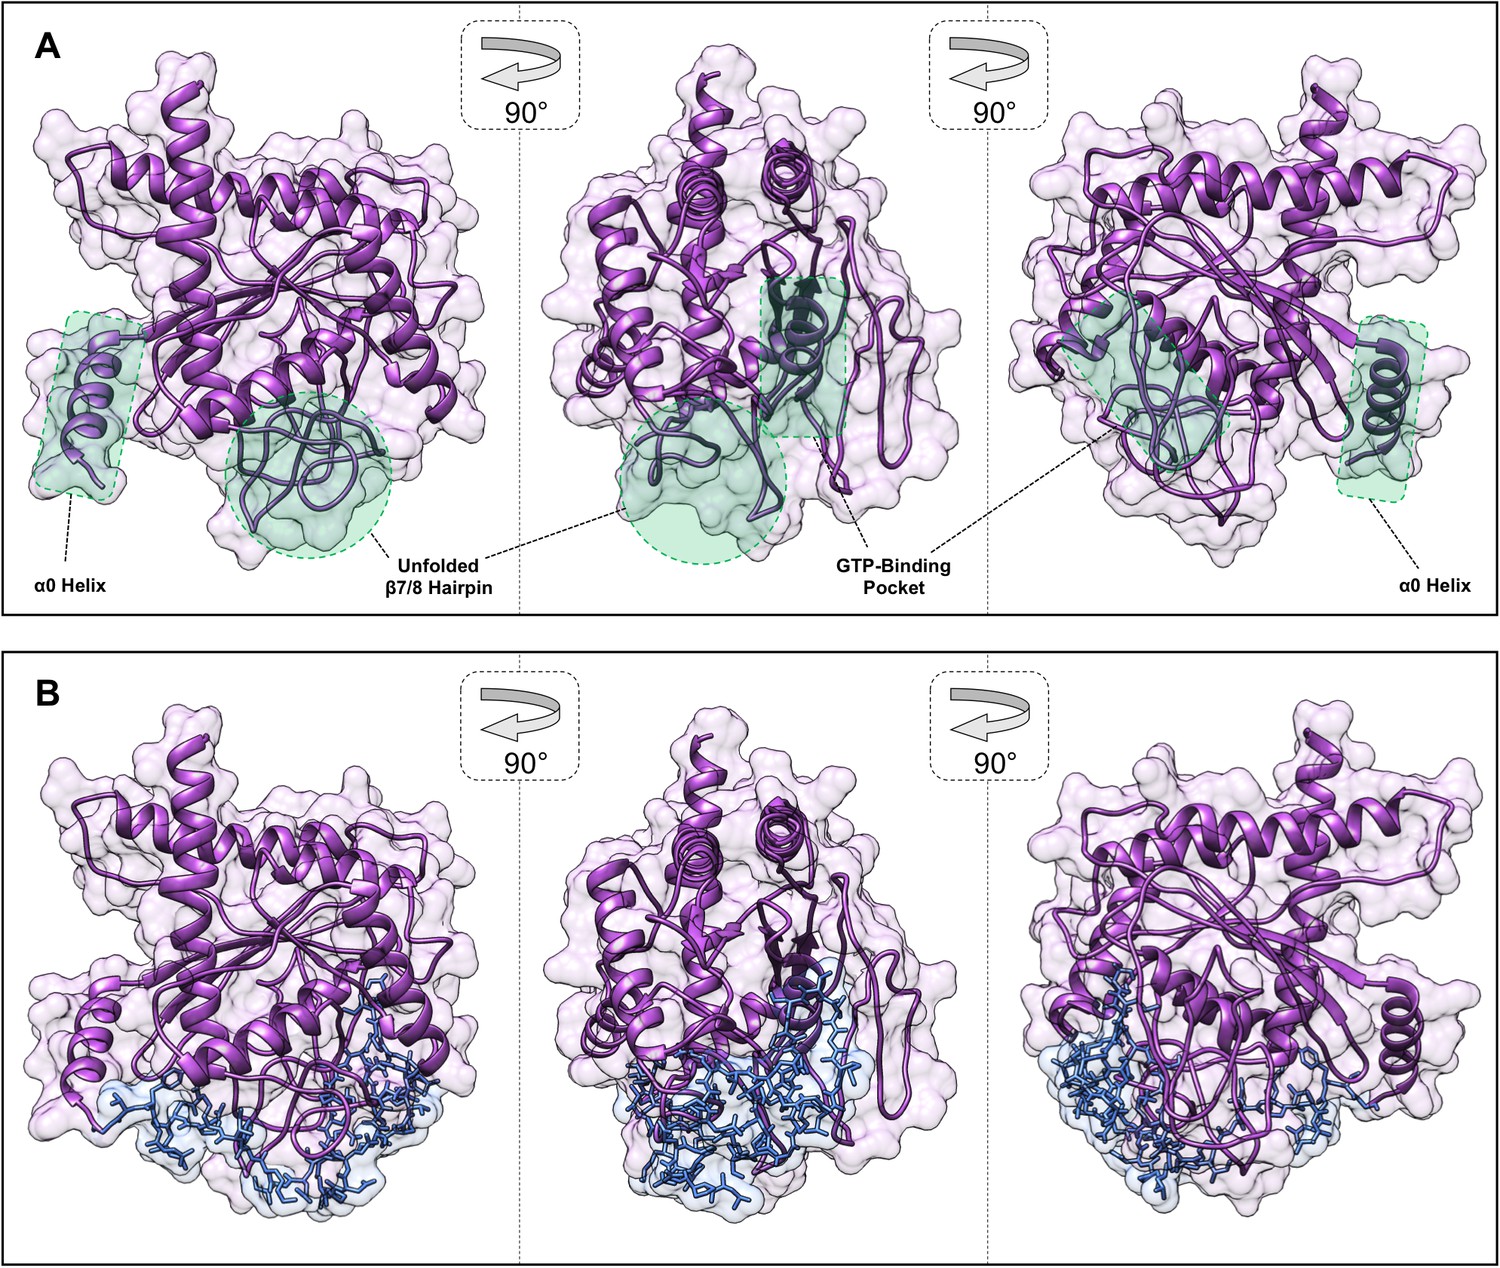
In silico structural modeling of G occlusion by the Cdc3 NTE.
(A) An ‘apo Cdc3’ structural model generated by threading the Cdc3 sequence through the crystal structure of nucleotide-free, truncated Cdc11 (PDB 5AR1), highlighting the lack of secondary structure for the Sep4-motif-proximal β7/8 hairpin (compare with ribbon diagrams in other figures). (B) A peptide comprised of residues 57–82 of Cdc3 was docked onto the ‘apo Cdc3’ model allowing full conformational freedom using Autodock Vina. The residues between the docked peptide and the α0 helix (83-100) were then modeled using MODELLER.
Figure 6 with 1 supplement
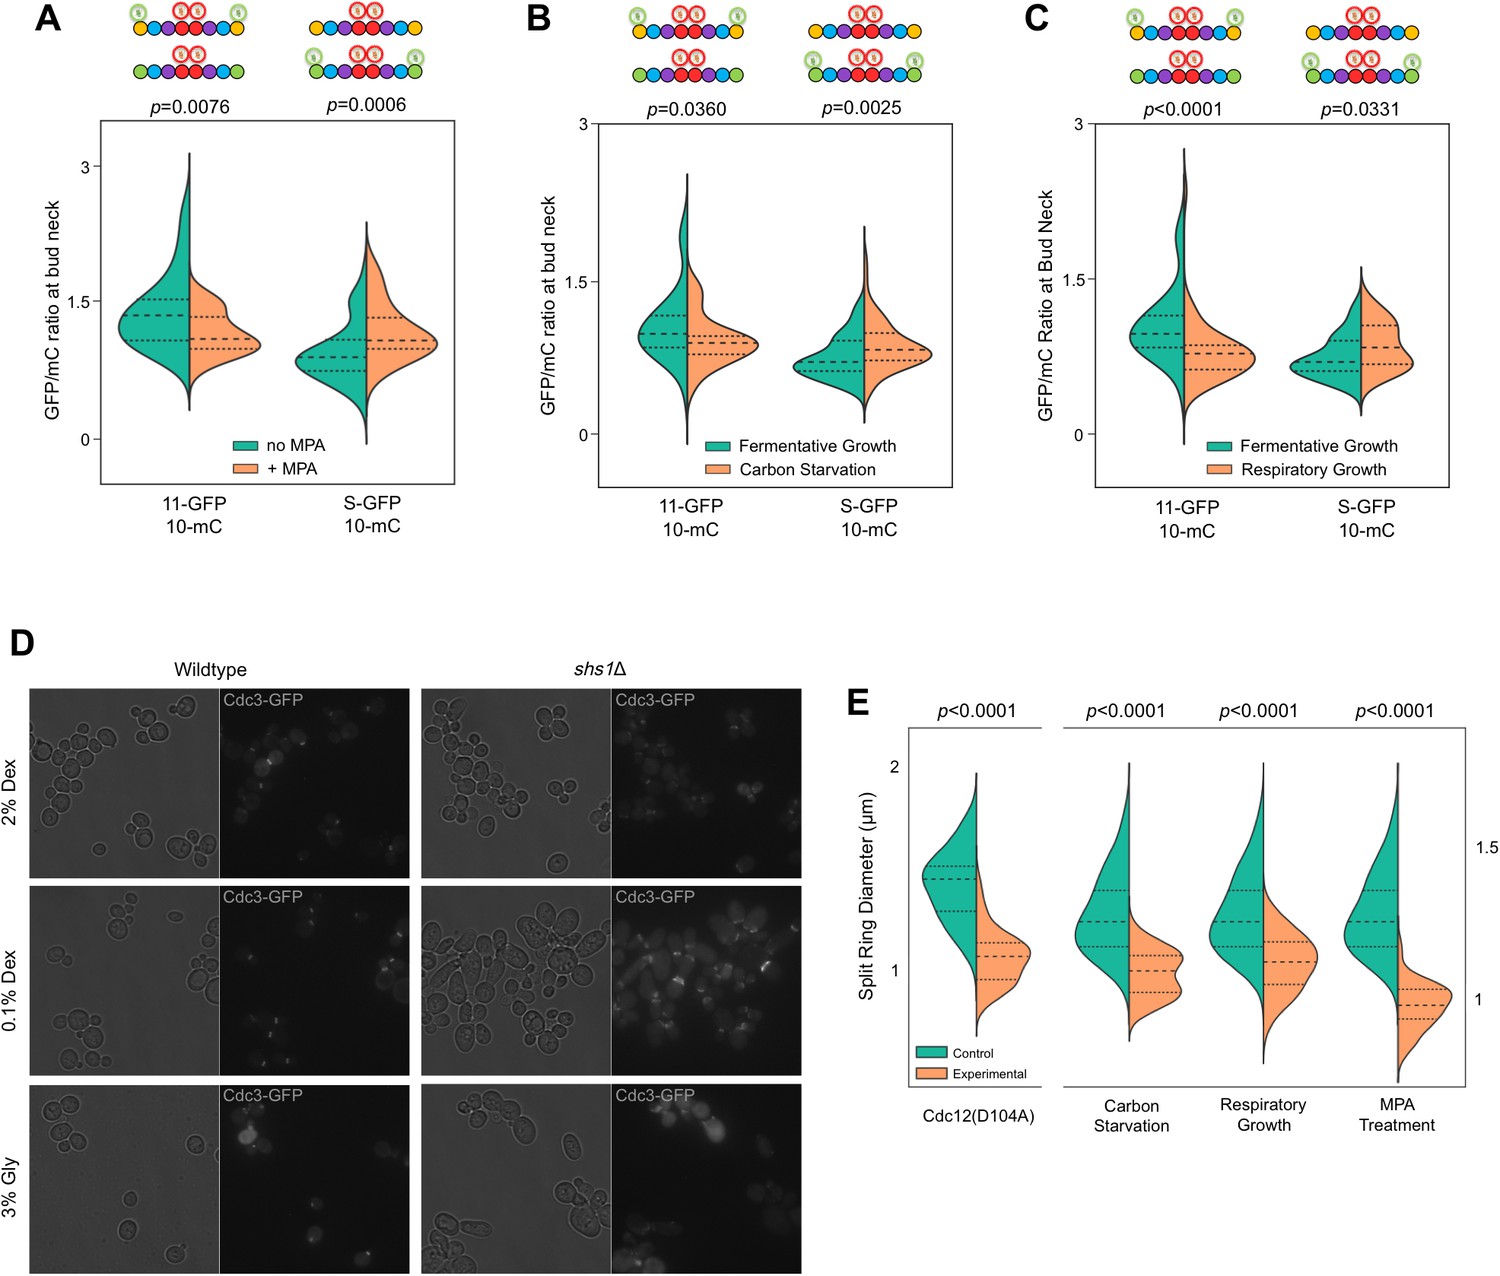
Recruitment of Cdc11 vs Shs1 by Cdc12 is sensitive to changes in the guanine nucleotide ratios.
(A–C) Violin plots showing Cdc11-GFP-to-Cdc10-mCherry or Shs1-GFP-to-Cdc10-mCherry ratios, as in Figure 4B, but with cells of strain JTY5396 or JTY5397 carrying no plasmid and exposed to various physiological conditions that alter the GTP:GDP ratio. (A) Treatment with 100 µg/ml MPA for 24 hr. From left to right, n = 35, 39, 48, and 26. (B) Media with 2% dextrose (fermentative growth; normal) or 0.1% dextrose (carbon starvation). From left to right, n = 31, 39, 57, and 58. (C) Media with 2% dextrose (fermentative growth) or 3% glycerol (respiratory growth). From left to right, n = 31, 47, 57, and 26. (D) Micrographs showing cell morphology for WT (BY4741) or shs1Δ (JTY3631) cells carrying a plasmid (pML109) expressing Cdc3-GFP in fermentative, carbon starvation, or respiratory growth conditions (YP w/2% dextrose, 0.1% dextrose, or 3% glycerol, respectively). (E) Septin ring diameters at split-ring phase. Violin plots showing ring diameters for cells of strain JTY5396 either carrying plasmids expressing WT Cdc12 (pFM650) or Cdc12(D104A) (YCpL-Cdc12(D104A)) on the left, or grown in the described conditions (control, YP w/2% dextrose;, carbon starvation, 0.1% dextrose; respiratory growth, 3% glycerol; or 2% dextrose w/100 µg/ml MPA) on the right. From left to right, n = 20, 28, 25, 33, 25, 24, 25, 30.
Figure 6—figure supplement 1

Non-pharmacological IMPDH inhibition reduces septin-septin interaction across the NC interface.
As in Figure 1B, for cells co-expressing Cdc12-VC and Cdc3-VN in either normal fermentative growth conditions (YP w/2% dextrose; ‘control’), carbon starvation conditions (YP w/0.1% dextrose), or respiratory growth conditions (YP w/3% glycerol).
Figure 7
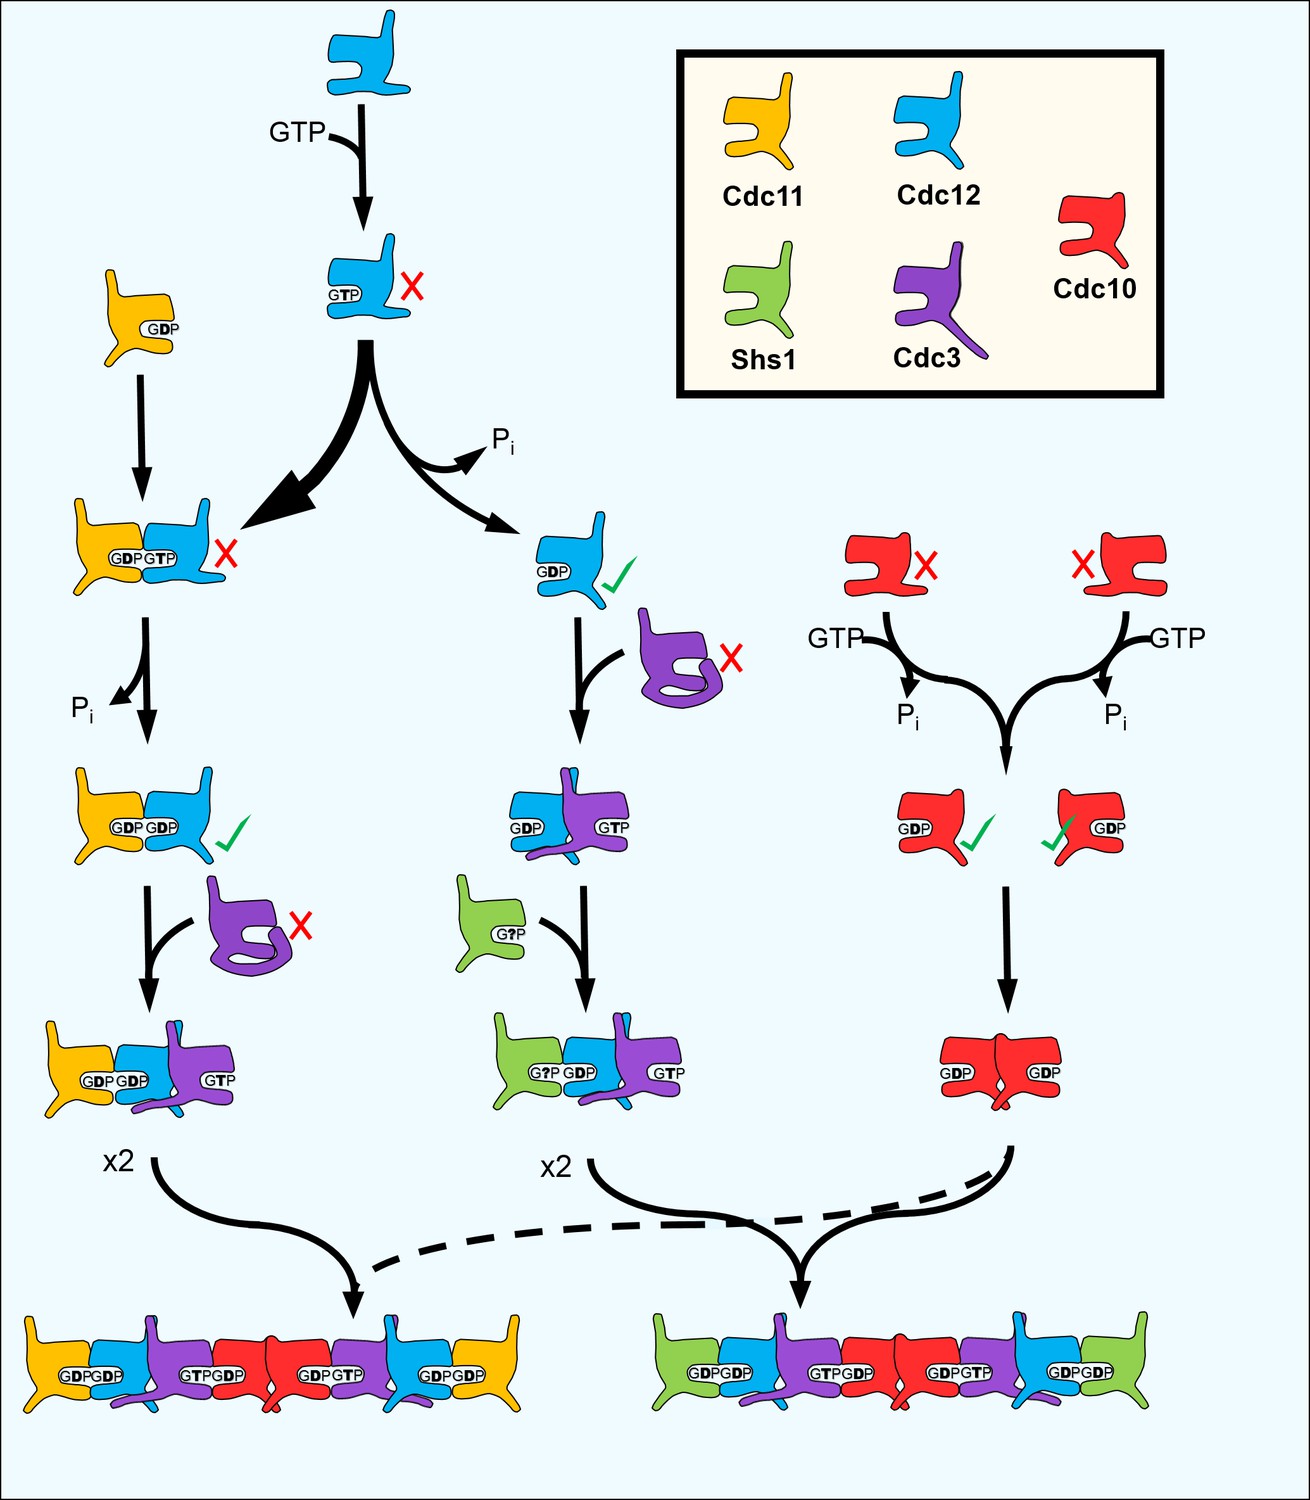
A model for the step-wise pathway of septin protofilament assembly in S. cerevisiae.
https://doi.org/10.7554/eLife.23689.020Additional files
-
Supplementary file 1
Yeast strains and plasmids.
Table listing the strains and plasmids used in this study, including genotypes and origins.
- https://doi.org/10.7554/eLife.23689.021
-
Supplementary file 2
Image J macro used to analyze microscopy data for cytoplasmic fluorescence.
A macro made for ImageJ to automate the quantification of cytoplasmic fluorescence.
- https://doi.org/10.7554/eLife.23689.022
-
Supplementary file 3
Image J macro used to analyze microscopy data for cytoplasmic fluorescence.
A macro made for ImageJ to automate the quantification of maximum fluorescence signal intensity in a small area (bud neck).
- https://doi.org/10.7554/eLife.23689.023
-
Supplementary file 4
Image J macro used to analyze microscopy data for ratios of GFP and mCherry bud neck fluorescence.
A macro made for ImageJ to automate the quantification of maximum fluorescence signal intensity in a small area (bud neck) matched across images of the same cells for two different filter sets.
- https://doi.org/10.7554/eLife.23689.024
Download links
A two-part list of links to download the article, or parts of the article, in various formats.
Downloads (link to download the article as PDF)
Open citations (links to open the citations from this article in various online reference manager services)
Cite this article (links to download the citations from this article in formats compatible with various reference manager tools)
The step-wise pathway of septin hetero-octamer assembly in budding yeast
eLife 6:e23689.
https://doi.org/10.7554/eLife.23689


