C. elegans avoids toxin-producing Streptomyces using a seven transmembrane domain chemosensory receptor
- San Jose State University, United States
- University of California San Francisco, United States
Figures
Figure 1 with 1 supplement
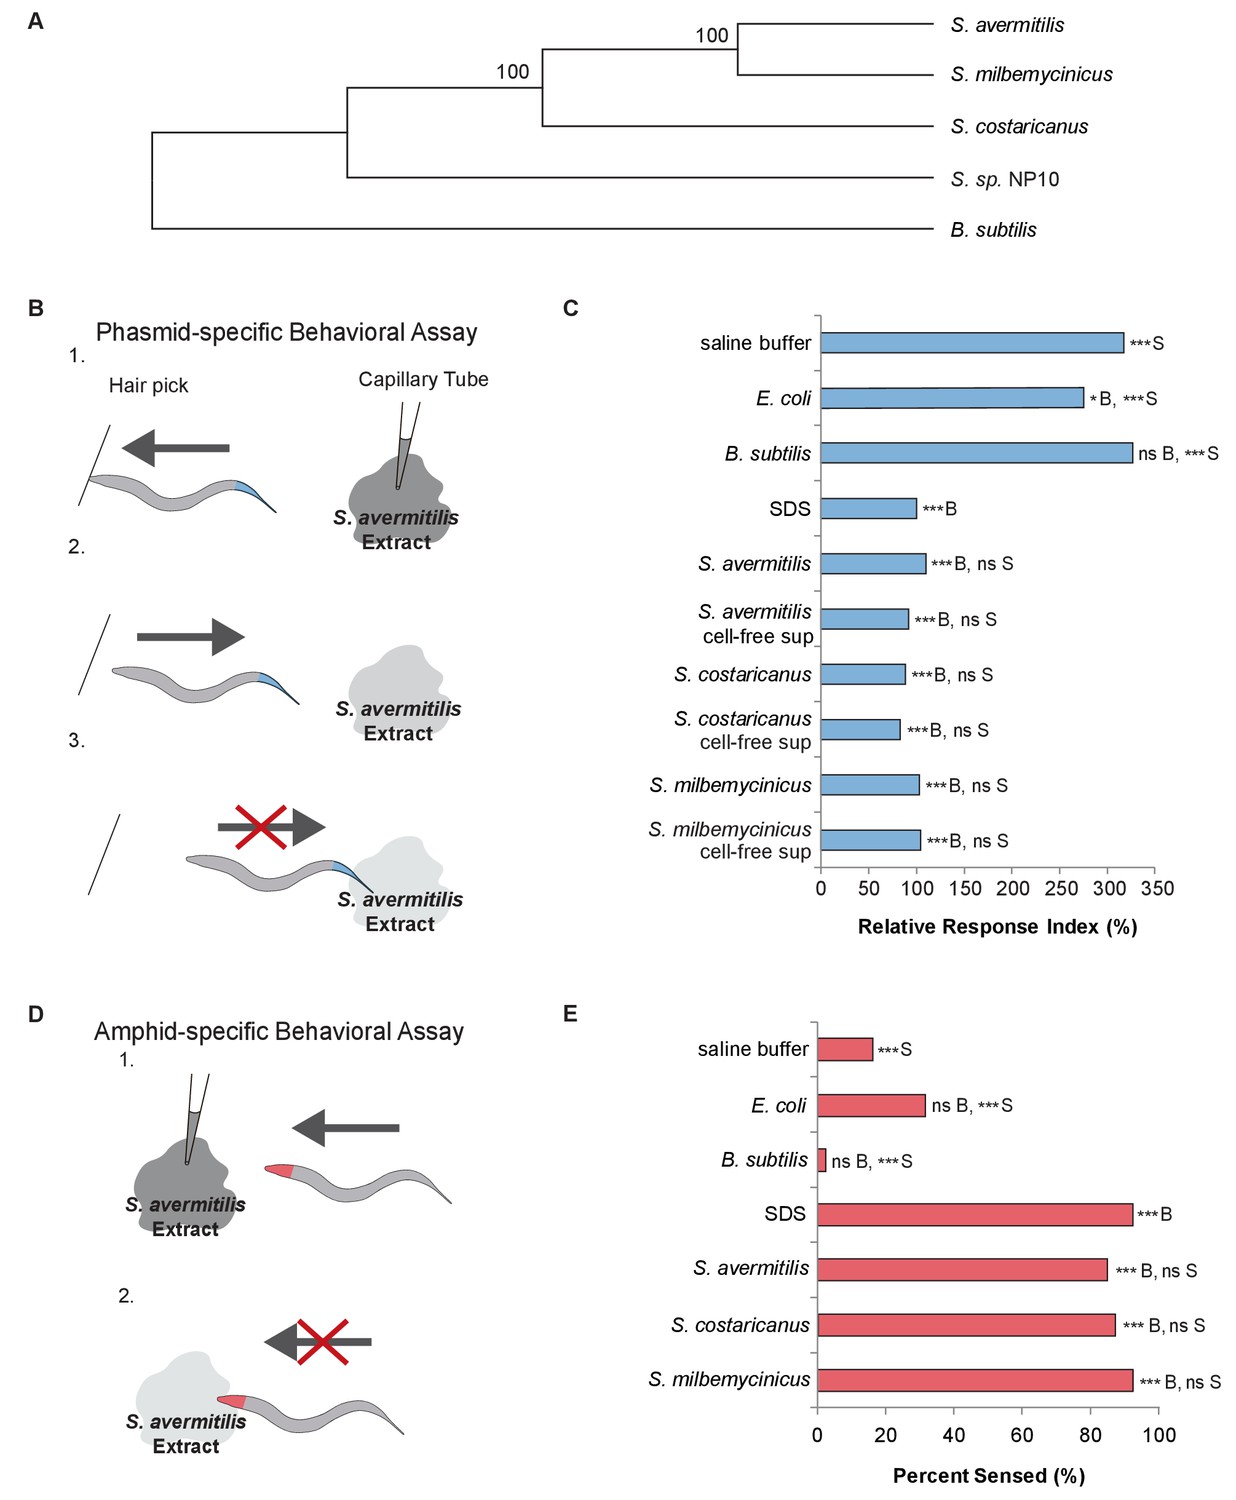
C. elegans nematodes rapidly avoid Streptomyces at their head and tail.
(A) Phylogenetic tree including strains of Streptomyces bacteria and Bacillus subtilis. (B) Schematic diagram of a dry-drop behavioral assay that selectively tests the response of the PHA and PHB phasmid neurons. Animals are placed on a dry plate and induced to move backward with a hair pick. A drop of bacterial extract or control buffer is placed behind the animal and quickly dries, preventing wicking along the animal. As the animal moves into the drop, the time before the animal halts movement is measured. Response times are normalized to a positive control, the average response to sodium dodecyl sulfate (SDS), assayed on the same day. A shorter response time indicates a more rapid avoidance response. (C) Quantification of the rapid avoidance response of C. elegans phasmid neurons to Streptomyces, but not to Escherichia coli or B. subtilis. One-way ANOVA and Tukey’s post-hoc tests were performed to determine significance. (D) Schematic diagram of a dry-drop behavioral assay that selectively tests the response of amphid neurons in the head. Animals are placed on a dry plate and allowed to move forward. A drop of bacterial extract or control buffer is placed in front of the animals and quickly dries. The proportion of the time that animals halt movement into the dry drop is recorded. (E) Quantification of the rapid avoidance response of C. elegans amphid neurons to species of Streptomyces, but not E. coli or B. subtilis. Two independent sample z-tests and the Hochberg multiple comparison adjustment procedure were performed. (C and E) For each experimental sample, n ≥ 40 for the experimental group, n ≥ 40 for the 0.6% SDS positive control, and n ≥ 40 for the saline buffer negative control. ***B, p<0.001; *B, p<0.05; ns B, not significant compared with a control buffer; ***S, p<0.001; NS S, not significant compared with SDS positive control. Exact values and additional pairwise comparisons are included in Figure 1—source data 1 and Figure 1—source data 2.
-
Figure 1—source data 1
Source data for Figure 1 and Figure 1—figure supplement 1.
- https://doi.org/10.7554/eLife.23770.004
-
Figure 1—source data 2
Significance for pairwise comparisons for Figure 1.
- https://doi.org/10.7554/eLife.23770.005
Figure 1—figure supplement 1
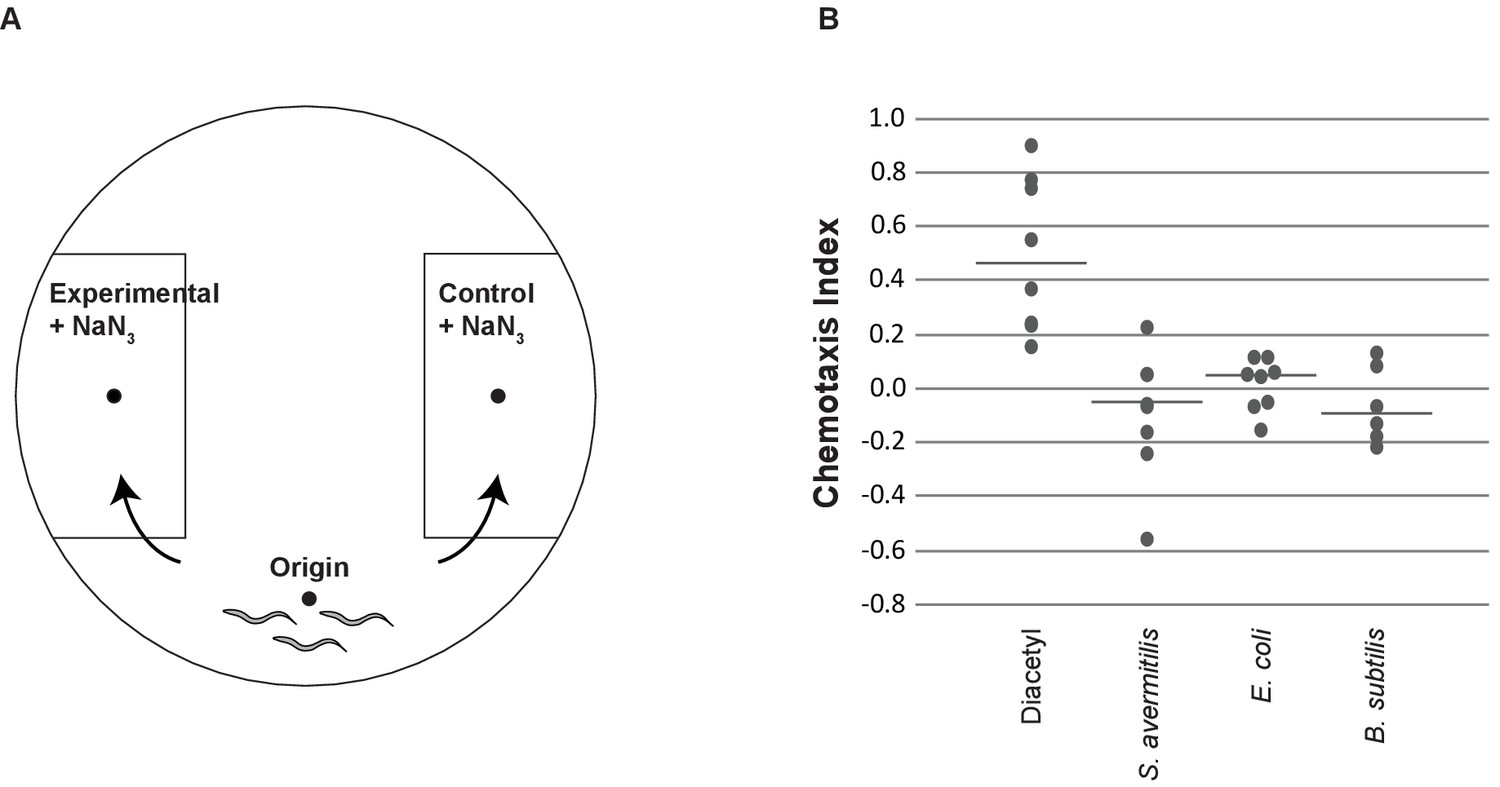
C. elegans do not avoid the smell of Streptomyces.
(A) Chemotaxis assays are designed to test olfactory cues (Bargmann et al., 1993). Chemotaxis plates included an origin, where the nematodes are placed, and control and experimental sections. Both the control and experimental sections contain sodium azide to immobilize animals that reach the control or experimental liquid. (B) Animals chemotax to the olfactory cue diacetyl, but exhibit no response to S. avermitilis, E. coli, or B. subtilis. For each treatment, 50–300 worms were tested on each of at least six plates on at least two different days. Horizontal lines indicate medians. Exact values are included in Figure 1—source data 1.
Figure 2 with 2 supplements

C. elegans avoids the SDS analogs dodecanoate and decanoate.
(A) Quantification of the similar phasmid responses to 3.4 mM and 0.6 mM SDS, which is ten-fold below the critical micelle concentration of SDS. All other assays in this study were performed with 0.6 mM SDS to preclude the possibility of surfactant activity. The surfactant Triton X-100 at its critical micelle concentration is not strongly sensed by the phasmid neurons. (B) Quantification of the reduced responses to molecules with shorter tail length or a less polar head group than SDS. SDS and sodium hexyl sulfate were tested at 0.6 mM and 1-dodecanol was tested at 1 mM. (C) Quantification of the similar phasmid responses to SDS, dodecanoate, decanoate and nonanoate. All compounds except SDS were tested at 1 mM. Note that compounds are represented as the predominant form in a pH 7 solution, the carboxylates. (D) Quantification of the similar amphid responses to SDS, dodecanoate, decanoate and undecanoate, and slower responses to nonanoate and 1-decanol. All compounds except SDS were tested at 1 mM. Note that carboxylate forms are again represented. (A–C) For phasmid assays, one-way ANOVA and Tukey’s post-hoc test were performed. (D) For amphid assays, two-sample z-tests and the Hochberg multiple comparison adjustment procedure were performed. (A–D) For all experimental samples, n ≥ 40 for the experimental group, n ≥ 40 for the 0.6% SDS positive control, and n ≥ 40 for the saline buffer negative control. ***B, p<0.001; *B, p<0.05; ns B, not significant compared with a control buffer; ***S, p<0.001; ns S, not significant compared with SDS positive control. Exact values and additional pairwise comparisons are included in Figure 2—source data 1 and Figure 2—source data 2.
-
Figure 2—source data 1
Source data for Figure 2 and Figure 2—figure supplement 2.
- https://doi.org/10.7554/eLife.23770.009
-
Figure 2—source data 2
Significance for pairwise comparisons for Figure 2 and Figure 2—figure supplement 2.
- https://doi.org/10.7554/eLife.23770.010
Figure 2—figure supplement 1
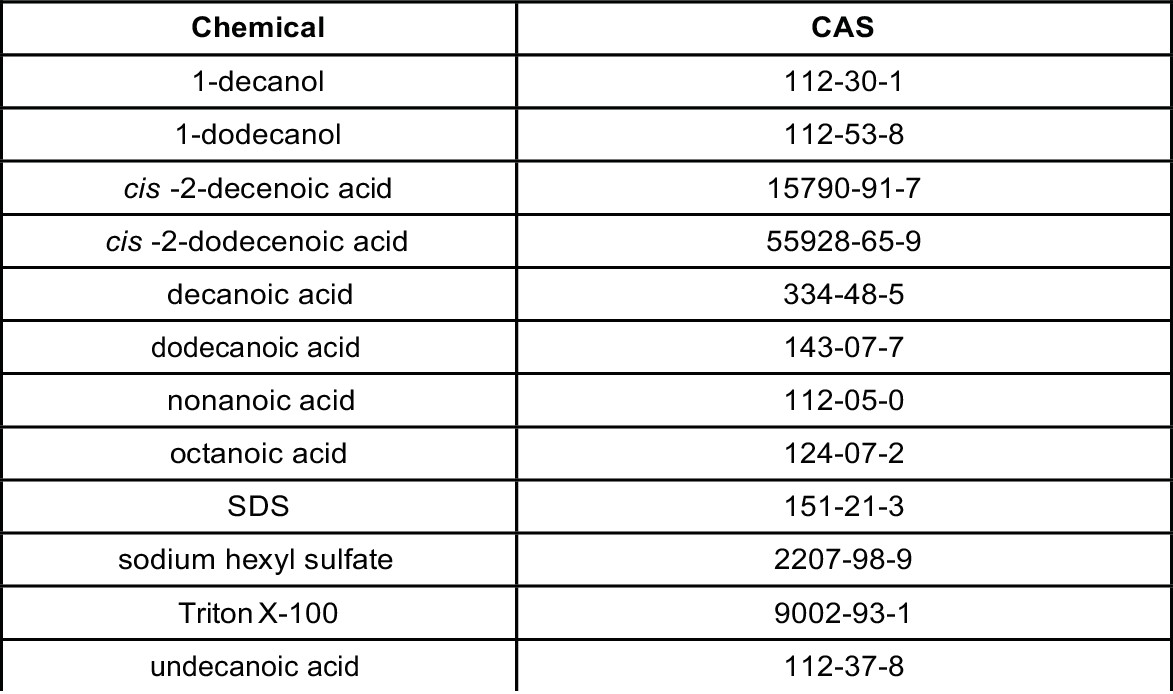
CAS numbers for compounds purchased for this study.
https://doi.org/10.7554/eLife.23770.007
Figure 2—figure supplement 2

Response to different concentrations of SDS, dodecanoate and decanoate.
The response to SDS, dodecanoate and decanoate at the tail is shown. Note that compounds are represented as the predominant form in a pH 7 solution, the carboxylates. One-way ANOVA and Tukey’s post-hoc test were performed. For all experimental samples, n ≥ 40 for the experimental group, n ≥ 40 for the 0.6% SDS positive control, and n ≥ 40 for the saline buffer negative control. ***B, p<0.001; ns B,not significant compared with a control buffer; ***S, p<0.001; ns S, not significant compared with SDS positive control. Exact values and additional pairwise comparisons are included in Figure 2—source data 1 and Figure 2—source data 2.
Figure 3 with 1 supplement
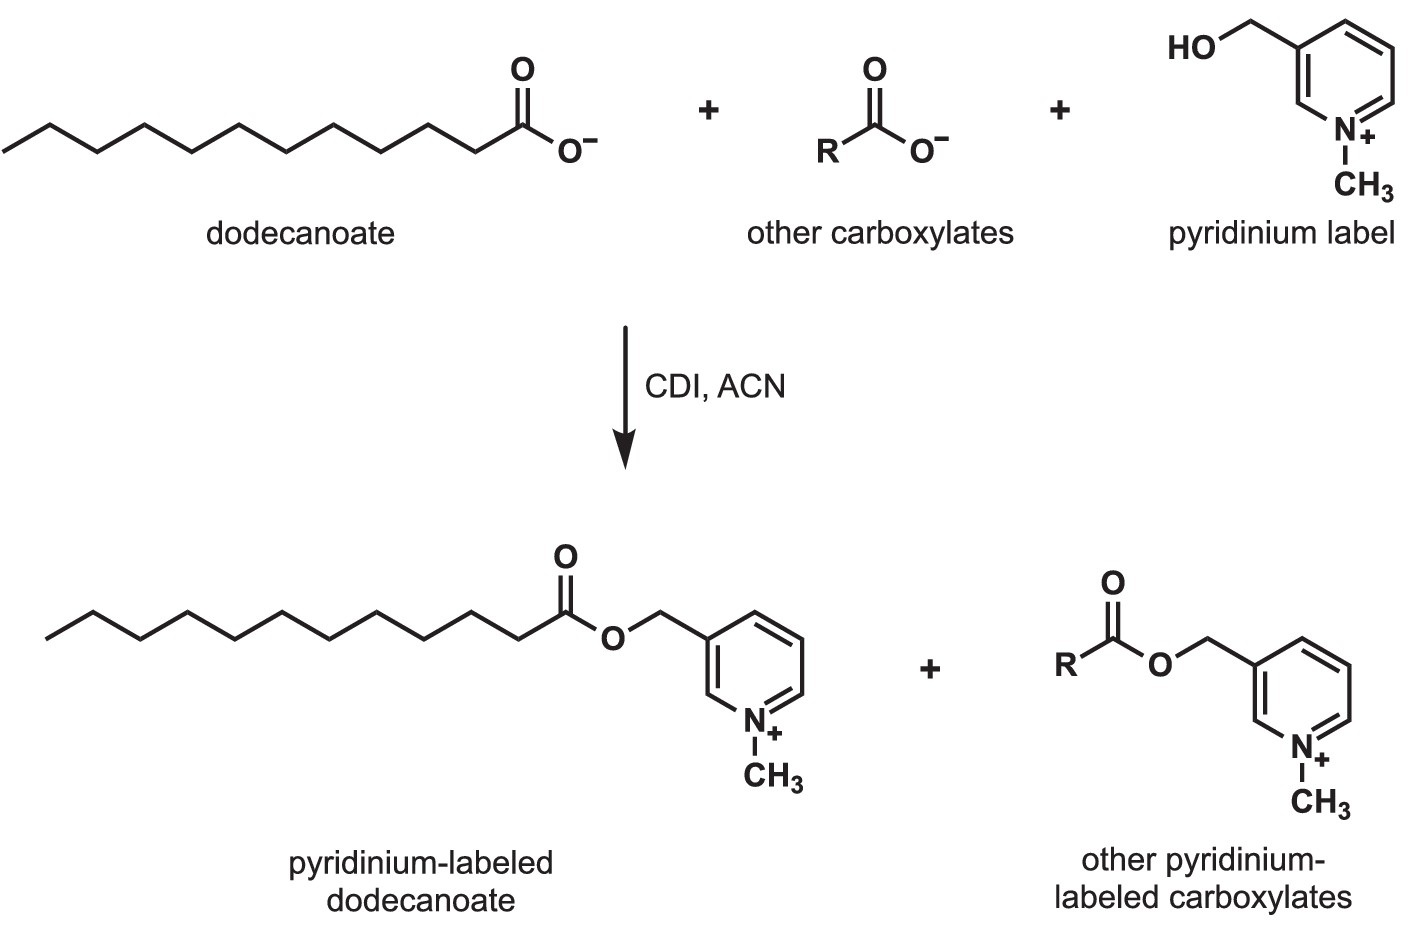
Detection of carboxylates secreted by S.avermitilis, S. costaricanus, and S. milbemycinicus.
Carboxylates were extracted from species of Streptomyces and labeled with a pyridinium moiety for easier detection by mass spectrometry. For example, to detect dodecanoate after Streptomyces cell-free supernatants were extracted and concentrated, dodecanoate and the other carboxylates in the extract were converted to pyridinium esters by treatment with carbonyldiimidazole (CDI) in acetonitrile (ACN).
Figure 3—figure supplement 1
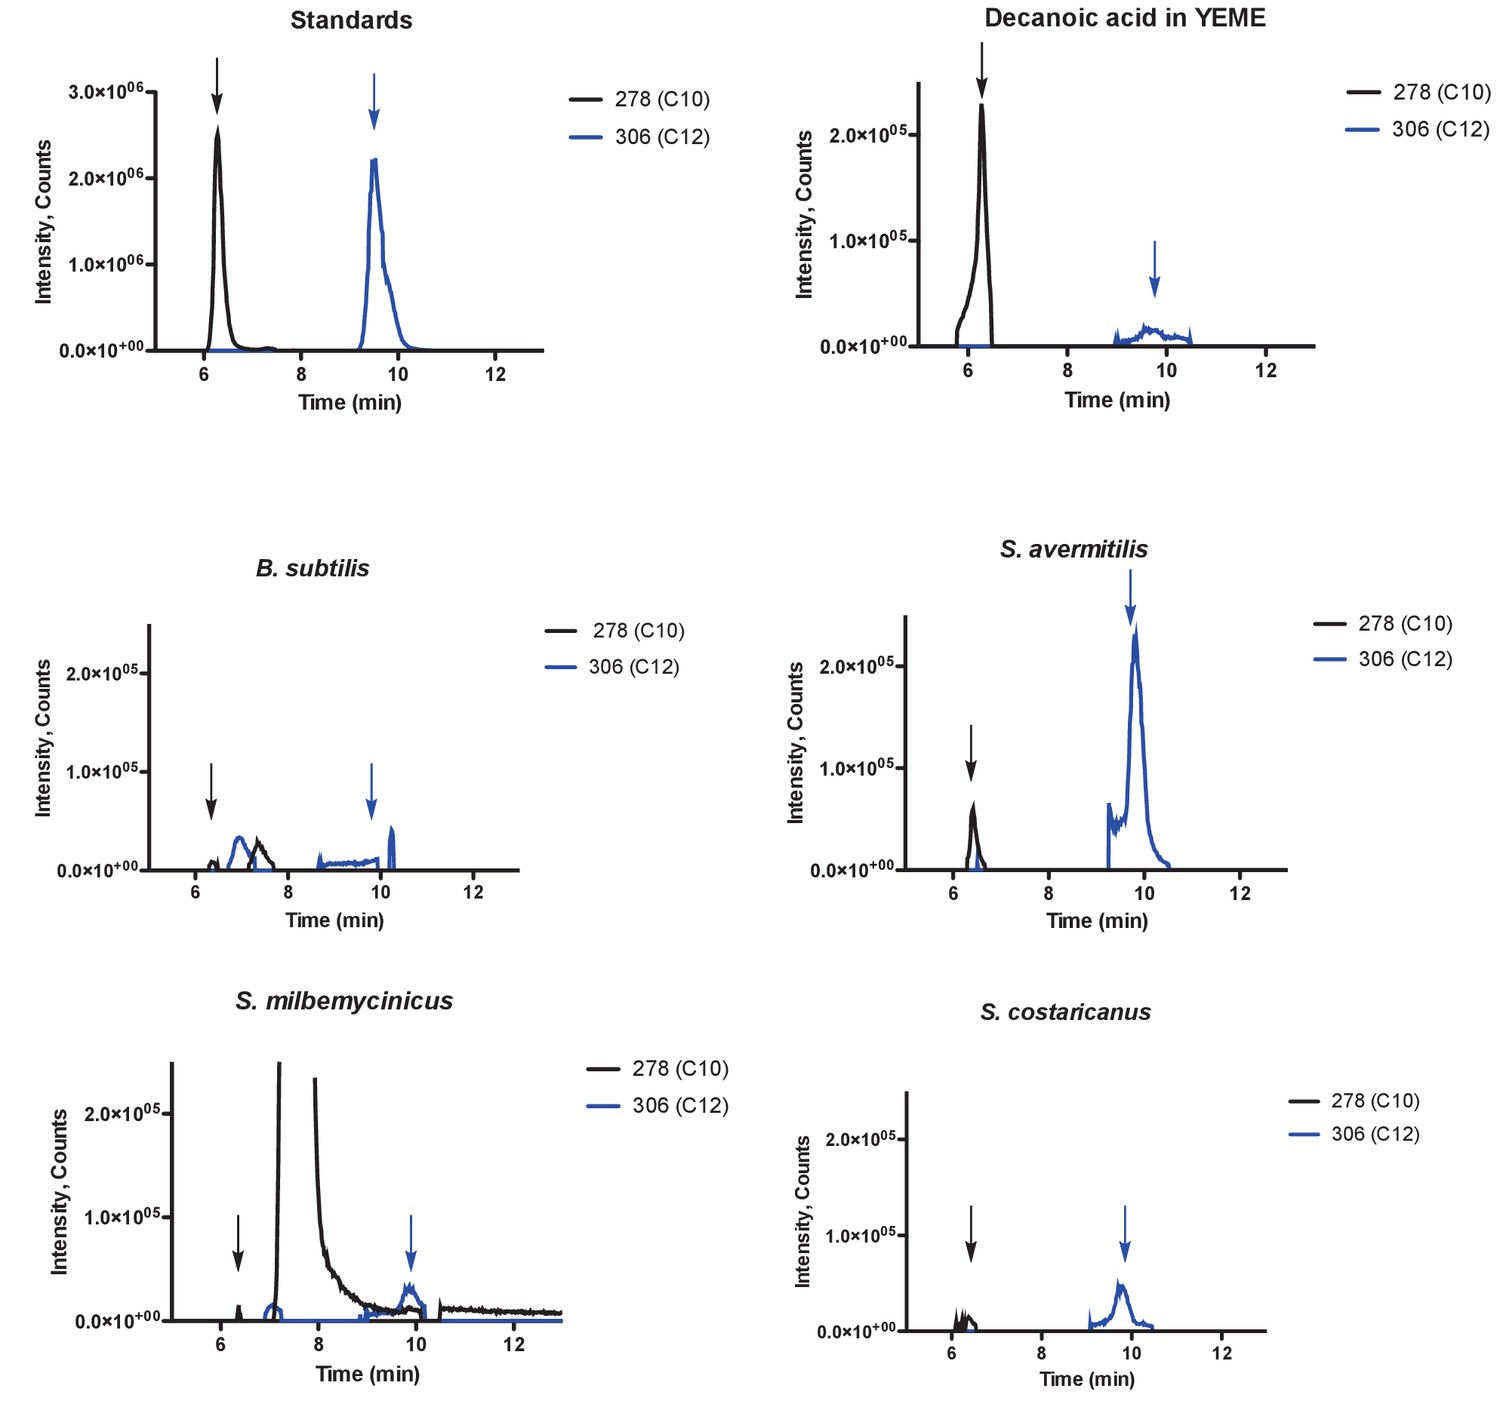
Dodecanoic acid is secreted by Streptomyces.
Modified decanoic (C10) and dodecanoic (C12) acids were detected by LC-MS by searching for molecular weights of 278 and 306 g/mol, respectively. Modified decanoic (C10) and dodecanoic (C12) acid standards, decanoic acid in YEME control, B. subtilis control, S. avermitilis, S. milbemycinicus, and S. costaricanus are shown. Arrows point to decanoic and dodecanoic acid retention times.
Figure 4 with 2 supplements
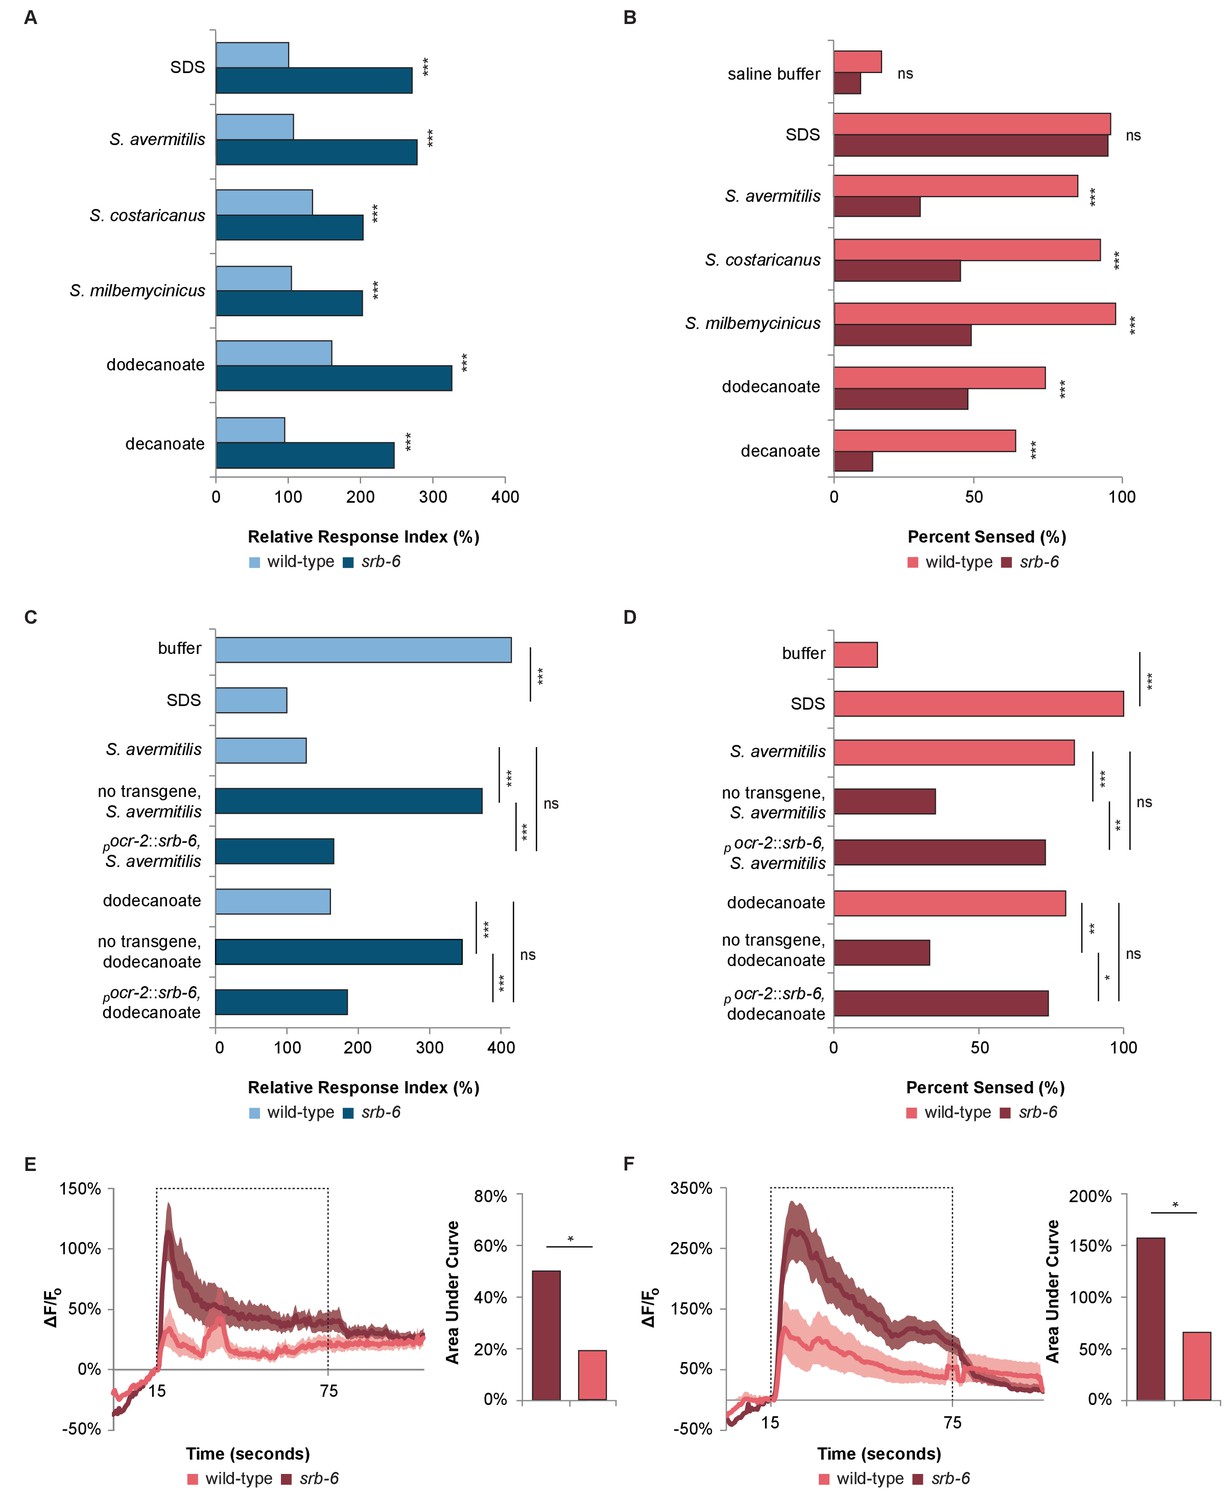
The GPCR SRB-6 is required for the response to Streptomyces, dodecanoate and decanoate.
(A) Quantification of the defect in the phasmid response to SDS, Streptomyces, dodecanoate and decanoate in srb-6 null mutants. (B) Quantification of the defect in the amphid response to Streptomyces, dodecanoate and decanoate in srb-6 mutants. (A–D) For each Streptomyces species in each panel, cell-free supernatants were used for wild-type and srb-6 mutants. (A–B) Decanoate and dodecanoate were tested at 1 mM. Note that carboxylate forms are represented. For experimental samples, n ≥ 40 for the experimental group, n ≥ 40 for the 0.6% SDS positive control, and n ≥ 40 for the saline buffer negative control. ***, p<0.001; NS, not significant. (C) Quantification of the significantly rescued response of srb-6 mutant animals expressing the srb-6 cDNA under the direction of the ocr-2 promoter (pocr-2::srb-6) to S. avermitilis and dodecanoate compared with the response of srb-6 mutant animals without the transgene. In the tail, the ocr-2 promoter drives srb-6 cDNA expression in PHA and PHB neurons. (D) Quantification of the significantly rescued response of srb-6 mutant animals carrying the pocr-2::srb-6 transgene to S. avermitilis and dodecanoate compared with that of srb-6 mutant animals without the transgene. In the head, the ocr-2 promoter drives expression in ASH, ADL, ADF and one other type of amphid neuron (AWA). (C–D) Decanoate and dodecanoate were tested at 1 mM. Note that carboxylate forms are represented. Two similar transgenic lines were examined. For experimental samples, n ≥ 20 for the experimental group, n ≥ 20 for the 0.6% SDS positive control, and n ≥ 20 for the saline buffer negative control. ***, p<0.001; **, p<0.01; *, p<0.05; ns, not significant. (A, C) For phasmid assays, one-factor ANOVA analysis was performed followed by two-sample t-tests and the Hochberg procedure for multiple comparisons. (B, D) For amphid assays, two-sample z-tests and the Hochberg multiple comparison adjustment procedure were performed. Exact values are included in Figure 4—source data 1. (E) Calcium imaging of ASH sensory neurons in living wild-type and srb-6 mutant animals expressing GCaMP6 (Chen et al., 2013) under the direction of the srb-6 promoter upon exposure to a cell-free supernatant of S. avermitilis. The bar graph shows the average areas under the curve (AUC) for the period of S. avermitilis stimulation and error bars are standard error of the mean (SEM). (F) Calcium imaging of ASH neurons in living wild-type and srb-6 mutant animals expressing GCaMP6 under the direction of the srb-6 promoter upon exposure to 1 mm dodecanoate. The bar graph represents the average AUC for the period of dodecanoate stimulation, and error bars are SEM. (E–F) Experimental animals were exposed to a control buffer for the first 15 s, then to stimulus for 60 s, followed by control buffer. Traces show the average percent change in GCaMP6 fluorescence (ΔF/F0) and shading indicates SEM. For experimental samples, n ≥ 15 for each genotype and stimulus. *, p<0.05 in a t-test. See Statistical Analysis in the Materials and methods section for additional details.
-
Figure 4—source data 1
Source data for Figure 4 and Figure 4—figure supplement 1.
- https://doi.org/10.7554/eLife.23770.016
-
Figure 4—source data 2
Significance for pairwise comparisons for Figure 4—figure supplement 1.
- https://doi.org/10.7554/eLife.23770.017
Figure 4—figure supplement 1
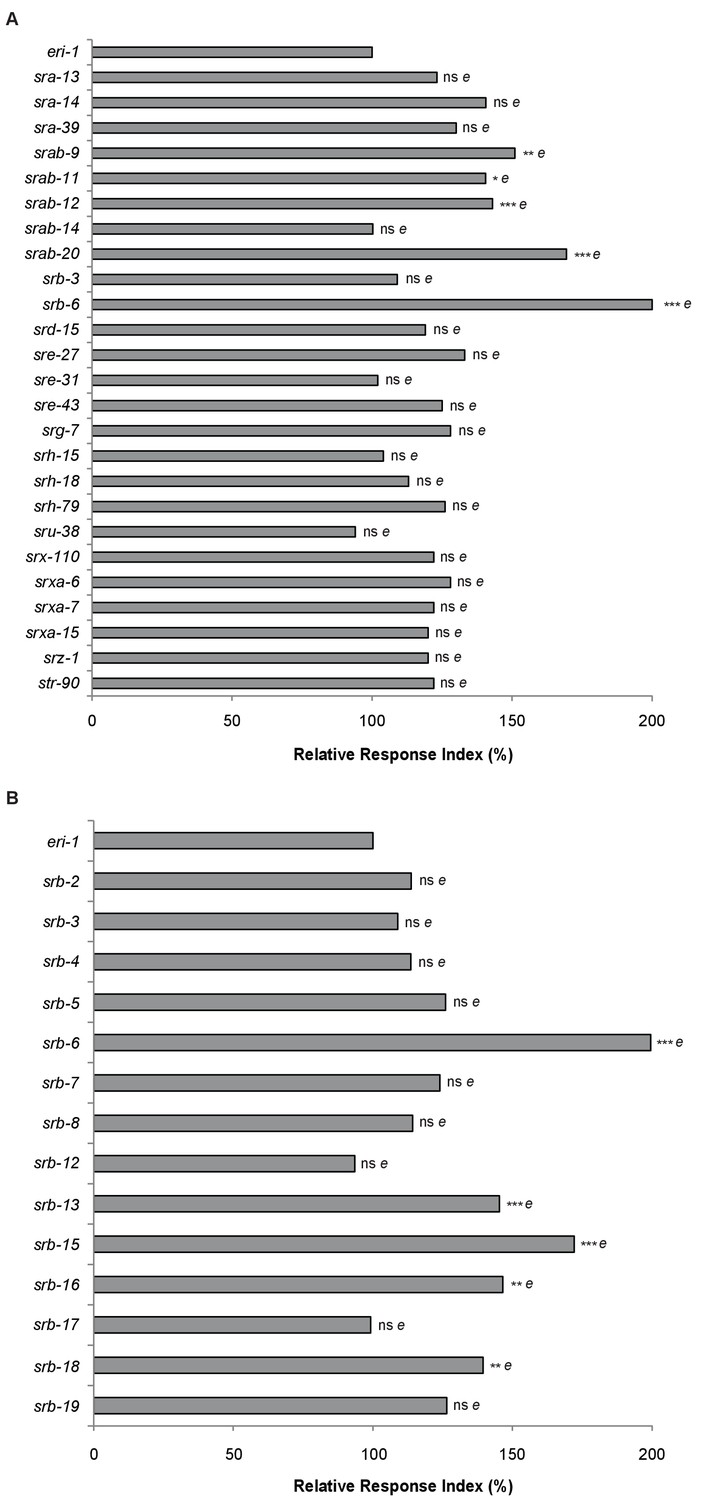
RNAi screen for receptors required to sense dodecanoic acid.
RNAi was used to knock down the expression of chemoreceptor genes (A) expressed in PHA, PHB, and a subset of neurons in the head and (B) srb family members. (A-B) RNAi was performed in an eri-1(mg366) RNAi-sensitive background. Animals were assayed for their ability to respond to 1 mM dodecanoic acid exposure at the tail. Each RNAi back-up time measurement was normalized to the eri-1 value. Repeated measurements on the same RNAi strains were averaged across at least two days. One-way ANOVA and Tukey’s post-hoc test were performed. ***E, p<0.001; **E, p<0.01; *E, p<0.05; NS, not significant compared with an eri-1 buffer. Exact values and additional pairwise comparisons are included in Figure 4—source data 1 and Figure 4—source data 2.
Figure 4—figure supplement 2

C. elegans srb-6 has homologs within the Caenhorabditis genus and the nematode phylum.
srb-6 is highlighted in red. Note that srb-6’s closest homologs (highlighted in dark green) are within the Caenhorabditis genus, and a larger monophyletic group contains nematode species outside the Caenhorabditis genus (highlighted in light green). The dataset includes 100 protein sequences retrieved by BLAST with E-value <0.0001.
Additional files
-
Transparent reporting form
- https://doi.org/10.7554/eLife.23770.018
Download links
A two-part list of links to download the article, or parts of the article, in various formats.
Downloads (link to download the article as PDF)
Open citations (links to open the citations from this article in various online reference manager services)
Cite this article (links to download the citations from this article in formats compatible with various reference manager tools)
C. elegans avoids toxin-producing Streptomyces using a seven transmembrane domain chemosensory receptor
eLife 6:e23770.
https://doi.org/10.7554/eLife.23770


