Human biallelic MFN2 mutations induce mitochondrial dysfunction, upper body adipose hyperplasia, and suppression of leptin expression
- Wellcome Trust-MRC Institute of Metabolic Science, United Kingdom
- The National Institute for Health Research Cambridge Biomedical Research Centre, United Kingdom
- National Institutes of Health, United States
- Experimental and Forensic Medicine, University of Pavia, Italy
- University of Birmingham, United Kingdom
- Birmingham Women’s Hospital, Edgbaston, United Kingdom
- Aarhus University Hospital, Denmark
- New Medicines, UCB Pharma, United Kingdom
- Wellcome Trust Sanger Institute, United Kingdom
- University of Cambridge School of Clinical Medicine, Cambridge Biomedical Campus, United Kingdom
- Cambridge University Hospitals NHS Foundation Trust, Cambridge Biomedical Campus, United Kingdom
- University of Copenhagen, Denmark
- National Hospital for Neurology and Neurosurgery, UCL Institute of Neurology, United Kingdom
- University of Maryland School of Medicine, United States
- Brehm Center for Diabetes, United States
- University of Cambridge School of Clinical Medicine, United Kingdom
- Aarhus University Hospital and Clinical Medicine, Aarhus University, Denmark
Figures
Figure 1 with 3 supplements
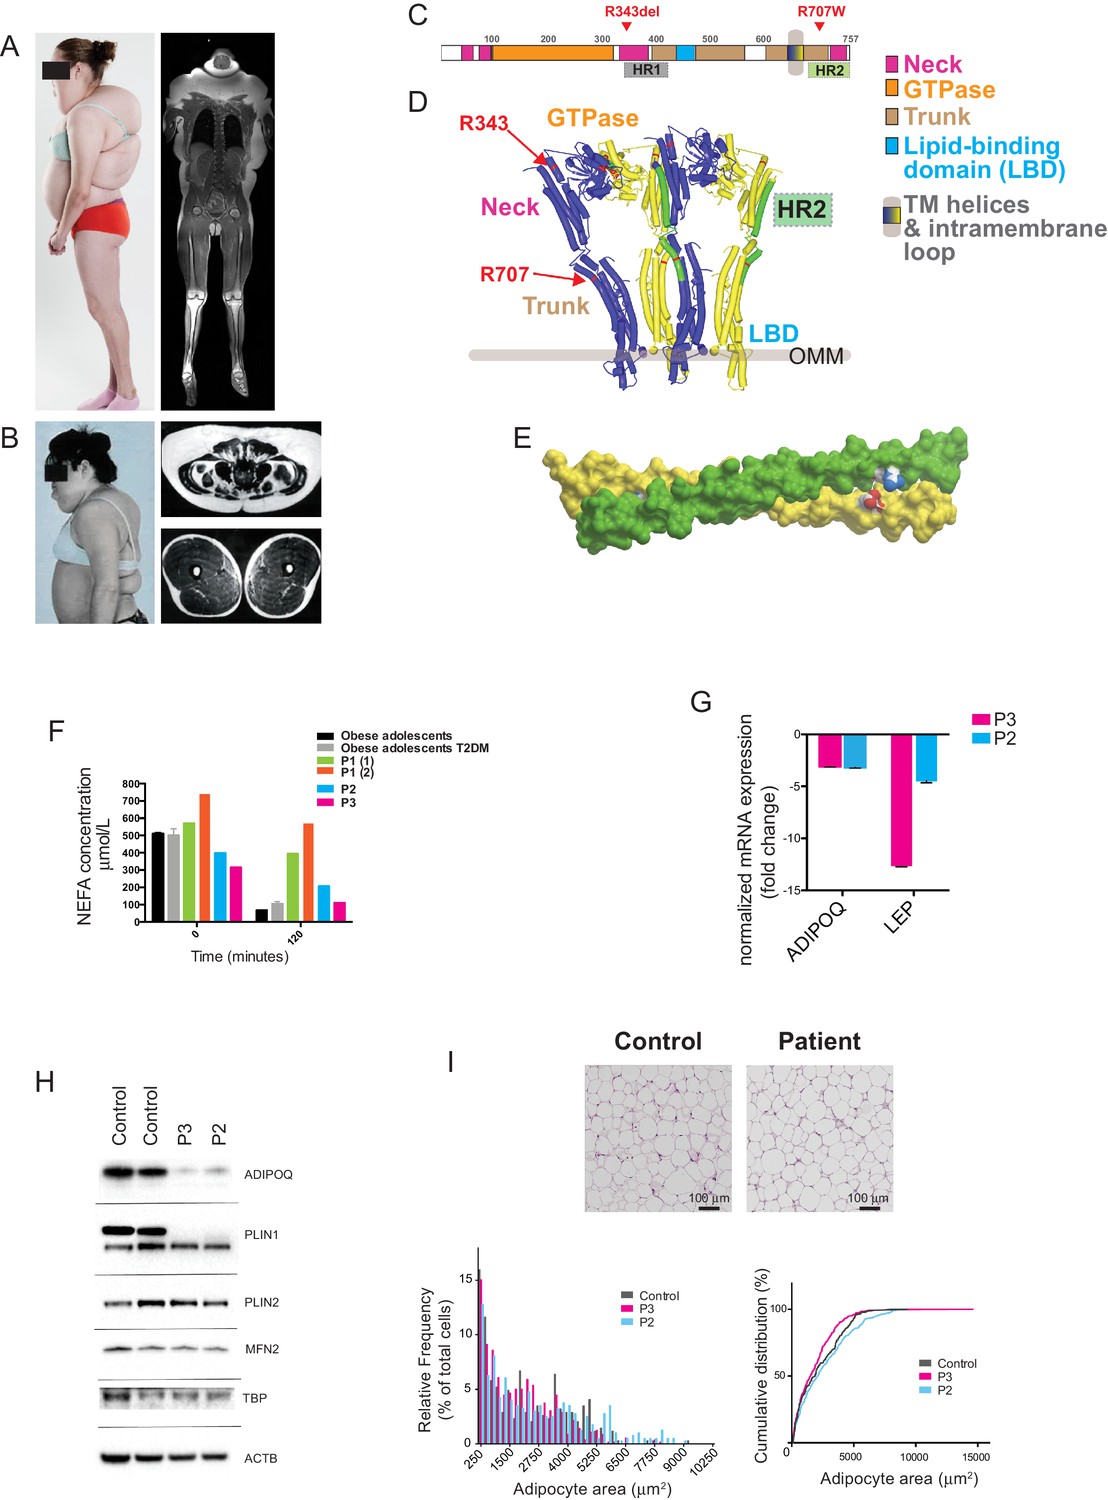
Multiple symmetrical lipomatosis associated with biallelic mutations in MFN2.
(A) Profile of P1, showing upper body adipose overgrowth and loss of adipose tissue and muscle from legs (left) and T1-weighted coronal MRI image of P1, highlighting excess upper body fat (right). (B) Profile of P4, showing upper body adipose overgrowth (left) and T1-weighted MRI images highlighting excess lower abdominal adipose tissue and a paucity of adipose tissue at the mid femoral region. (C) Linear depiction of human MFN2, highlighting regions contributing to key structural domains. (D) Structure of a GTP-bound, extended tetramer (dimer of dimers) of Bacterial Dynamin-Like Protein (BDLP) as a model of human MFN2. Monomers are distinguished in yellow and blue and HR2 domain in green. The MFN2 mutations are shown in red. (E) Homology model of antiparallel homodimer of HR2 domains rendered in surface presentation with the individual monomers coloured in yellow and green and the charged atoms of residues R707 and D742 in blue and red. (F) Plasma non-esterified fatty acid (NEFA) concentrations in P1 (at age 18 (1) and 20 (2) years), P2 and P3 before and after a 75g oral glucose load. Data from 770 obese adolescents and 22 obese adolescents with type 2 diabetes (Hershkop et al., 2016) are shown as controls. (G) Quantitative real-time PCR of interscapular adipose biopsies from P2 and P3, expressed as fold change from five female controls. (H) Immunoblots from patient and control adipose lysates for adiponectin (ADIPOQ), perilipin 1 (PLIN1), perilipin 2 (PLIN2), and mitofusin 2 (MFN2). TATA-binding protein (TBP) and β-actin (ACTB) were used as loading controls. (I) Assessment of adipocyte size in interscapular adipose tissue. Representative haematoxylin and eosin-stained interscapular adipose tissues from a patient and a control are shown on top. Scale bars = 100 µm. The bottom left chart shows adipocyte size distribution analysis with bars indicating percentages of cells in the specified area range. The chart on the right shows cumulative frequencies. ≥500 adipocytes analyzed per biopsy.
Figure 1—figure supplement 1
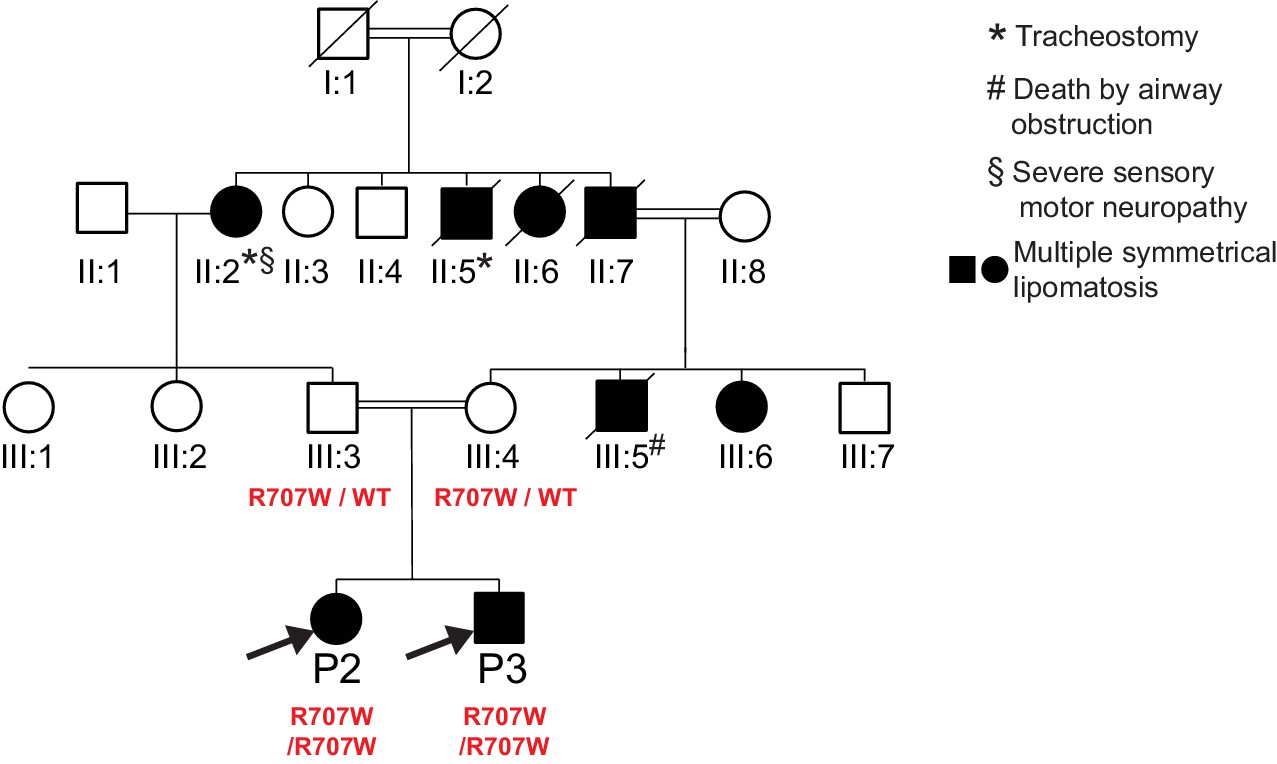
Pedigree diagram for P2, P3.
Only P2, P3 and their parents were clinically assessed and genotyped as part of this study. MFN2 genotypes are indicated in red. Phenotypes of non-genotyped relatives were determined from family reports, with supporting photographs.
Figure 1—figure supplement 2
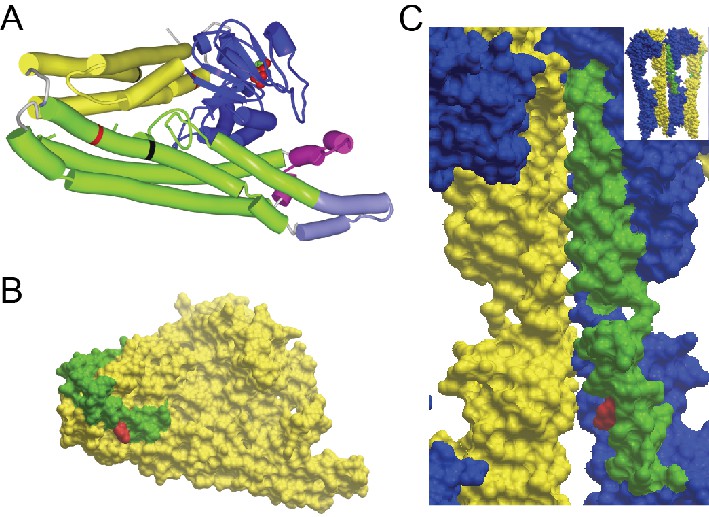
GTP/GDP-dependent conformations of MFN2 modelled on homology to Bacterial Dynamin-Like Protein.
R343 and R707 are indicated in red. (A) Global view of MFN2 in the GDP-bound, lipid-free, folded conformation. Colours: blue - GTPase domain; yellow - ‘neck’; green - ‘stalk’; magenta - lipid binding domain; light purple - membrane anchor, black lines - boundaries of heptad repeat 2 (HR2). (B) Surface presentation of the view in the previous Figure A. HR2 is distinguished in green. Note that the side chain of R707 does not participate in the interface packing in contrast to the GTPase-independent conformation where it stabilises the cis-dimer (Figure 1E). (C) Surface presentation of the position of HR2 in the GTP-bound, extended tetramer at the interface of dimer of dimers (global view in the inset and in Figure 1D). Monomers are distinguished in yellow and blue and HR2 in green.
Figure 1—figure supplement 3
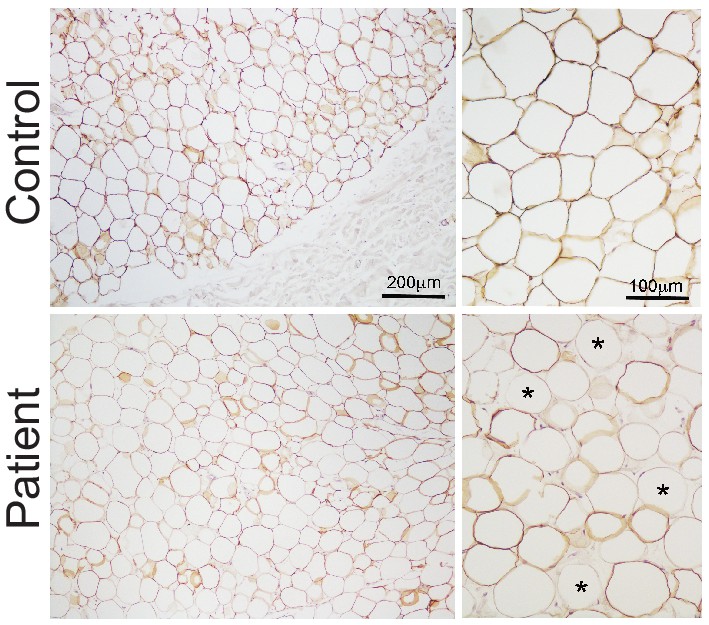
Expression of perilipin in affected adipose tissue.
Perilipin immunostaining in paraffin-embedded adipose tissue sections. Control adipose tissue is shown on the top row and representative patient adipose tissue on the bottom. Low magnification images are shown on the left and high magnification images on the right. All control adipocytes showed perilipin 1 immunopositivity, however staining was heterogeneous in patient adipose tissue, with many adipocytes showing no staining (some indicated by asterisks).
Figure 2
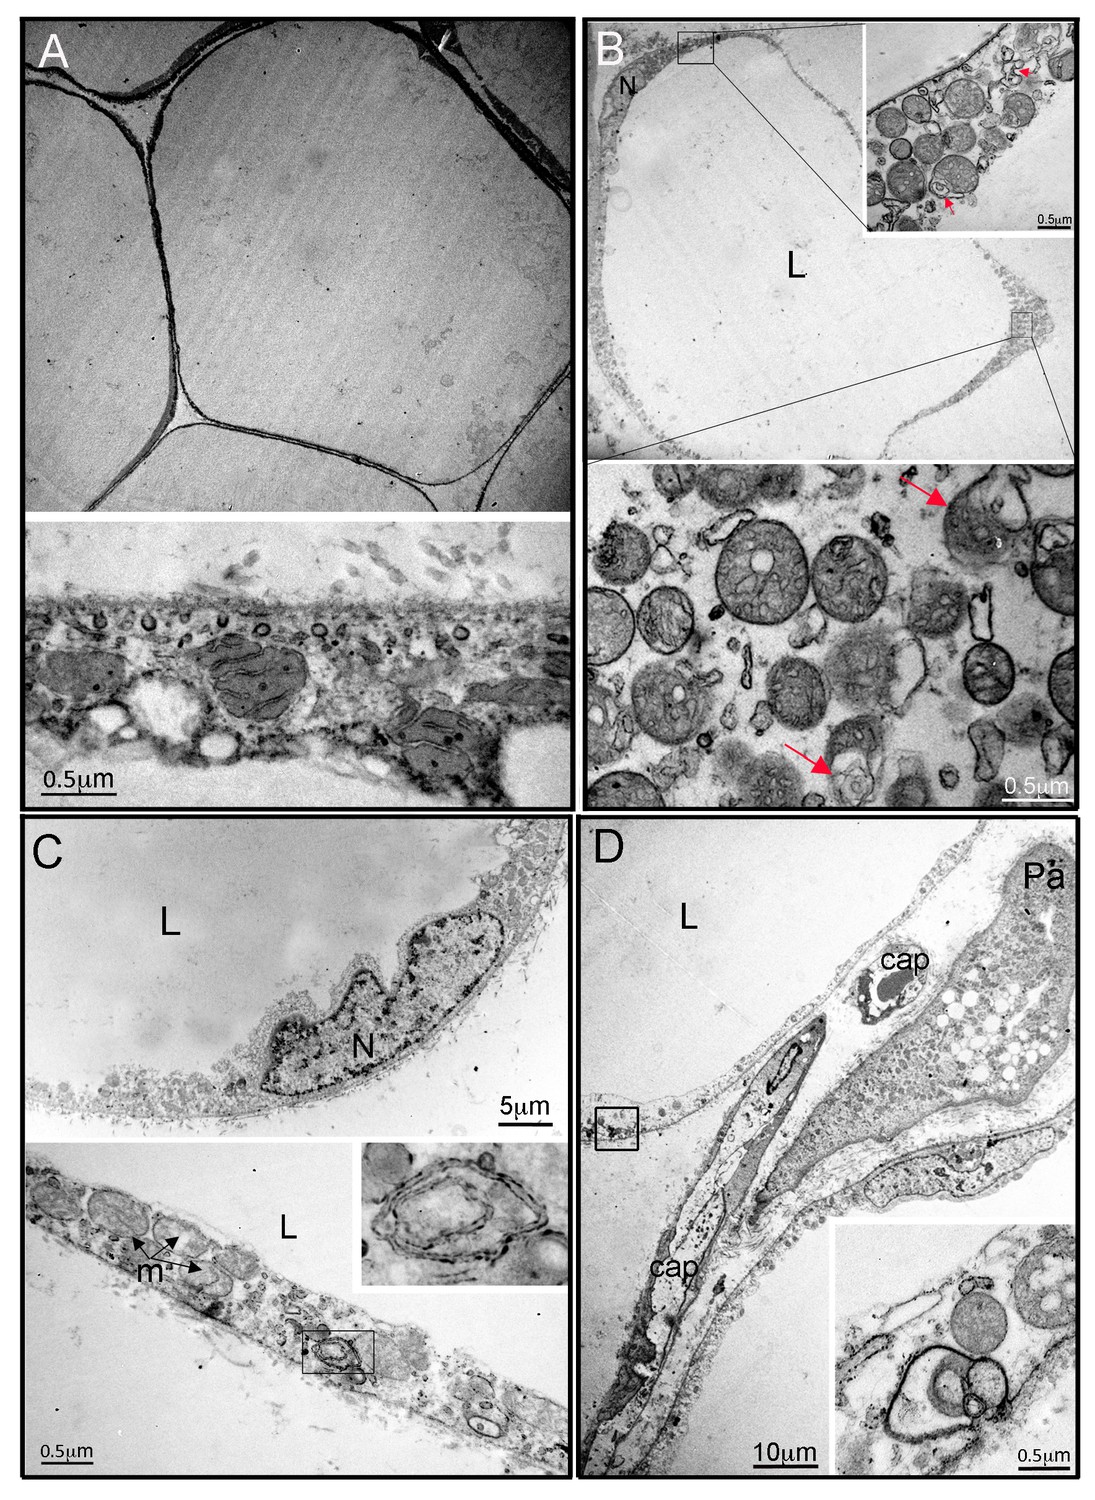
Ultrastructural appearances of interscapular subcutaneous adipose tissue in individuals with the homozygous MFN2 p.Arg707Trp mutation.
(A) Transmission electron micrograph (TEM) of interscapular subcutaneous adipose tissue obtained from a control volunteer, showing a thin cytoplasmic rim, and, in the panel below, ovoid mitochondria with thin cristae. (B) TEM of interscapular subcutaneous adipose tissue obtained from P2, showing a thickened cytoplasmic rim containing increased numbers of round, enlarged mitochondria. Lower panel and inset: Mitochondria showed evidence of degeneration with disorganised cristae and complex inclusions (pointed by red arrows); L= lipid droplet. (C) TEM of affected adipose tissue showing mitochondria at different degree of degeneration (m) and double membrane-bound structures suggestive of mitophagy (inset in lower panel shows a concentric double membrane). N: adipocyte nucleus. (D) TEM of juxtacapillary cell representative of several pre-adipocytes (Pa) identified in P2 and P3 but in no controls. Early lipid accumulation and glycogen granules can be seen. In the inset, another image suggestive for active mitophagy is seen in the adjacent adipocyte.
Figure 3 with 1 supplement
Gene expression profiling of hyperplastic adipose tissue.
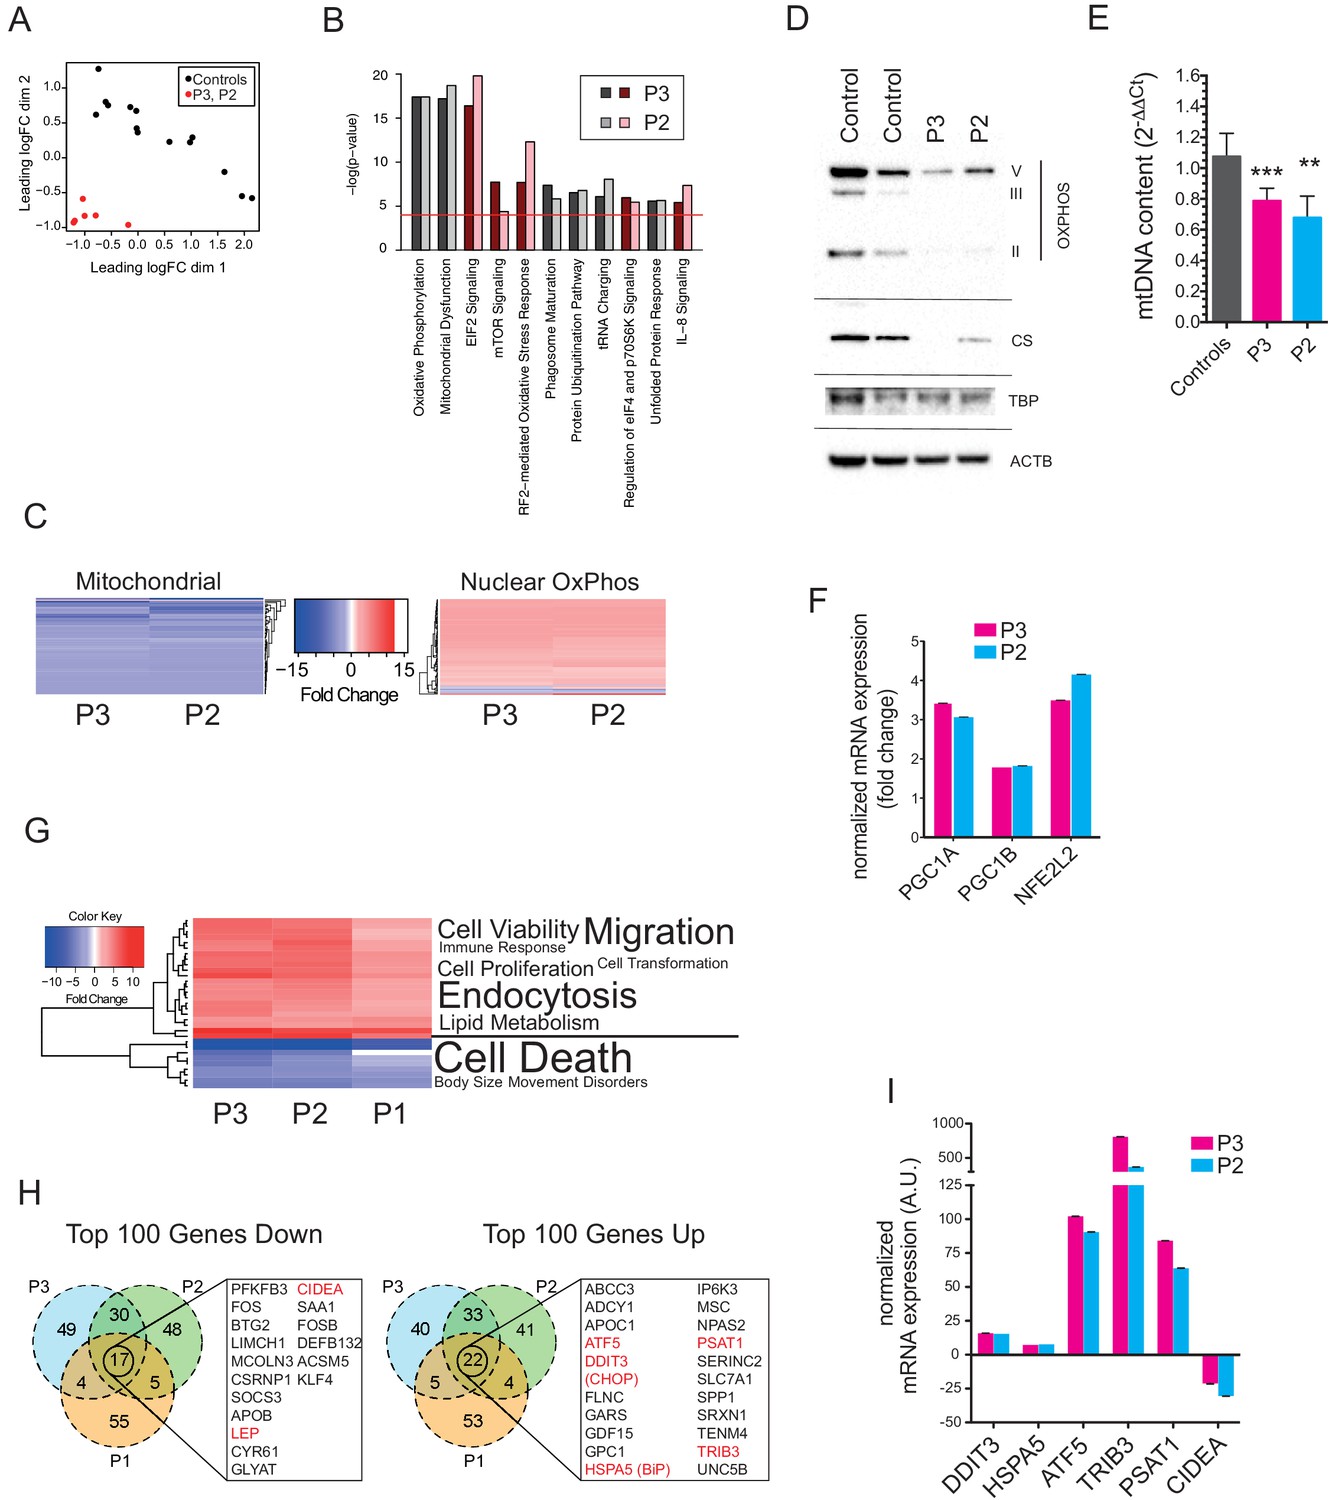
(A) Multidimensional Scaling Plot showing distinct patterns of gene expression of interscapular tissue samples from P2 and P3, compared to five age-matched controls. Three separate tissue samples from each of the patients and two to three separate tissue samples from the controls were used in the analysis. (B) Bar chart showing the 10 most significantly altered pathways identified by Ingenuity Pathway Analysis (IPA). Canonical pathways are shown in red to indicate increased expression; non-canonical pathways, to which no directionality was assigned, are shown in grey. The red line represents the p-value cut-off of <0.0001. (C) Heat maps showing decreased expression of genes in the mitochondrial genome and increased expression of nuclear-encoded oxidative phosphorylation (OxPhos) genes in P2 and P3. (D) Immunoblots of control and patient adipose tissue for OXPHOS subunits ATP synthase subunit alpha (V), Complex III subunit Core 2 (III), Complex II subunit 30 kDa (II), and the mitochondrial marker citrate synthase (CS). TATA-binding protein (TBP) and β-actin (ACTB) levels were used as loading controls (as also shown in Figure 1H). (E) Reduced levels of mtDNA in affected adipose tissue determined by Taqman real-time PCR. Means of three independent experiments ± SEM are shown. (**p<0.01). (F) Increased expression of PGC1A, PGC1B, and NEF2L2 assessed by real-time qPCR and expressed as fold change in expression relative to five controls. Shown are means of 3 replicates. Error bars represent SEM. (G) Heat map showing the top 32 ‘disease and biology’ pathways from IPA. A word/tag weighted cloud of component pathways is shown. (H) Venn Diagrams comparing the top 100 genes up and down with an FDR cut-off of <0.00001 among patients. Genes shared between all three patients’ samples are shown in expanded lists with genes noted in the text highlighted in red. (I) Transcript levels of DDIT3, HSPA5, ATF5, TRIB3, PSAT1, and CIDEA in P3 and P2, expressed as fold change relative to controls determined by Taqman quantitative real-time PCR. Shown are means of eight replicates of different dilutions with error bars calculated from R-squared values of fitted line.
-
Figure 3—source data 1
Differential expression analysis data.
- https://doi.org/10.7554/eLife.23813.012
-
Figure 3—source data 2
Ingenuity Pathway Analysis results for P1.
- https://doi.org/10.7554/eLife.23813.013
-
Figure 3—source data 3
Ingenuity Pathway Analysis results for P2.
- https://doi.org/10.7554/eLife.23813.014
-
Figure 3—source data 4
Ingenuity Pathway Analysis results for P3.
- https://doi.org/10.7554/eLife.23813.015
-
Figure 3—source data 5
Data used to generate the heat maps shown in Figure 3C.
- https://doi.org/10.7554/eLife.23813.016
-
Figure 3—source data 6
Ingenuity Pathway Analysis ‘Disease and Biology’ data used to generate the heat map shown in Figure 3G.
- https://doi.org/10.7554/eLife.23813.017
Figure 3—figure supplement 1
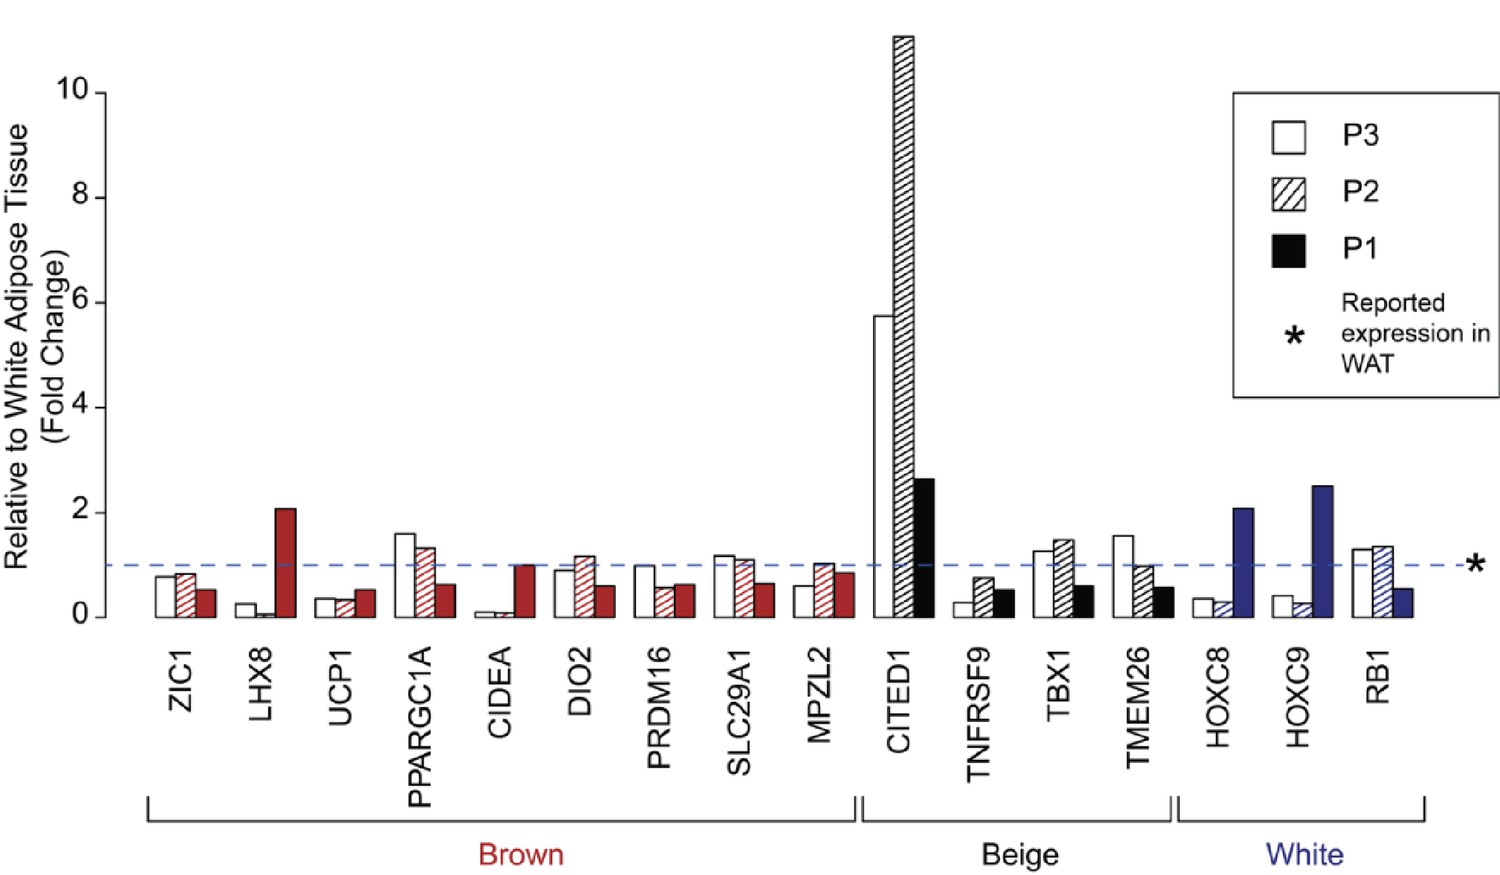
Expression of human brown, ‘beige’, and white adipocyte markers in affected adipose tissue.
Expression of previously suggested markers of human adipocyte subclasses in adipose tissue from P1, P2, and P3. Results are represented as fold changes from control adipose tissue from the matched volunteers described. Data for P2 and P3 were derived from RNAseq analysis, and for P1 from microarray analysis.
Figure 4 with 3 supplements
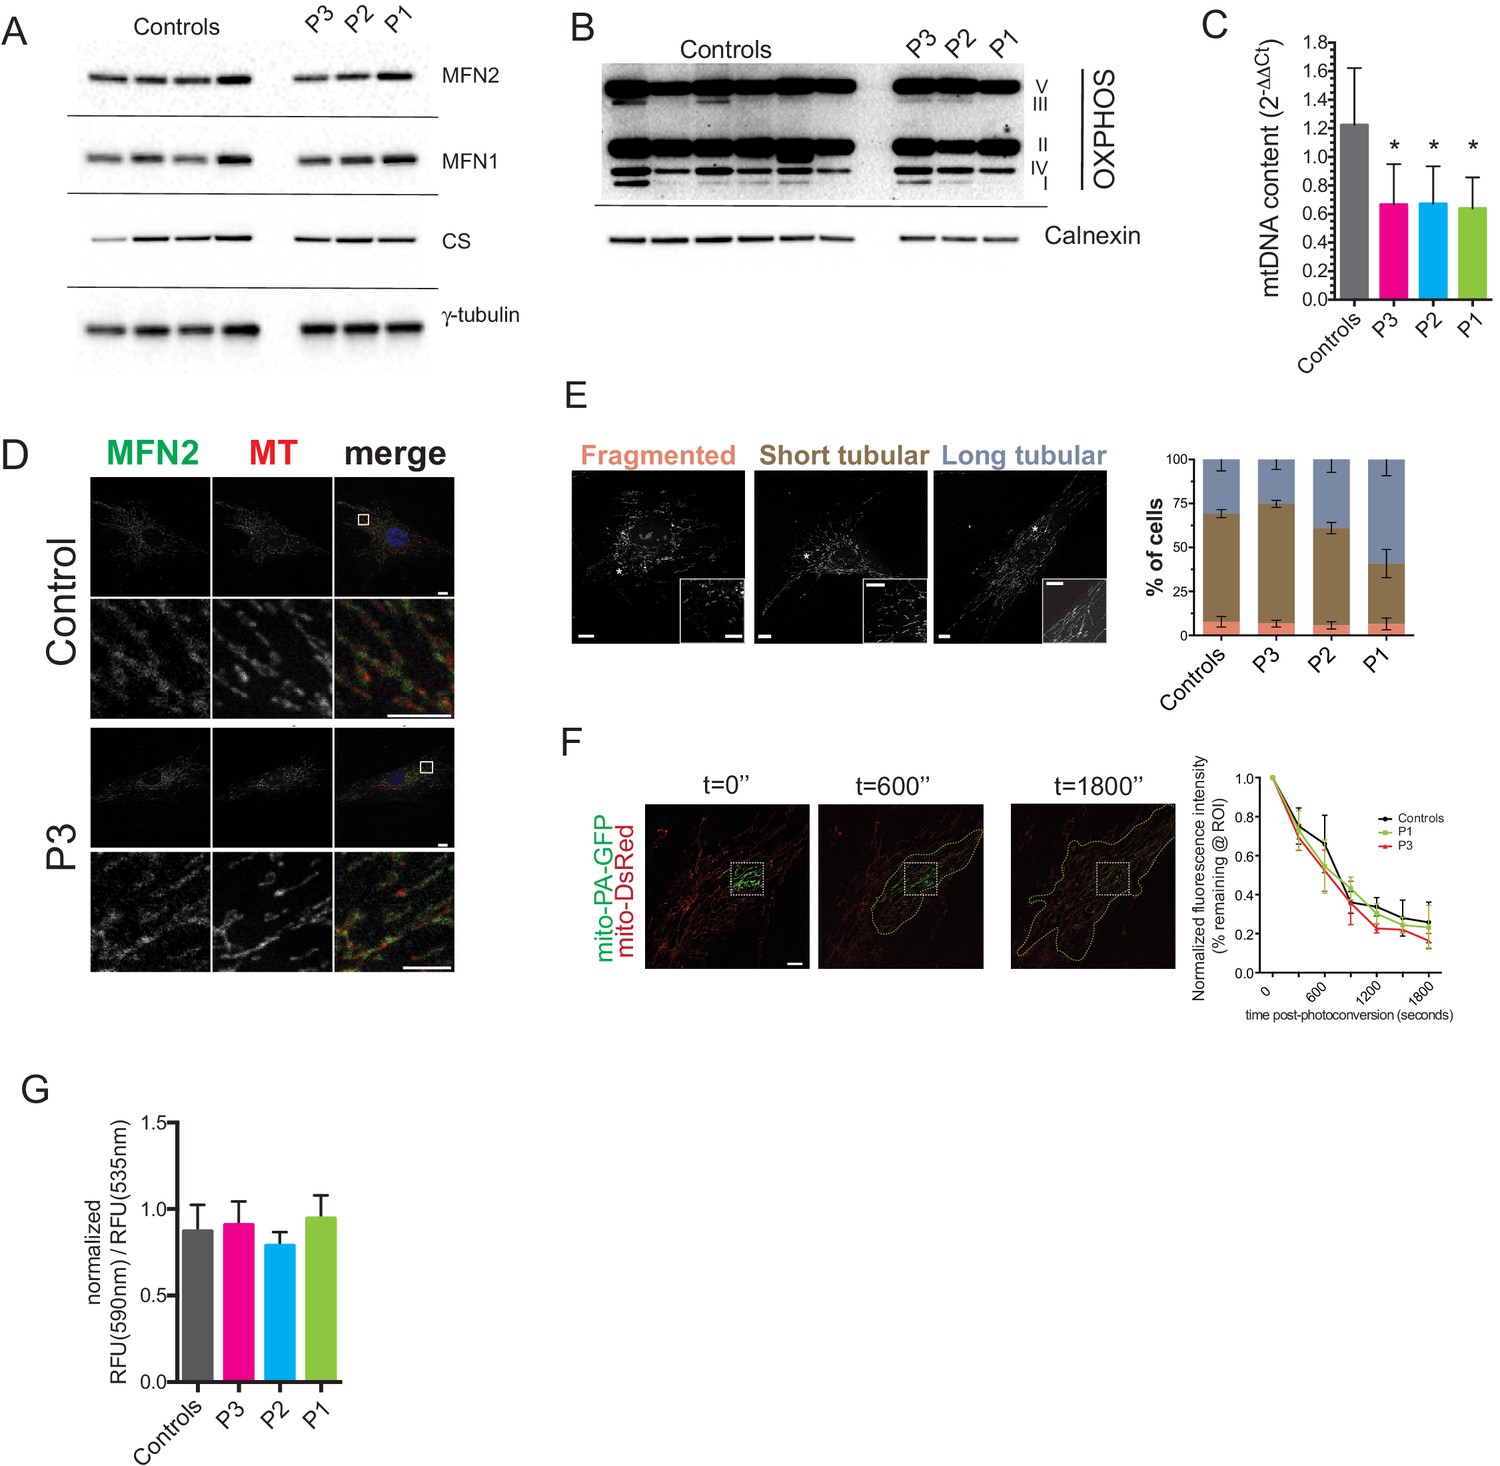
Preserved mitochondrial network in dermal fibroblasts from patients with MFN2-related MSL.
(A) Immunoblots of dermal fibroblast lysates for mitofusin 2 (MFN2), mitofusin 1 (MFN1), and the mitochondrial marker citrate synthase (CS). γ-tubulin was used as loading control. (B) Immublotting of OXPHOS subunits using an optimized pre-mixed cocktail of monoclonal antibodies specific to Complex I subunit NDUF88 (CI), Complex II subunit 30 kDa (CII), Complex III subunit Core 2 (CIII), Complex IV subunit (IV), and ATP synthase subunit alpha (CV). (C) Reduced levels of mtDNA in patient dermal fibroblasts determined by Taqman real-time PCR. Means of three independent experiments ± SEM are shown. (*p<0.05). (D) Immunofluorescence confocal microscopy of endogenous MFN2 in fixed control and patient dermal fibroblasts showing preserved MFN2 expression and localization to mitochondria (See also Figure 4—figure supplement 1). Mitochondria were visualized with MitoTracker Orange (MT). Images in the bottom rows show digitally magnified detail of the boxed areas in the top rows. Scale bars: 10 µm (top rows); 5 µm (bottom rows). (E) Normal mitochondrial morphology in patient dermal fibroblasts demonstrated using the mitochondrial dye MitoTracker Orange. Cells were classified as having mostly fragmented, short tubular, and long tubular mitochondria as indicated in the representative confocal microscopy images shown. Asterisks indicate regions digitally magnified to show mitochondrial morphology in detail (insets). Scale bars, 10 µm. Data from four independent experiments (>50 cells per experiment) are presented as means ± SD. (F) Visualization and quantification of mitochondrial fusion using photoactivatable mitochondria matrix-targeted GFP (mito-PA-GFP): a dermal fibroblast from P1 expressing both mito-PA-GFP and mito-DsRed is shown to illustrate the in vivo mitochondria fusion assay. Photoconversion of PA-GFP was restricted to the area marked by the white dashed box. The activated mito-PA-GFP molecules, in time, redistributed along the area within the green dashed lines. The percentage of fluorescence remaining in the boxed region was measured, normalized to mito-DsRed signal, and plotted against time. Data are represented as means ± SD of single cell time-lapse measurements (10 randomly selected cells expressing both mito-DsRed and mito-PA-GFP per cell line were imaged). Scale bar, 10 µm. (G) Quantification of mitochondrial membrane potential (△Ψ) using the fluorescent sensor JC-1. Data show ratio of 590 nm (red) and 535 nm (green) fluorescence signals. Data from three independent experiments are represented as mean ± SD.
Figure 4—figure supplement 1

Mitochondrial network morphology and mitofusin 2 expression in dermal fibroblasts from P1 and P2.
Representative immunofluorescence microscopy images of endogenous MFN2 in fixed dermal fibroblasts from P1 and P2. Mitochondria were visualized with MitoTracker Orange (MT). Representative micrographs from Control and P3 dermal fibroblasts are shown in Figure 4D.
Figure 4—figure supplement 2
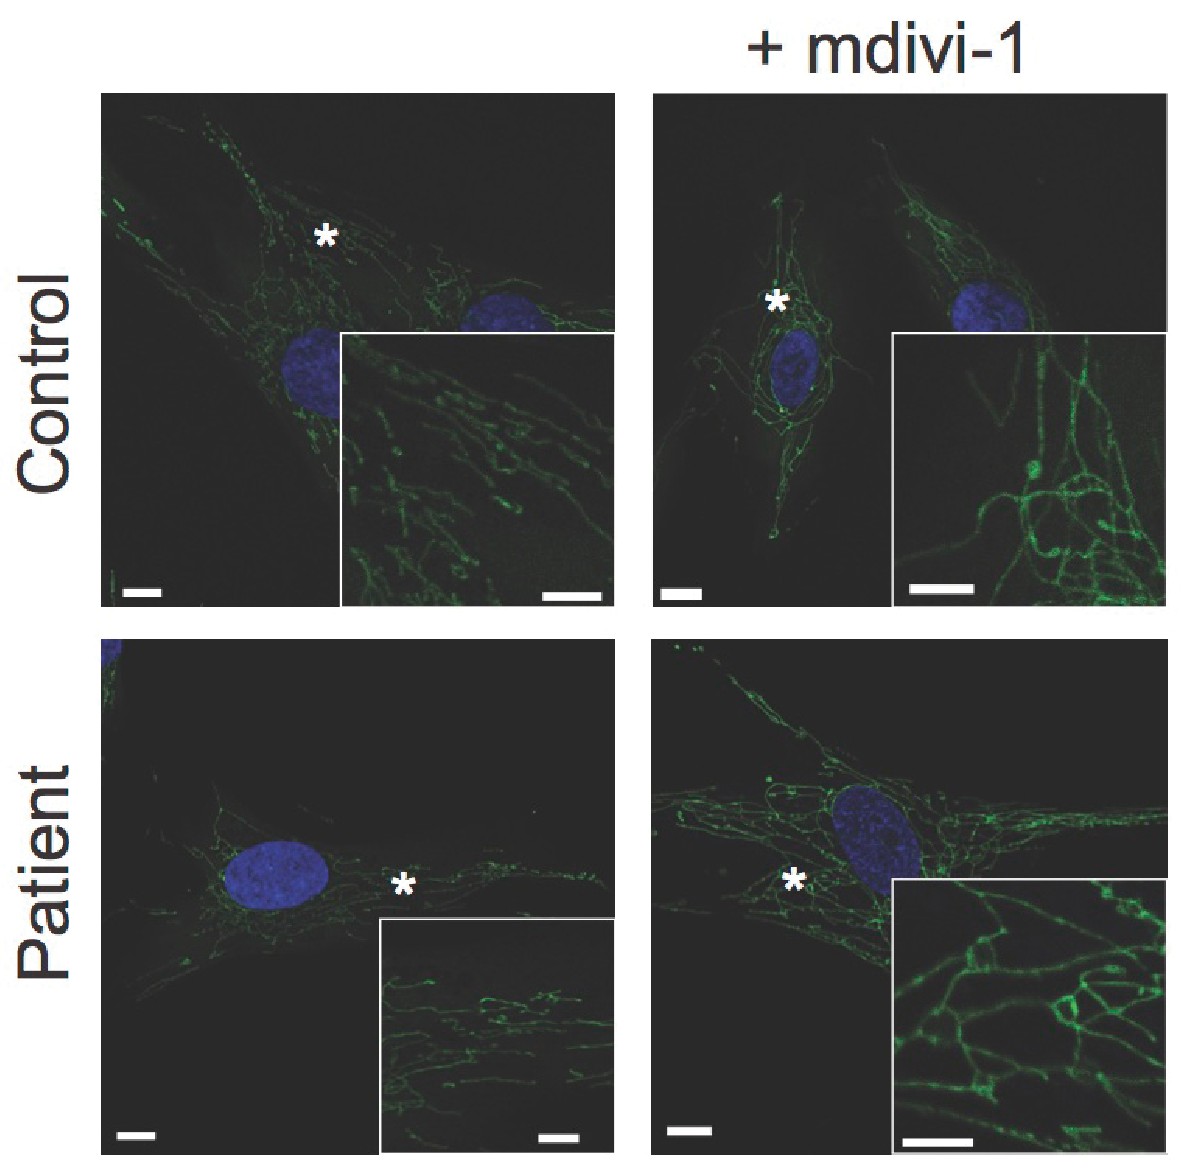
Response of dermal fibroblasts to mitochondrial fission inhibitor mdivi-1.
Representative confocal microscopy images of fixed dermal fibroblasts. MitoTracker Orange-labelled mitochondria are shown in green. DAPI-stained nuclei are shown in blue. Asterisks indicate regions digitally magnified and shown in insets. Scale bars: 10 µm (5 µm in insets).
Figure 4—figure supplement 3
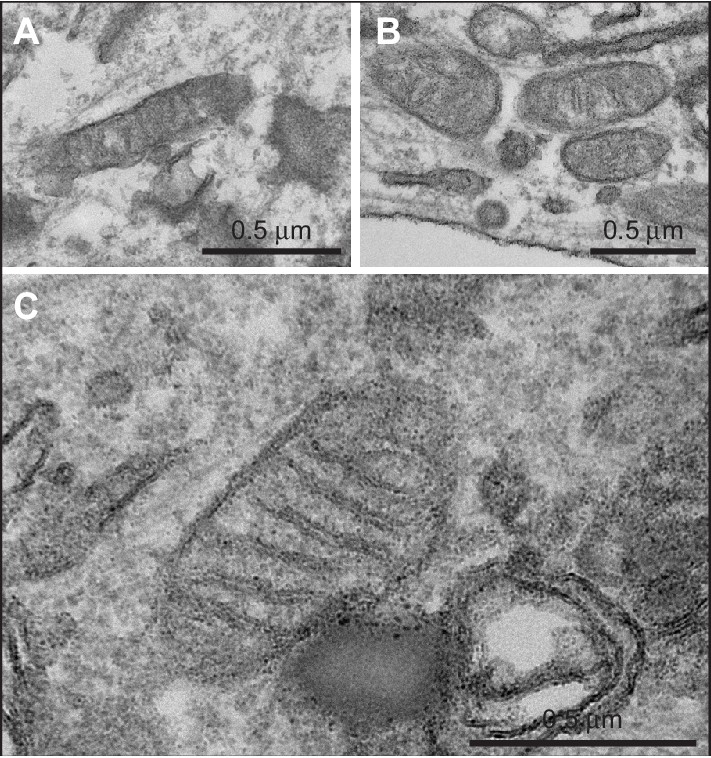
Transmission electron micrographs of dermal fibroblasts obtained from A. a control volunteer, B. P3, and C. P1, showing normal mitochondrial morphology in all cases.
https://doi.org/10.7554/eLife.23813.022
Author response image 1
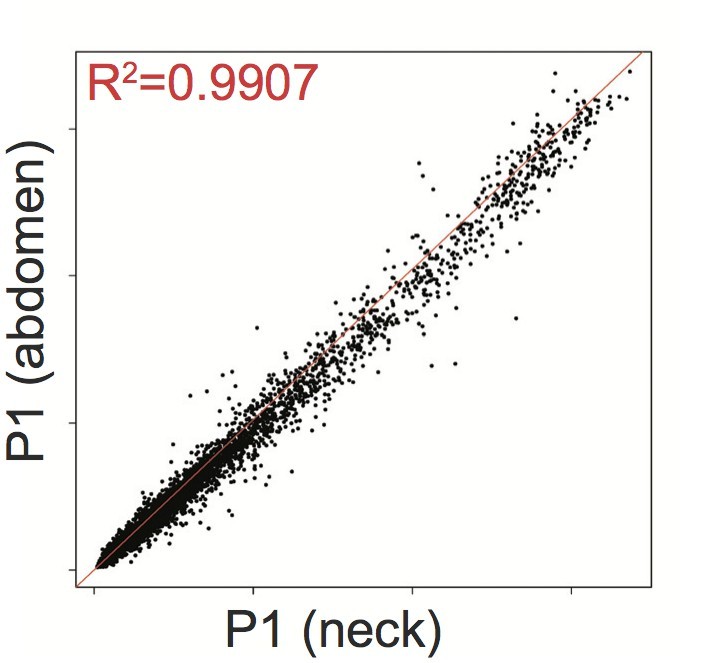
Affymetrix Array-determined gene expression in subcutaneous abdominal adipose biopsy (Y axis) compared to adipose tissue derived from the neck (X axis) of P1.
https://doi.org/10.7554/eLife.23813.024Tables
Table 1
Biochemical profiles of probands P1-4. MRS = Magnetic Resonance Spectroscopy; USS = Ultrasound scanning.
| P1 | P2 | P3 | P4 | Reference range | |
|---|---|---|---|---|---|
| Age at time of assessment - years | 18 | 17.8 | 16.7 | 17 | |
| Age at first presentation - years | c.5 | c.12 | c.13 | c.13 | |
| Height – m | 1.63 | 1.58 | 1.62 | 1.63 | |
| Weight – kg | 88.4 | 61.6 | 53.6 | 72 | |
| BMI - kg/m2 | 33.0 | 24.7 | 20.4 | 27.0 | |
| Liver fat | 26% by MRS (normal < 5.5) | -- | -- | increased (USS and biopsy) | |
| Triglyceride - mmol/L | 7.1 | 1.0 | 0.9 | 7.7 | <1.7 |
| HDL-Cholesterol - mmol/L | 0.9 | 1.4 | 0.9 | 0.6 | >1.0 |
| Total-Cholesterol - mmol/L | 5.8 | 4.5 | 4.2 | 4.0 | <5.2 |
| Insulin - pmol/L | 89 | 96 | 152 | 264 | <60 |
| Glucose - mmol/L | 4.5 | 4.6 | 5.2 | 4.5 | <6.1 |
| Glycated haemoglobin -mmol/mol | 27 | 30 | 32 | 35 | <53 |
| Leptin - µg/L | 0.6 (14.9–60.2) | 2.4 (2.4–24.4) | 2.2 (0.4–8.3) | <0.6 (8.6–38.9) | * |
| Adiponectin - mg/L | 0.7 (2.6–14.9) | 0.8 (4.4–17.7) | 1.4 (2.6–12.6) | 2.0 (5.0–28.8) | * |
| Lactate – mmol/L | 7.3 | -- | -- | 4.8 | |
| LH – U/L | 2.0 | 10.1 | 5.3 | 3.0 | 1.3-8.4‡ |
| FSH – U/L | 3.4 | 8.0 | 5.0 | 1.0 | 2.9-8.4‡ |
| Estradiol – pmol/L | 105 | 107 | -- | 35 ng/dl | 72-529‡ |
| Testosterone – nmol/L | -- | -- | 7.6 | 93 ng/dl | 9-22† |
-
*Sex, BMI and assay-specific reference ranges are indicated in brackets for each patient.
-
†Adult male range.
-
‡Follicular phase.
Table 2
Genotypes and phenotypes of all patients identified with biallelic MFN2 mutations including p.Arg707Trp; MSL = Multiple Symmetrical Lipomatosis.
| ID | Age, years | Sex | MFN2 genotype | Phenotype(s) (age of onset, years) | Comment | Reference |
|---|---|---|---|---|---|---|
| P1 | 18 | F | p.Arg707Trp R343del | MSL (<10) Axonal neuropathy (<10) | ↑↑ lactate ↓↓ leptin ↓↓ adiponectin | This study |
| P2 | 17 | F | p.Arg707Trp p.Arg707Trp | MSL (c.13) No neuropathy (17) | ↓ adiponectin | This study |
| P3 | 16 | M | p.Arg707Trp p.Arg707Trp | MSL (c.13) No neuropathy (16) | ↓ adiponectin | This study |
| P4 | 37 | F | p.Arg707Trp p.Arg707Trp | MSL (c.13) Likely neuropathy* Renal tubular dysfunction† (c.13) | ↑↑ lactate ↓↓ leptin ↓↓ adiponectin | This study |
| Sawyer et al Patient 1 | 61 | M | p.Arg707Trp p.Arg707Trp | MSL (20 s) Axonal neuropathy (50 s) Diabetes (50 s) | ↑ lactate ↓↓ leptin ↓ adiponectin | (Sawyer et al., 2015) |
| Sawyer et al Patient 2 | 63 | M | p.Arg707Trp p.Arg707Trp | MSL (40 s) Axonal neuropathy (40s) | ↑ lactate | (Nicholson et al., 2008; Sawyer et al., 2015) |
| Sawyer et al Patient 3 | 60 | F | p.Arg707Trp p.Arg707Trp | MSL (20 s) Axonal neuropathy (c.2) | ↑ lactate | (Sawyer et al., 2015) |
| Carr et al Patient 4/II-1 | 44 | M | p.Arg707Trp MFN2 ex7-8del | MSL (not reported) Axonal neuropathy (2) | (Carr et al., 2015) | |
| Calvo et al Patient 6 | 19 | M | p.Arg707Trp p.Gly108Arg | Axonal neuropathy (<10) | (Calvo et al., 2009) | |
| Calvo et al Patient 7 | 24 | F | p.Arg707Trp p.Gly108Arg | Axonal neuropathy (<10) | (Calvo et al., 2009) | |
| Calvo et al Patient 8 | 25 | M | p.Arg707Trp p.Gly108Arg | Axonal neuropathy (<10) | (Calvo et al., 2009) |
-
*Based on clinical signs and symptoms.
-
†increased renal protein, magnesium, potassium and calcium with low serum potassium and magnesium; still apparent at 37 years old.
Table 3
Oral glucose tolerance test results for patients P1, P2 and P3. P1 and P4 were tested on two occasions.
| Time (minutes) | 0 | 30 | 60 | 90 | 120 | |
|---|---|---|---|---|---|---|
| P1 (18 years old) | Glucose (mmol/L) | 4.6 | 6.4 | 6.4 | 4.3 | 4.6 |
| Insulin (pmol/L) | 109 | 1010 | 996 | 249 | 190 | |
| P1 (20 years old) | Glucose (mmol/L) | 6.9 | 9.3 | 9.8 | 9.7 | 9.3 |
| Insulin (pmol/L) | 207 | 630 | 609 | 677 | 708 | |
| Lactate (mmol/L) | 6.8 | 8.3 | 9.6 | 9.9 | 9.9 | |
| P2 (17.8 years old) | Glucose (mmol/L) | 4.6 | 7.1 | 8.9 | 6.0 | 6.2 |
| Insulin (pmol/L) | 96 | 595 | 962 | 478 | 566 | |
| P3 (16.7 years old) | Glucose (mmol/L) | 5.7 | 9.8 | 8.4 | 7.0 | 5.5 |
| Insulin (pmol/L) | 199 | 2048 | 1796 | 1888 | 773 | |
| P4 (17 years old) | Glucose (mmol/L) | 4.5 | 5.8 | 6.9 | 5.8 | 6.3 |
| Insulin (pmol/L) | 264 | 1160 | 2479 | 1361 | 1514 | |
| P4 (37 years old) | Glucose (mmol/L) | 6.6 | -- | -- | -- | -- |
| Insulin (pmol/L) | 688 | -- | -- | -- | -- |
Table 4
Primers and Probes used for mRNA and mtDNA quantification.
| Gene | TaqMan GE assay | Taqman GE primers and probe |
|---|---|---|
| PPARGC1A | Hs01016719_m1 | NA |
| PPARGC1B | Hs00991676_m1 | NA |
| NFE2L | Hs00975961_g1 | NA |
| DDIT3 | Hs00358796_g1 | NA |
| HSPA5 | Hs00607129_gH | NA |
| ATF5 | Hs01119208_m1 | NA |
| LEP | Hs00174877_m1 | NA |
| TRIB3 | Hs01082394_m1 | NA |
| PSAT1 | Hs00795278_mH | NA |
| CIDEA | Hs00154455_m1 | NA |
| ADIPOQ | Hs00605917_m1 | NA |
| TBP | Hs99999910_m1 | NA |
| UBC | Hs01871556_s1 | NA |
| YWHAZ | Hs03044281_g1 | NA |
| ND1 | NA | Forward: 5'-CCCTAAAACCCGCCACATCT-3' Reverse: 5'-GAGCGATGGTGAGAGCTAAGGT-3' Probe: [6FAM]−5'-CCATCACCCTCTACATCACCGCCC-3'-[TAM] |
| B2M | NA | Forward: 5'-CCAGCAGAGAATGGAAAGTCAA-3' Reverse: 5'-TCTCTCTCCATTCTTCAGTAAGTCAACT-3' Probe: [6FAM]−5'- ATGTGTCTGGGTTTCATCCATCCGACA-3’-[TAM] |
Download links
A two-part list of links to download the article, or parts of the article, in various formats.
Downloads (link to download the article as PDF)
Open citations (links to open the citations from this article in various online reference manager services)
Cite this article (links to download the citations from this article in formats compatible with various reference manager tools)
Human biallelic MFN2 mutations induce mitochondrial dysfunction, upper body adipose hyperplasia, and suppression of leptin expression
eLife 6:e23813.
https://doi.org/10.7554/eLife.23813


