Distinct contributions of the thin and thick filaments to length-dependent activation in heart muscle
- King’s College London, United Kingdom
- King's College London, United Kingdom
Figures
Figure 1

Sarcomere length-force relationships in rat cardiac trabeculae.
(a) Passive force (○) and maximum Ca2+-activated force (●) at five sarcomere lengths (n = 6 trabeculae). Force is normalised to maximum force measured at SL 1.9 μm (T/T0). (b) pCa-force relationships at sarcomere lengths 1.9 μm (○) and 2.3 μm (●). The data were summarised from experiments for Figure 2a and b and fit to the Hill Equation (n = 10). Dotted line is the Hill curve at SL 2.3 μm normalised to its maximum force. Increases in SL resulted in increases in maximum Ca2+-activated force and Ca sensitivity (leftward shift of pCa-force curve). Error bars denote SEM.
Figure 2
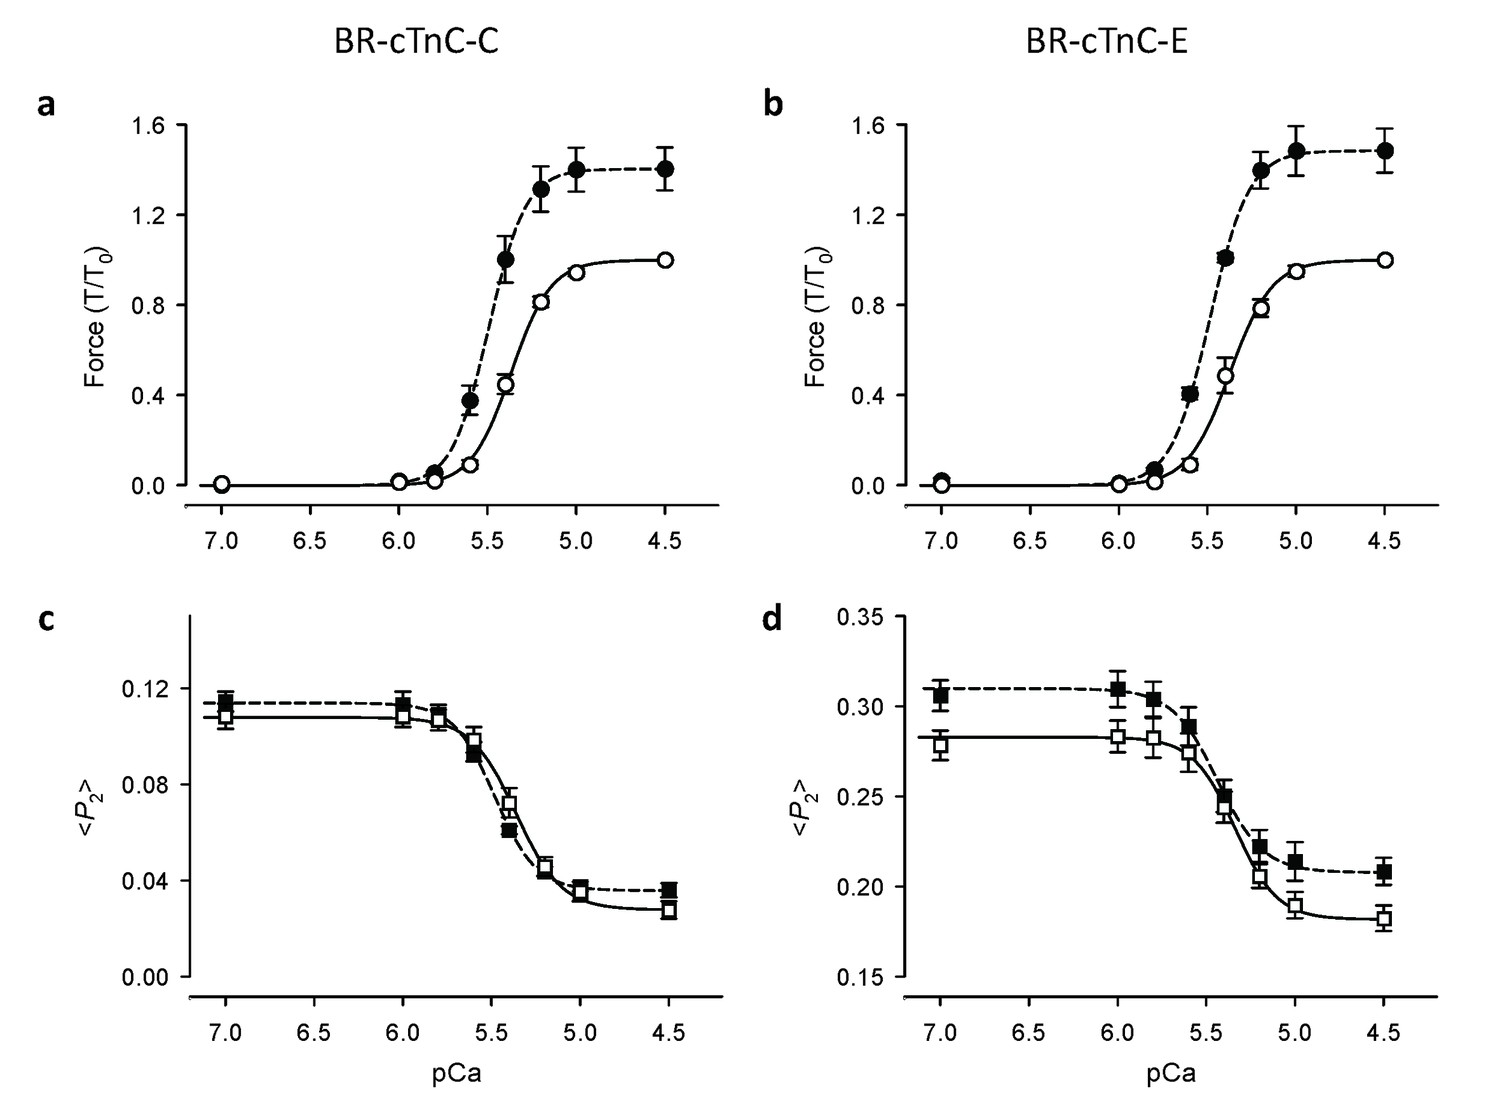
Ca2+-dependence of force and troponin orientation, <P2>, in cardiac trabeculae.
(a, c) BR-cTnC-C; (b, d) BR-cTnC-E. Open symbols, SL 1.9 μm; filled symbols, SL 2.3 μm. Error bars denote SEM.
Figure 3
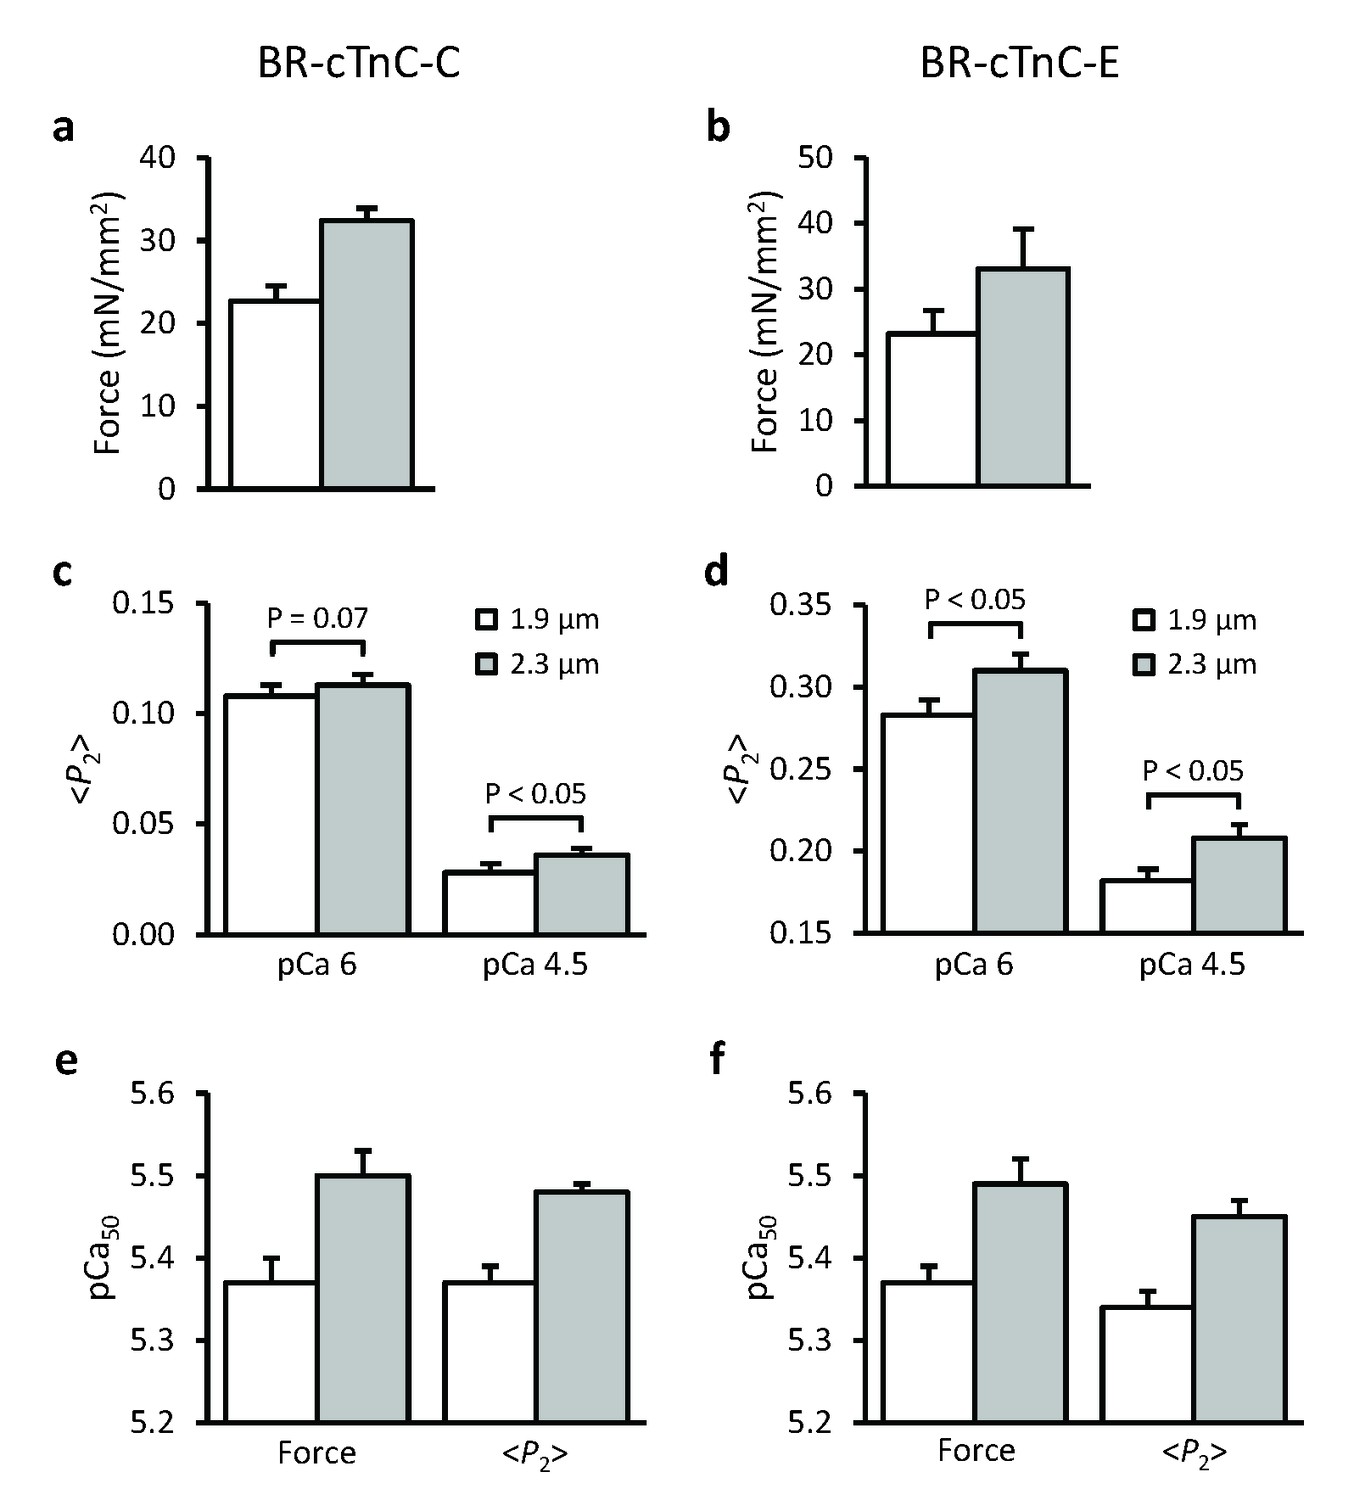
Effects of sarcomere length on maximum Ca2+-activated force, orientation (<P2>) of cTnC-BR probes in solutions with the highest [Ca2+] where trabeculae remained relaxed (pCa 6) and the maximum [Ca2+] (pCa 4.5), and the Hill parameter pCa50.
(a, c, e) BR-cTnC-C; (b, d, f) BR-cTnC-E. Open bars, SL 1.9 μm; grey bars, SL 2.3 μm. Mean ± SEM (n = 5). The statistical significance of differences was assessed using a two-tailed paired t-test.
Figure 4
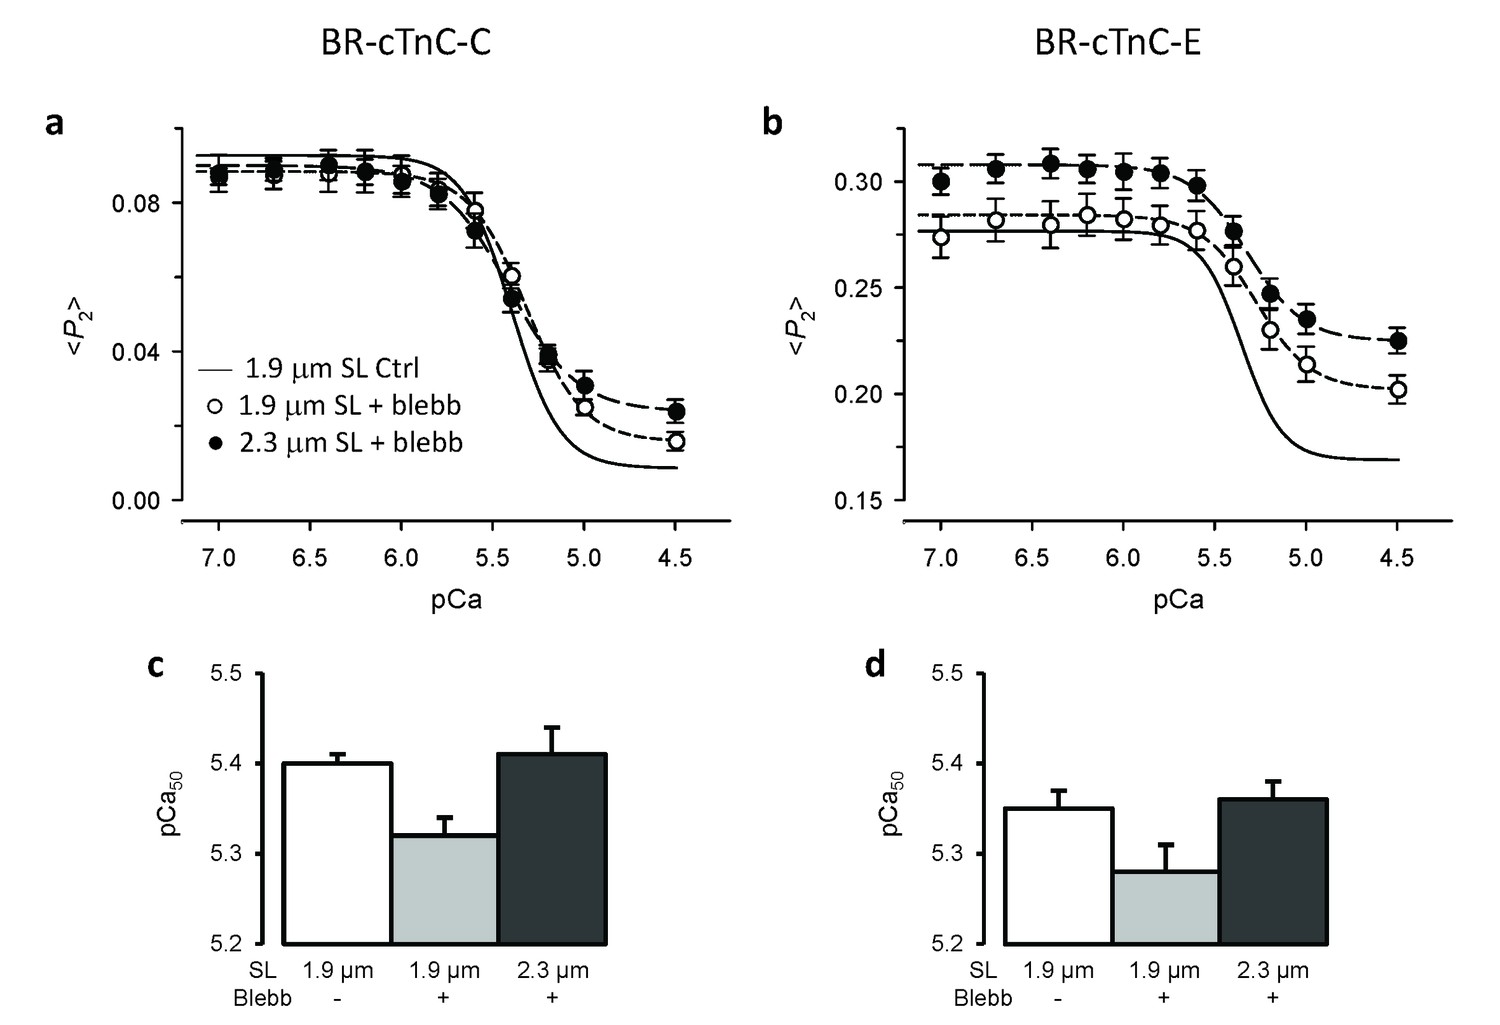
Effects of active force inhibition by 25 μM blebbistatin on the orientation of cTnC probes and their length-dependence.
(a, c) BR-cTnC-C; (b, d) BR-cTnC-E. (a–b) Continuous lines denote Hill fits to data at SL 1.9 μm (data not shown for clarity). Circles denote <P2> in the presence of blebbistatin at SL of 1.9 μm (○) and 2.3 μm (●). (c–d) Fitted Hill parameter, pCa50, for the control at 1.9 μm SL (white) and in the presence of blebbistatin at 1.9 μm SL (gray) and 2.3 μm (black). Mean ± SEM (n = 5–7).
Figure 5
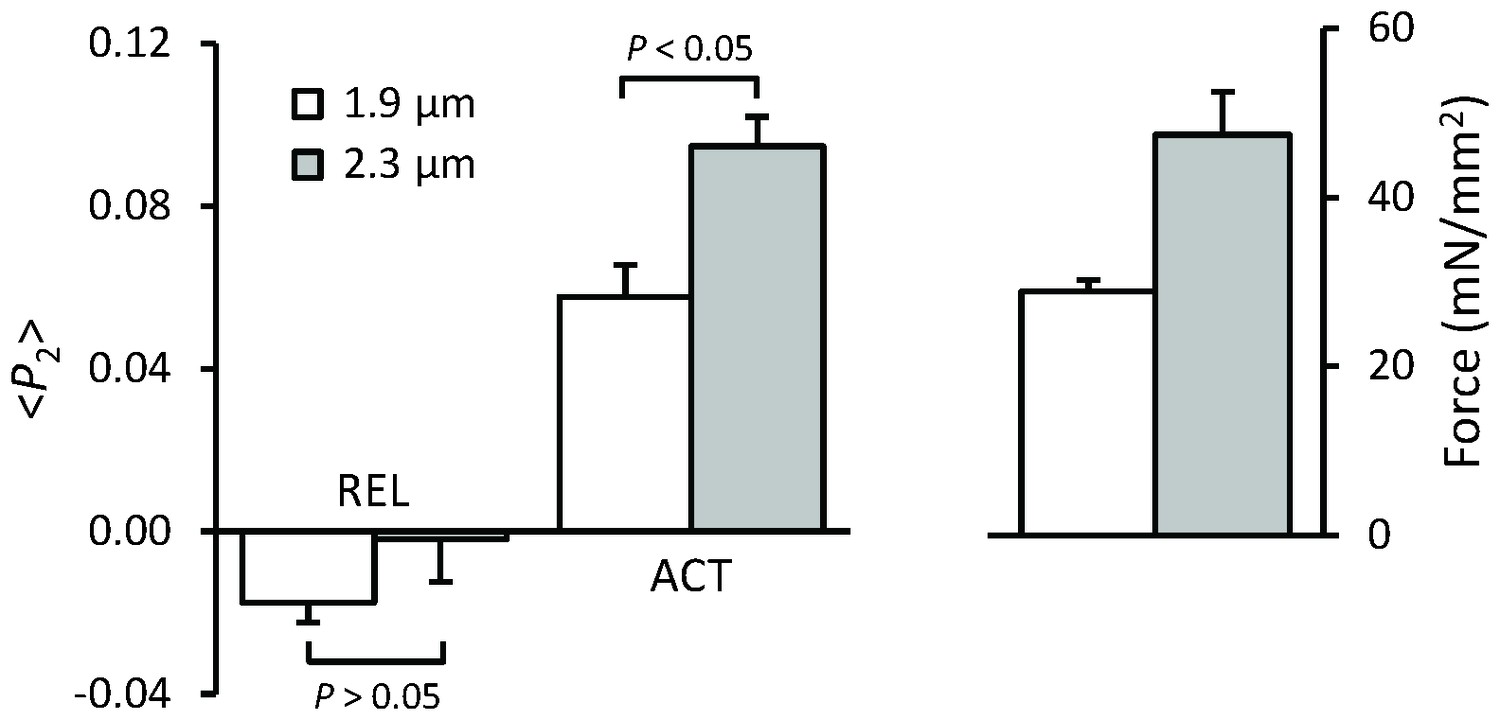
Force and orientation (<P2>) of the BSR-RLC-BC probe in relaxing (pCa 6.6) and activating (pCa 4.5) solution at sarcomere lengths of 1.9 (white) and 2.3 μm (gray).
Mean ± SEM (n = 5). Statistical significance was assessed using a two-tailed paired t-test.
Tables
Table 1
Ca2+-dependence of force and the orientation parameter <P2> and the effects of sarcomere length. Mean ± SEM. pCa50 and nH are fitted parameters of Hill equation. Δ<P2> , changes in <P2> during Ca2+-activation from pCa 6 to 4.5. Comparisons: between sarcomere lengths 1.9 and 2.3 μm (t test, two-tailed; *p<0.05).
| BR-cTnC-C | BR-cTnC-E | |||
|---|---|---|---|---|
| SL (μm) | 1.9 | 2.3 | 1.9 | 2.3 |
| Force | ||||
| (mN/mm2) | 22.7 ± 1.8 | 32.4 ± 1.5* | 23.2 ± 3.5 | 33.1 ± 6.0* |
| pCa50 | 5.37 ± 0.03 | 5.50 ± 0.03* | 5.37 ± 0.02 | 5.49 ± 0.03* |
| nH | 4.03 ± 0.20 | 4.29 ± 0.22* | 4.12 ± 0.24 | 4.33 ± 0.16* |
| <P2> | ||||
| pCa50 | 5.37 ± 0.02 | 5.48 ± 0.01* | 5.34 ± 0.02 | 5.45 ± 0.02* |
| nH | 3.28 ± 0.16 | 3.42 ± 0.10 | 3.59 ± 0.25 | 3.24 ± 0.18 |
| at pCa 6 | 0.108 ± 0.005 | 0.113 ± 0.005 | 0.283 ± 0.009 | 0.310 ± 0.010* |
| at pCa 4.5 | 0.028 ± 0.004 | 0.036 ± 0.003* | 0.182 ± 0.007 | 0.208 ± 0.008* |
| Δ<P2> | −0.081 ± 0.005 | −0.077 ± 0.005 | −0.101 ± 0.007 | −0.101 ± 0.006 |
| n = 5 | n = 5 | |||
Table 2
Effects of force inhibition by 25 μM blebbistatin on Ca2+-dependence of force and the cTnC orientation parameter <P2>. Mean ± SEM. pCa50 and nH are fitted parameters of Hill equation. Δ<P2>, changes in <P2> during Ca2+-activation from pCa 6 to 4.5. Comparisons (paired t test, two-tailed): before and after addition of blebbistatin (*p<0.05); between sarcomere lengths 1.9 and 2.3 μm in the presence of blebbistatin (#p<0.05).
| BR-cTnC-C | BR-cTnC-E | |||||
|---|---|---|---|---|---|---|
| SL (μm) | 1.9 | 1.9 | 2.3 | 1.9 | 1.9 | 2.3 |
| 25 μM Blebbistatin | − | + | + | − | + | + |
| Force | ||||||
| pCa50 | 5.39 ± 0.03 | 5.39 ± 0.04 | ||||
| nH | 3.72 ± 0.23 | 4.23 ± 0.20 | ||||
| <P2> | ||||||
| pCa50 | 5.40 ± 0.01 | 5.32 ± 0.02 * | 5.41 ± 0.03 # | 5.35 ± 0.02 | 5.28 ± 0.03 * | 5.36 ± 0.02 # |
| nH | 3.29 ± 0.10 | 2.74 ± 0.20 * | 2.49 ± 0.15 | 3.57 ± 0.22 | 2.90 ± 0.19 * | 2.60 ± 0.17 |
| at pCa 6.0 | 0.091 ± 0.004 | 0.088 ± 0.005 | 0.086 ± 0.004 | 0.276 ± 0.010 | 0.282 ± 0.010 * | 0.305 ± 0.009 # |
| at pCa 4.5 | 0.009 ± 0.002 | 0.016 ± 0.002 | 0.024 ± 0.003 | 0.168 ± 0.008 | 0.202 ± 0.007 * | 0.225 ± 0.006 # |
| Δ<P2> | 0.082 ± 0.004 | 0.069 ± 0.004 * | 0.062 ± 0.003 # | 0.098 ± 0.007 | 0.080 ± 0.004 * | 0.080 ± 0.005 |
| n = 5 | n = 7 | |||||
Download links
A two-part list of links to download the article, or parts of the article, in various formats.
Downloads (link to download the article as PDF)
Open citations (links to open the citations from this article in various online reference manager services)
Cite this article (links to download the citations from this article in formats compatible with various reference manager tools)
Distinct contributions of the thin and thick filaments to length-dependent activation in heart muscle
eLife 6:e24081.
https://doi.org/10.7554/eLife.24081


