Repeated losses of PRDM9-directed recombination despite the conservation of PRDM9 across vertebrates
- Columbia University, United States
- Harvard University, United States
- Centro de Investigaciones Científicas de las Huastecas 'Aguazarca', Mexico
- Texas A&M University, United States
Figures
Figure 1 with 5 supplements
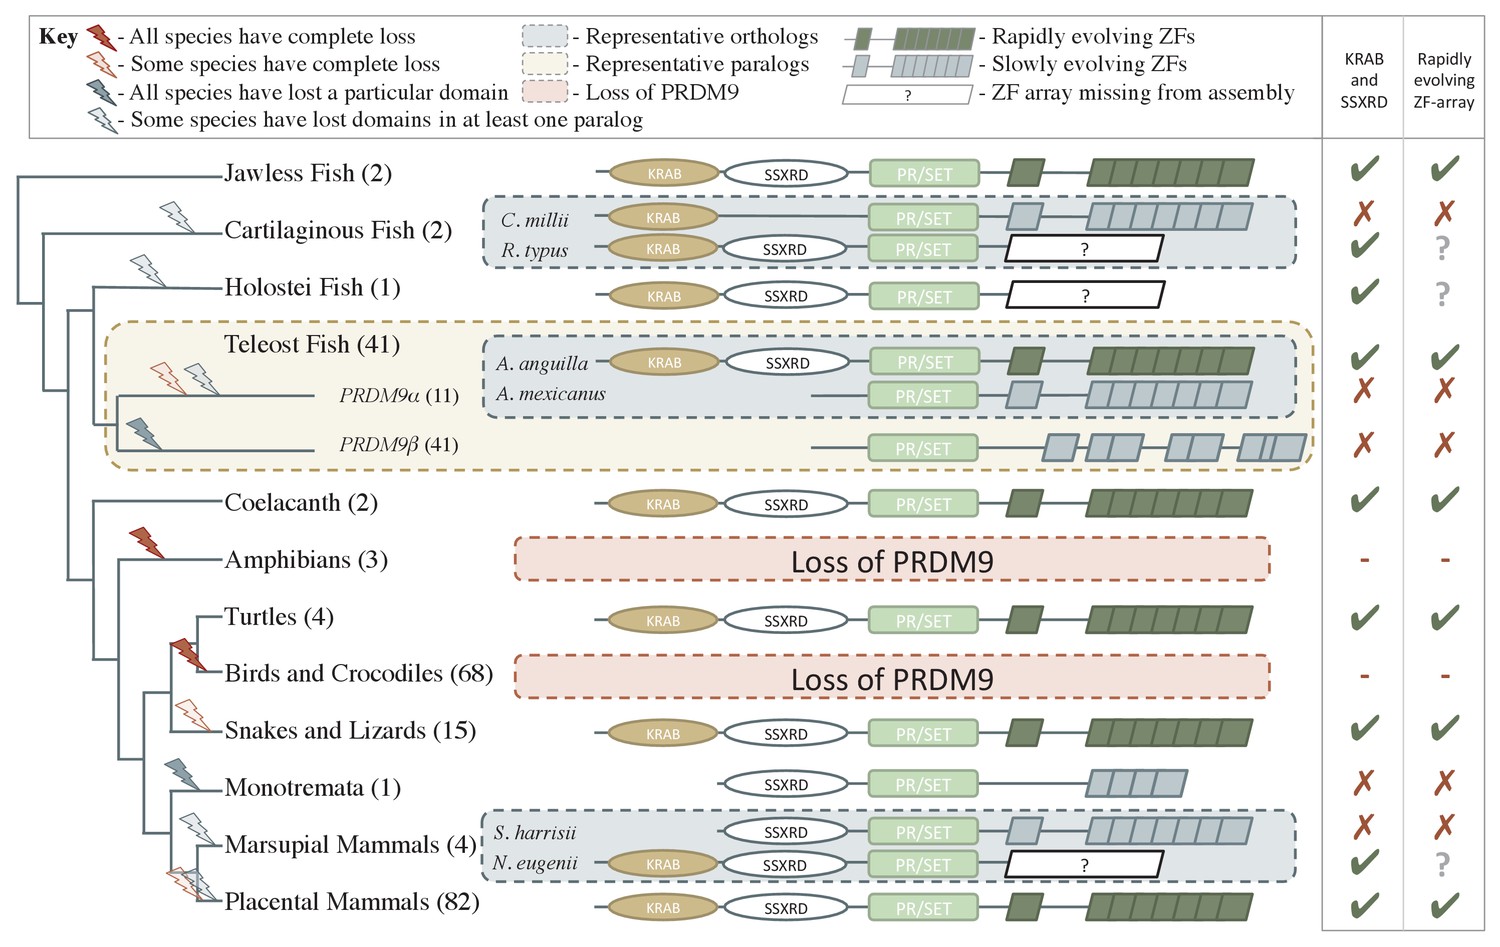
Phylogenetic distribution and evolution of PRDM9 orthologs in vertebrates.
Shown are the four domains: KRAB domain (in tan), SSXRD (in white), PR/SET (in light green) and ZF (in gray/dark green; the approximate structure of identified ZFs is also shown). The number of unique species included from each taxon is shown in parenthesis. Complete losses are indicated on the phylogeny by red lightning bolts and partial losses by gray lightning bolts. Lightning bolts are shaded dark when all species in the indicated lineage have experienced the entire loss or same partial loss. Lightning bolts are shaded light when it is only true of a subset of species in the taxon. ZF arrays in dark green denote those taxa in which the ZF shows evidence of rapid evolution. White rectangles indicate cases where we could not determine whether the ZF was present, because of the genome assembly quality. For select taxa, we present the most complete PRDM9 gene found in two examplar species. Within teleost fish, we additionally show a PRDM9 paralog that likely arose before the common ancestor of this taxon; in this case, the number of species observed to have each paralog is in paranthesis. Although the monotremata ZF is shaded gray, it was not included in our analysis of rapid evolution because of its small number of ZFs.
Figure 1—figure supplement 1
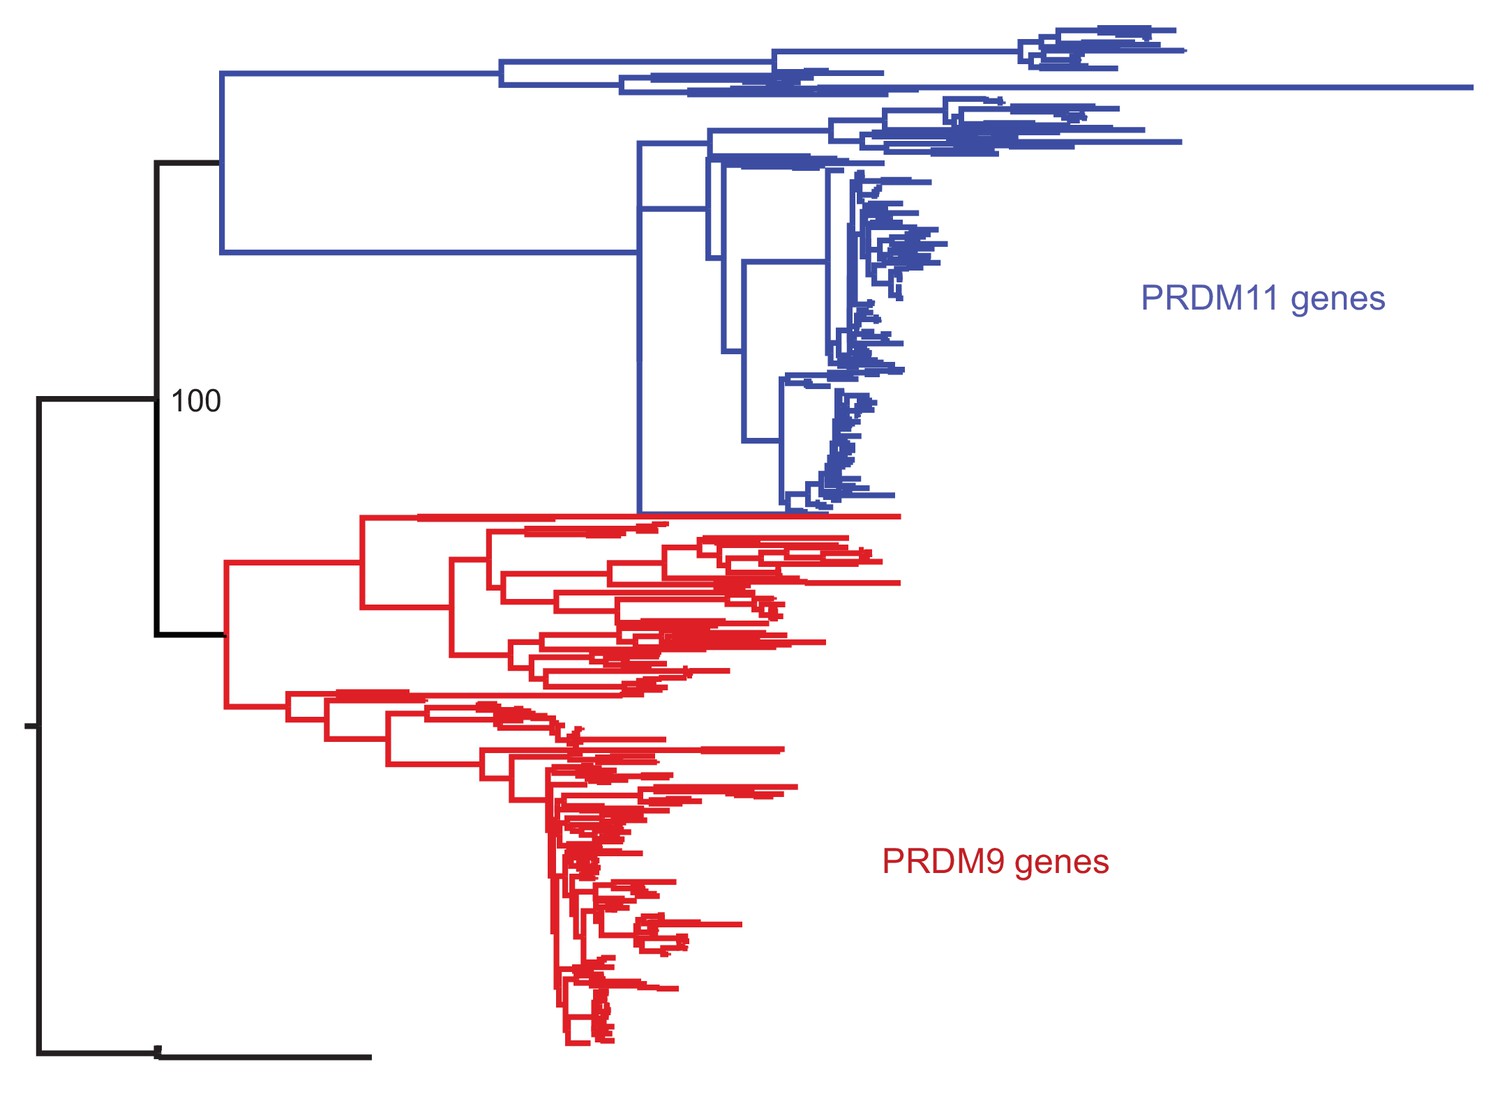
Phylogenetic approach to identifying PRDM9 orthologs and related gene families.
A maximum likelihood phylogeny built with RAxML, using an alignment of SET domains, distinguishes between genes that cluster with mammalian PRDM9 and PRDM11 with 100% bootstrap support. Genes shown in black, which are orthologous to both PRDM9 and PRDM11, are only found in jawless fish.
Figure 1—figure supplement 2
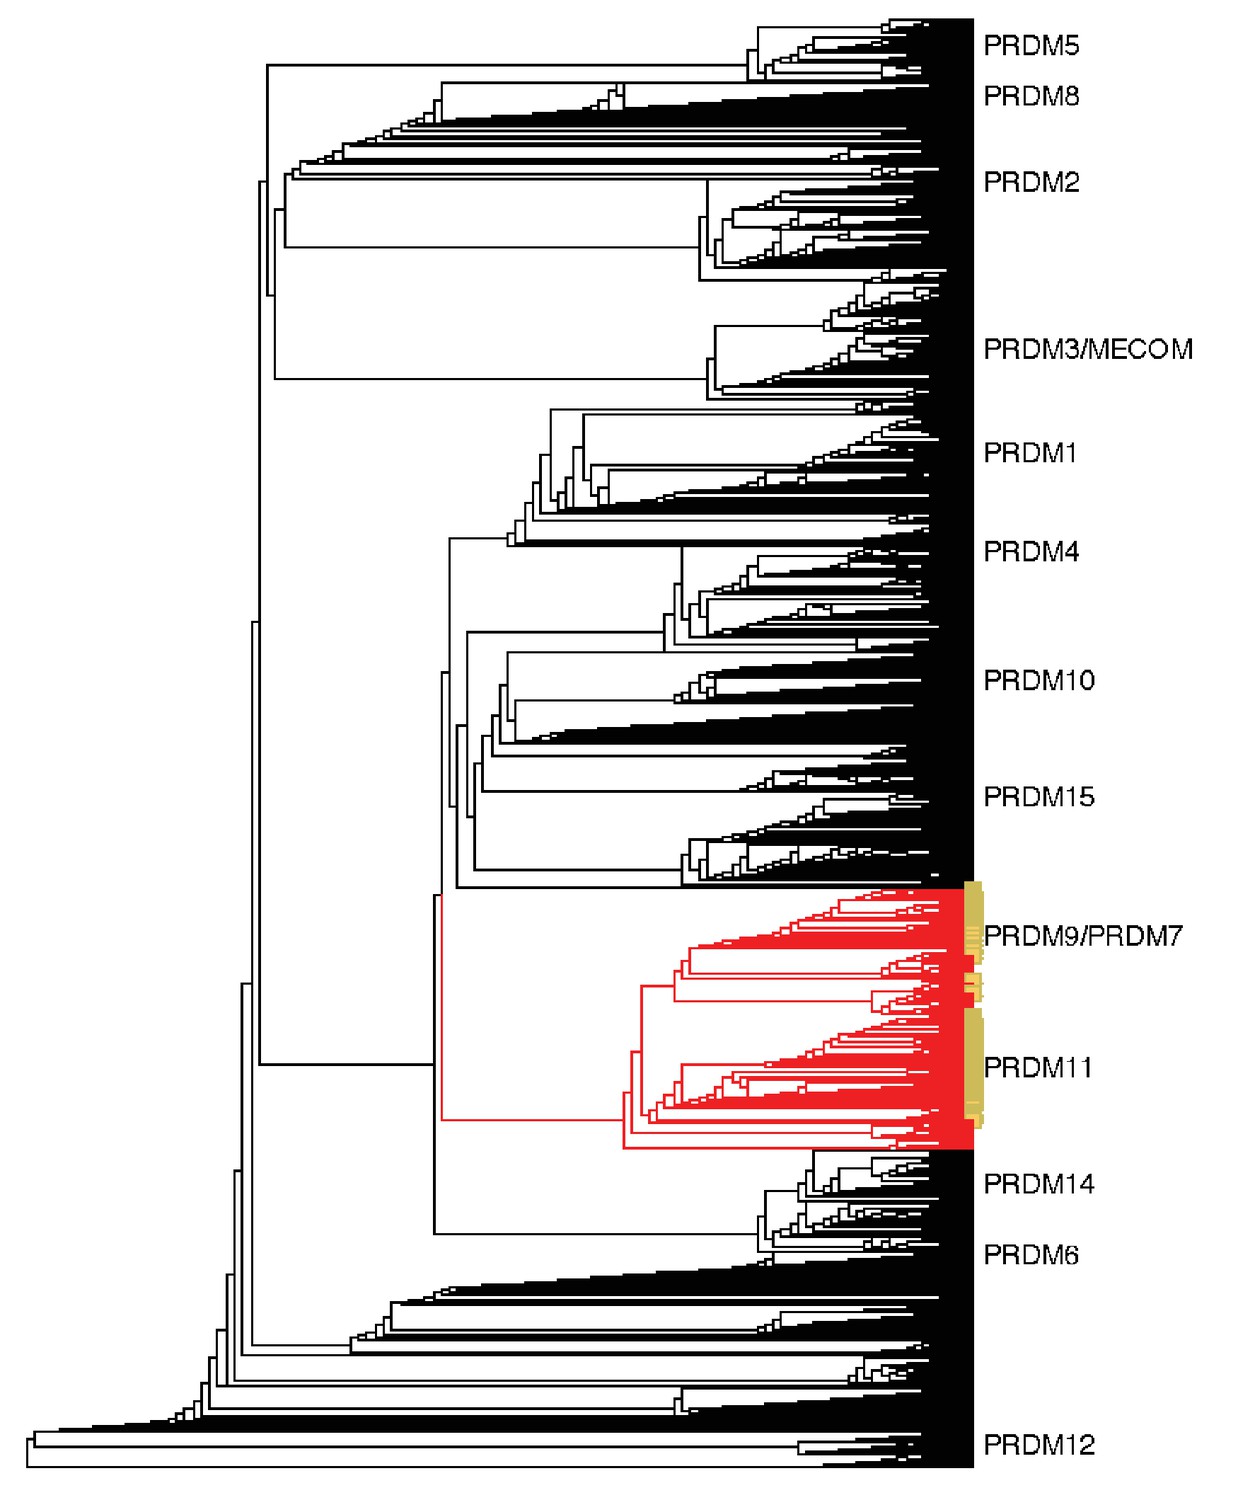
Neighbor-joining (NJ) guide tree based on the SET domain.
A NJ guide tree analysis on SET domains identified in our RefSeq, whole genome assembly, and transcriptome datasets was used as an initial step to identify sequences clustering with human PRDM9/7 or PRDM11. These sequences (in red) were selected for phylogenetic analysis with RAxML; they included all RefSeq genes in our dataset that have been previously annotated as PRDM9/7 or PRDM11 (in yellow). Genes more closely related to known PRDM genes other than PRDM9 or PRDM11 (in black) were excluded from further analysis.
Figure 1—figure supplement 3
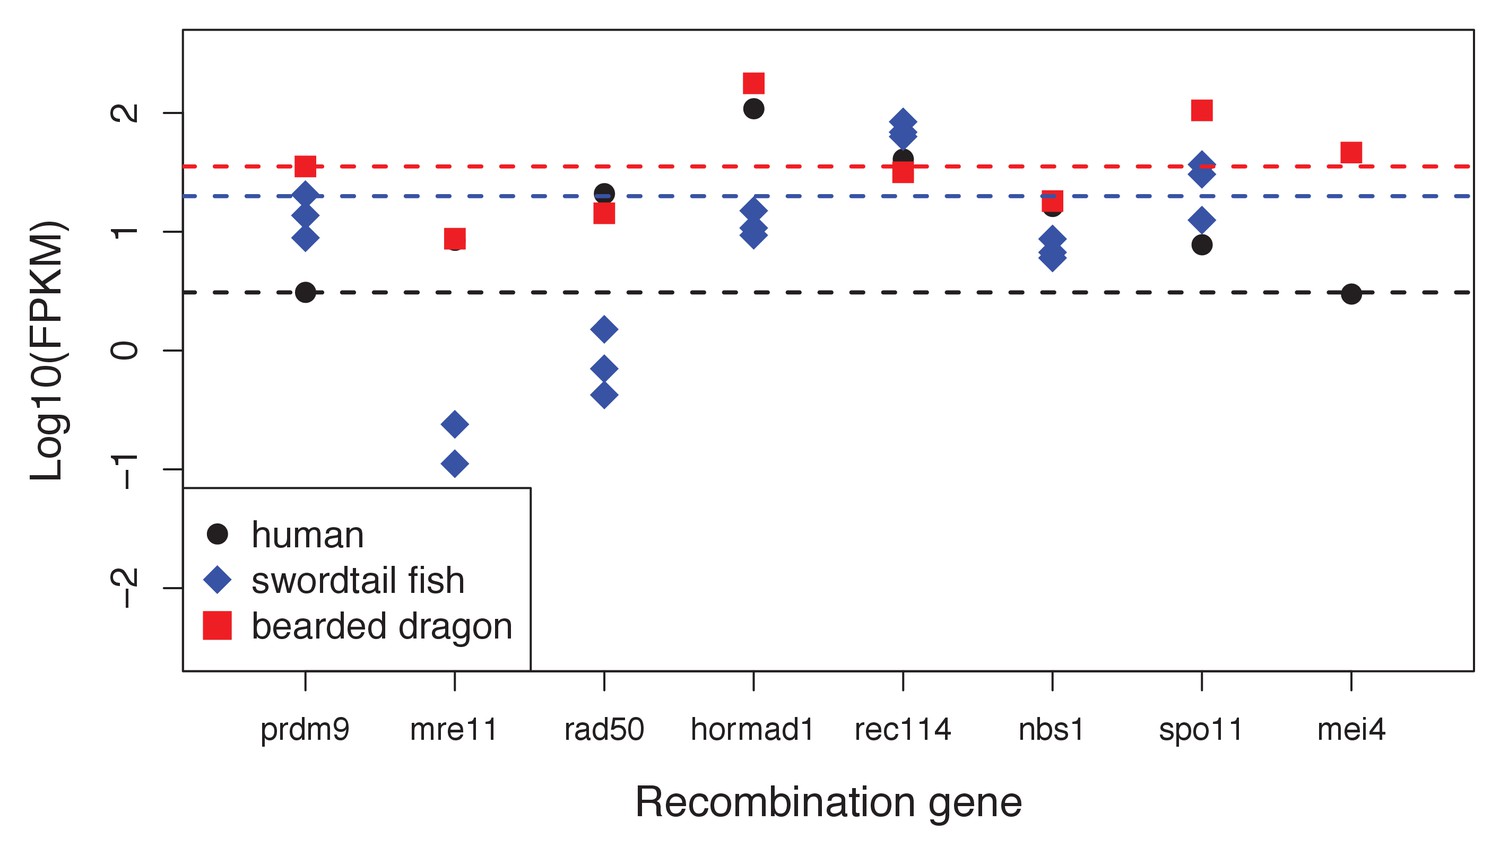
Expression levels of genes with a known role in meiotic recombination in testes of three exemplar species: human, swordtail fish and bearded dragon (a lizard).
For three swordtails (X. malinche) and one bearded dragon, the FPKM per individual is plotted for each transcript. For humans, the point represents the average expression of 122 individuals from the gene expression atlas (see Materials and methods). For bearded dragons, PRDM9 and RAD50 were represented by multiple transcripts (two and three respectively), and the average expression level is shown. Dashed lines show the point estimate or average expression level of PRDM9 to highlight that several genes in each species have expression levels comparable to or lower than PRDM9 in testes.
Figure 1—figure supplement 4

Amino acid diversity as a function of amino acid position in the ZF alignment for six examplar species.
Each plot shows the 95% range of diversity levels at that site for all C2H2 ZFs from a species of that taxon (gray); the values at PRDM9 are show in red or blue. Turtles, snakes and coelacanth show a pattern of diversity that is similar to those in mammalian species with a complete PRDM9 ortholog, with higher diversity at DNA-binding sites (residues 11, 12, 15 and 18) and reduced diversity at most other sites. In bony fish, this pattern is not observed in PRDM9β genes (blue) or in partial PRDM9α genes (shown for A. mexicanus), where PRDM9 ZF diversity is more typical of other C2H2 ZFs.
Figure 1—figure supplement 5
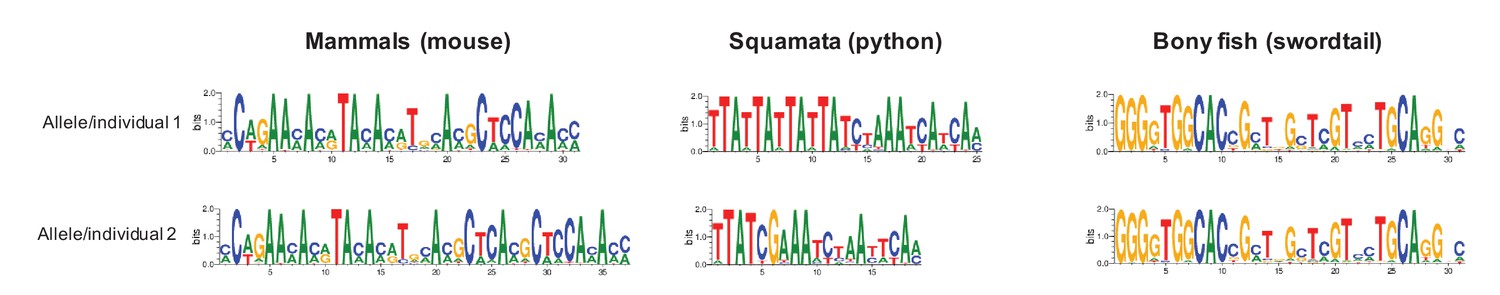
Examples of differences in computationally predicted PRDM9 binding motifs for species from three taxa.
Shown are two mouse from the same species (Mus musculus subspecies; Genbank: AB844114.1; FJ899852.1), two pythons from the same species (Python bivittatus; the genome sequence and a Sanger resequenced individual; see Materials and methods), and two species of swordtail fish (X. birchmanni and X. malinche; genome sequences). The position weight matrix was obtained using C2H2 prediction tools available at http://zf.princeton.edu.
Figure 2 with 2 supplements
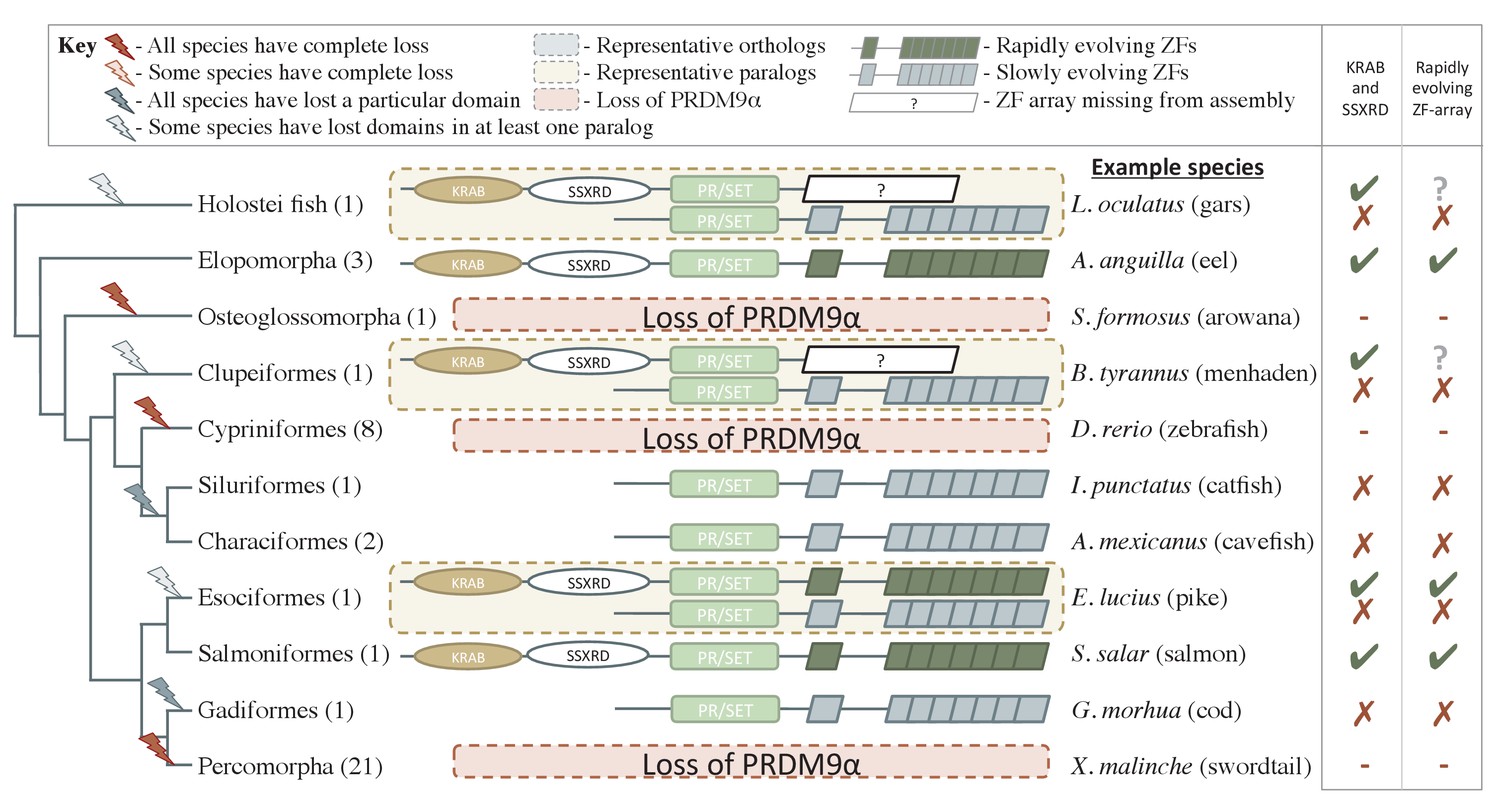
Phylogenetic distribution and functional domains of PRDM9α orthologs in teleost fish and in holostean fish that are outgroups to the PRDM9α/PRDM9β duplication event.
Shown are the four domains: KRAB domain (in tan), SSXRD (in white), PR/SET (in light green) and ZF (in gray/dark green; the approximate structure of identified ZFs is also shown). The number of unique species included from each taxon is shown in parenthesis. Complete losses are indicated on the phylogeny by red lightning bolts and partial losses by gray lightning bolts. Lightning bolts are shaded dark when all species in the indicated lineage have experienced the loss. Lightning bolts are shaded light when it is only true of a subset of species in the taxon. ZF arrays in dark green denote those taxa in which the ZF shows evidence of rapid evolution. White rectangles indicate cases where we could not determine whether the ZF was present, because of the genome assembly quality. While many taxa shown have more than one PRDM9α ortholog, the genes identified from each species generally have similar domain architectures. Exceptions include Clupeiformes, Esociformes, and Holostean fish, for which two alternative forms of PRDM9α paralogs are shown. Based on this distribution, we infer that the common ancestor of ray-finned fish likely had a rapidly evolving and complete PRDM9α ortholog.
Figure 2—figure supplement 1
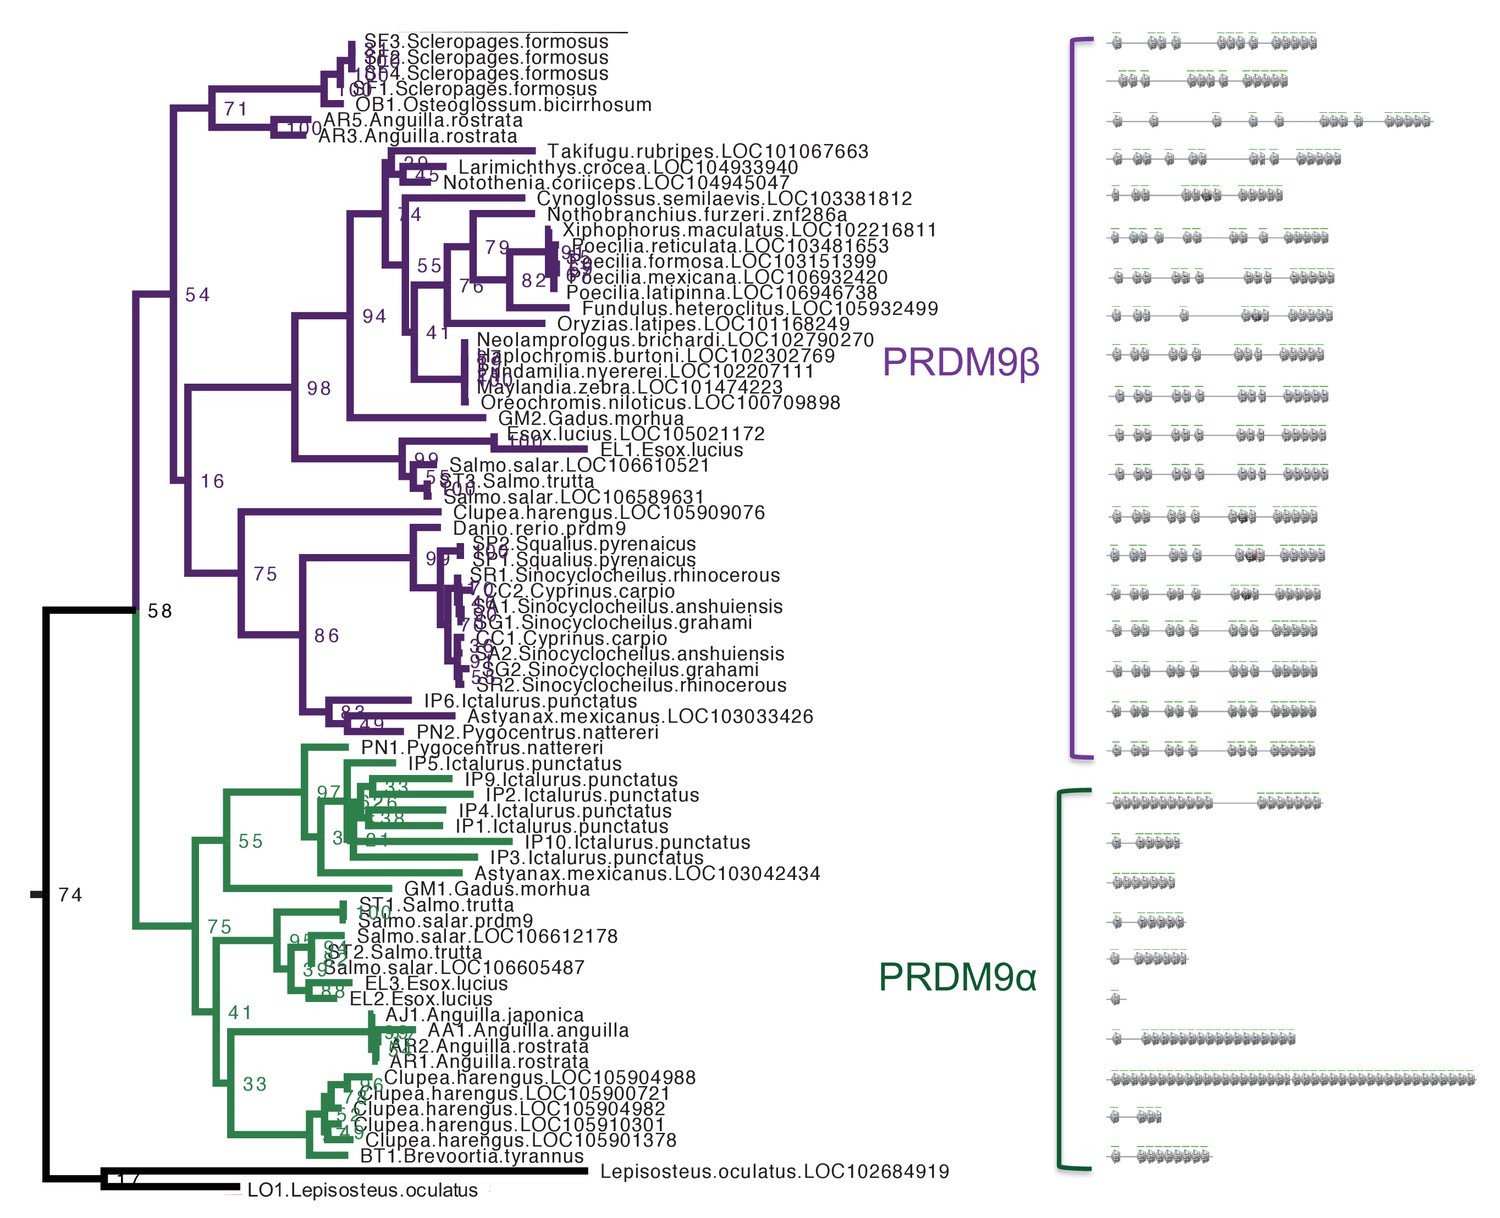
Section of maximum-likelihood phylogeny of the SET domain showing bony fish PRDM9 orthologs α and β.
The reciprocal monophyly of PRDM9 orthologs α and β is reasonably well supported and in particular bootstrap support for the monophyly of PRDM9α genes is 75%. The ZF domains for representative PRDM9 orthologs of each type are shown to the right, with each gray pentagon indicating the location of a ZF. In swordtail fish, the complete ZF array is found within a single exon, and the last tandem array of six ZFs forms a minisatellite structure.
Figure 2—figure supplement 2
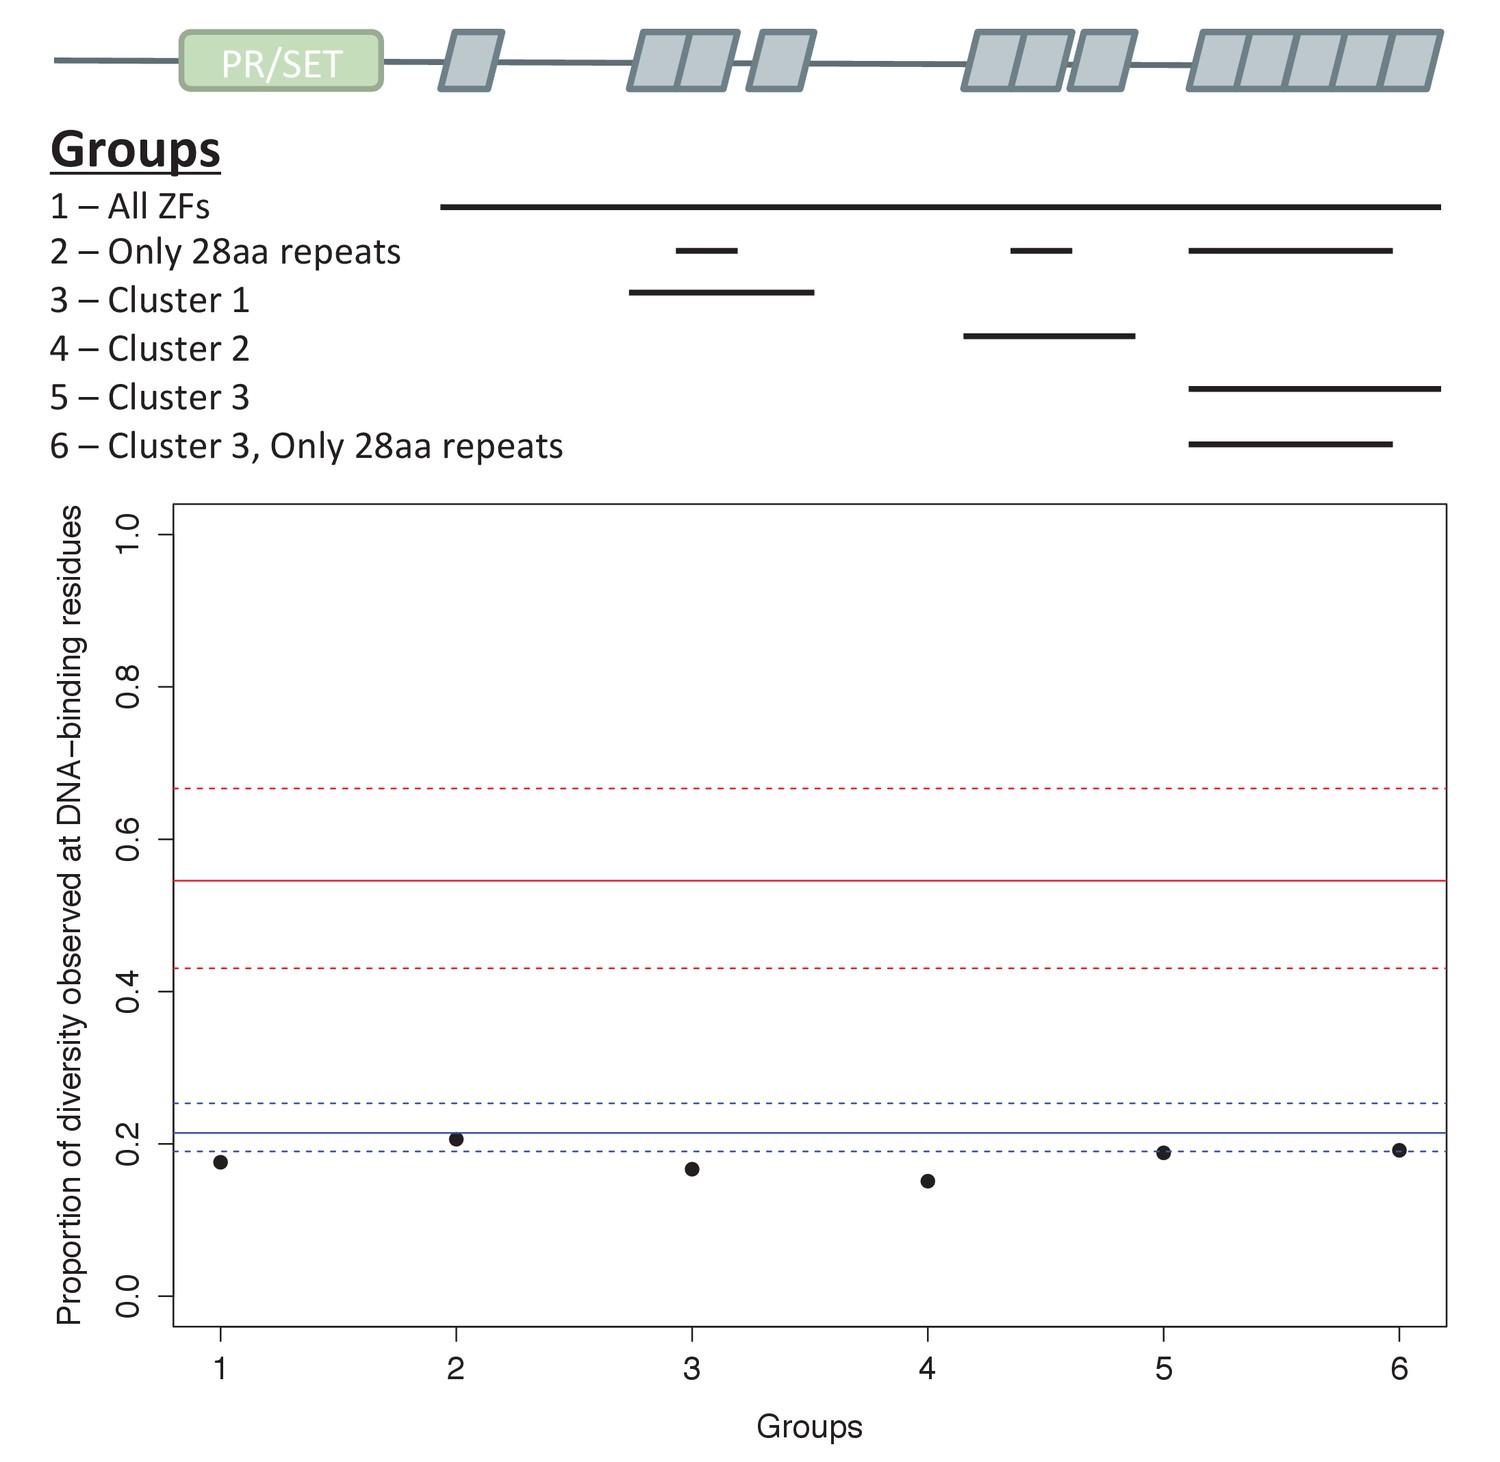
Analysis of ZF evolution in PRDM9β.
Red lines show the median (solid) and first and third quantiles (dashed lines) for all 48 complete PRDM9 orthologs identified in vertebrates that have four or more ZFs. Blue lines show the median (solid) and first and third quantiles (dashed lines) for all other C2H2 ZF genes from X. maculatus (157 genes). Results about the rate of ZF evolution in the PRDM9β gene from X. maculatus are qualitatively similar regardless of our choice of which cluster of individual ZF domains to include in our analysis, indicating that our ability to detect evidence of positive selection at DNA-binding residues in these arrays, or lack thereof, is unlikely to be influenced by this choice.
Figure 3
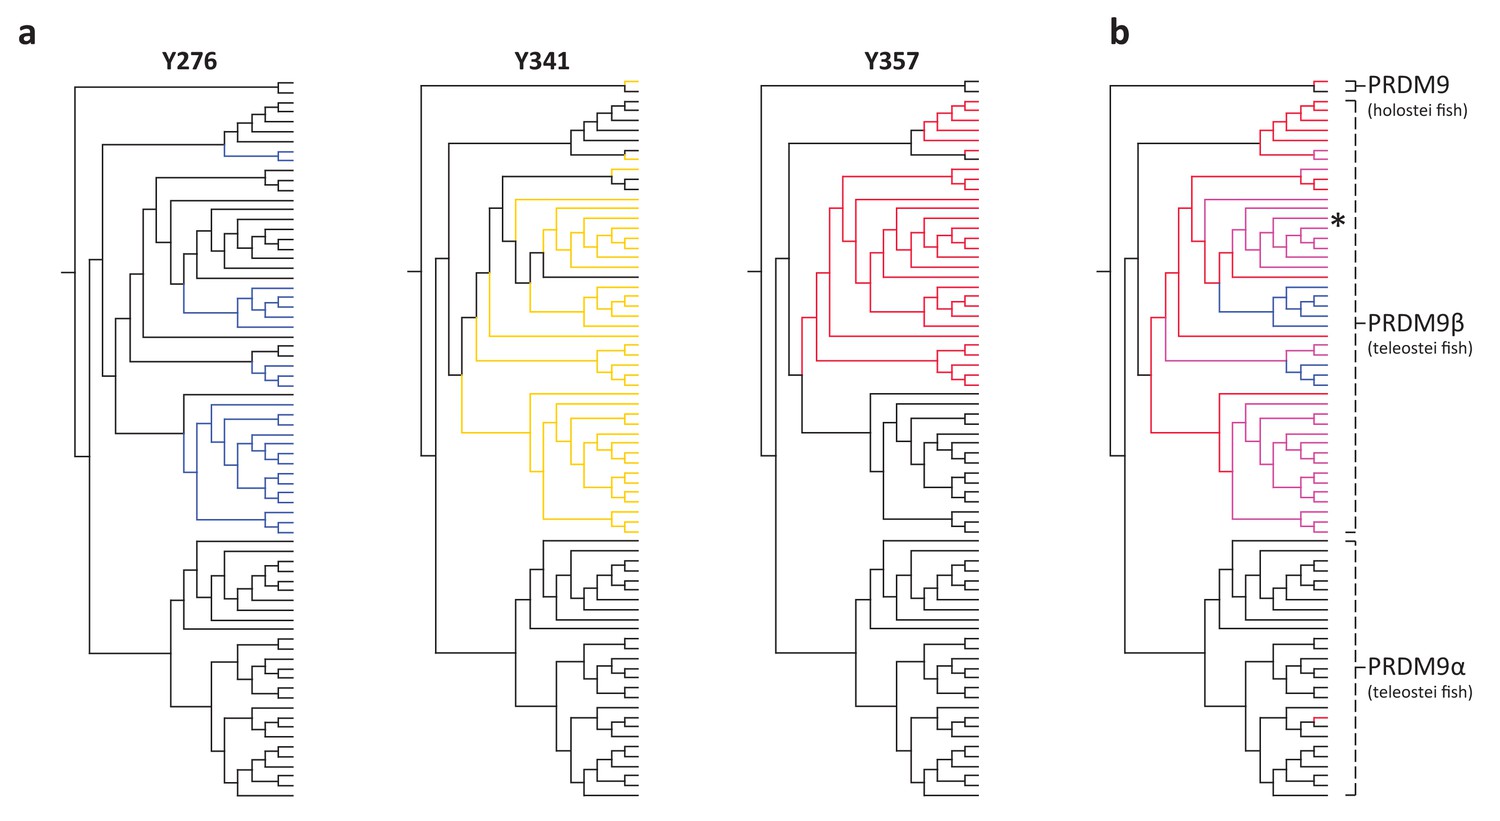
Substitutions at SET domain catalytic residues in bony fish PRDM9 genes.
(a) Lineages within bony fish carrying substitutions at each of three tyrosine residues involved in H3K4me3 catalysis in human PRDM9 are shown in blue, yellow and red. (b) Lineages carrying substitutions at one, two or three of these residues are shown in red, pink and blue respectively. All PRDM9β genes as well as a partial PRDM9 ortholog from holostean fish carry one or more substitutions at these residues. The PRDM9β gene from Xiphophorus is indicated by the presence of asterisk.
Figure 4 with 5 supplements
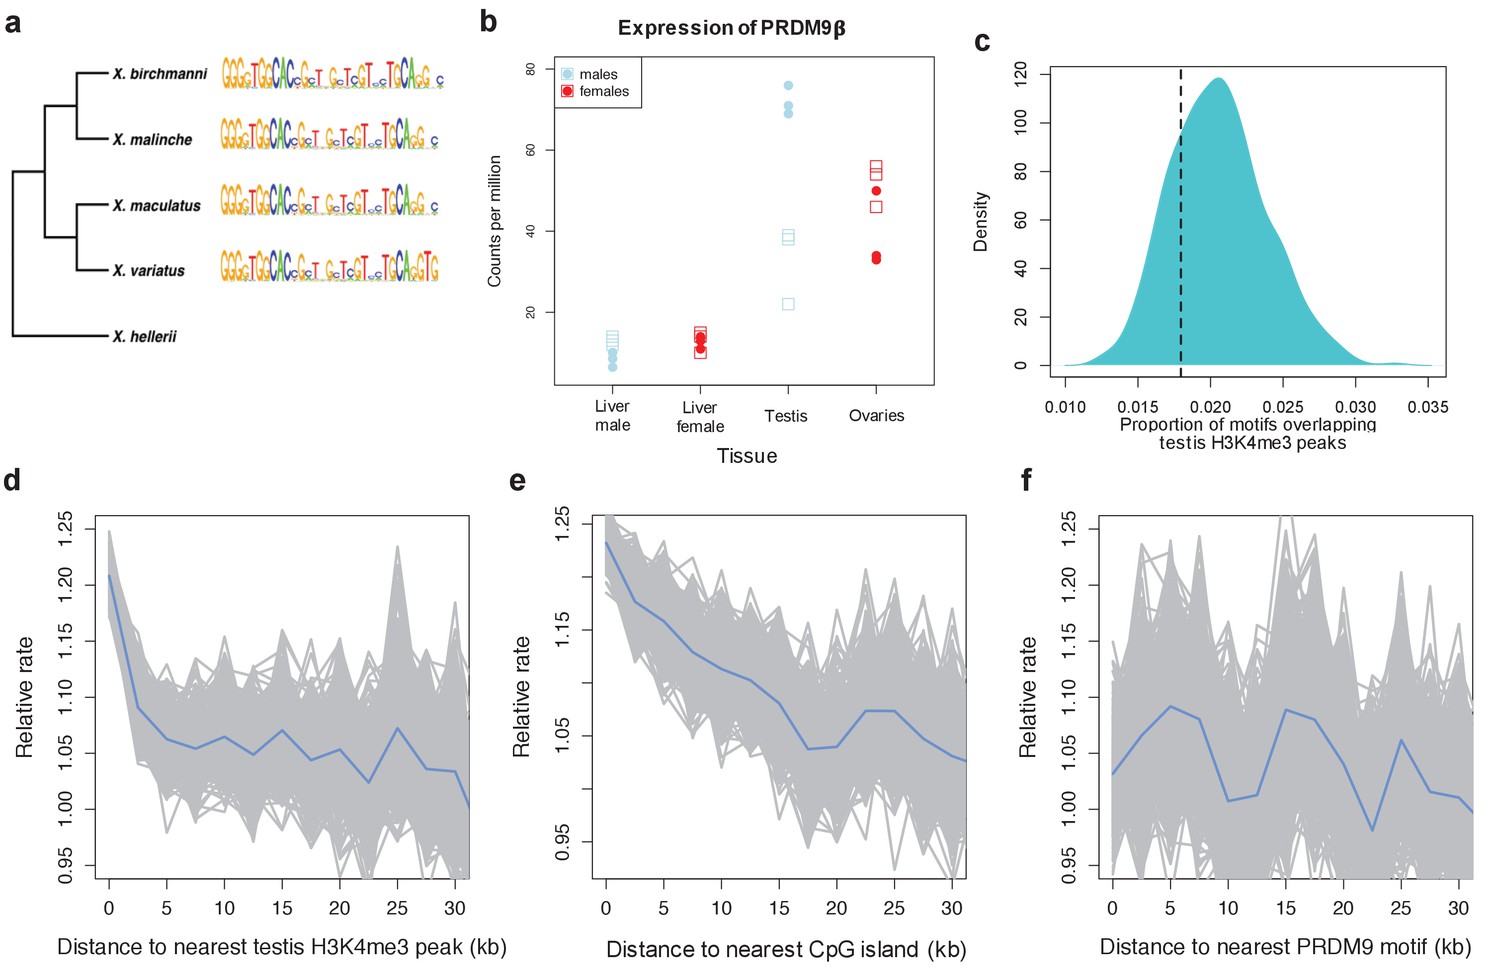
Patterns of recombination and PRDM9 evolution in swordtail fish.
(a) The ZF array of PRDM9 appears to be evolving slowly in Xiphophorus, with few changes over 1 million years of divergence (Cui et al., 2013; Jones et al., 2013). (b) PRDM9 is upregulated in the germline relative to the liver in X. birchmanni (circles) and X. malinche (squares; panel shows three biological replicates for each species). (c) The computationally-predicted PRDM9 binding sites is not unusually associated with H3K4me3 peaks in testes (d) Crossover rates increase near H3K4me3 peaks in testis (e) Crossover rates increase near CGIs (f) Crossover rates do not increase near computationally-predicted PRDM9 binding sites (see Figure 4—figure supplement 3 for comparison). Crossover rates were estimated from ancestry switchpoints in naturally occurring hybrids between X. birchmanni and X. malinche (see Materials and methods).
Figure 4—figure supplement 1
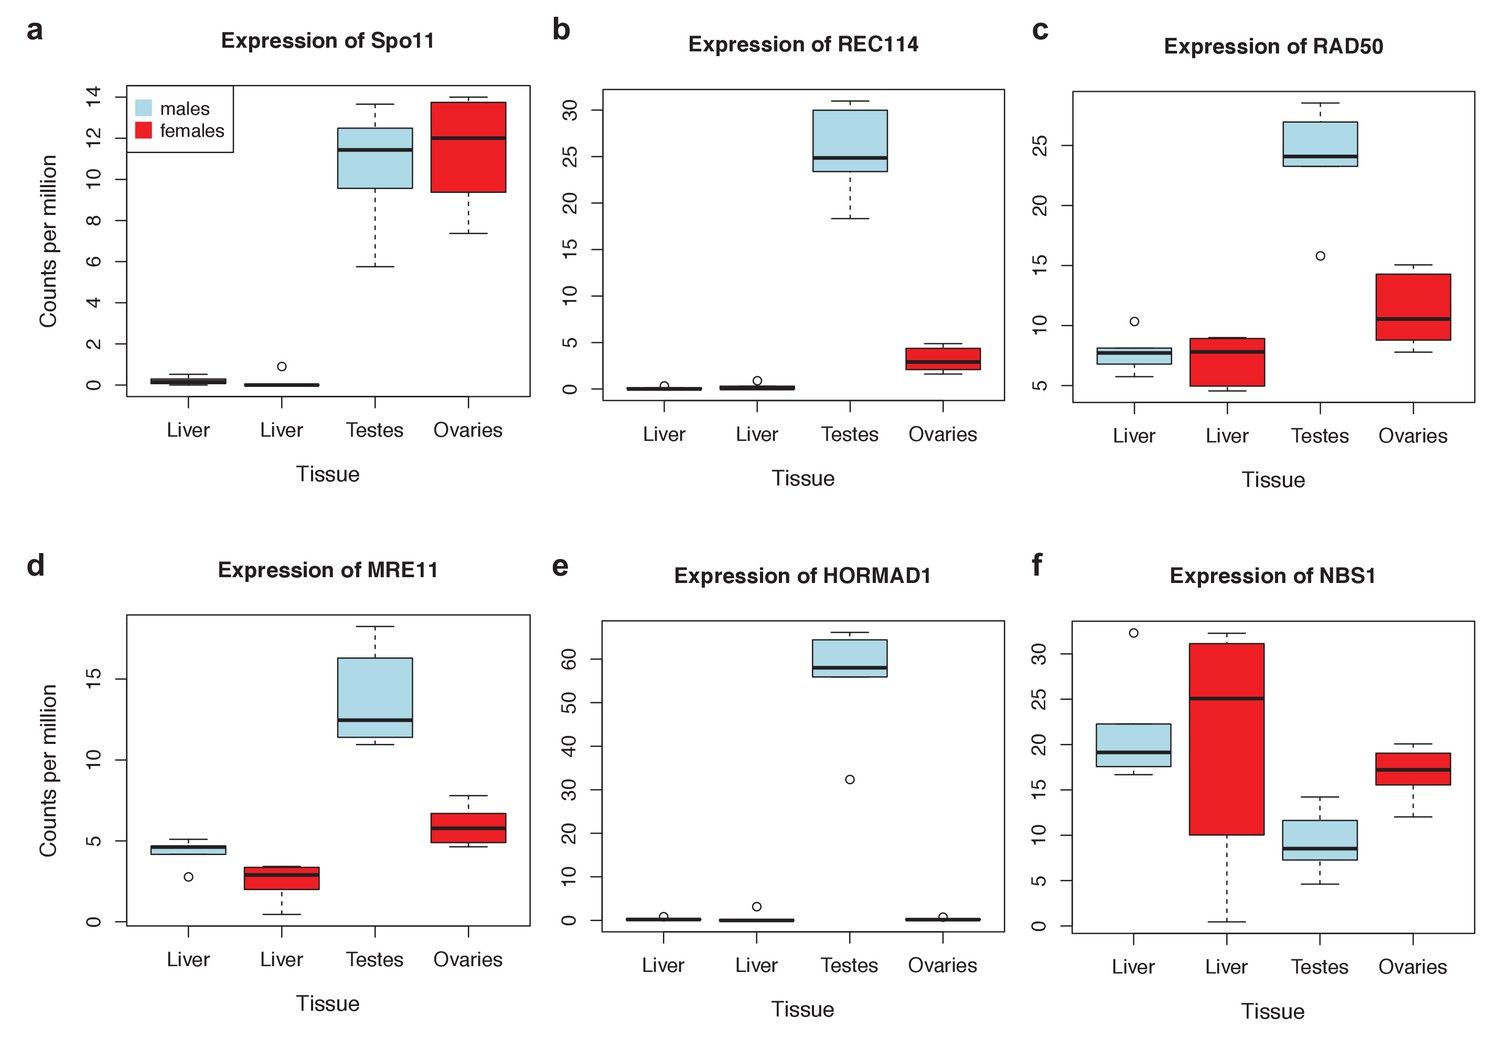
Expression levels of meiosis-related genes in swordtail fish tissues.
In general, the seven meiosis-related genes surveyed had higher expression in tissues containing germline cells than liver tissue, but this pattern was much more pronounced in testis tissue (compared to ovary tissue). As a result, we focused our analysis of meiosis related genes on RNAseq data generated from testis. Results shown are based on analysis of three male and female biological replicates from each swordtail species (X. birchmanni and X. malinche).
Figure 4—figure supplement 2
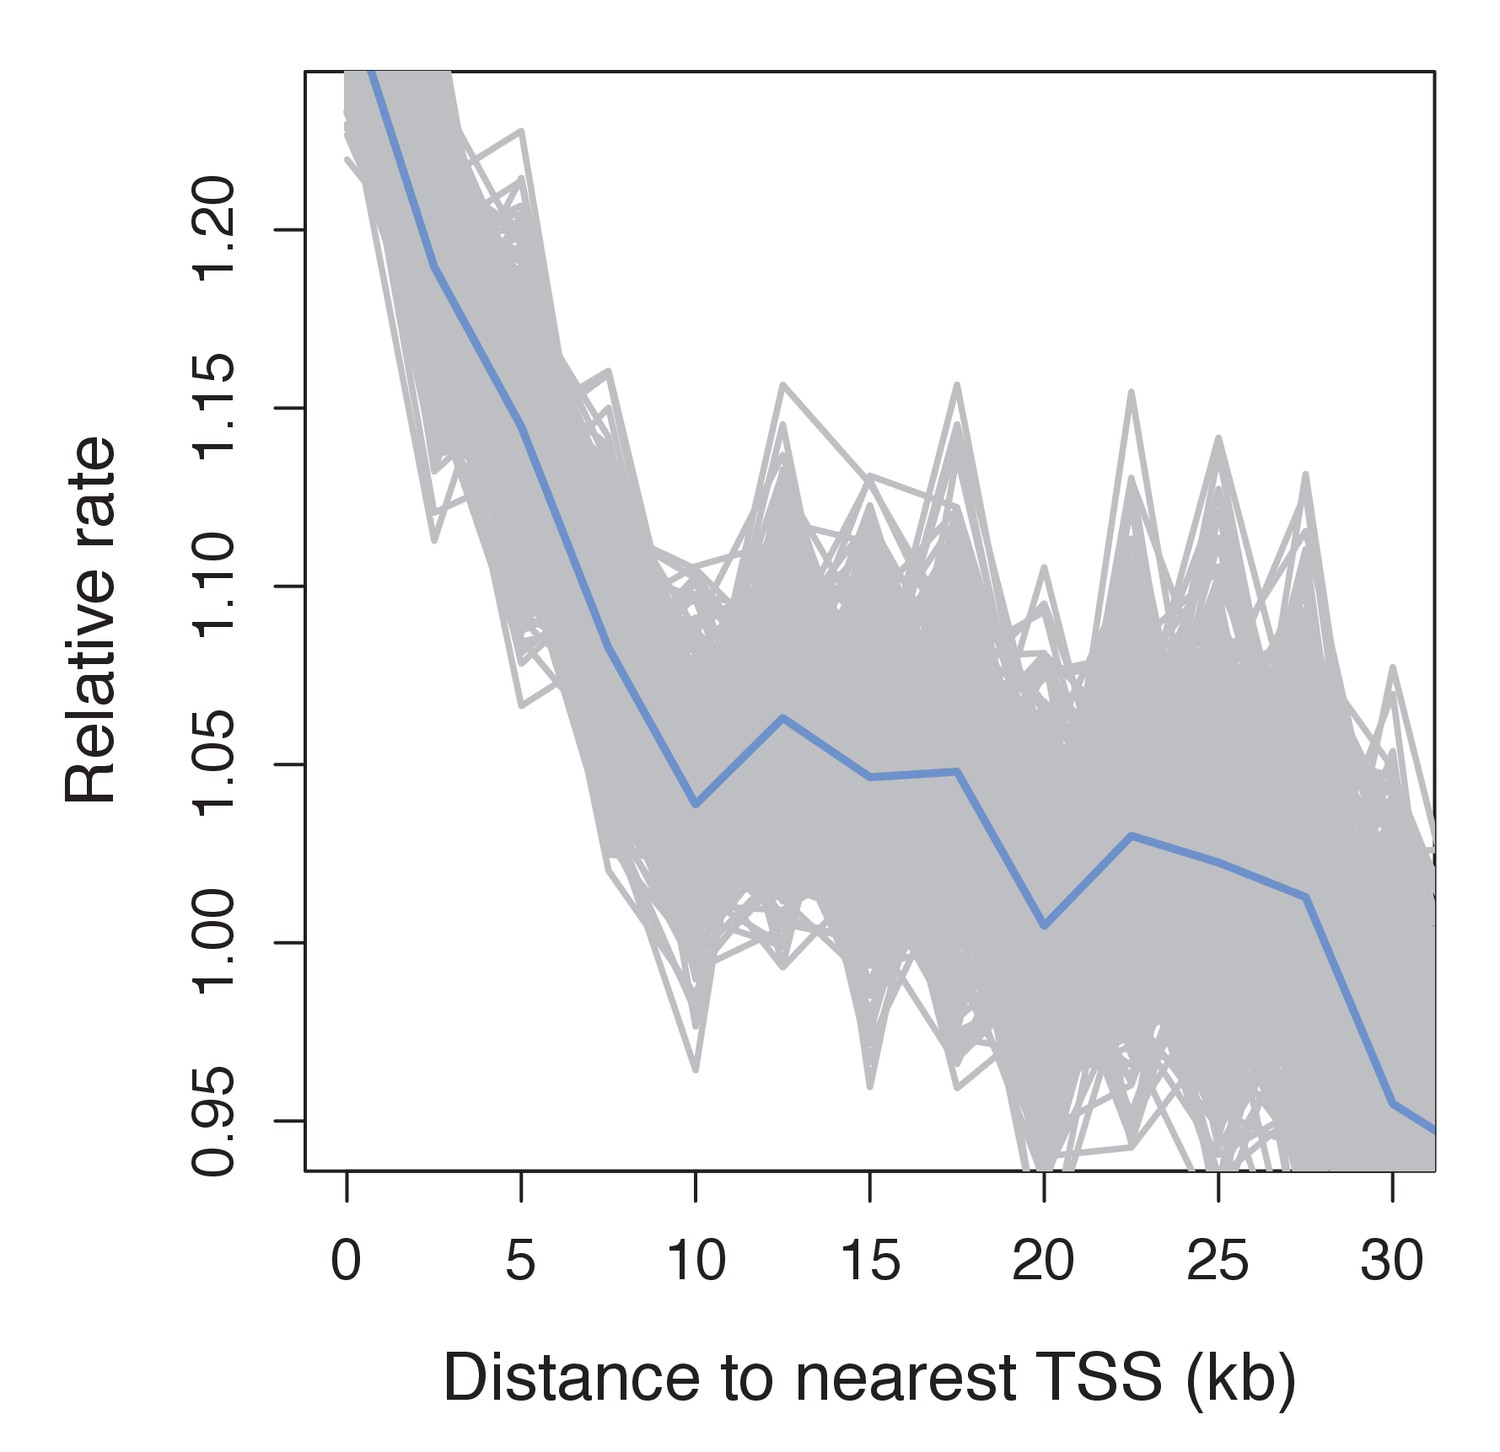
Recombination frequency in swordtails as a function of distance to the TSS.
Partial correlation analyses suggest that the association between the TSS and recombination rate in swordtails is explained by H3K4me3 peaks and CGIs.
Figure 4—figure supplement 3
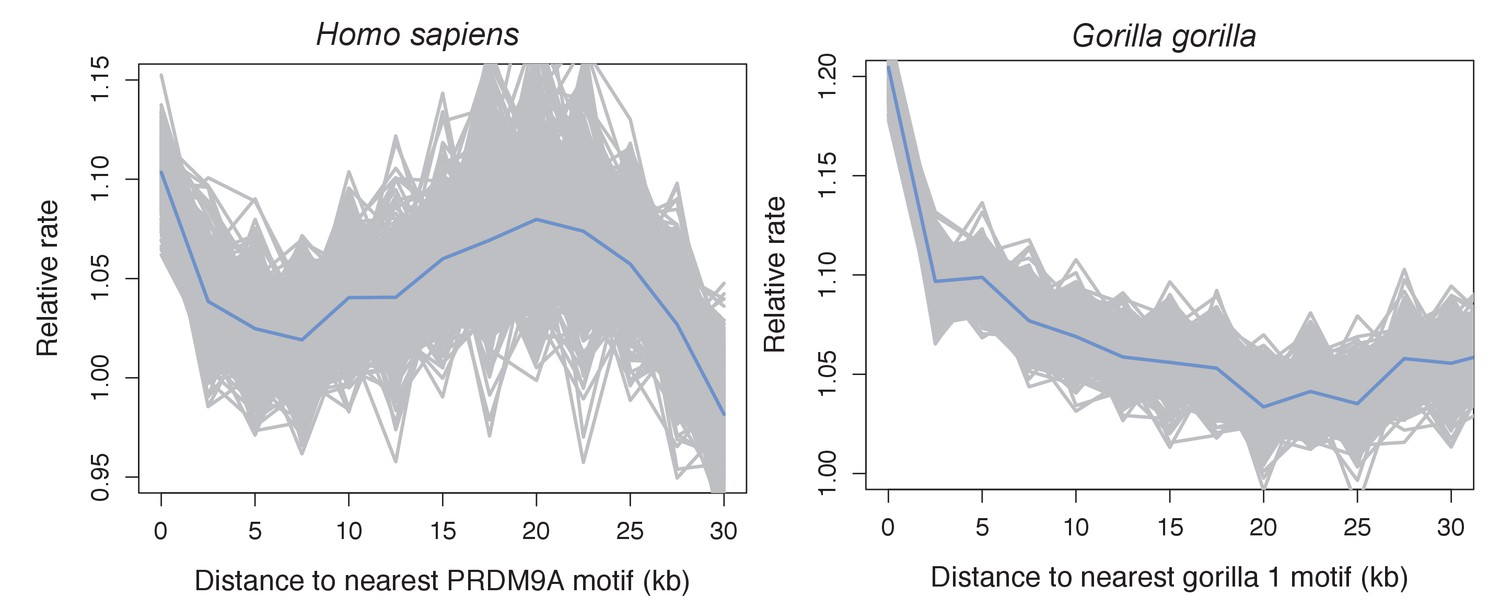
Recombination rates show a peak near the computationally predicted PRDM9A binding motif in humans and gor-1 allele in gorillas.
Most work investigating relationships between PRDM9 motifs and recombination rates have focused on the PRDM9 motif empirically inferred from recombination hotspots, but the empirical motif is unknown for many species. To generate results comparable to those we present for swordtails in Figure 4F, we therefore determined recombination rate (using the map based on LD patterns in the CEU; Frazer et al., 2007) as a function of distance to computationally predicted binding sites for the PRDM9A motif in humans and as a function of distance to computationally predicted binding sites for the gor-1 PRDM9 allele (Schwartz et al., 2014) in gorillas (using the LD-based map from Great Ape Genome Project et al., 2016).
Figure 4—figure supplement 4
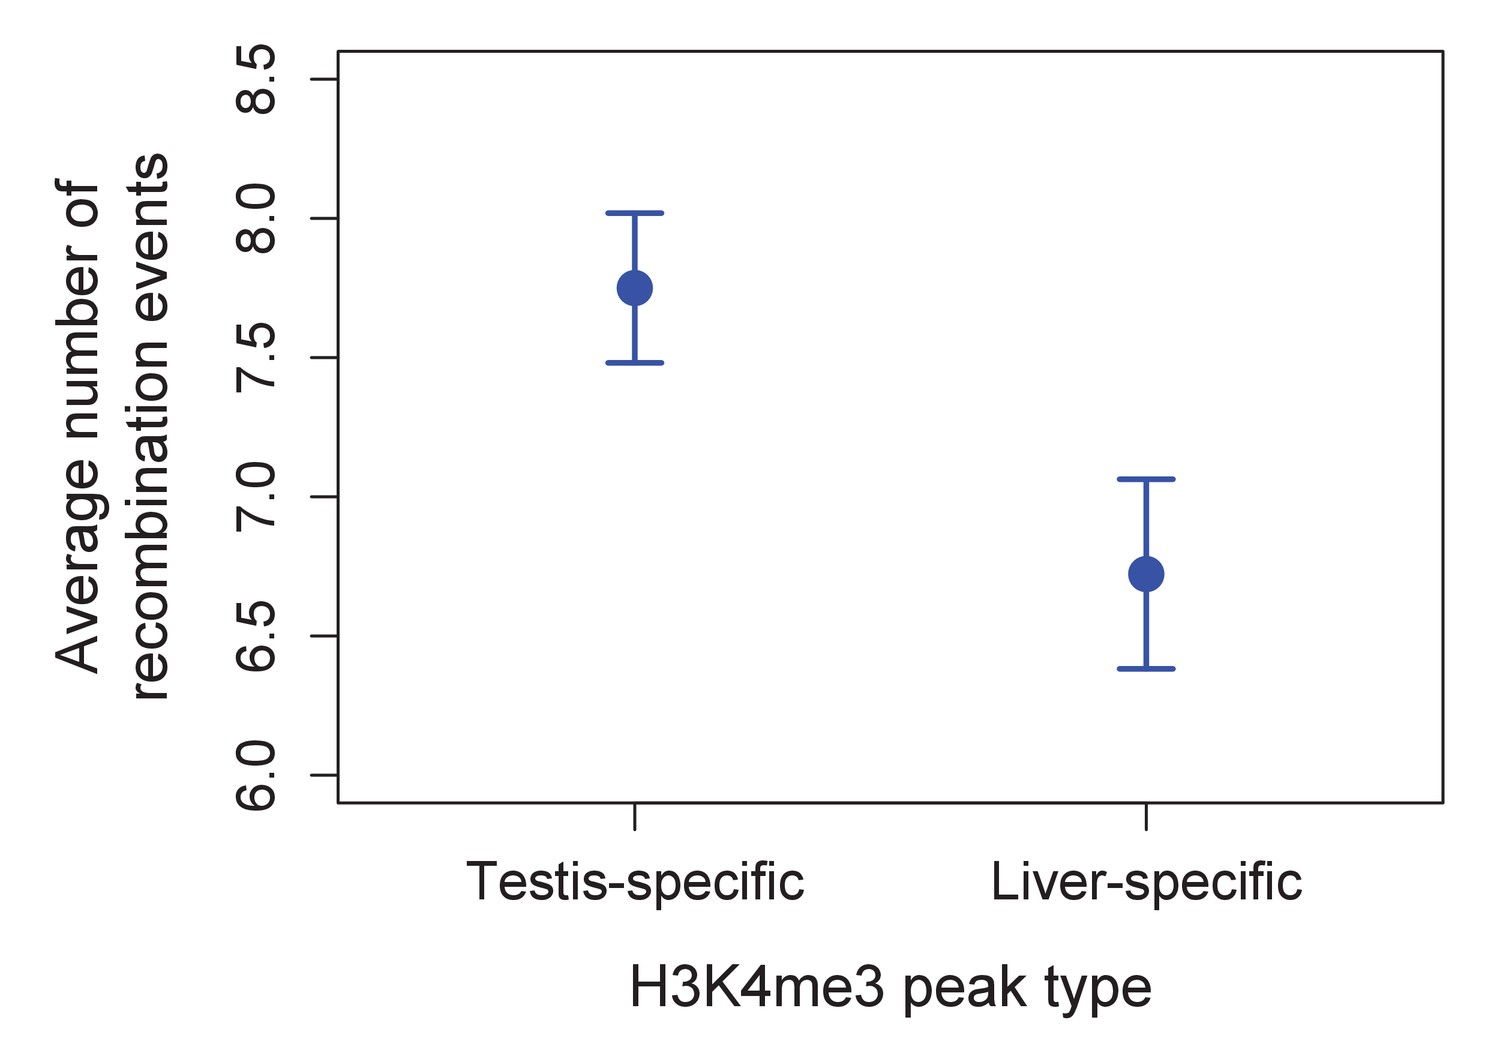
Higher observed recombination rate at testis-specific H3K4me3 peaks than liver-specific H3K4me3 peaks.
H3K4me3 peaks found only in the testis and not in the liver of X. birchmanni have higher observed recombination rates in X. birchmanni – X. malinche hybrids. This pattern supports the conclusion that H3K4me3 peaks are associated with recombination in swordtails.
Figure 4—figure supplement 5
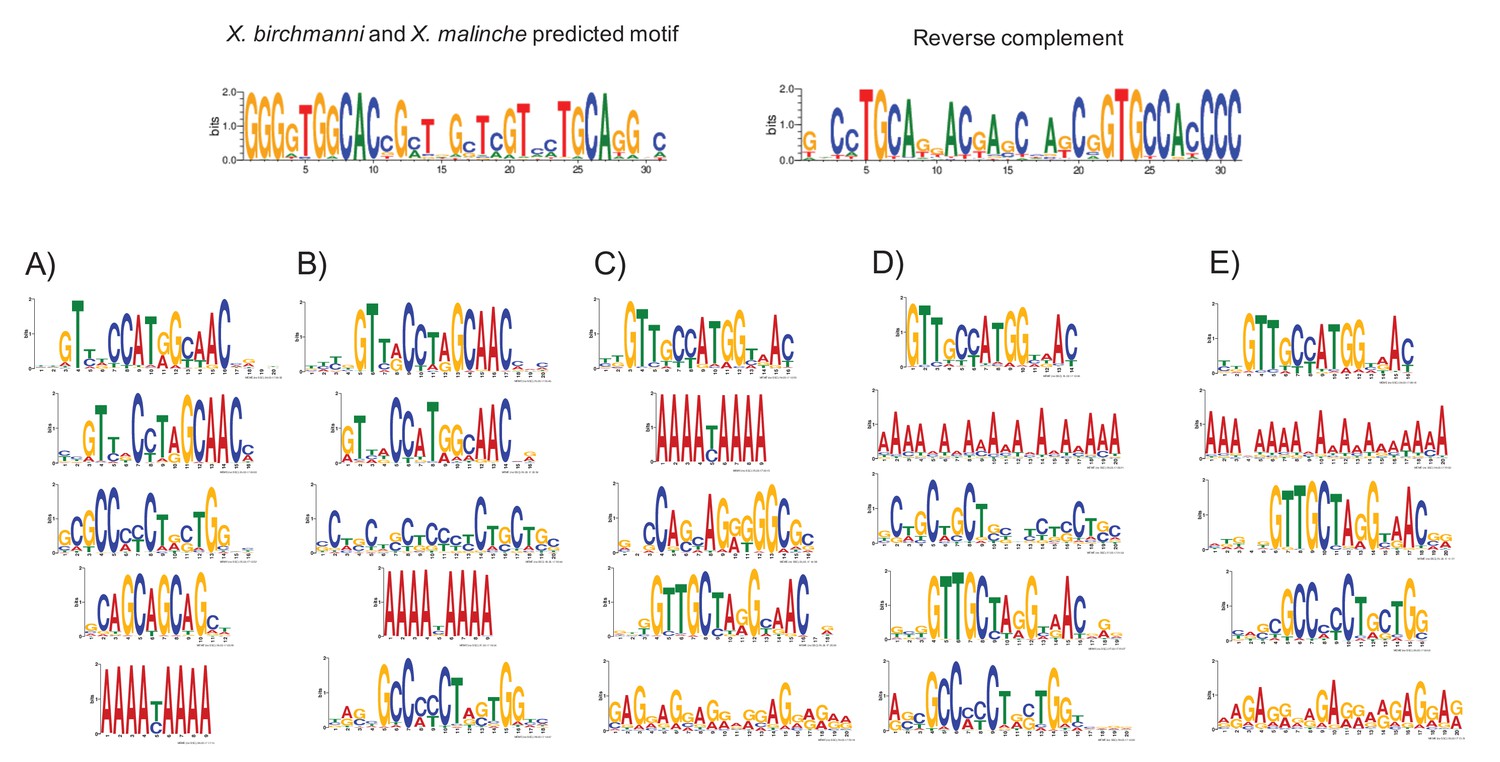
MEME prediction of sequences enriched in testis-H3K4me3 peaks relative to liver-specific H3K4me3 peaks.
Results shown in A-E are from five replicate runs of 2000 testis-specific sequences using liver-specific sequences as a background comparison set. The swordtail computationally-predicted PRDM9 binding motif is shown for comparison.
Figure 5 with 1 supplement
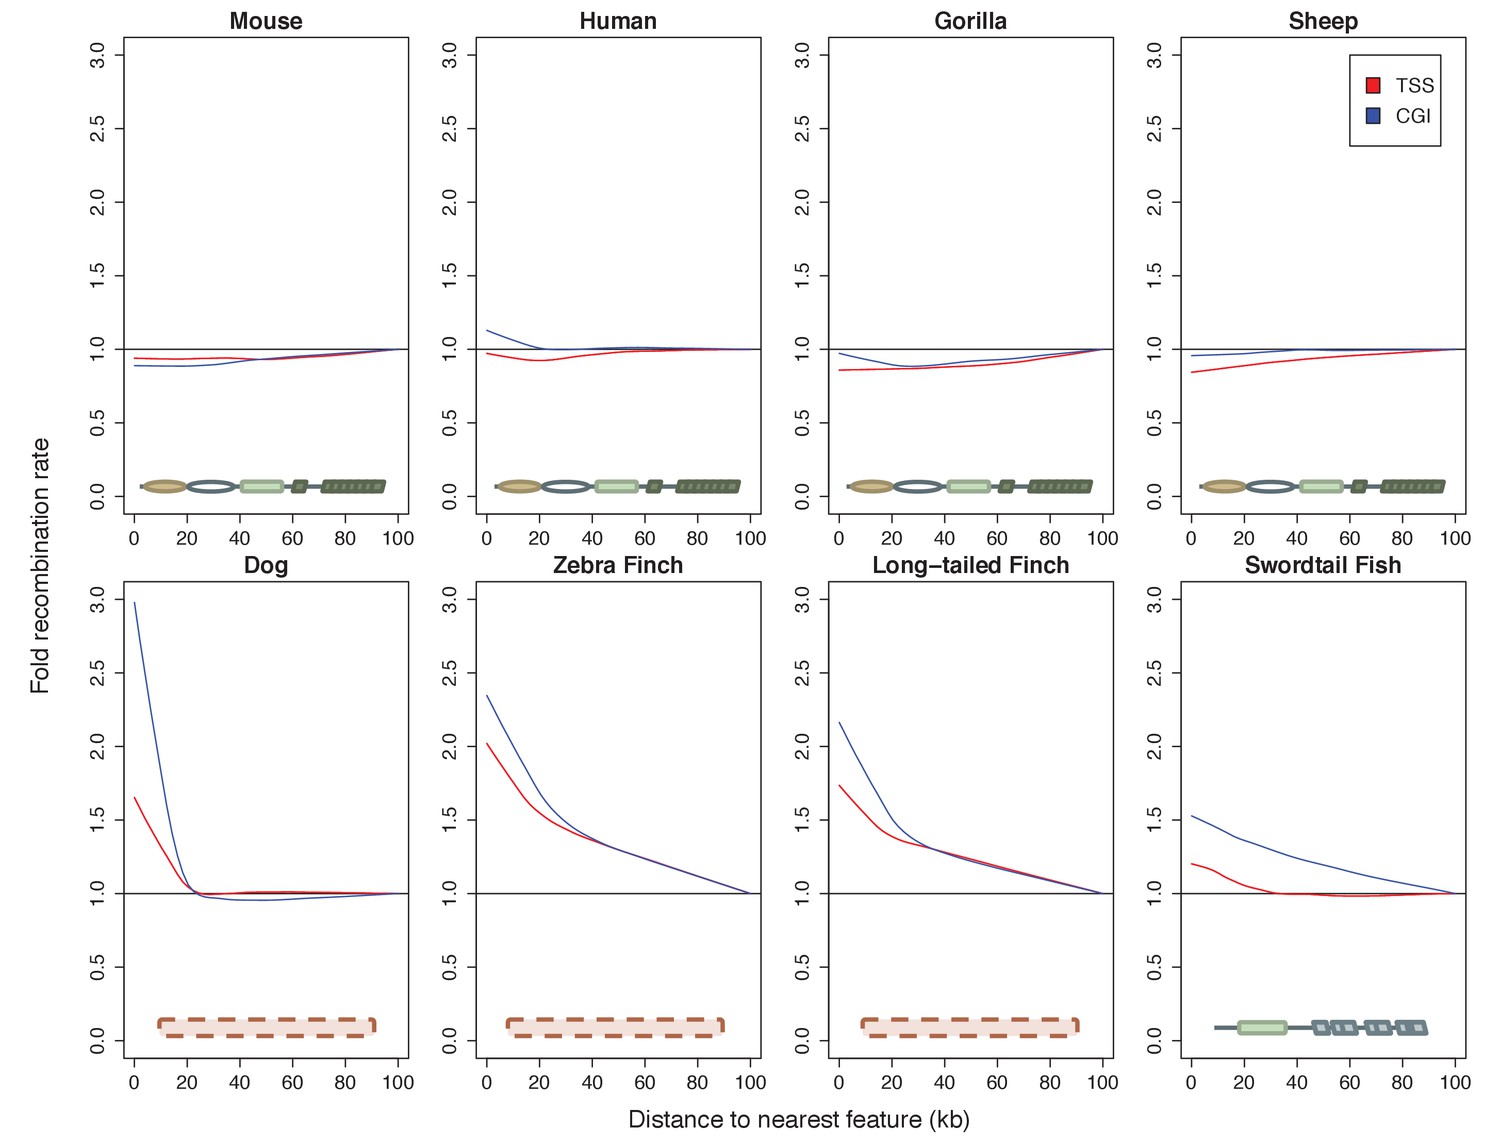
Patterns of recombination near TSSs and CGIs in species with and without complete PRDM9 orthologs.
For each species, recombination rates were binned in 10 kb windows along the genome; curves were fit using gaussian loess smoothing. The fold change in recombination rates shown on the y-axis is relative to recombination rates at the last point shown. Species shown in the top row have complete PRDM9 orthologs (mouse, human, gorilla and sheep), whereas species in the bottom row have no PRDM9 ortholog (dog, zebra finch, long-tailed finch), or a partial PRDM9 ortholog (swordtail fish).
Figure 5—figure supplement 1
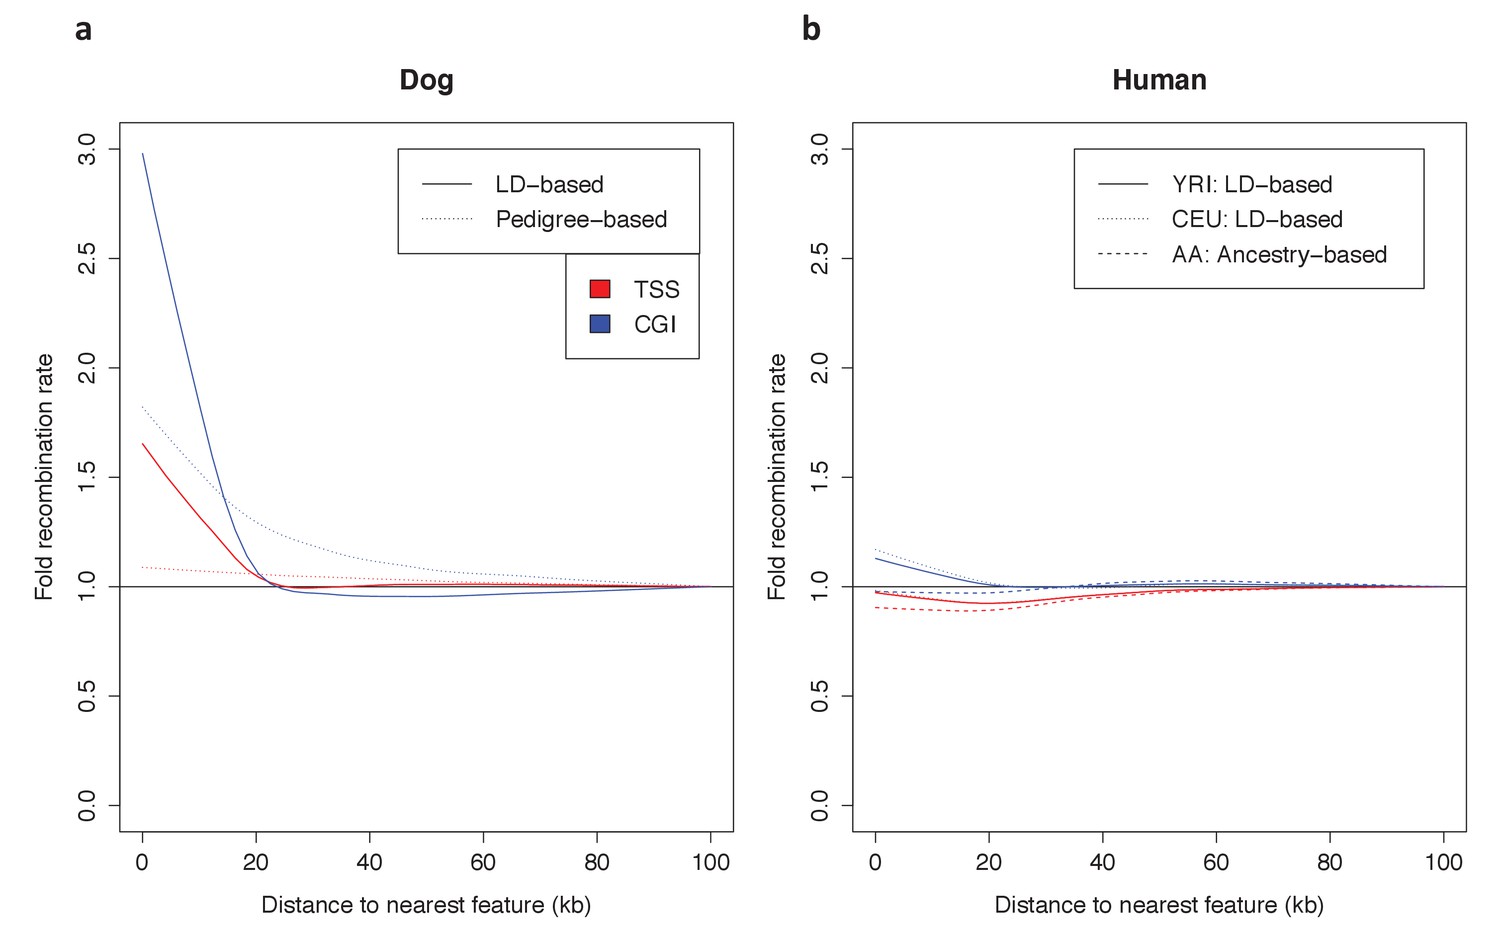
Dependence of patterns of recombination near TSSs and CGIs in dog and human on the type of genetic map.
(a) Recombination rates near the TSS and CGI in dogs are shown using recombination maps inferred either from LD patterns or pedigree data. The magnitude of the peak near these features is lower in the map with lower resolution. This observation raises the possibility that a higher resolution map in swordtail fish would result in a higher peak near these features. (b) Recombination rates near the TSS and CGI in humans are shown using recombination maps inferred either from LD patterns or ancestry switches in African-American samples. Recombination rates near the TSS and CGI in human do not seem to be strongly influenced by the choice of genetic map, though peaks at these features are slightly reduced in admixture- and pedigree-based methods.
Tables
Table 1
Evolution of the ZF in PRDM9 orthologs with different domain architectures. PRDM9 orthologs for which an empirical comparison dataset is available are ordered by their domain structures: from the top, we present cases of complete PRDM9 orthologs with KRAB-SSXRD-SET domains; partial orthologs putatively lacking KRAB or SSXRD domains or partial orthologs lacking both; then those containing only the SET domain. A row is shaded green if the ZF is in the top 5% most rapidly evolving C2H2 ZF in the species, as summarized by the proportion of amino-acid diversity at DNA-binding sites, and is blue if it is ranked first. A complete PRDM9 ortholog from dolphins (Balaenoptera acuforostrata scammoni) is shaded in gray because there is no amino acid diversity between ZFs of the tandem array. The empirical rank is also shown, as are the number of PRDM9 orthologs identified in the species. Asterisks indicate PRDM9 orthologs known to play a role in directing recombination. For PRDM9 genes from teleost fish, under major group, we additionally indicate whether or not the gene is a PRDM9α or PRDM9β gene.
| Organism | Major group | PRDM9 structure | Proportion AA diversity at DNA-binding sites | Rank | Number of PRDM9 genes from species | Number of ZF genes evaluated from species |
|---|---|---|---|---|---|---|
| Balaenoptera acutorostrata scammoni | placental | KRAB-SSXRD-SET | NA | NA | 1 | 272 |
| Bison bison bison | placental | KRAB-SSXRD-SET | 0.667 | 1 | 1 | 285 |
| Bos taurus* (chr1) | placental | KRAB-SSXRD-SET | 0.684 | 1 | 3 | 313 |
| Bos taurus (chrX) | placental | KRAB-SSXRD-SET | 0.414 | 6 | 3 | 313 |
| Bos taurus* (chrX) | placental | KRAB-SSXRD-SET | 0.414 | 7 | 3 | 313 |
| Bubalus bubalis | placental | KRAB-SSXRD-SET | 0.667 | 1 | 1 | 268 |
| Chelonia mydas | turtle | KRAB-SSXRD-SET | 0.414 | 11 | 1 | 235 |
| Chlorocebus sabaeus | placental | KRAB-SSXRD-SET | 0.500 | 1 | 1 | 344 |
| Chrysemys picta bellii | turtle | KRAB-SSXRD-SET | 0.478 | 1 | 1 | 308 |
| Cricetulus griseus | placental | KRAB-SSXRD-SET | 0.781 | 3 | 1 | 259 |
| Dasypus novemcinctus | placental | KRAB-SSXRD-SET | 0.614 | 1 | 1 | 289 |
| Dipodomys ordii | placental | KRAB-SSXRD-SET | 0.567 | 1 | 1 | 194 |
| Esox lucius | teleost fish (α) | KRAB-SSXRD-SET | 0.455 | 1 | 4 | 234 |
| Fukomys damarensis | placental | KRAB-SSXRD-SET | 0.430 | 3 | 1 | 227 |
| Homo sapiens* | placental | KRAB-SSXRD-SET | 0.687 | 1 | 1 | 357 |
| Latimeria chalumnae | coelacanth | KRAB-SSXRD-SET | 0.545 | 2 | 1 | 227 |
| Loxodonta africana | placental | KRAB-SSXRD-SET | 0.617 | 1 | 1 | 381 |
| Macaca fascicularis | placental | KRAB-SSXRD-SET | 0.680 | 1 | 1 | 364 |
| Macaca mulatta | placental | KRAB-SSXRD-SET | 0.645 | 1 | 1 | 366 |
| Marmota marmota marmota | placental | KRAB-SSXRD-SET | 0.483 | 1 | 1 | 277 |
| Microcebus murinus | placental | KRAB-SSXRD-SET | 1.000 | 1 | 1 | 326 |
| Mus musculus* | placental | KRAB-SSXRD-SET | 0.910 | 1 | 1 | 224 |
| Nannospalax galili | placental | KRAB-SSXRD-SET | 1.000 | 1 | 1 | 307 |
| Octodon degus | placental | KRAB-SSXRD-SET | 0.333 | 5 | 3 | 227 |
| Octodon degus | placental | KRAB-SSXRD-SET | 0.331 | 6 | 3 | 227 |
| Ovis aries | placental | KRAB-SSXRD-SET | 0.615 | 1 | 2 | 252 |
| Ovis aries | placental | KRAB-SSXRD-SET | 0.398 | 4 | 2 | 252 |
| Ovis aries musimon | placental | KRAB-SSXRD-SET | 0.353 | 12 | 1 | 285 |
| Papio anubis | placental | KRAB-SSXRD-SET | 0.585 | 1 | 1 | 404 |
| Pelodiscus sinensis | turtle | KRAB-SSXRD-SET | 0.692 | 1 | 1 | 221 |
| Peromyscus maniculatus bairdii | placental | KRAB-SSXRD-SET | 1.000 | 1 | 1 | 243 |
| Protobothrops mucrosquamatus | squamata | KRAB-SSXRD-SET | 0.462 | 5 | 1 | 195 |
| Python bivittatus | squamata | KRAB-SSXRD-SET | 0.571 | 1 | 1 | 206 |
| Rattus norvegicus | placental | KRAB-SSXRD-SET | 0.570 | 1 | 1 | 255 |
| Rousettus aegyptiacus | placental | KRAB-SSXRD-SET | 0.742 | 1 | 1 | 258 |
| Salmo salar | teleost fish (α) | KRAB-SSXRD-SET | 0.538 | 9 | 4 | 510 |
| Salmo salar | teleost fish (α) | KRAB-SSXRD-SET | 0.500 | 11 | 4 | 510 |
| Sus scrofa | placental | KRAB-SSXRD-SET | 0.542 | 1 | 1 | 248 |
| Thamnophis sirtalis | squamata | KRAB-SSXRD-SET | 0.459 | 3 | 1 | 179 |
| Tupaia chinensis | placental | KRAB-SSXRD-SET | 1.000 | 1 | 1 | 249 |
| Tursiops truncatus | placental | KRAB-SSXRD-SET | 0.939 | 1 | 1 | 233 |
| Myotis lucifugus | placental | SSXRD-SET | 0.524 | 1 | 2 | 308 |
| Myotis lucifugus | placental | SSXRD-SET | 0.310 | 68 | 2 | 308 |
| Octodon degus | placental | SSXRD-SET | 0.282 | 46 | 3 | 227 |
| Sarcophilus harrisii | marsupial | SSXRD-SET | 0.224 | 277 | 2 | 344 |
| Callorhinchus millii | cartilaginous fish | KRAB-SET | 0.314 | 6 | 1 | 63 |
| Astyanax mexicanus | teleost fish (α) | SET | 0.258 | 60 | 2 | 158 |
| Astyanax mexicanus | teleost fish (β) | SET | 0.167 | 152 | 2 | 158 |
| Clupea harengus | teleost fish (α) | SET | 0.279 | 6 | 4 | 118 |
| Clupea harengus | teleost fish (α) | SET | 0.278 | 7 | 4 | 118 |
| Clupea harengus | teleost fish (α) | SET | 0.274 | 10 | 4 | 118 |
| Clupea harengus | teleost fish (β) | SET | 0.158 | 114 | 4 | 118 |
| Cynoglossus semilaevis | teleost fish (β) | SET | 0.182 | 80 | 1 | 107 |
| Danio rerio | teleost fish (β) | SET | 0.179 | 345 | 1 | 367 |
| Esox lucius | teleost fish (α) | SET | 0.295 | 32 | 4 | 234 |
| Esox lucius | teleost fish (β) | SET | 0.192 | 176 | 4 | 234 |
| Esox lucius | teleost fish (β) | SET | 0.192 | 177 | 4 | 234 |
| Fundulus heteroclitus | teleost fish (β) | SET | 0.189 | 158 | 1 | 206 |
| Haplochromis burtoni | teleost fish (β) | SET | 0.180 | 148 | 1 | 168 |
| Ictalurus punctatus | teleost fish (α) | SET | 0.320 | 14 | 8 | 140 |
| Ictalurus punctatus | teleost fish (α) | SET | 0.319 | 15 | 8 | 140 |
| Ictalurus punctatus | teleost fish (α) | SET | 0.306 | 24 | 8 | 140 |
| Ictalurus punctatus | teleost fish (α) | SET | 0.303 | 25 | 8 | 140 |
| Ictalurus punctatus | teleost fish (α) | SET | 0.286 | 33 | 8 | 140 |
| Ictalurus punctatus | teleost fish (α) | SET | 0.276 | 39 | 8 | 140 |
| Ictalurus punctatus | teleost fish (α) | SET | 0.253 | 55 | 8 | 140 |
| Ictalurus punctatus | teleost fish (β) | SET | 0.179 | 127 | 8 | 140 |
| Larimichthys crocea | teleost fish (β) | SET | 0.192 | 70 | 1 | 115 |
| Lepisosteus oculatus | holostei fish | SET | 0.223 | 48 | 1 | 106 |
| Maylandia zebra | teleost fish (β) | SET | 0.173 | 161 | 1 | 176 |
| Neolamprologus brichardi | teleost fish (β) | SET | 0.173 | 141 | 1 | 152 |
| Nothobranchius furzeri | teleost fish (β) | SET | 0.180 | 245 | 1 | 266 |
| Notothenia coriiceps | teleost fish (β) | SET | 0.167 | 83 | 1 | 87 |
| Oreochromis niloticus | teleost fish (β) | SET | 0.173 | 173 | 1 | 190 |
| Oryzias latipes | teleost fish (β) | SET | 0.213 | 104 | 1 | 191 |
| Otolemur garnettii | placental | SET | 0.266 | 121 | 1 | 285 |
| Poecilia formosa | teleost fish (β) | SET | 0.191 | 184 | 1 | 242 |
| Poecilia latipinna | teleost fish (β) | SET | 0.191 | 175 | 1 | 235 |
| Poecilia mexicana | teleost fish (β) | SET | 0.191 | 187 | 1 | 244 |
| Poecilia reticulata | teleost fish (β) | SET | 0.191 | 162 | 1 | 212 |
| Pundamilia nyererei | teleost fish (β) | SET | 0.173 | 134 | 1 | 147 |
| Pygocentrus nattereri | teleost fish (α) | SET | 0.331 | 12 | 2 | 142 |
| Pygocentrus nattereri | teleost fish (β) | SET | 0.179 | 124 | 2 | 142 |
| Salmo salar | teleost fish (β) | SET | 0.188 | 411 | 4 | 510 |
| Salmo salar | teleost fish (β) | SET | 0.180 | 454 | 4 | 510 |
| Sinocyclocheilus anshuiensis | teleost fish (β) | SET | 0.185 | 224 | 2 | 284 |
| Sinocyclocheilus anshuiensis | teleost fish (β) | SET | 0.185 | 225 | 2 | 284 |
| Sinocyclocheilus grahami | teleost fish (β) | SET | 0.185 | 211 | 1 | 271 |
| Sinocyclocheilus rhinocerous | teleost fish (β) | SET | 0.185 | 208 | 2 | 269 |
| Sinocyclocheilus rhinocerous | teleost fish (β) | SET | 0.185 | 209 | 2 | 269 |
| Takifugu rubripes | teleost fish (β) | SET | 0.188 | 66 | 1 | 98 |
| Xiphophorus maculatus | teleost fish (β) | SET | 0.191 | 117 | 1 | 158 |
Additional files
-
Supplementary file 1
(A) PRDM9 orthologs identified in RefSeq and whole genome databases.
Includes which amino acids align to each of three catalytic tyrosine residues of the human PRDM9 SET domain for each PRDM9 ortholog. (B) Genomes targeted for the PRDM9 search. Major groups or individual species lacking PRDM9 in RefSeq were targeted for further analysis of their whole genome sequences, with the exception of previously reported bird and crocodilian losses. Species included and results of this search are reported here.
- https://doi.org/10.7554/eLife.24133.022
-
Supplementary file 2
(A) Accession numbers and assembly descriptions of publicly available testes RNAseq samples used for de novo assembly and assessment of PRDM9 expression.
N50 describes the shortest contig length in which 50% of the assembled transcriptome is contained. (B) Summary of expression results of PRDM9 in the testis in representative species from major taxa. Only species that passed the core recombination protein quality test (see Materials and methods, Supplementary file 2D) are included in this table, with the exception of cases, indicated with asterisks, in which PRDM9 was detected but one or more conserved recombination proteins were not. (C) Results of a rpsblast search of assembled transcriptomes and a reciprocal best blast test to PRMD9. Domain structures found in transcripts that blasted to PRDM9 for each species are also listed. (D) Results of the core recombination protein test for each species for which a transcriptome was assembled. Blue shading indicates that a reciprocal best blast test did not identify the gene in the transcriptome.
- https://doi.org/10.7554/eLife.24133.023
-
Supplementary file 3
(A) Rates of amino acid evolution in SET domains of representative PRDM9 orthologs lacking other functional domains.
To determine whether PRDM9 orthologs lacking functional domains are non-functional, we compared rates of evolution between each PRDM9 ortholog missing a domain and another sequence (listed here) with the complete domain structure. The number of aligned bases and the results of a likelihood ratio test of non-neutral versus neutral evolution are also shown. See Methods for details. (B) Amino acid diversity levels of PRDM9 ZF arrays and the proportion localized to known DNA-binding residues. Columns labeled V1-V28 indicate the amount of amino acid diversity observed at each amino acid in the ZF array. For each gene, we also report the ranking of this proportion relative to all other C2H2 ZF genes from the same species, when such a ranking was feasible. This table additionally includes the average percent DNA identity between ZFs used in our analysis of rapid evolution. (C) Results of the likelihood ratio test of neutral versus not non-neutral evolution along the SET domain of mammalian PRDM9 orthologs lacking a KRAB or SSXRD domain, as annotated in RefSeq (see Materials and methods). We also indicate whether another annotated ortholog exists with a KRAB domain.
- https://doi.org/10.7554/eLife.24133.024
-
Supplementary file 4
R script to convert GenPept/GenBank files for RefSeq genes into table format.
- https://doi.org/10.7554/eLife.24133.025
-
Supplementary file 5
Shell script to perform reciprocal best blast search of transcripts from de novo assembly of testis transcriptomes.
- https://doi.org/10.7554/eLife.24133.026
Download links
A two-part list of links to download the article, or parts of the article, in various formats.
Downloads (link to download the article as PDF)
Open citations (links to open the citations from this article in various online reference manager services)
Cite this article (links to download the citations from this article in formats compatible with various reference manager tools)
Repeated losses of PRDM9-directed recombination despite the conservation of PRDM9 across vertebrates
eLife 6:e24133.
https://doi.org/10.7554/eLife.24133


