Digitizing mass spectrometry data to explore the chemical diversity and distribution of marine cyanobacteria and algae
- University of California San Diego, United States
- Scripps Institution of Oceanography, University of California San Diego, United States
- European Molecular Biology Laboratory, Germany
Figures
Figure 1
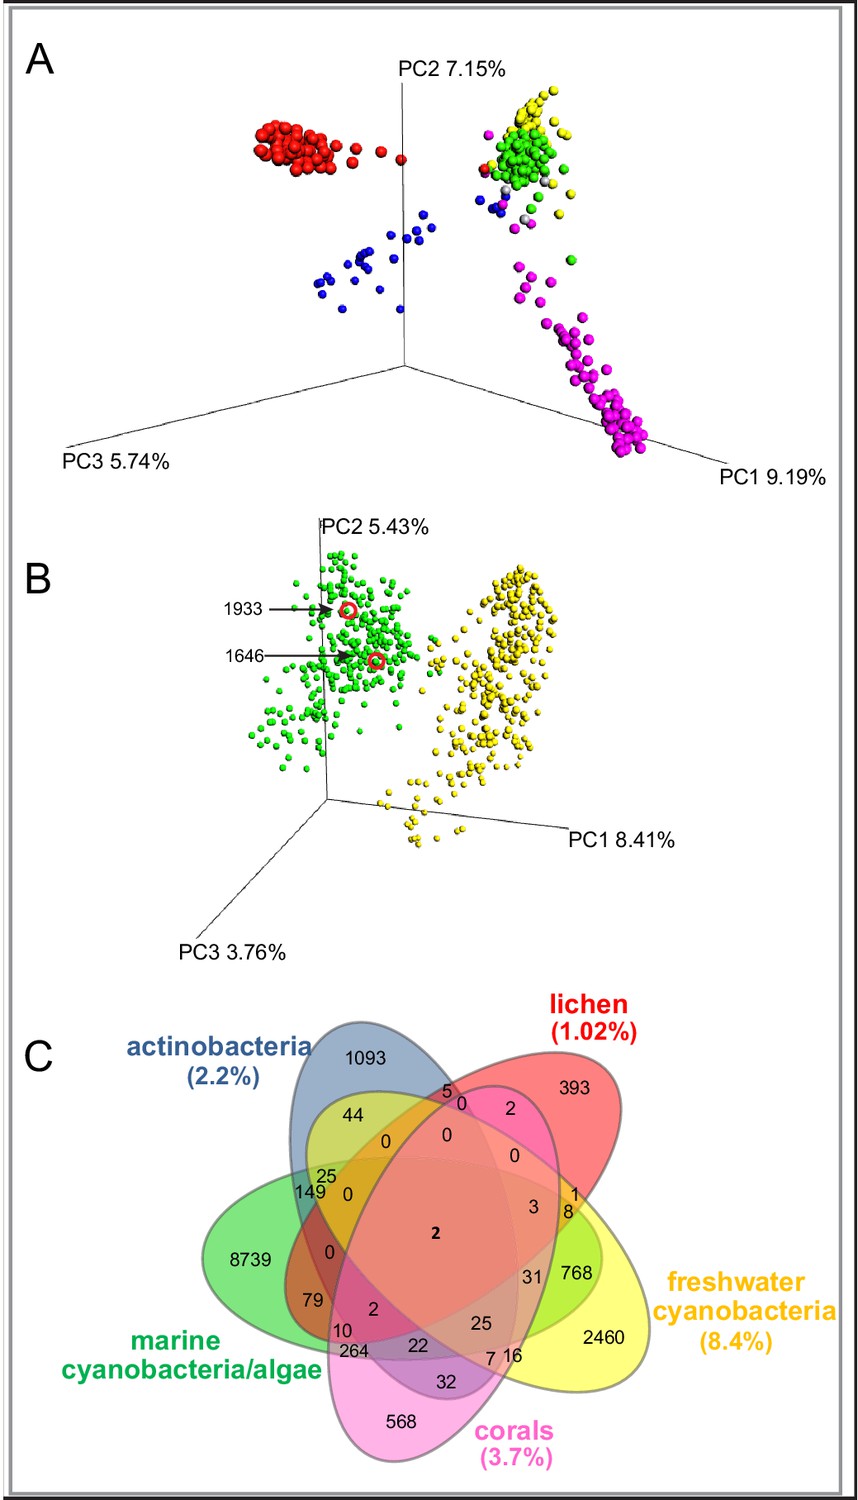
MS/MS features as generated in GNPS are shown for marine cyanobacteria and algae (green), marine and terrestrial actinobacteria (blue), lichens (red), freshwater cyanobacteria (yellow) and corals (pink).
(A) PCoA plots of 300 samples randomly selected from each dataset display the distance between samples based on molecular features using Bray-Curtis dissimilarity matrix. (B) Marine cyanobacteria and algae and freshwater cyanobacteria. Laboratory cultures of Phormidium 1646, Lyngbya 1933 are highlighted in red circles. Each sphere represents the full sample metabolome (C) Venn diagram display of overlapping MS/MS features. Percentage of overlapping features with the marine cyanobacteria and algae dataset are given in parenthesis in their respective colors (Supplementary file 1).
Figure 2 with 1 supplement
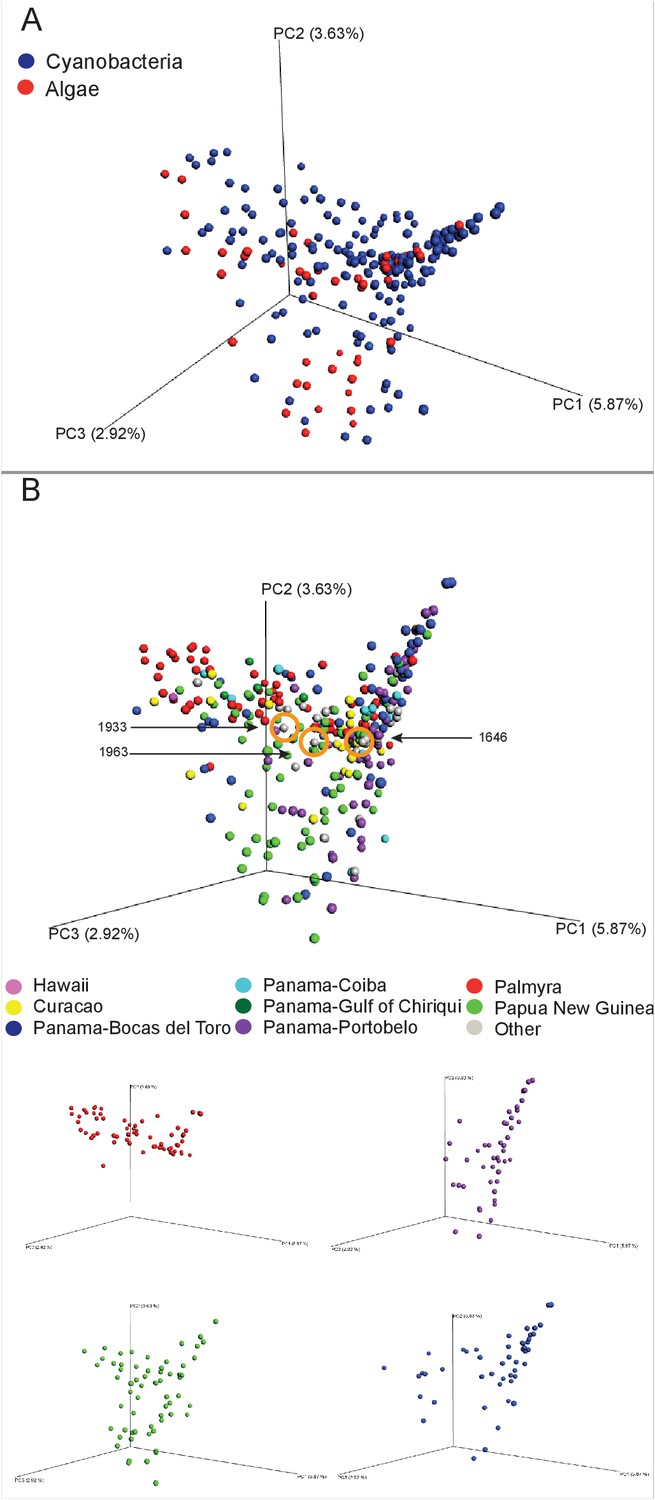
MS/MS feature diversity between and within sampling sites.
PCoA plots of crude extract molecular features using Bray-Curtis, dissimilarity matrix. Each point represents a single sample and points are colored by metadata. (A) PCoA plot shows the distance between samples based on field identified classification. (B) PCoAs color coded by geographical origin shows the distance of all locations together (B: upper panel) and the individual PCoA plots of the four collection sites with most samples (B: lower panel). Laboratory cultures of Phormidium 1646, Lyngbya 1933 and Lyngbya 1963 are highlighted in orange circles.
Figure 2—figure supplement 1
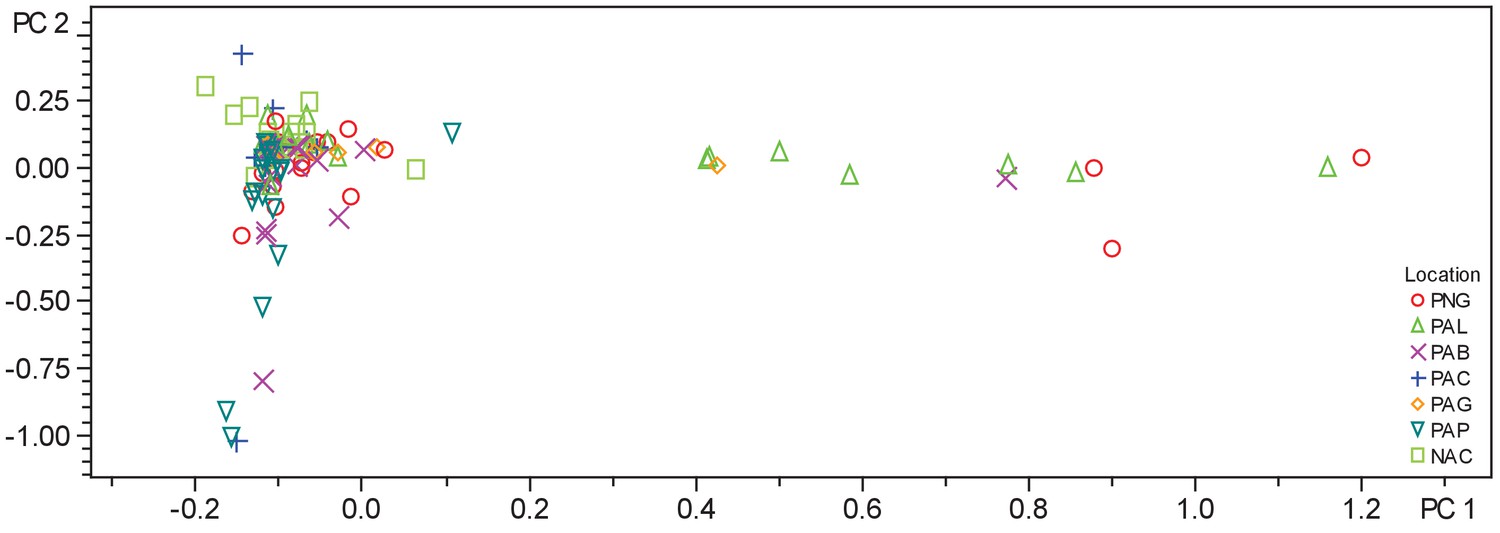
PCA plot of crude extracts of cyanobacteria and algae collections.
PCA was performed using Bruker Profile Analysis software version 2.1. Samples are displayed by collection location as described in the legend. NAC-Curacao, PAB-Panama Bocas del Toro, PAC-Panama Coiba, PAG-Panama Gulf of Chiriqui, PAP-Panama Portobelo, PAL-Palmyra Atoll, PNG-Papua New Guinea.
Figure 3 with 3 supplements
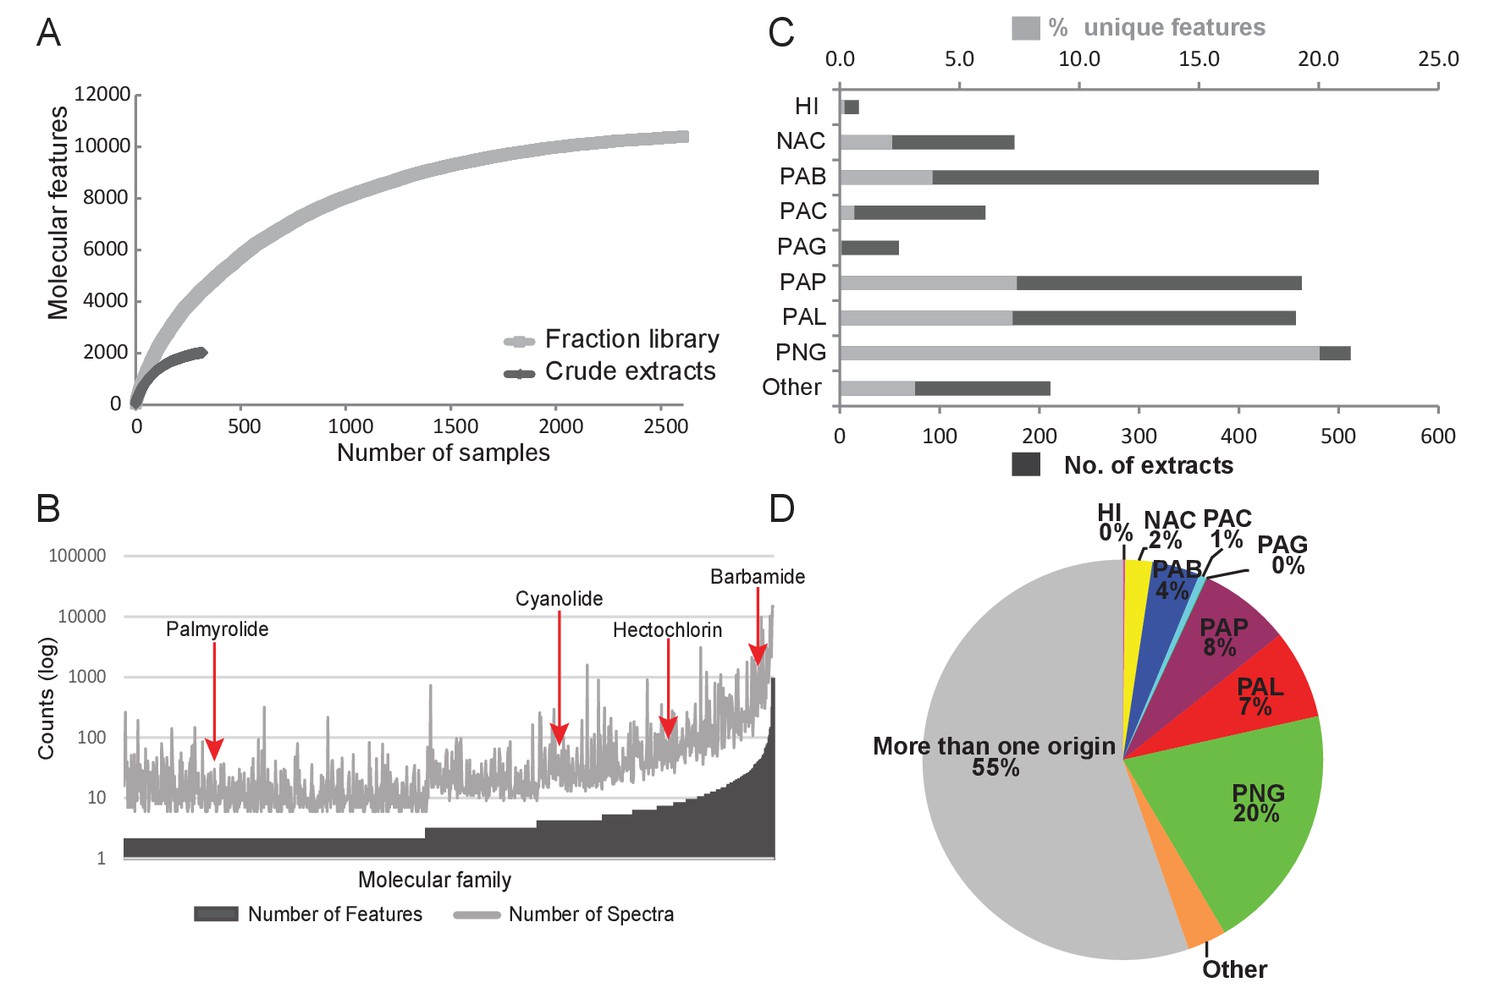
Chemodiversity and richness of molecular features based on MS/MS data.
(A) Rarefaction curve of cyanobacteria collection library showing the chemical richness of crude extracts vs. the fraction library. (B) Abundance of molecular families: Bars represent the number of features and spectra comprising each molecular family clustered by GNPS molecular networking. (C) Bar chart depicting both the total number of extracts from a given location and the percent contribution of unique features to the entire dataset. (D) Pie chart representing the percentage of unique molecular features attributed to origin of the sample. HI-Hawaii, NAC-Curacao, PAB-Panama Bocas del Toro, PAC-Panama Coiba, PAG-Panama Gulf of Chiriqui, PAP-Panama Portobelo, PAL-Palmyra Atoll, PNG-Papua New Guinea.
Figure 3—figure supplement 1

Molecular network of marine cyanobacterial natural products with annotated molecular families.
(A) Molecular networking generated using MSV000078568/MSV000078892 datasets by http://gnps.ucsd.edu and visualized in Cytoscape. A-malyngamides [M+H]+, B-barbamides [M+H]+, C-curacins [M+H]+, D-hectochlorins [M+H]+, E-viequeamides [M+Na]+, F-carmabins [M+H]+, G-palmyramides [M+Na]+, H-palmyramides [M+H]+, I-dolastatins [M + 2 hr]+, J- cyanolides [M+H]+, K-apratoxins [M+H]+, L-hoiamides [M+H]+, M-hoiamides [M+Na]+, N-majusculamides [M+Na]+, O-hectochlorins [M+Na]+, P-palmyrolides [M+H]+. Spectral data dereplicated by fragmentation patterns present in spectral libraries available on GNPS. Nodes are color-coded by the geographical origin of the sample and labeled with parent mass (m/z). Edge thickness represents the cosine similarity score. Insets on right hand side depict the (B) barbamide and (C) cyanolide molecular families. Shown for each are the standard library spectrum (upper panel) and the matching sample spectrum from within the same node (lower panel).
Figure 3—figure supplement 2
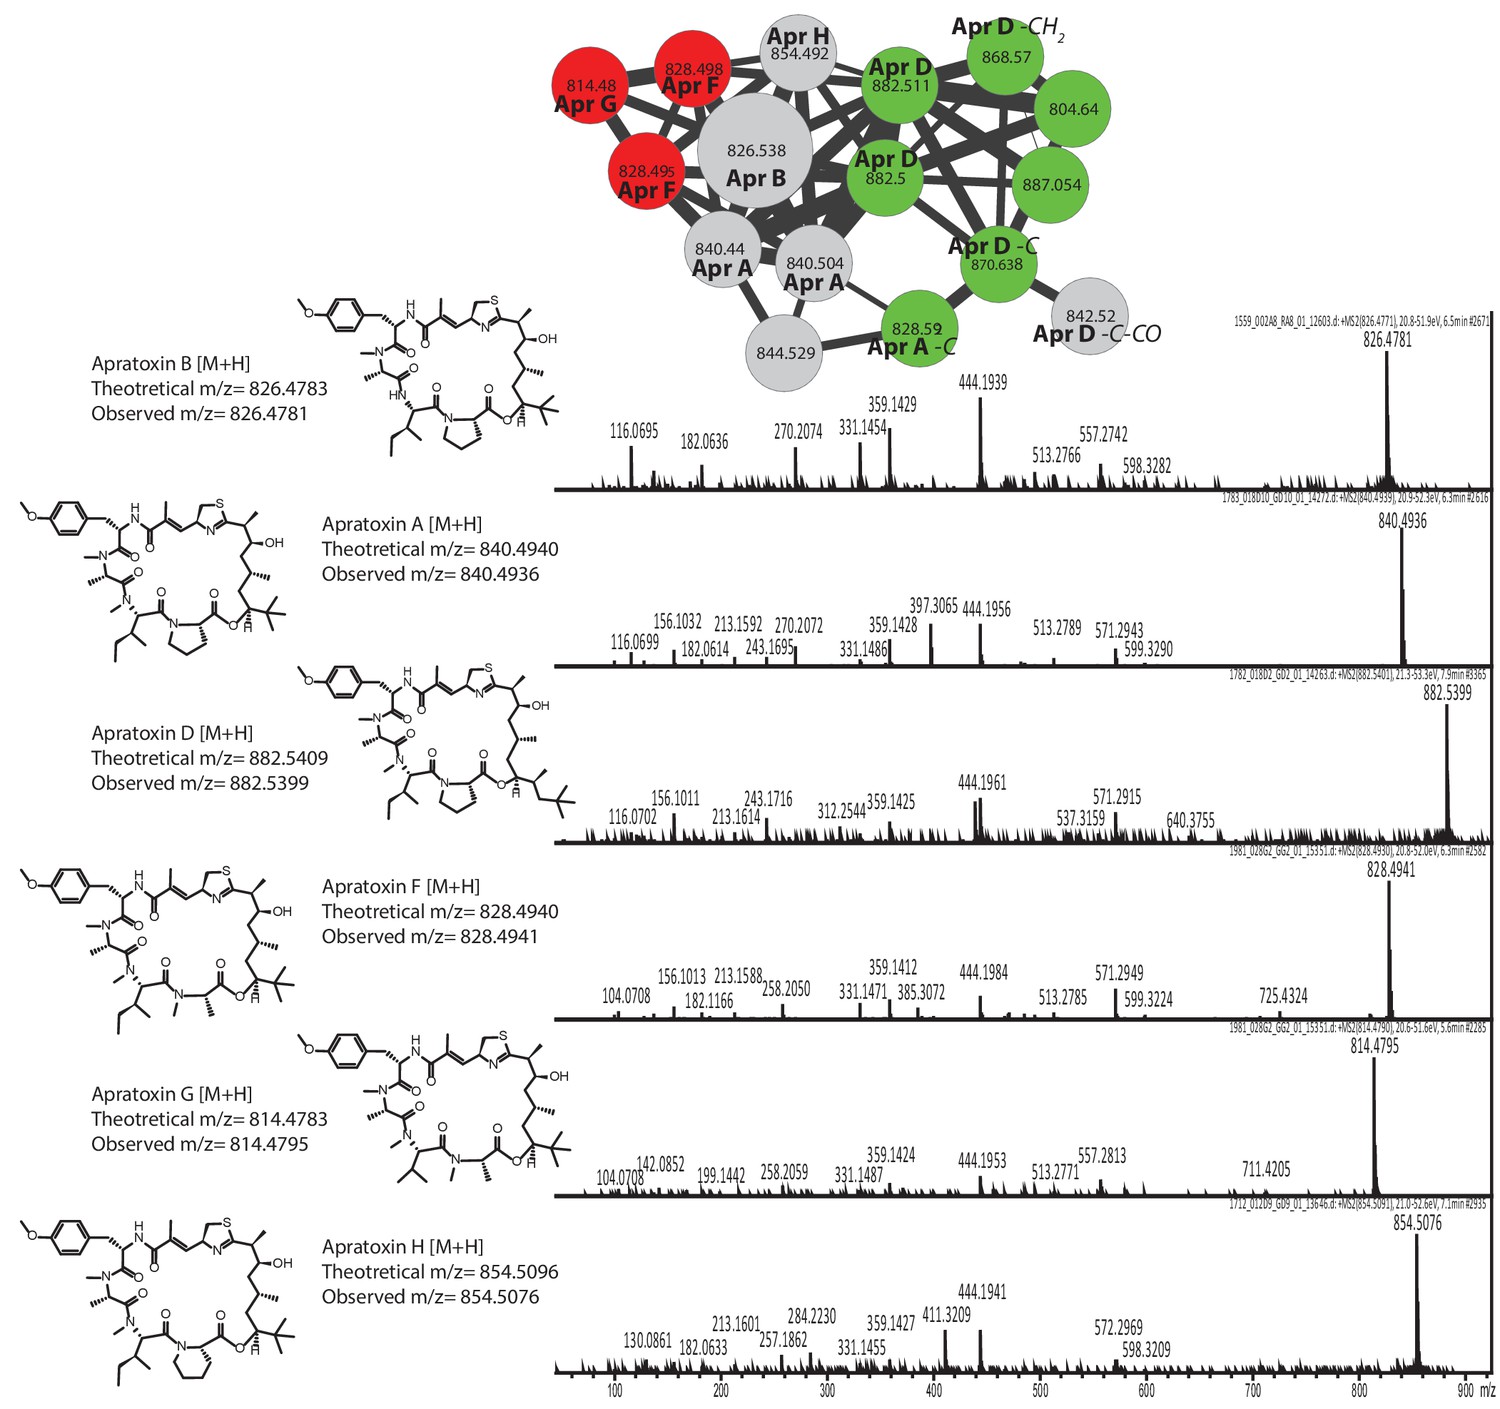
Dereplication of the apratoxin molecular family.
Identification of apratoxin B based on library standards enabled dereplication of 5 known apratoxins (A, D, F, G, and H). Additional apratoxin derivatives were characterized based on mass differences of functional groups.
Figure 3—figure supplement 3

Dereplication and spatial distribution for new derivatives of the barbamide molecular family.
Based on barbamide (1) dereplication, peaks assigned to fragments enable the characterization of N-demethylbarbamide (2) and a substitution of the Phe and Leu groups as a new barbamide derivative (3).
Figure 4
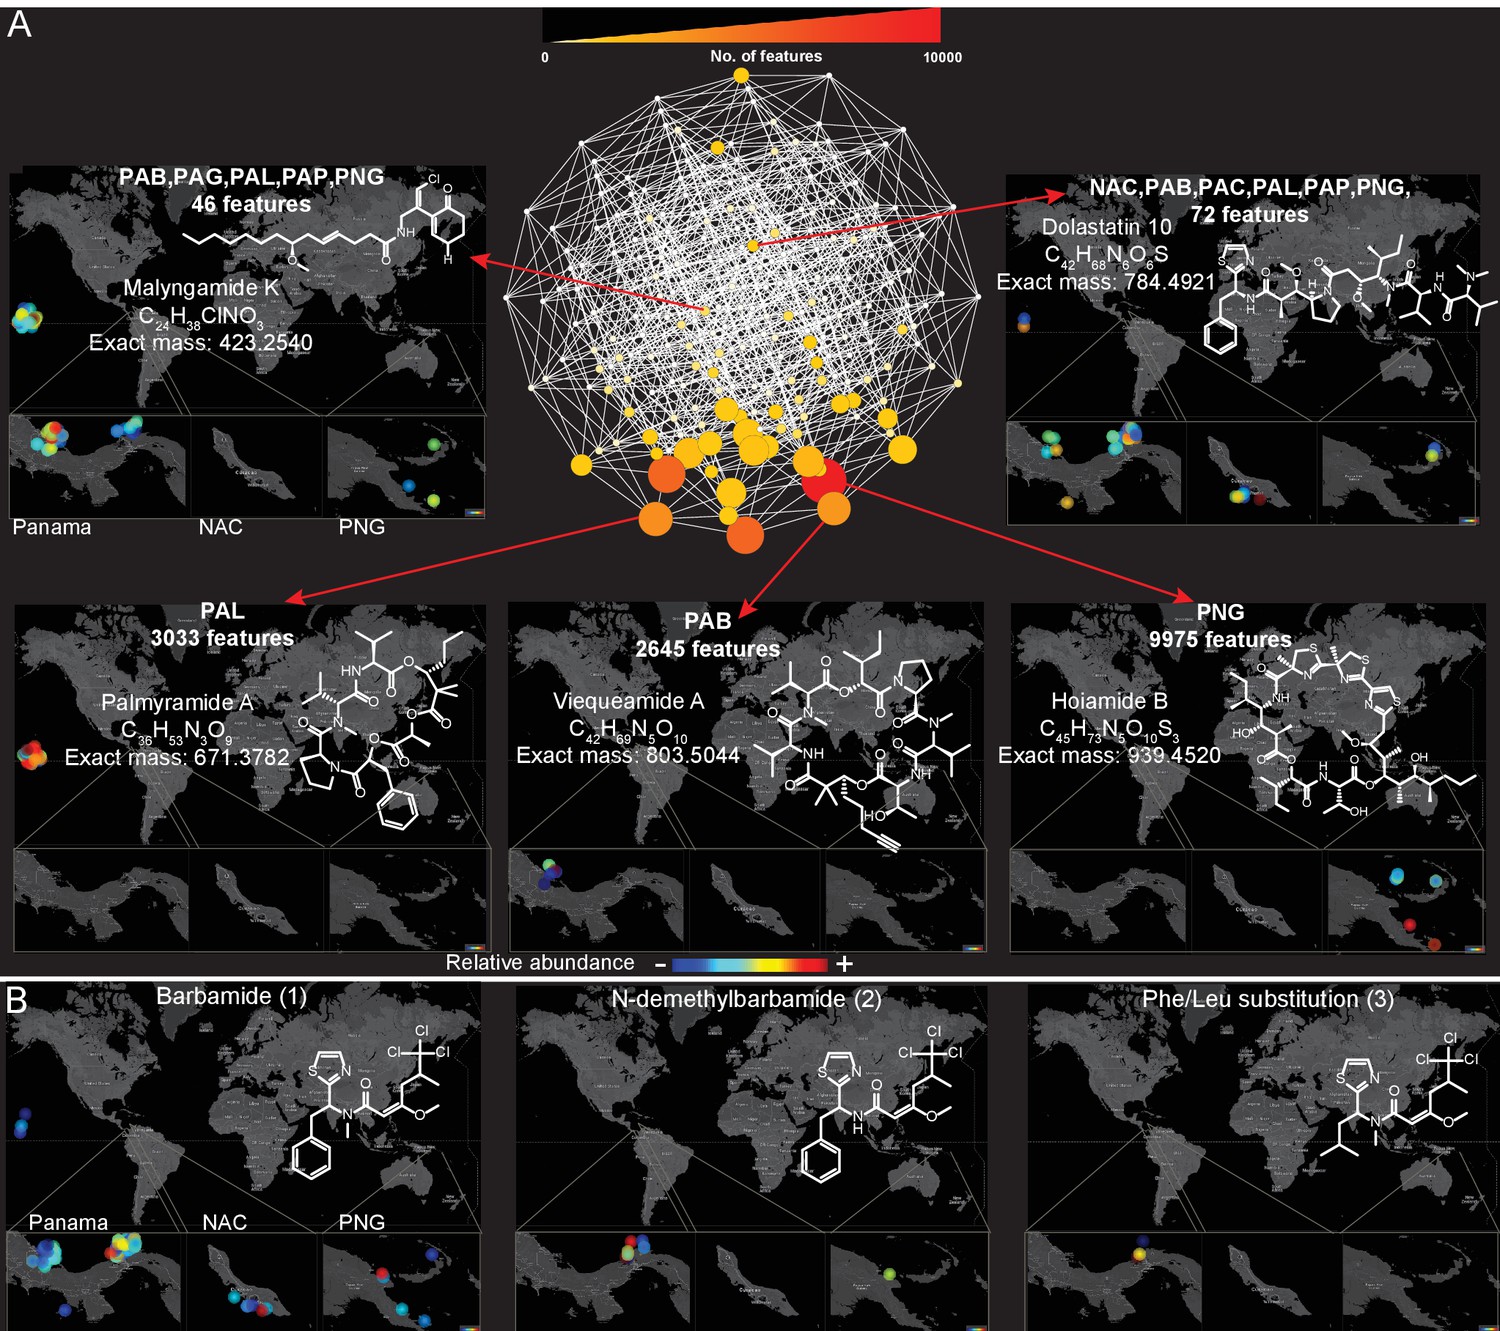
Spatial maps showing the geographic distribution of selected cyanobacterial natural products.
(A) Features were binned by their distribution patterns across the eight main geographical locations, each bin represented by a node with edges linking bins differing by one location. Number of features in each bin is presented according to size and color scale from white (0) to red (10,000) as indicated by the scale bar on the top. Spatial patterns are represented for selected natural products within these bins. Inserts in each map display zoomed-in sections of Panama, Curaçao and Papua New Guinea. Each sample is designated to a specific coordinate based on GPS coordinates of the collection site (multiple samples are represented by spots placed around the collection site). See the URL provided below. (B) Spatial maps display chemogeographical distribution and abundance of barbamide (1) and two barbamide analogs (2, 3). Relative abundance is presented by Jet color scale from low (blue) to high (red). HI-Hawaii, NAC-Curaçao, PAB-Panama Bocas del Toro, PAC-Panama Coiba, PAG-Panama Gulf of Chiriqui, PAP-Panama Portobelo, PAL-Palmyra Atoll, PNG-Papua New Guinea.
(To use the open source tool ‘ili please open the following link in Google Chrome: http://ili-toolbox.github.io/?cyano/bg.png;cyano/intensities.csv. Please wait until the data is loaded and visualized, then click on the Mapping submenu, and change the scale to Logarithmic, and Color map to Jet. For flipping through maps corresponding to different molecules, please click on the name of the molecule shown above the colorbar and select another molecule either with a click or with up-down arrow keys. Alternatively, you can refer to the example tab and choose cyanobacteria natural products. If you experience any problems, please contact theodore.alexandrov@embl.de.)
Figure 5 with 3 supplements
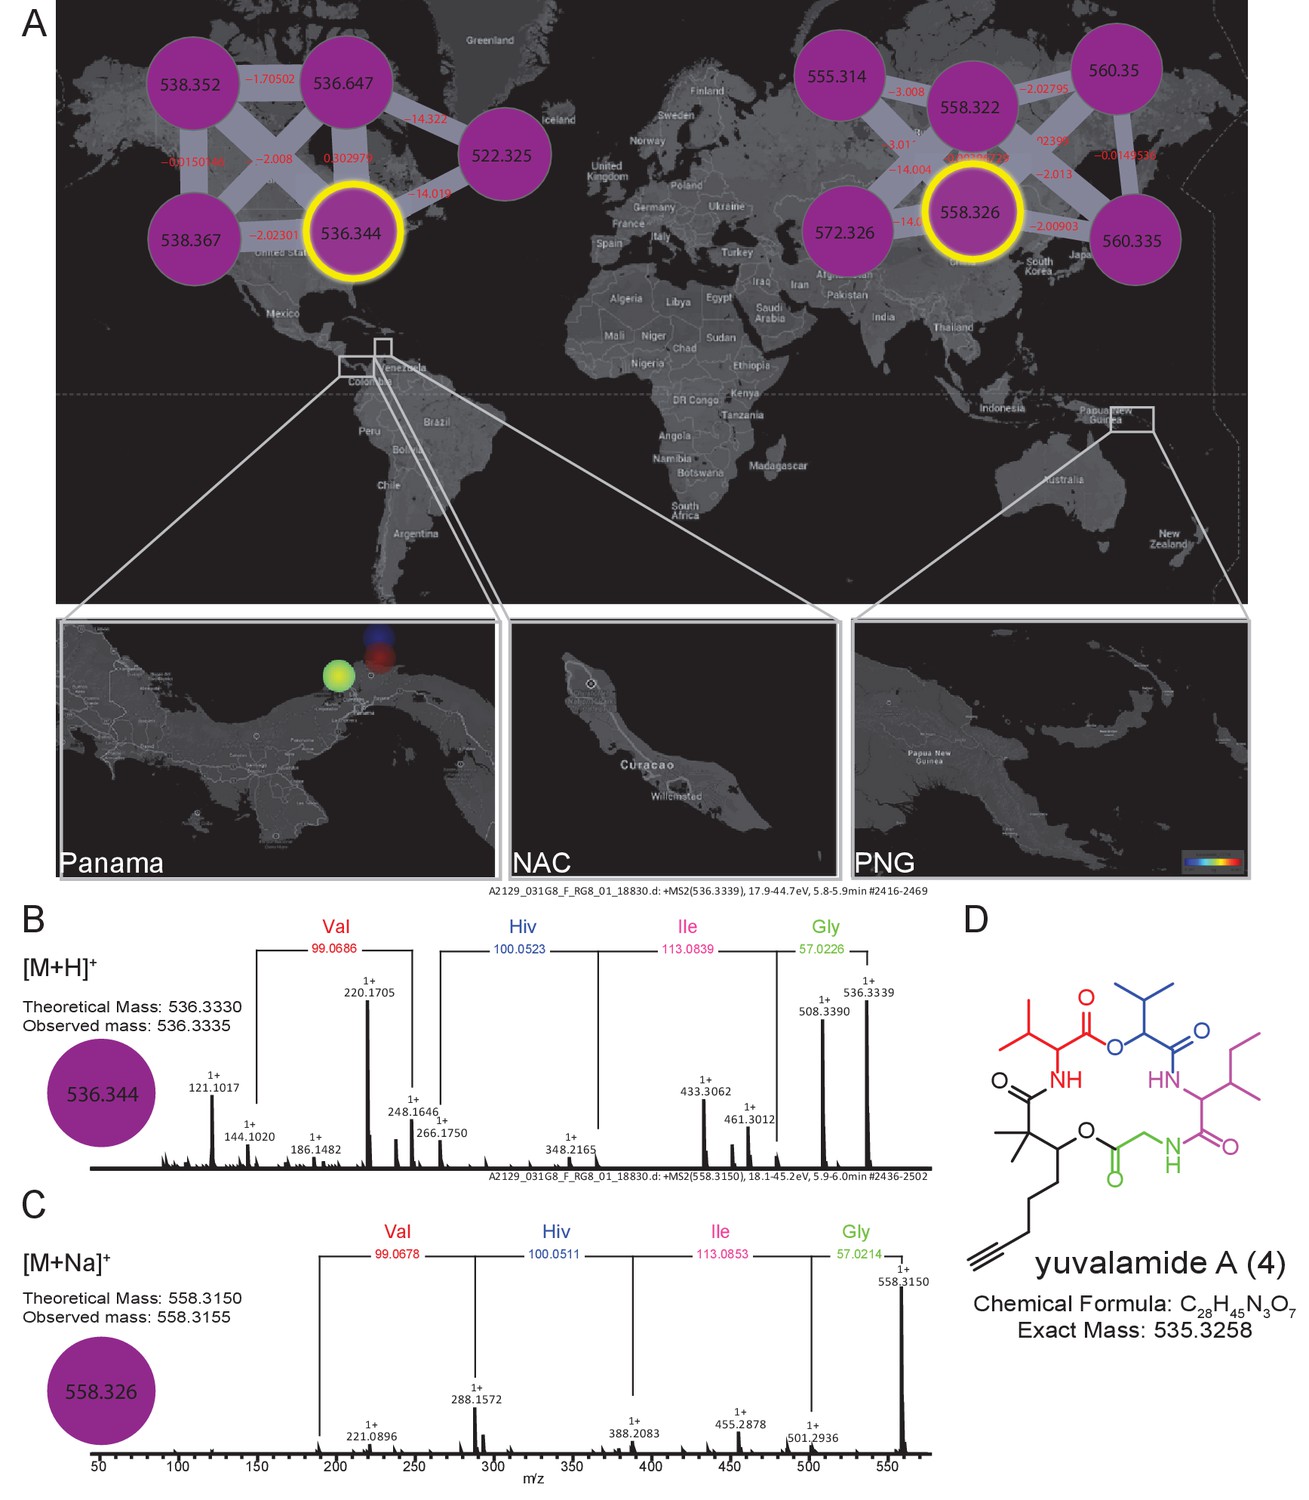
The molecular family and structure elucidation of a novel natural product yuvalamide A (4), isolated from a Panama-Portobelo (PAP) cyanobacterial collection.
(A) Molecular families and the spatial distribution of yuvalamide A [M+H]+ and [M+Na]+ ions are highlighted within yellow circles. MS/MS spectra display the linear structure for the non-ribosomal peptide (NRP) fragments Gly-Ile-Hiv-Val. (B) for the [M+H]+ and the (C) [M+Na]+ ions. (D) The full elucidated structure of yuvalamide A (4) as confirmed by NMR analysis (Figure 5—figure supplements 1 and 2, Supplementary file 3).
Figure 5—figure supplement 1
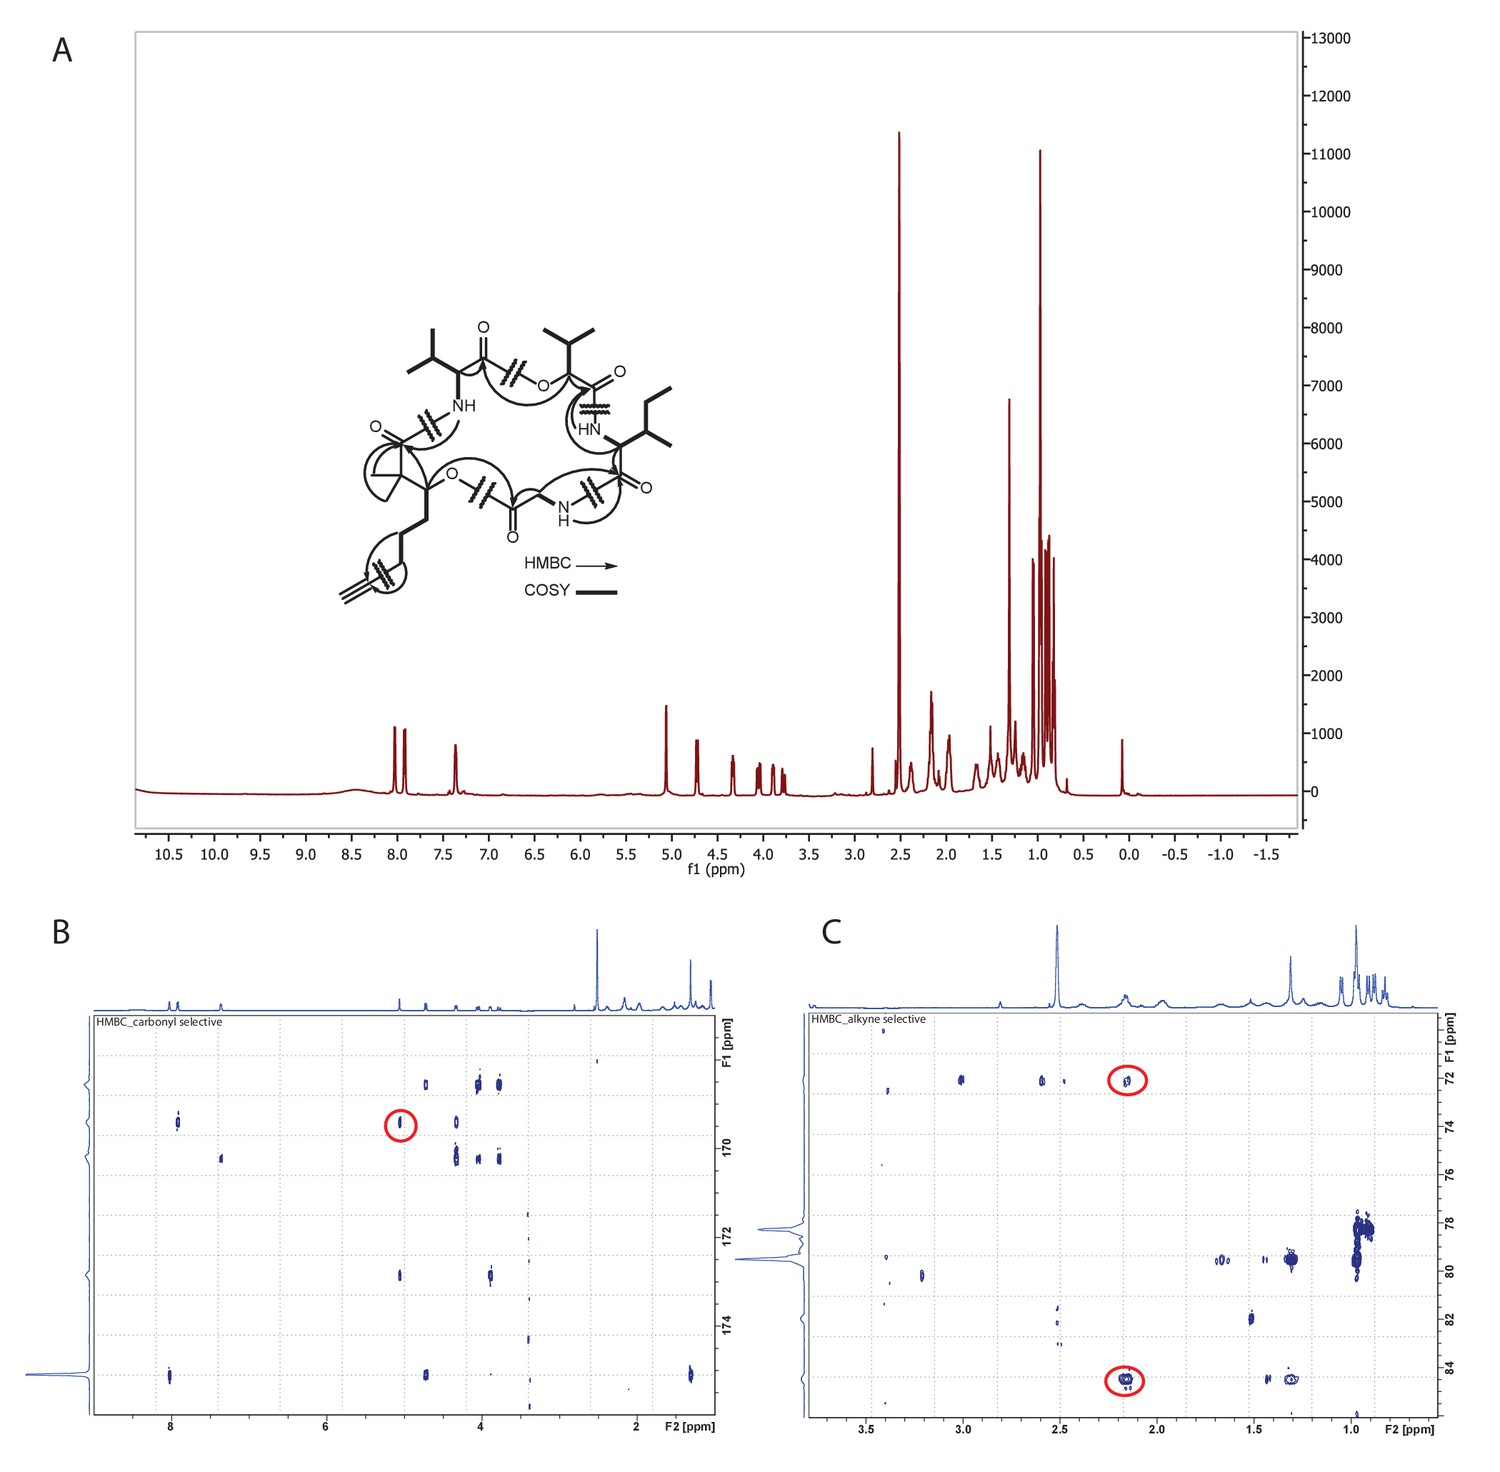
Structure identification of yuvalamide A.
(A) 1H NMR spectrum of yuvalamide A with COSY and key HMBC correlations (600 Hz, DMSO-d6). (B) HMBC correlation of Dhoya-H3 - Gly-CO. (C) HMBC correlation of Dhoya-H6 - C7 and H6-C8.
Figure 5—figure supplement 2
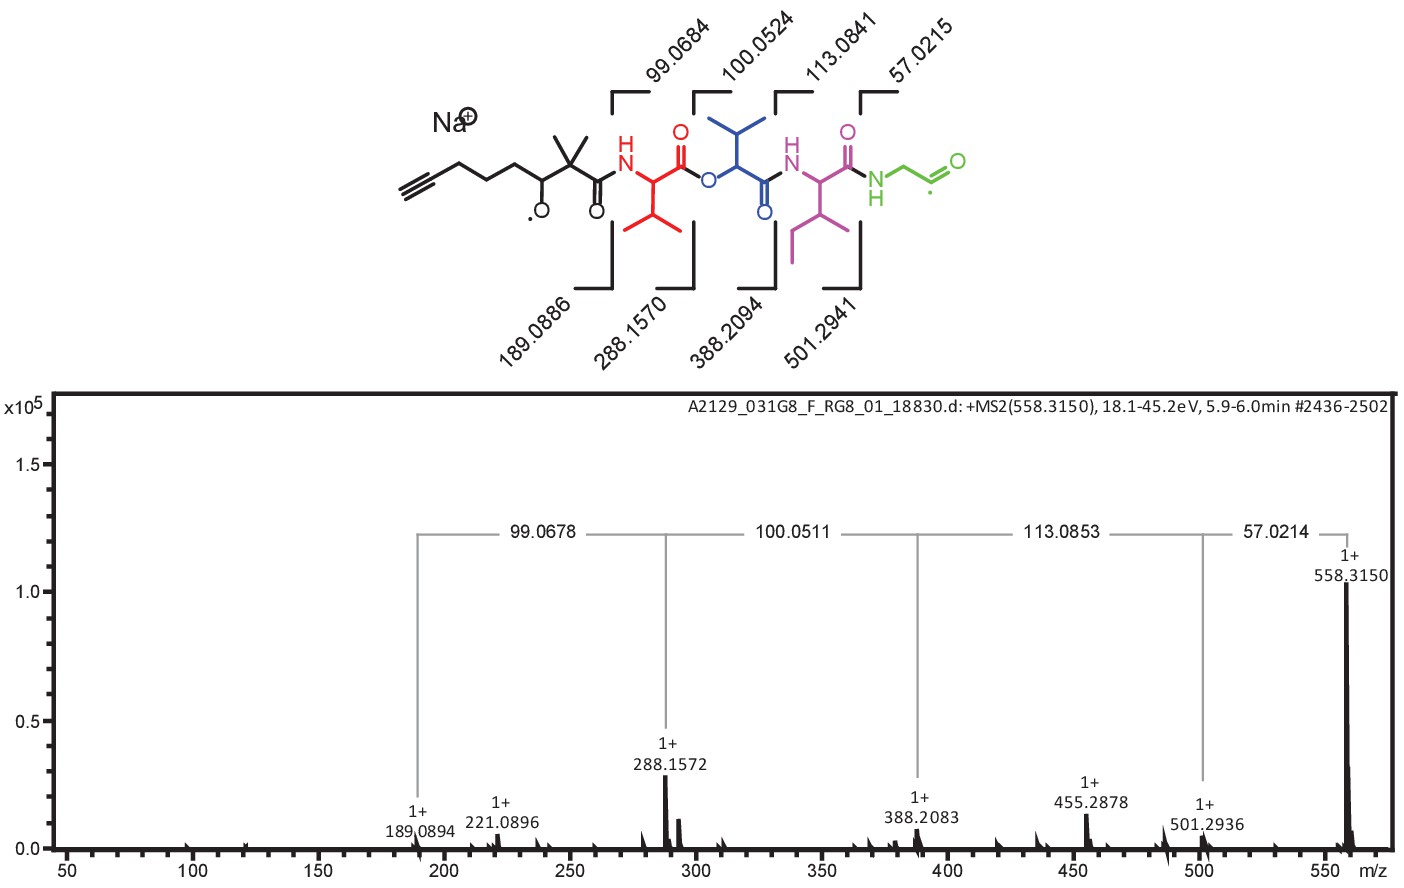
MS/MS fragmentation of yuvalamide A.
The theoretical masses of predicted MS/MS fragments of yuvalamide A are shown in the top panel. The observed masses of these MS/MS fragments are labelled in the acquired spectrum.
Figure 5—figure supplement 3
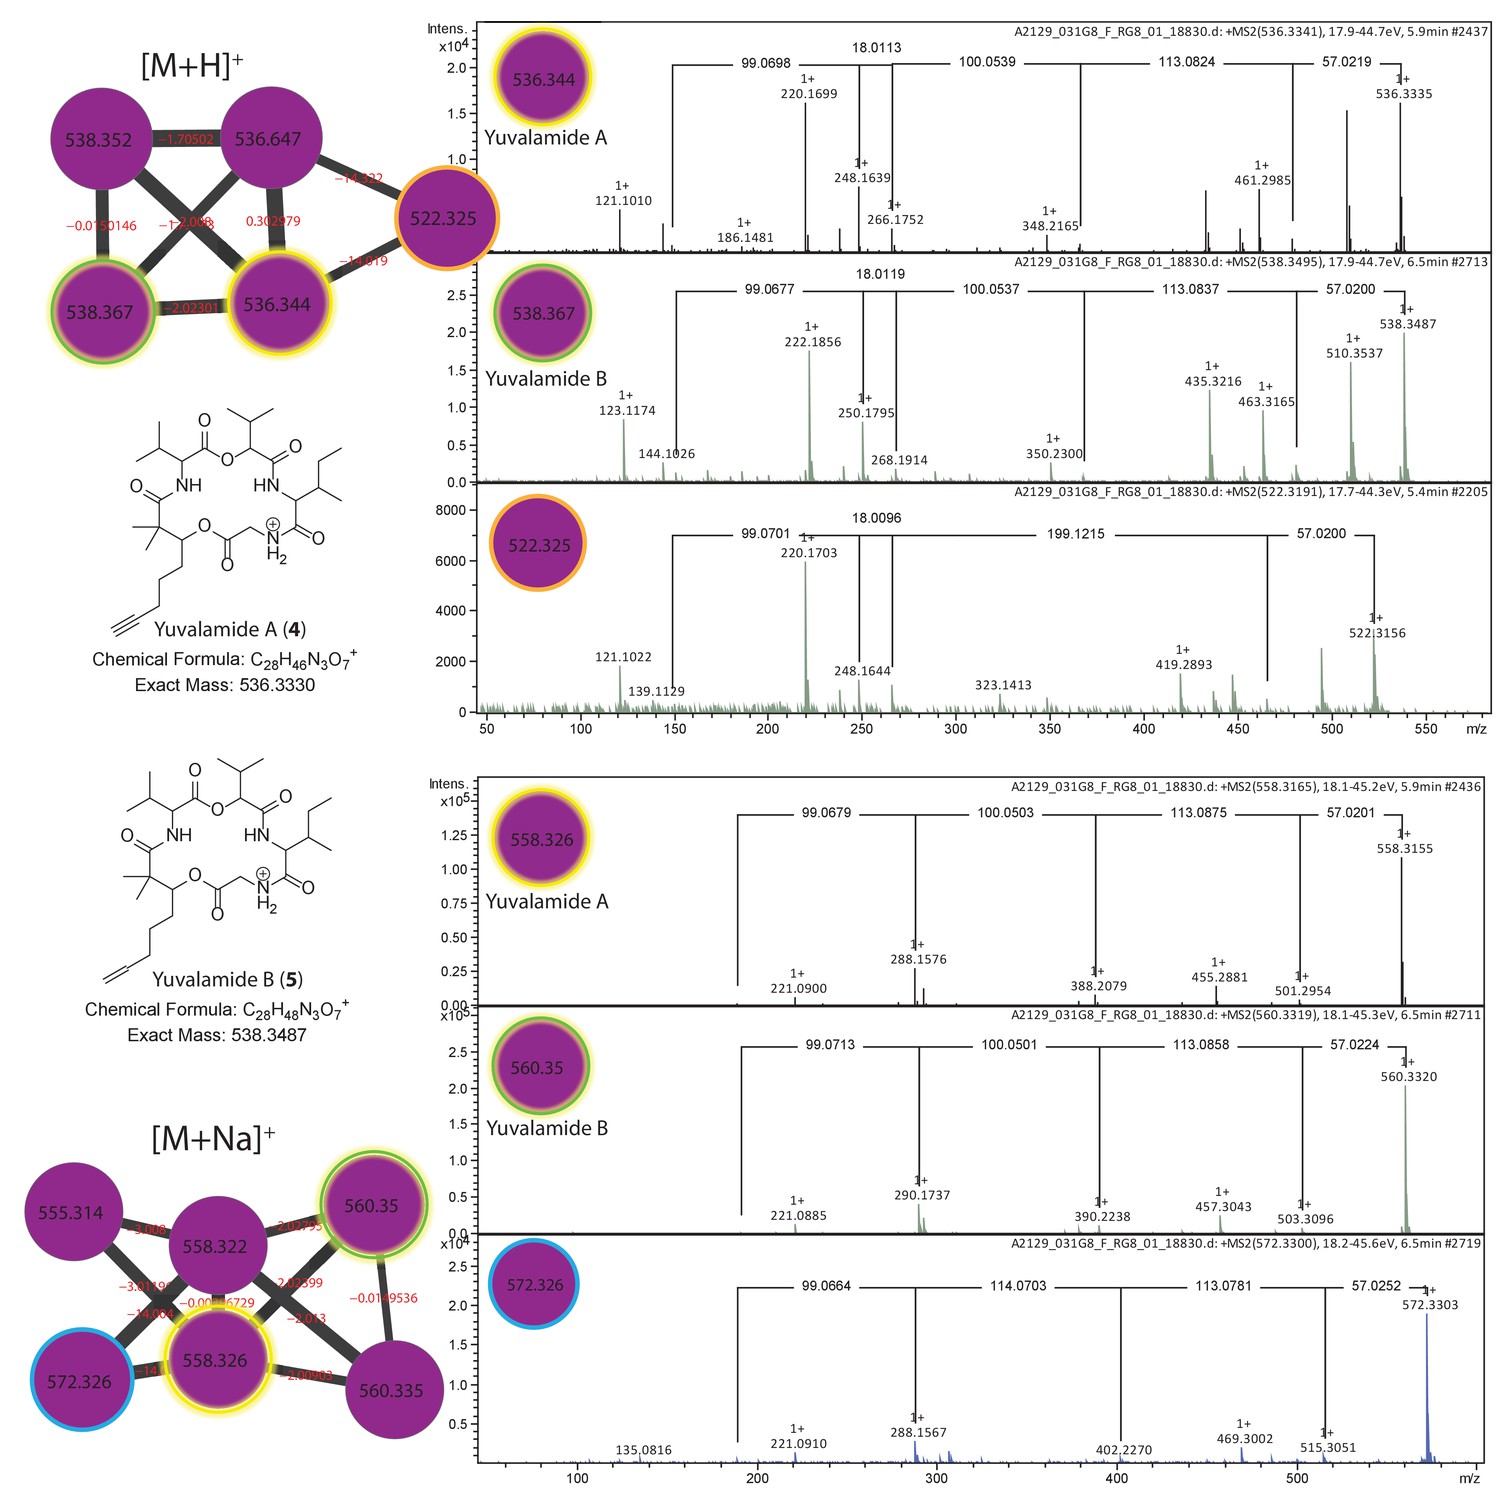
Dereplication of yuvalamide molecular family.
Additional putative yuvalamide analogs observed in the molecular family. Molecular families of [M+H]+ and [M+Na]+ ions highlighting yuvalamide A (4) (Gly-Ile-Hiv-Val-Dhoya) in yellow and the putative yuvalamide B (5) characterized as Dhoea analogue (Gly-Ile-Hiv-Val-Dhoea) in green circles. Two additional putative analogs characterized 522.3 m/z [M+H]+ (Gly-C10H17NO3-Val-Dhoya) and 572.3 m/z [M+Na]+ (Gly-Ile-MeHiv-Val-Dhoya). One analog with an [M+H]+ m/z 522.3156 (14 Da smaller than compound 4) displayed a similar, but not identical fragmentation pattern to yuvalamide A (Figure 5—figure supplement 3). The linear order we propose is Gly-[C10H17NO3]-Val-Dhoya, as the −14 Da change is located in the Ile - Hiv residue region when compared to yuvalamide A. This is likely due to the promiscuous behavior of A domains in the NRPS biosynthetic assembly. Such promiscuous behavior where one amino acid is substituted by another, is quite common in non-ribosomal peptides, and results from similar amino acids being recognized by the cognate adenylation domain (Crawford et al., 2011). Another yuvalamide analog with a 572.3303 m/z (Figure 5—figure supplement 3) that clusters with the sodiated yuvalamide molecular family possess a similar fragmentation pattern to the yuvalamide A but with an increase in 14 Da. This shift is likely due to presence of additional methyl group and the fragmentation suggests this methyl is near the Hiv residue.
Additional files
-
Supplementary file 1
Samples list and metadata.
Sample list and metadata are freely available upon registration at http://qiita.microbio.me Study ID:10125. Also refers to Figures 2, 3, 4 and 5.
- https://doi.org/10.7554/eLife.24214.015
-
Supplementary file 2
Supplemental table 1: GNPS molecular networking MS/MS based identification of molecules and molecular families – Refers to Figures 3 and 4.
- https://doi.org/10.7554/eLife.24214.016
-
Supplementary file 3
2D NMR spectroscopic data for amino acids residues of yuvalamide A.
13C and 1H chemical shifts were determined by HSQC and HMBC spectra. Hiv = 2 hydroxyisovaleric acid (600 MHz for 1H, 125 for 13C), the solvent (DMSO-d6) and the temperature (298K).
- https://doi.org/10.7554/eLife.24214.017
Download links
A two-part list of links to download the article, or parts of the article, in various formats.
Downloads (link to download the article as PDF)
Open citations (links to open the citations from this article in various online reference manager services)
Cite this article (links to download the citations from this article in formats compatible with various reference manager tools)
Digitizing mass spectrometry data to explore the chemical diversity and distribution of marine cyanobacteria and algae
eLife 6:e24214.
https://doi.org/10.7554/eLife.24214


