The age of Homo naledi and associated sediments in the Rising Star Cave, South Africa
- James Cook University, Australia
- University of the Witwatersrand, South Africa
- University of Johannesburg, South Africa
- University of Wisconsin-Madison, United States
- University of Wollongong, Australia
- Environmental Futures Research Institute, Griffith University, Australia
- Centro Nacional de Investigación sobre la Evolución Humana (CENIEH), Spain
- The Australian National University, Australia
- The University of Melbourne, Australia
- La Trobe University, Australia
- Southern Cross University, Australia
Figures
Figure 1

Location of Rising Star Cave and the Dinaledi Chamber.
(a) Simplified geological map showing the position of the Rising Star Cave (in grey); (b) close-up map of the Dinaledi Chamber showing the distribution of the dating samples, including: U-Th flowstone samples (yellow dots, black text); ESR samples (purple dots, orange text); and OSL samples (red dots, blue text). Age estimates for the different samples are shown, with cross reference to Tables 1, 7 and 8.
Figure 2
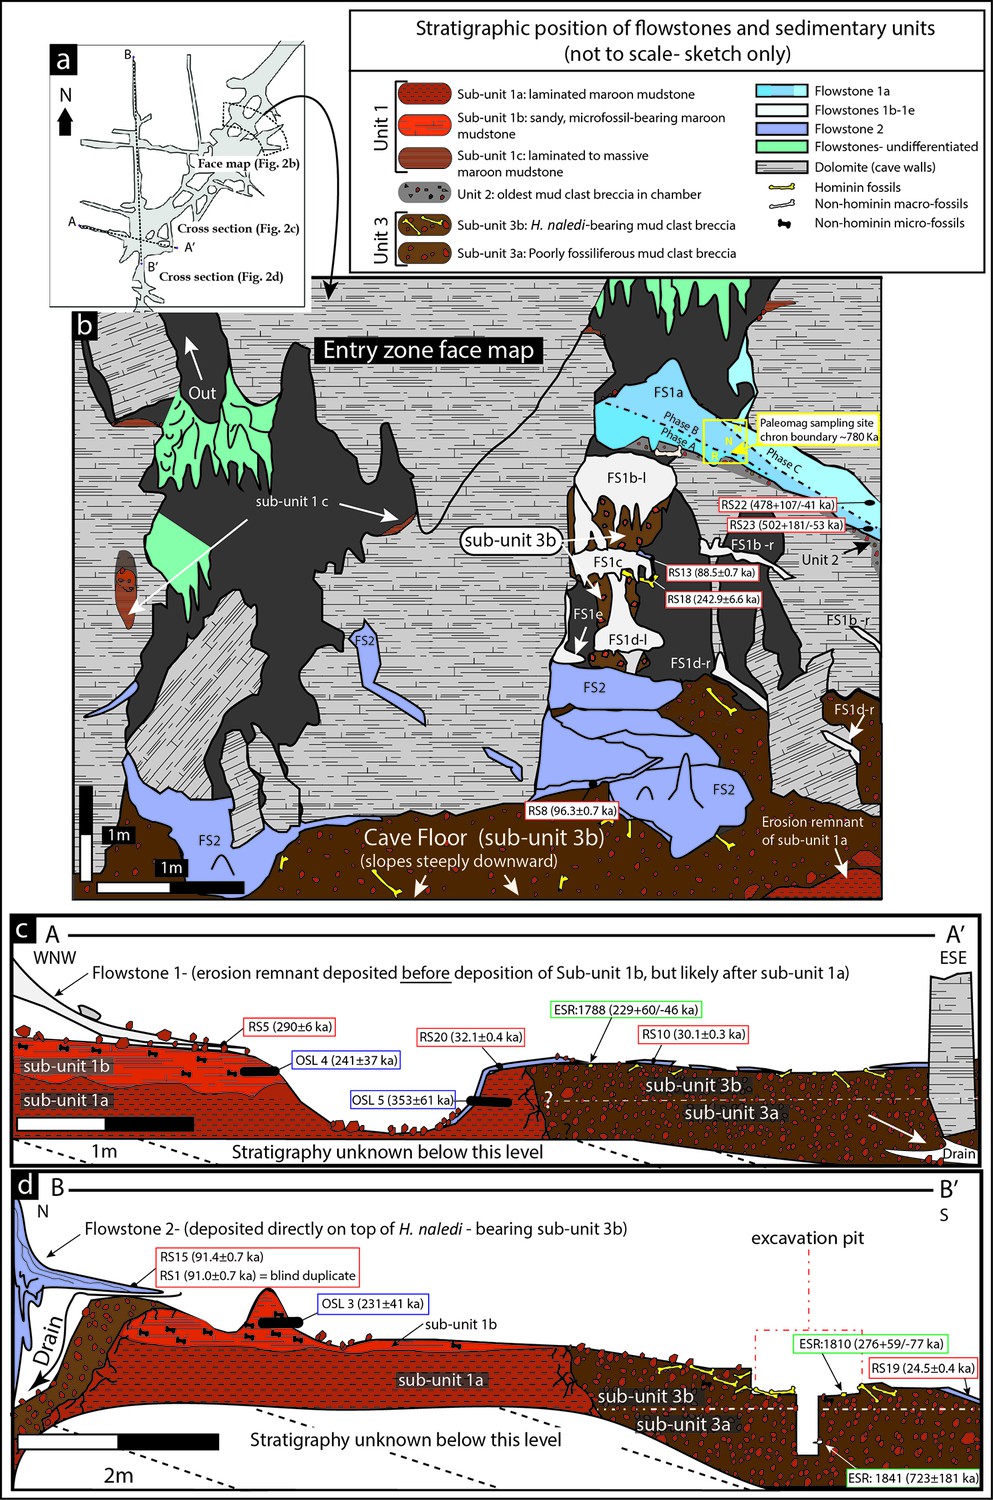
Geological face map and cross-sections through the sediment pile at different locations in the Dinaledi Chamber, illustrating the relationships between the flowstone groups and sedimentary units.
The positions of the section lines are shown in (a); a face map of the entry zone of the Dinaledi Chamber (looking NE) is shown in (b); geological cross-sections through the central part of the Dinaledi Chamber near the excavation pit are shown in (c) and (d).
Figure 3
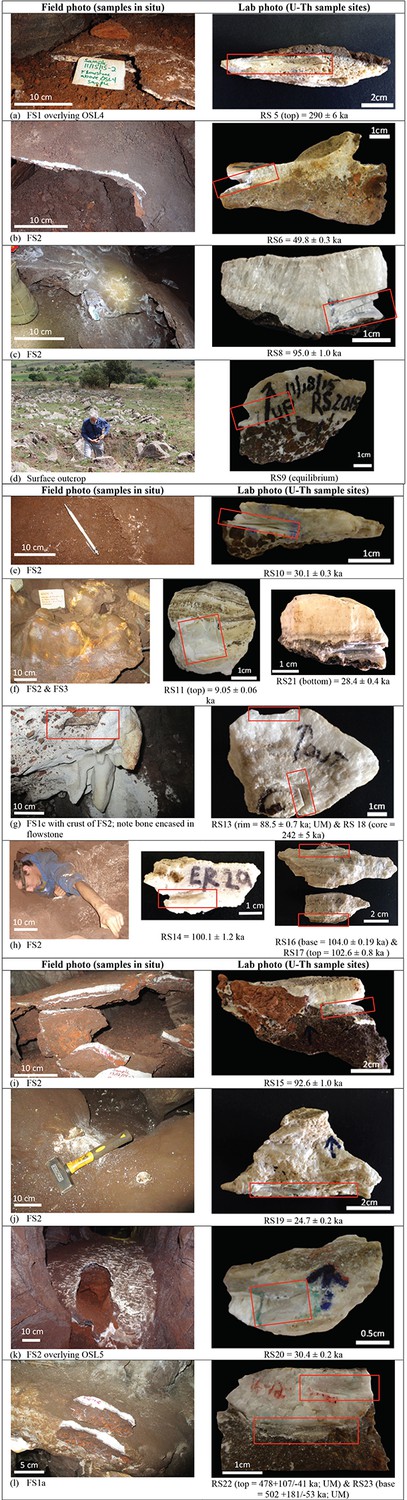
Field and close-up photographs of all flowstone samples collected for U-Th dating.
The flowstone groups (i.e., Flowstone Groups 1, 2 or 3), sample numbers, and ages (2σ uncertainty), as listed in Table 1, are shown below each sample. Ages reported here are from JCU, unless otherwise stated.
Figure 4
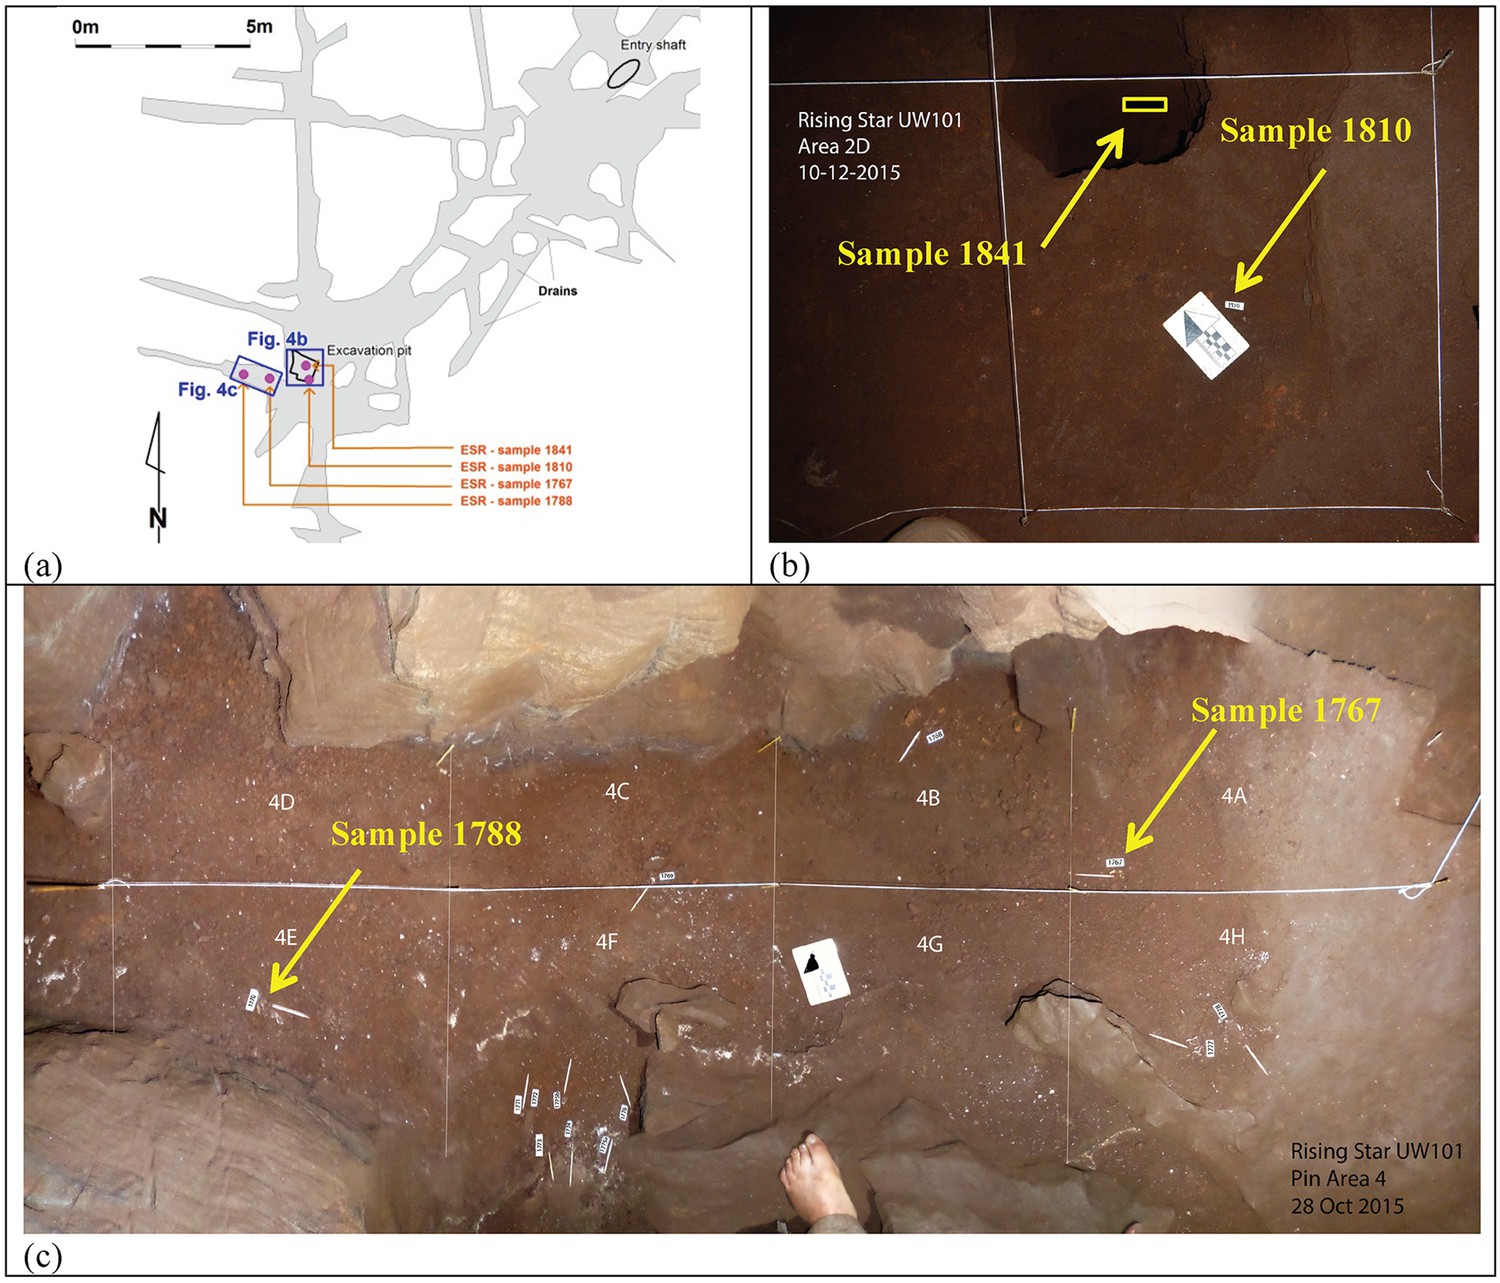
Location of the three H. naledi tooth samples (samples 1767, 1788 and 1810) and one baboon (cf. Papio) tooth sample (sample 1841) used for combined U-series and ESR dating.
(a) Map of the Dinaledi Chamber showing the position of the excavation pit and the position of figures (b) and (c); (b) close-up of the SE corner of the excavation pit showing the sample site for sample 1810 and the 50 cm deep sondage from which sample 1841 was recovered; (c) the area to the W of the excavation pit from which samples 1767 and 1788 were collected.
Figure 5

Samples of orange laminated mudstone of Unit 1 for OSL dating.
(a) sample OSL3 with an estimated MAM age of 231 ± 41 ka taken from sub-unit 1b; (b) sample OSL4 with an estimated MAM age of 241 ± 37 ka, taken from sub-unit 1b and covered by a flowstone sheet dated at 290 ± 6 ka (RS5); (c) sample OSL5 with an estimated MAM age of 353 ± 61 ka, taken from sub-unit 1a and covered by a flowstone sheet dated at 32.1 ± 0.4 ka (RS20). The scale bar in each of the photographs is 10 cm.
Figure 6

Photographs of H. naledi teeth used for ESR dating.
(a) U.W.101–1767; (b) U.W.101–1788; (c) U.W.101–1810. The order of images for each panel is: buccal, distal, lingual, mesial, and occlusal views. The scale bar in each panel is 1 cm.
Figure 7
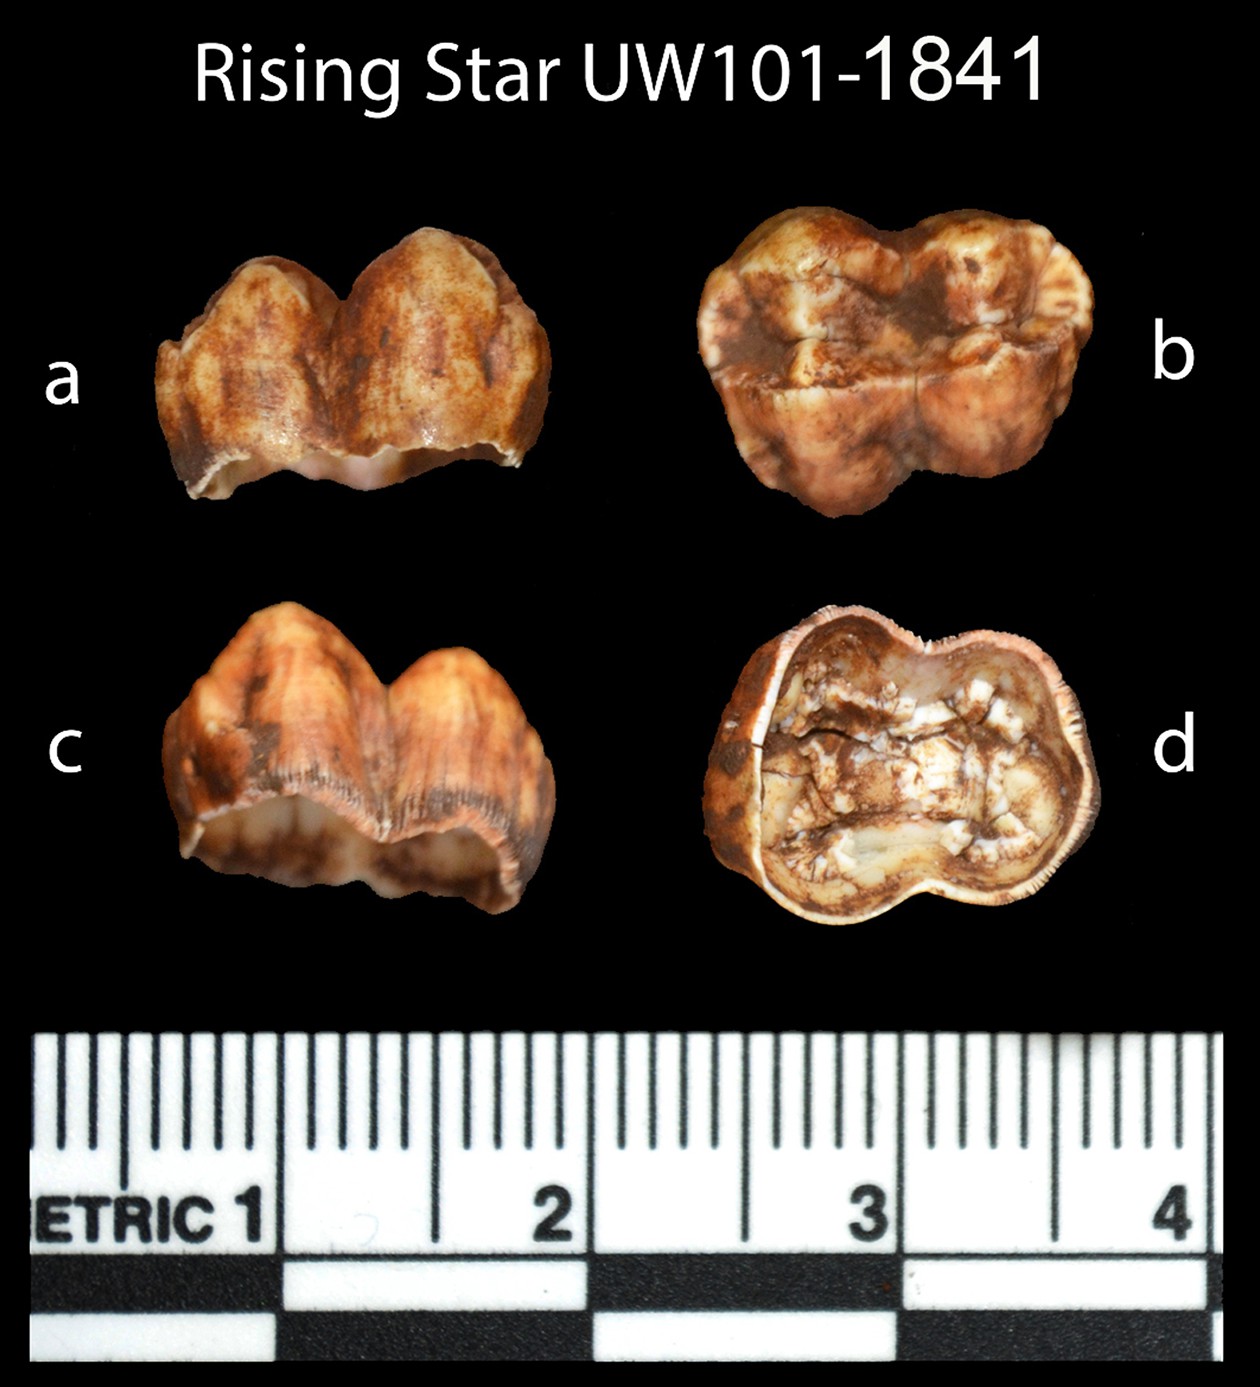
Photographs of the baboon (cf. Papio) tooth (sample 1841), recovered from the sondage in the excavation pit, and used for ESR dating.
Views are: (a) buccal, (b) occlusal, (c) lingual, and (d) internal.
Figure 8
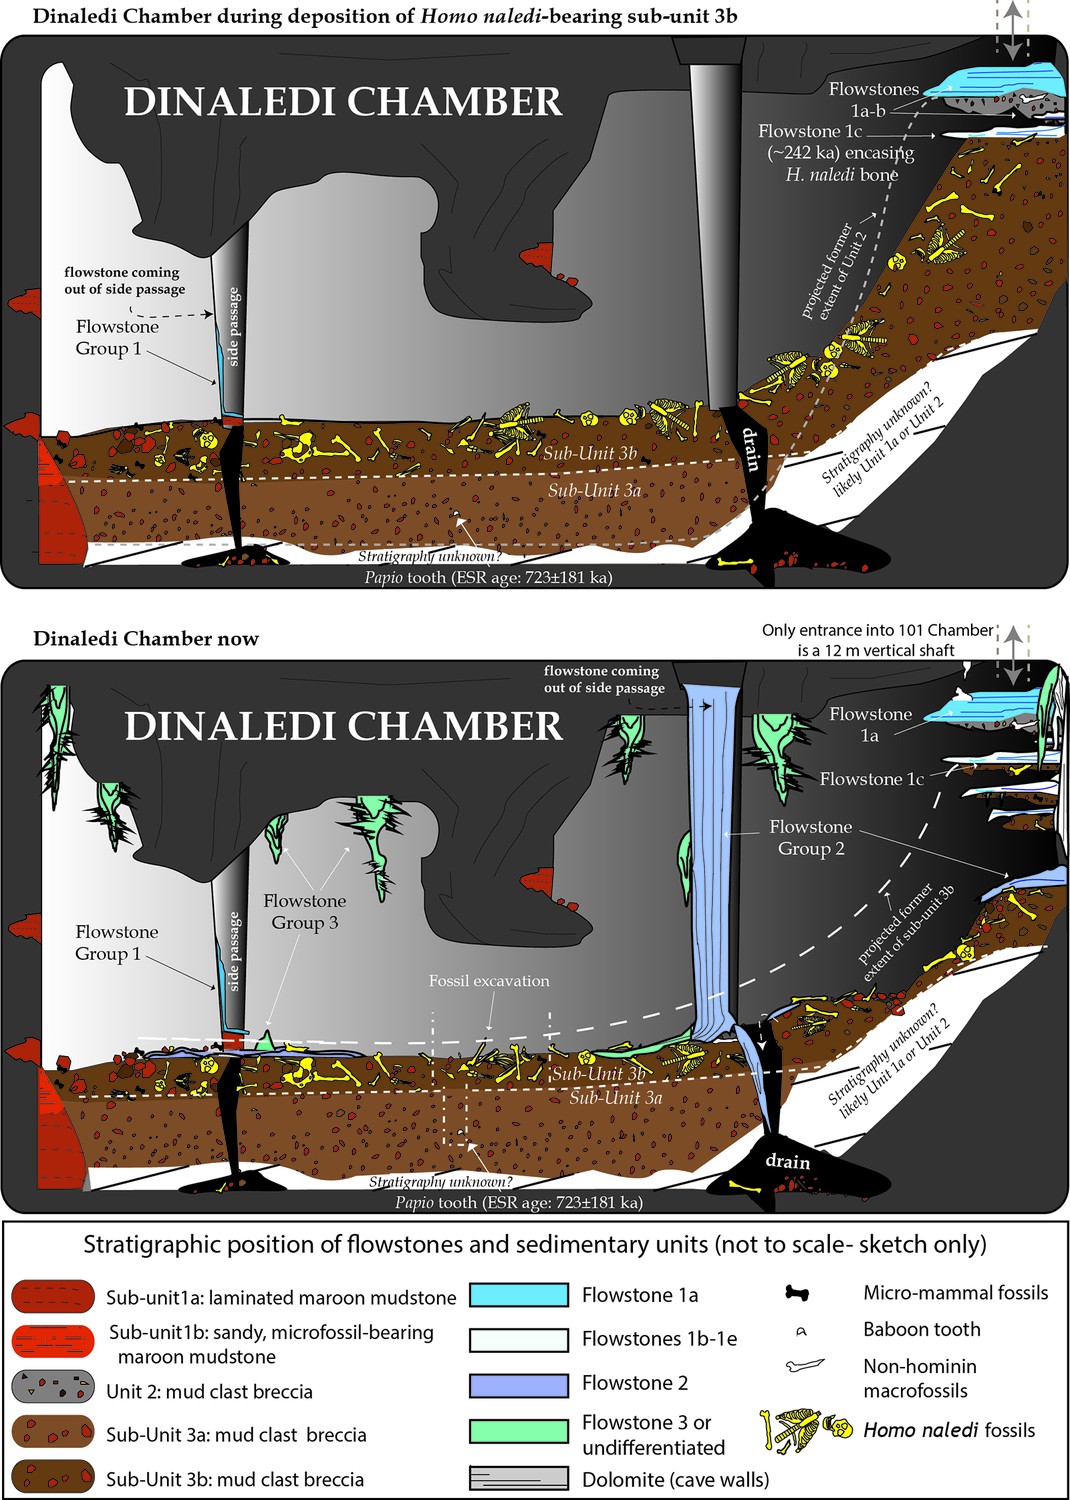
Cartoon illustrating the sedimentary history resulting in the deposition and redistribution of sediment of Units 2 and 3, and Flowstone Groups 1 to 3 in the Dinaledi Chamber.
Note that all hominin fossils are contained in sub-unit 3b, but that this sub-unit has been repeatedly reworked after its initial deposition. Fossil entry occurred during the initial stages of deposition of Unit 3 below the entry shaft and predated deposition of Flowstone 1c. H. naledi fossils may have continued to enter the Dinaledi Chamber as older parts of Unit 3 were eroded from below Flowstone 1c, and as remnants of all older units were reworked to be incorporated into Unit 3 sediments that accumulated along the floor of the Dinaledi Chamber.
Figure 9
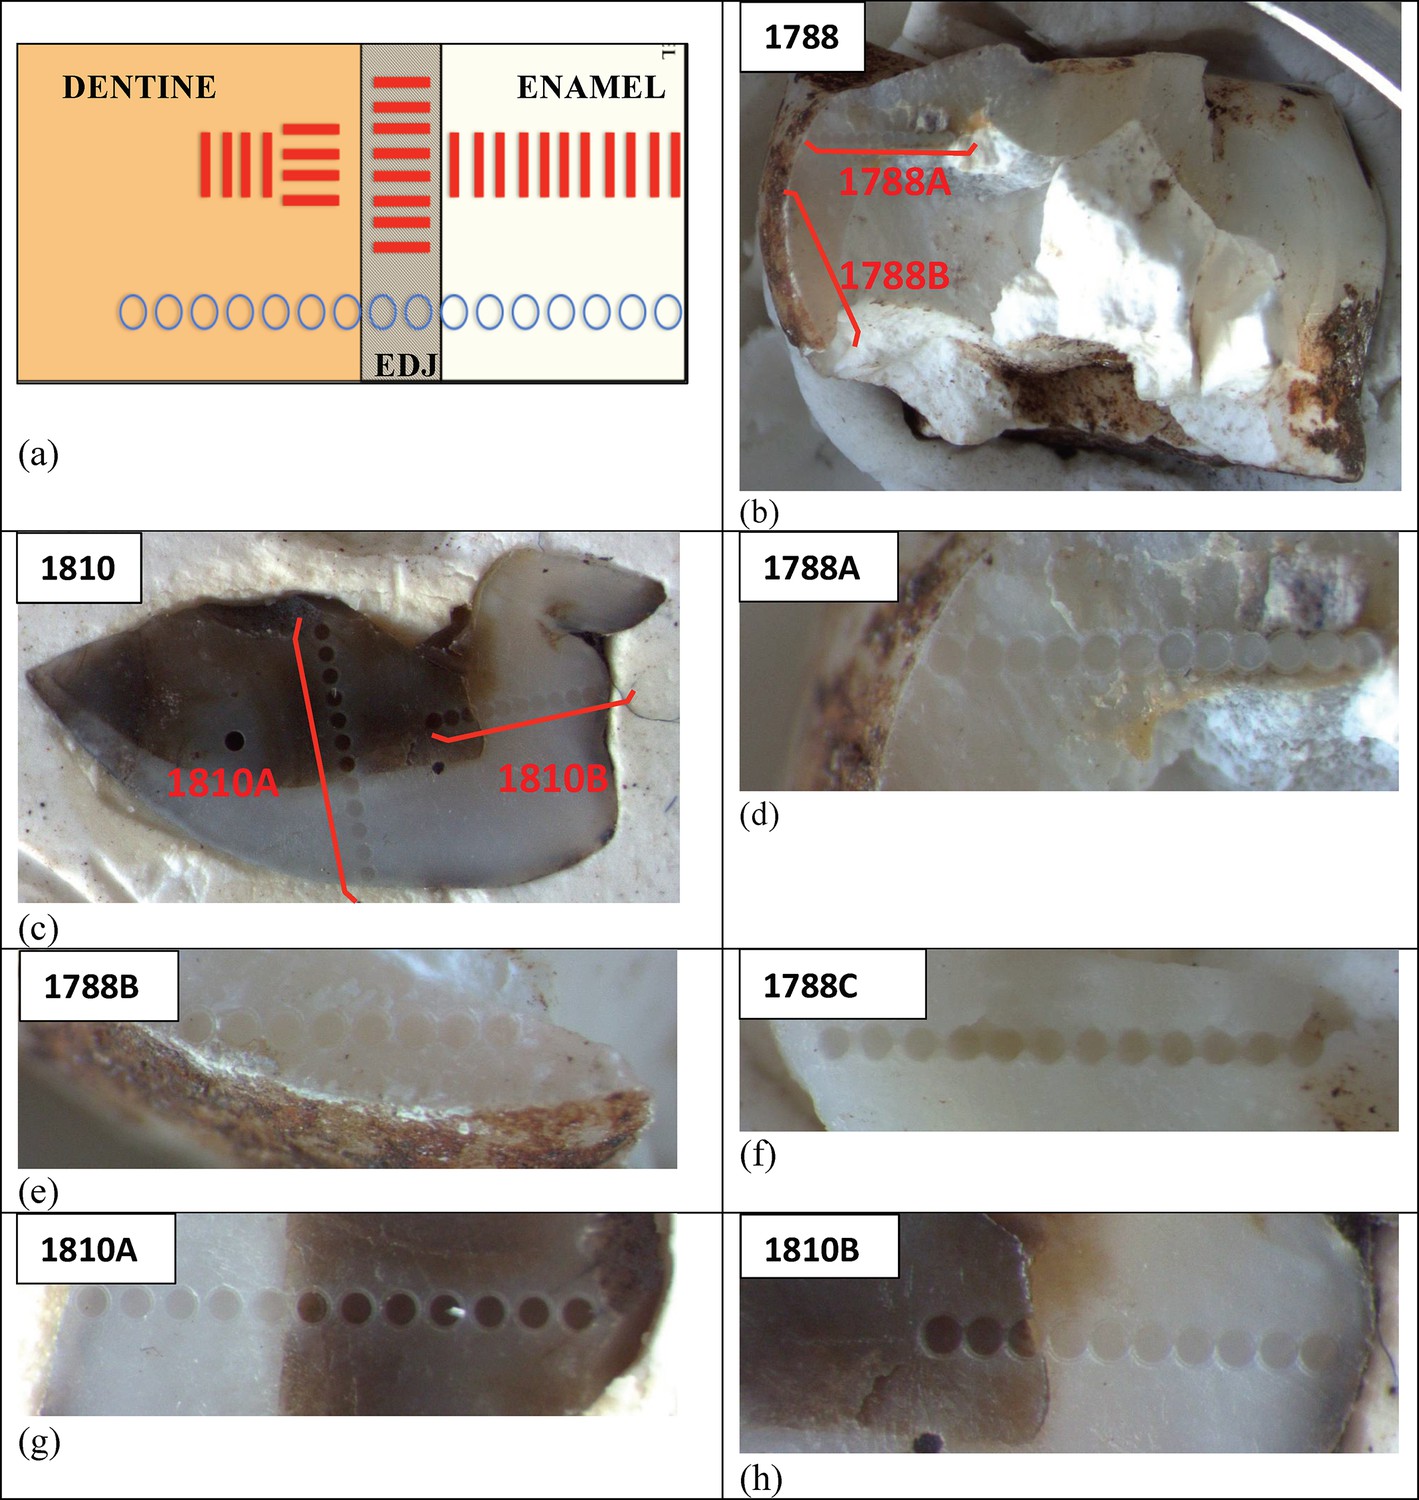
Photographs illustrating the sampling approaches taken by SCU-UoW and GU-ANU in obtaining the U-Th results presented in Tables 4 and 5.
(a) Comparison of sampling grids across the enamel-dentine boundary measured by SCU-UoW (red lines) vs. GU-ANU (blue circles). SCU-UoW (red lines) measured a series of parallel, shallow (<5 μm) pits along grid lines across the teeth and averaged U concentrations across each grid. GU-ANU (blue circles) measured the average composition of the tooth in single spots that were laser-bored along profiles across the teeth, and report results for each spot. (b, c) Locations of LA-ICP-MS spot analyses for teeth samples 1788 (b) and 1810 (c) conducted by GU-ANU. The detailed transects are shown in panels (d) to (h).
Figure 10

Gamma dose rate reconstructions derived from analytical data of sediment samples collected around ESR samples 1767, 1788 and 1810 (closed circles and diamonds), combined with samples from a vertical profile in the excavation pit and sondage (open circles and diamonds).
The data show little variation in dose rate with depth (see text for explanation).
Figure 11
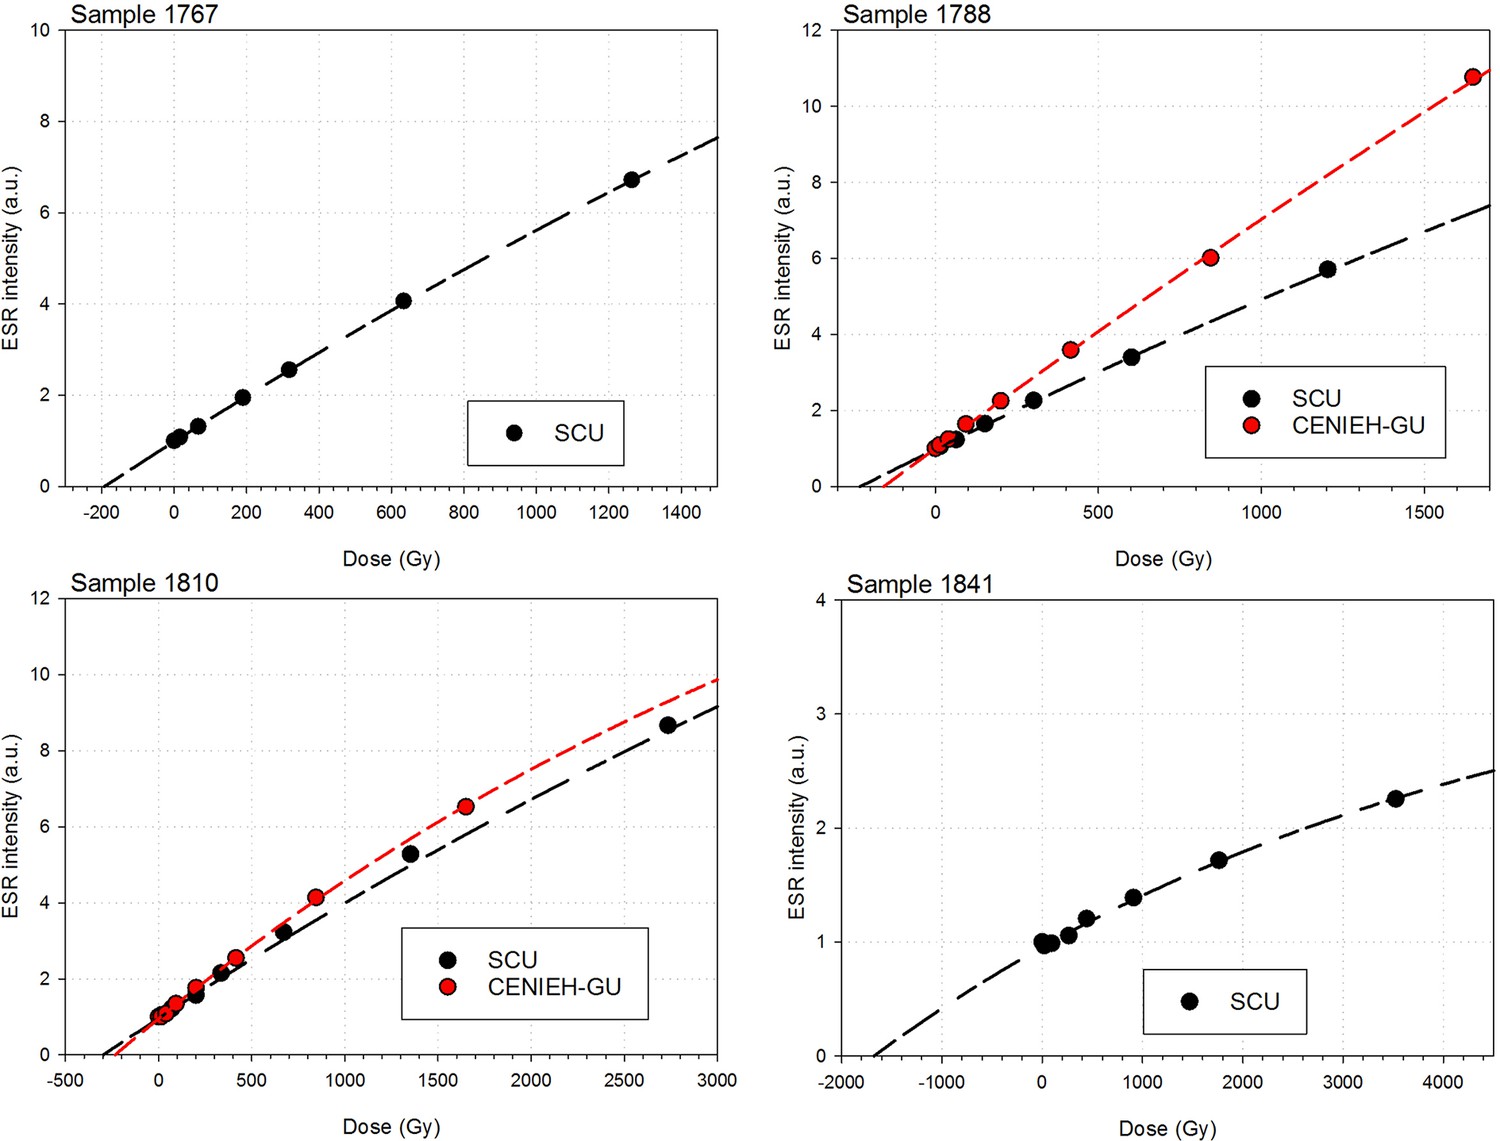
ESR dose response curves (DRC’s) obtained for the samples 1767, 1788, 1810 and 1841.
To facilitate comparison, all DRC’s have been normalised to the intensity of the natural point (=1).
Figure 12
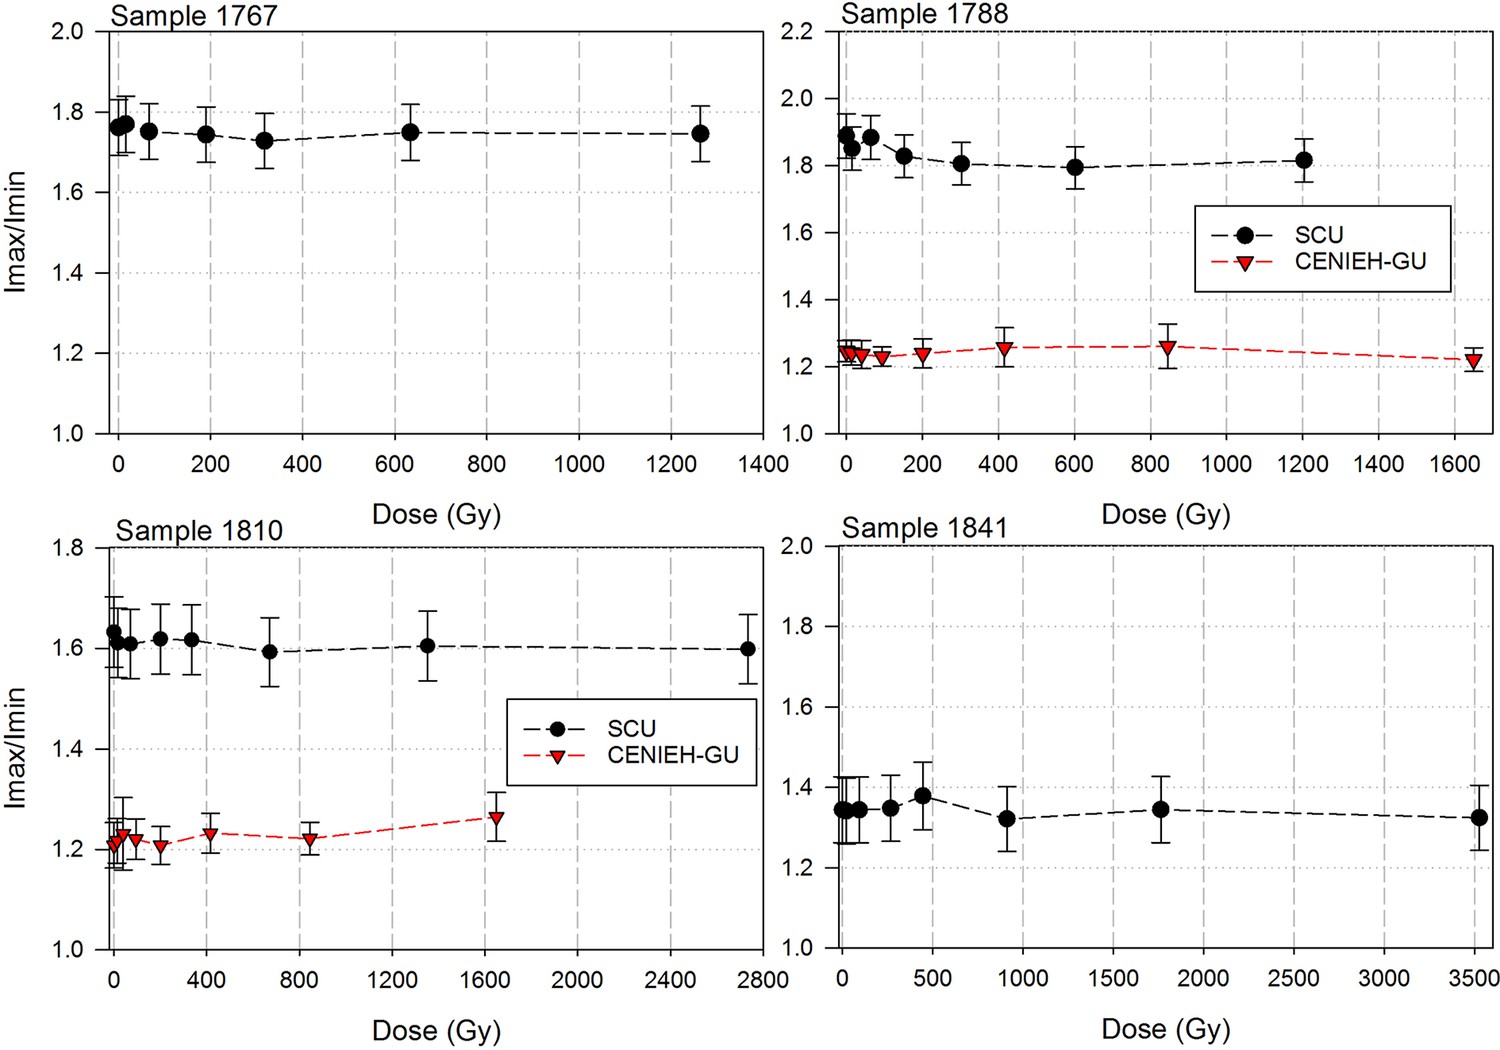
Evolution of the Imax/Imin ratio vs the irradiation dose for the four tooth samples.
(see text for explanation).
Figure 13

Samples and results of palaeomagnetic analyses forFlowstone 1a.
(a) Outcrop photo of hanging erosion remnant of Flowstone 1a from which the palaeomagnetic sample was taken. The three flowstone phases separated by detrital horizons are clearly visible, and their magnetic polarity has been marked (N = normal; R = reverse). The stratigraphic top is towards the top of the photo; (b) close-up of a hand sample taken for palaeomagnetic analysis from Flowstone 1a in the Dinaledi Chamber. The sample is layered and comprises three distinct phases (from base to top: A-C marked in yellow) separated by thin clastic horizons that mark disconformities indicated with red dashed lines. The larger-scale extent of the three phases can be seen in (a); (c) intensity spectra, Zijderveld plots, and stereo plots for samples from phases A to C taken from (b). Phases B and C show normal polarity and phase A shows reversed and intermediate polarity directions.
Figure 14
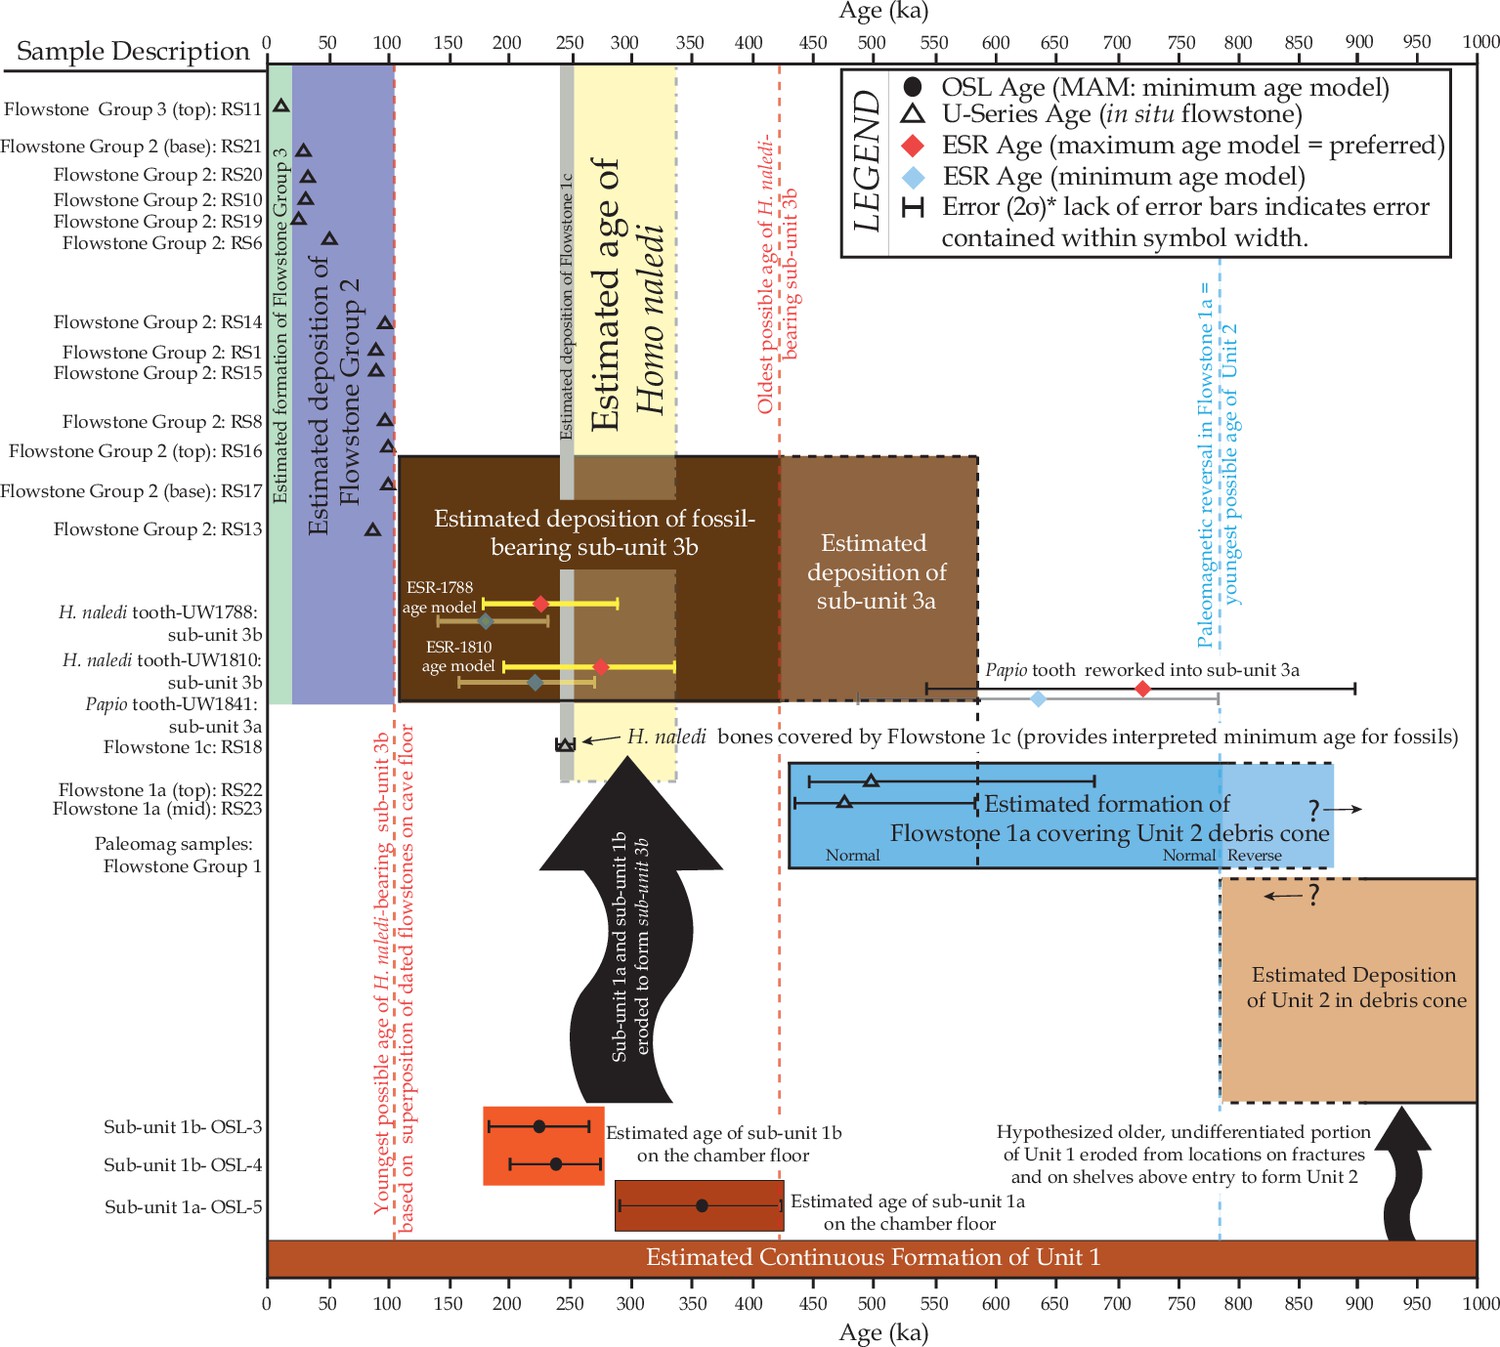
Chronostratigraphic summary of radio-isotopic dating results, and interpretation of the depositional ranges of stratigraphic units, flowstones and H.
naledi fossils in the Dinaledi Chamber. Following the preferred US-ESR maximum age model and associated uncertainties for ESR samples 1788 and 1810, a maximum depositional age of 335 Ma was determined, while the minimum depositional age of 236 ka was constrained by Flowstone 1c (sample RS18), which covers H. naledi material in the entry zone.
Tables
Table 1
Summary table of U-Th disequilibrium ages obtained for samples from the Dinaledi Chamber by James Cook University (JCU - 1) and the University of Melbourne (UoM - 2). The detailed analytical results are shown in Tables 2 and 3. Sample locations are shown in Figure 1b. The data are ranked by increasing age of the oldest flowstone horizon within the sample, based on the JCU ages. The grey shading highlights the different age groupings observed within the flowstones: 24–32 ka, ~50 ka, 88–105 ka, ~242 ka, ~290 ka and >440 ka. Ages are reported relative to 1950.
| Sample ID | Flowstone group | Underlying unit | Age1 (ka) | 2σ1 (ka) | Age2 (ka) | 2σ2 (ka) |
|---|---|---|---|---|---|---|
| RS19 | FS2 | sub-unit 3b | 24.7 | 0.2 | 24.53 | 0.43 |
| RS11 | FS3 (top to RS21) | FS2 | 9.05 | 0.06 | 9.946 | 0.063 |
| RS21 | FS2 (base to RS11) | sub-unit 3b | 28.4 | 0.4 | 28.62 | 0.29 |
| RS10 | FS2 | sub-unit 3b (and bone) | 30.1 | 0.3 | – | – |
| RS20 | FS2 | sub-unit 1a (Facies 1a; OSL5) | 30.4 | 0.2 | 32.12 | 0.38 |
| RS6 | FS2 | sub-unit 1a, sub-unit 3b | 49.8 | 0.3 | 50.82 | 0.43 |
| RS15 | FS2 (blind duplicate of RS1) | sub-unit 3b | 92.6 | 1.0 | 91.40 | 0.65 |
| RS1 | FS2 (blind duplicate of RS15) | sub-unit 3b | – | – | 91.04 | 0.72 |
| RS8 | FS2 (below FS1a-e) | sub-unit 3b | 95.0 | 1.0 | 96.29 | 0.69 |
| RS14 | FS2 | in drain, along dolostone wall | 100.1 | 1.2 | 96.20 | 0.36 |
| RS17 | FS2 (top to RS16) | in drain, along dolostone wall | 102.6 | 0.8 | 98.6 | 1.4 |
| RS16 | FS2 (base to RS17) | in drain, along dolostone wall | 104.0 | 1.9 | 99.1 | 1.4 |
| RS13 | FS2 (rim to RS18) | sub-unit 3b | – | – | 88.46 | 0.67 |
| RS18 | FS1c (core to RS13) | sub-unit 3b | 242 | 5 | 242.9 | 6.6 |
| RS5 | FS1 | sub-unit 1b (Facies 1b; OSL4) | 290 | 6 | – | – |
| RS22 | FS1a (top to RS23) | Unit 2 | equilibrium | – | 478 | +107/−41 |
| RS23 | FS1a (base to RS22) | Unit 2 | equilibrium | – | 502 | +181/−53 |
| RS9 | n/a (surface outcrop) | n/a | equilibrium | – | equilibrium | – |
-
1James Cook University (JCU), Advanced Analytical Centre.
-
2University of Melbourne (UoM), paleochronology laboratory.
Table 2
U-Th data table for James Cook University. Uncertainties include: analytical error, decay constant uncertainty, and uncertainty on initial 230Th/232Th. Ages are reported relative to 1950 and assume an initial 230Th/232Th activity of 0.83 ± 0.5, and the equation given in Placzek et al. (2006). Decay constants for 234U and 230Th are from Cheng et al. (2013).
| Sample ID | U (ppm) | 234U/238U | 2σ | 230Th/238U | 2σ | 232Th/238U | 2σ | Age (ka BP) | 2σ (ka) | 234U/238Uinitial | 2σ |
|---|---|---|---|---|---|---|---|---|---|---|---|
| (activity) | (activity) | (corrected) | (activity) | ||||||||
| RS11 | 2.314 | 1.772 | 0.050 | 0.144 | 0.001 | 0.0001088 | 0.0000005 | 9.05 | 0.06 | 1.8184 | 0.0003 |
| RS19 | 0.652 | 1.855 | 0.001 | 0.387 | 0.002 | 0.002176 | 0.000008 | 24.7 | 0.2 | 1.989 | 0.001 |
| RS21 | 0.421 | 1.946 | 0.001 | 0.460 | 0.004 | 0.001920 | 0.000015 | 28.4 | 0.4 | 2.109 | 0.002 |
| RS10 | 0.846 | 1.885 | 0.001 | 0.466 | 0.003 | 0.000792 | 0.000003 | 30.1 | 0.3 | 2.053 | 0.001 |
| RS20 | 0.795 | 1.855 | 0.001 | 0.463 | 0.003 | 0.001363 | 0.000005 | 30.4 | 0.2 | 2.022 | 0.001 |
| RS6 | 0.560 | 1.966 | 0.001 | 0.747 | 0.003 | 0.000974 | 0.000002 | 49.8 | 0.3 | 2.263 | 0.002 |
| RS15 | 0.400 | 1.912 | 0.001 | 1.164 | 0.008 | 0.00472 | 0.00001 | 92.6 | 1.0 | 2.484 | 0.007 |
| RS8 | 0.328 | 1.813 | 0.003 | 1.120 | 0.008 | 0.00316 | 0.00002 | 95.0 | 1.0 | 2.373 | 0.007 |
| RS14 | 0.734 | 1.639 | 0.095 | 1.039 | 0.008 | 0.00298 | 0.00002 | 100.1 | 1.2 | 2.175 | 0.008 |
| RS17 | 0.680 | 1.609 | 0.001 | 1.032 | 0.005 | 0.000679 | 0.000001 | 102.6 | 0.8 | 2.150 | 0.005 |
| RS16 | 0.973 | 1.583 | 0.000 | 1.024 | 0.011 | 0.000403 | 0.000006 | 104.0 | 1.9 | 2.12 | 0.01 |
| RS18 | 0.152 | 1.848 | 0.001 | 1.856 | 0.013 | 0.01175 | 0.00005 | 242 | 5 | 3.66 | 0.05 |
| RS5 | 0.090 | 1.728 | 0.001 | 1.818 | 0.009 | 0.01732 | 0.00005 | 290 | 6 | 3.92 | 0.07 |
| RS23 | 0.314 | 1.187 | 0.002 | 1.315 | 0.011 | 0.00346 | 0.00002 | >400 | – | – | |
| RS22 | 0.367 | 1.209 | 0.001 | 1.322 | 0.008 | 0.000125 | 0.000001 | >400 | – | – | |
| RS9 | 0.737 | 1.007 | 0.002 | 1.029 | 0.004 | 0.000462 | 0.000001 | >400 | – | – |
Table 3
U-Th data table for the University of Melbourne. Activity ratios are determined after Hellstrom (2003) and Drysdale et al. (2012). Ages are corrected for initial 230Th using Equation 1 of Hellstrom (2006), the decay constants of Cheng et al. (2013), and an initial 230Th/232Th activity of 1.5 ± 1.5. The initial 234U/238U ratios are calculated using corrected ages, which are reported relative to 1950.
| Sample ID | U (ppm) | 234U/238U | 2σ | 230Th/238U | 2σ | 232Th/238U | 2σ | Age (ka BP) | 2σ (ka) | 234U/238Uinitial | 2σ |
|---|---|---|---|---|---|---|---|---|---|---|---|
| (activity) | (activity) | (corrected) | (activity) | ||||||||
| RS11 | 1.518 | 1.808 | 0.003 | 0.1597 | 0.0009 | 0.0000875 | 0.0000004 | 9.946 | 0.063 | 1.831 | 0.004 |
| RS19 | 0.501 | 1.884 | 0.011 | 0.3916 | 0.0026 | 0.004322 | 0.000010 | 24.53 | 0.43 | 1.947 | 0.011 |
| RS21 | 0.361 | 1.968 | 0.011 | 0.4654 | 0.0030 | 0.0011342 | 0.0000019 | 28.62 | 0.29 | 2.049 | 0.011 |
| RS20 | 0.626 | 1.878 | 0.011 | 0.4925 | 0.0032 | 0.0023837 | 0.0000040 | 32.12 | 0.38 | 1.961 | 0.011 |
| RS6 | 0.276 | 2.023 | 0.004 | 0.7856 | 0.0021 | 0.00496 | 0.00010 | 50.82 | 0.43 | 2.181 | 0.004 |
| RS13 | 0.076 | 2.006 | 0.004 | 1.1837 | 0.0047 | 0.004786 | 0.000058 | 88.46 | 0.67 | 2.291 | 0.005 |
| RS15 | 0.381 | 1.934 | 0.004 | 1.1661 | 0.0029 | 0.00639 | 0.00012 | 91.37 | 0.65 | 2.209 | 0.005 |
| RS14 | 0.665 | 1.626 | 0.003 | 1.0010 | 0.0015 | 0.001262 | 0.000014 | 96.24 | 0.36 | 1.822 | 0.003 |
| RS8 | 0.257 | 1.831 | 0.004 | 1.1397 | 0.0034 | 0.005746 | 0.000060 | 96.29 | 0.69 | 2.091 | 0.004 |
| RS17 | 0.517 | 1.637 | 0.009 | 1.0248 | 0.0066 | 0.0023963 | 0.0000037 | 98.6 | 1.4 | 1.841 | 0.010 |
| RS16 | 0.905 | 1.590 | 0.010 | 0.9963 | 0.0067 | 0.0017099 | 0.0000037 | 99.1 | 1.4 | 1.780 | 0.011 |
| RS18 | 0.104 | 2.001 | 0.011 | 2.0320 | 0.0140 | 0.020557 | 0.000041 | 242.9 | 6.6 | 2.987 | 0.027 |
| RS22 | 0.324 | 1.228 | 0.007 | 1.3017 | 0.0083 | 0.0001201 | 0.0000008 | 478 | +107/–41 | – | – |
| RS23 | 0.206 | 1.225 | 0.007 | 1.3016 | 0.0093 | 0.007818 | 0.000016 | 502 | +181/–53 | – | – |
| RS9 | 0.896 | 1.010 | 0.002 | 1.0204 | 0.0018 | 0.000916 | 0.000012 | – | – | – | – |
Table 4
Summary table of U-Th disequilibrium ages obtained for the three H. naledi teeth (samples 1767, 1788 and 1810) and the baboon tooth (sample 1841) from the Dinaledi Chamber obtained by SCU-UoW. No age calculations were carried out for U concentrations of ≤0.5 ppm or U/Th ≤250 (indicated in red and underlined). Mean values in this table only incorporate values from which meaningful ages could be calculated (indicated in black), however all values (i.e., red and black) were averaged to obtain the relevant mean values reported in Table 4. All uncertainties are given as 2σ.
| Sample1767 | U (ppm) | U/Th | 230Th/238U | 2σ | 234U/238U | 2σ | Age (ka) | 2s (ka) | (234U/238U)i | 2σ |
|---|---|---|---|---|---|---|---|---|---|---|
| 1767-1 D | 7.22 | 685 | 2.167 | 0.024 | 6.259 | 0.009 | 43.5 | 1.1 | 6.949 | 0.026 |
| 1767-2 D | 7.75 | 996 | 2.261 | 0.023 | 6.282 | 0.010 | 45.5 | 1.1 | 7.009 | 0.030 |
| 1767-3 D | 8.03 | 2.225 | 0.825 | 6.276 | 0.012 | – | – | – | – | |
| 1767-4 D | 8.55 | 951 | 2.209 | 0.031 | 6.301 | 0.009 | 44.1 | 1.4 | 7.007 | 0.030 |
| 1767-5* E | 3.69 | 1238 | 2.259 | 0.031 | 6.197 | 0.055 | 46.2 | 1.8 | 6.924 | 0.126 |
| 1767-6* E | 1.76 | 2.239 | 1.133 | 6.165 | 0.038 | – | – | – | – | |
| 1767-7* E | 2.15 | 2.337 | 0.947 | 6.231 | 0.024 | – | – | – | – | |
| 1767-8* E | 2.46 | 518 | 2.276 | 0.021 | 6.253 | 0.019 | 46.1 | 1.1 | 6.986 | 0.048 |
| Mean: | ||||||||||
| 1767 D | 7.84 | 877 | 2.212 | 0.026 | 6.281 | 0.009 | 44.5 | 1.2 | 6.988 | 0.029 |
| 1767 E | 3.08 | 878 | 2.268 | 0.026 | 6.225 | 0.037 | 46.2 | 1.4 | 6.955 | 0.087 |
| Sample1788 | U (ppm) | U/Th | 230Th/238U | 2σ | 234U/238U | 2σ | Age (ka) | 2s (ka) | (234U/238U)i | 2σ |
| 1788-1 D | 6.67 | 390 | 2.967 | 0.026 | 6.423 | 0.011 | 61.4 | 1.5 | 7.453 | 0.054 |
| 1788-2 D | 7.08 | 3.370 | 0.833 | 6.441 | 0.010 | – | – | – | – | |
| 1788-3 D | 7.17 | 3.206 | 3.126 | 6.394 | 0.049 | – | – | – | – | |
| 1788-4 D | 7.45 | 1391 | 3.313 | 0.023 | 6.445 | 0.010 | 70.3 | 1.4 | 7.645 | 0.056 |
| 1788-5 D | 5.52 | 4423 | 3.269 | 0.023 | 6.349 | 0.010 | 70.4 | 1.4 | 7.531 | 0.052 |
| 1788-6 D | 5.07 | 4090 | 3.416 | 0.014 | 6.378 | 0.014 | 74.1 | 1.1 | 7.634 | 0.054 |
| 1788-7 D | 5.39 | 4729 | 3.385 | 0.020 | 6.400 | 0.014 | 72.9 | 1.4 | 7.640 | 0.054 |
| 1788-8 D | 5.93 | 3209 | 3.427 | 0.015 | 6.393 | 0.013 | 74.2 | 1.1 | 7.654 | 0.054 |
| 1788-9 D | 5.24 | 4329 | 3.449 | 0.014 | 6.413 | 0.014 | 74.5 | 1.0 | 7.685 | 0.052 |
| 1788-10 D | 4.89 | 3161 | 3.390 | 0.010 | 6.403 | 0.011 | 73.0 | 0.9 | 7.645 | 0.052 |
| 1788-11 D | 4.8 | 2556 | 3.394 | 0.014 | 6.416 | 0.014 | 72.9 | 1.0 | 7.659 | 0.052 |
| 1788-12 D | 5.48 | 1606 | 3.356 | 0.017 | 6.384 | 0.014 | 72.3 | 1.1 | 7.609 | 0.052 |
| 1788-13 D | 5.04 | 838 | 3.317 | 0.025 | 6.420 | 0.014 | 70.7 | 1.5 | 7.623 | 0.058 |
| 1788-14 D | 5.69 | 3.281 | 2.426 | 6.408 | 0.013 | – | – | – | – | |
| 1788-15 D | 5.03 | 3.315 | 3.731 | 6.427 | 0.014 | – | – | – | – | |
| 1788-16 E | 3 | 1.786 | 18.149 | 3.834 | 0.267 | – | – | – | – | |
| 1788-17 E | 0.68 | 25 | 0.752 | 9.149 | 6.248 | 0.273 | – | – | – | – |
| 1788-18 E | 0.4 | 16 | 0.801 | 13.053 | 6.236 | 0.050 | – | – | – | – |
| 1788-19 E | 0.08 | 3 | 1.783 | 36.231 | 4.301 | 0.288 | – | – | – | – |
| 1788-20 E | 1.02 | 306 | 2.990 | 0.117 | 5.541 | 0.154 | 75.1 | 9.3 | 6.617 | 0.394 |
| 1788-21* E | 0.33 | 50 | 2.041 | 27.135 | 5.793 | 0.141 | – | – | – | – |
| 1788-22* E | 0.12 | 30 | 1.513 | 24.801 | 5.975 | 0.098 | – | – | – | – |
| 1788-23* E | 0.25 | 34 | 1.368 | 17.071 | 5.988 | 0.079 | – | – | – | – |
| 1788-24* E | 0.36 | 90 | 1.237 | 13.555 | 6.167 | 0.055 | – | – | – | – |
| 1788-25* E | 0.41 | 107 | 1.084 | 8.672 | 6.206 | 0.033 | – | – | – | – |
| 1788-26* E | 0.48 | 102 | 1.302 | 11.333 | 6.384 | 0.081 | – | – | – | – |
| 1788-27* E | 0.49 | 165 | 0.686 | 7.733 | 6.367 | 0.037 | – | – | – | – |
| 1788-28* E | 0.31 | 167 | 1.615 | 6.975 | 5.602 | 0.246 | – | – | – | – |
| 1788-29* E | 0.44 | 6 | 2.311 | 11.898 | 5.576 | 0.306 | – | – | – | – |
| 1788-30 E | 0.44 | 62 | 0.988 | 5.310 | 6.089 | 0.075 | – | – | – | – |
| 1788-31 E | 0.29 | 8 | 1.066 | 19.256 | 6.151 | 0.056 | – | – | – | – |
| 1788-32 E | 0.23 | 95 | 0.994 | 17.451 | 6.352 | 0.064 | – | – | – | – |
| 1788-33 E | 0.41 | 6 | 1.103 | 21.651 | 6.344 | 0.049 | – | – | – | – |
| 1788-34 E | 0.28 | 51 | 1.340 | 11.450 | 6.382 | 0.061 | – | – | – | – |
| 1788-35 E | 0.35 | 4 | 1.286 | 21.088 | 6.321 | 0.062 | – | – | – | – |
| 1788-36 E | 0.4 | 115 | 1.216 | 12.896 | 6.372 | 0.041 | – | – | – | – |
| 1788-37 E | 0.3 | 61 | 1.106 | 17.059 | 6.313 | 0.073 | – | – | – | – |
| 1788-38 E | 0.54 | 279 | 2.810 | 0.237 | 6.300 | 0.064 | 58.9 | 12.2 | 7.262 | 0.270 |
| Mean: | ||||||||||
| 1788 D | 5.59 | 2793 | 3.335 | 0.018 | 6.402 | 0.013 | 71.5 | 1.2 | 7.616 | 0.054 |
| 1788 E | 0.78 | 293 | 2.900 | 0.177 | 5.920 | 0.109 | 67.0 | 10.8 | 6.936 | 0.332 |
| Sample1810 | U (ppm) | U/Th | 230Th/238U | 2σ | 234U/238U | 2σ | Age (ka) | 2s (ka) | (234U/238U)i | 2σ |
| 1810-1 D | 7.07 | 348 | 3.231 | 0.021 | 5.814 | 0.017 | 77.9 | 1.6 | 7.003 | 0.056 |
| 1810-2 D | 8.29 | 411 | 3.112 | 0.030 | 5.863 | 0.010 | 73.4 | 2.1 | 6.986 | 0.062 |
| 1810-3 D | 8.88 | 979 | 3.106 | 0.027 | 5.929 | 0.010 | 72.1 | 1.8 | 7.046 | 0.060 |
| 1810-4 D | 9.19 | 833 | 3.049 | 0.044 | 5.993 | 0.011 | 69.4 | 2.6 | 7.079 | 0.066 |
| 1810-5 D | 9.17 | 508 | 2.937 | 0.047 | 5.990 | 0.007 | 66.2 | 2.8 | 7.020 | 0.066 |
| 1810-6 D | 9.12 | 3.143 | 6.919 | 5.981 | 0.012 | – | – | – | – | |
| 1810-7 D | 7.95 | 432 | 3.099 | 0.018 | 5.977 | 0.013 | 71.1 | 1.3 | 7.089 | 0.054 |
| 1810-8 D | 8.84 | 489 | 2.986 | 0.074 | 6.035 | 0.060 | 67 | 4.1 | 7.088 | 0.084 |
| 1810-9 D | 9.39 | 15905 | 3.122 | 0.013 | 5.870 | 0.006 | 73.6 | 1.1 | 6.999 | 0.052 |
| 1810-10 D | 9.78 | 7839 | 3.165 | 0.017 | 5.873 | 0.011 | 74.8 | 1.3 | 7.024 | 0.054 |
| 1810-11 D | 9.03 | 7242 | 3.174 | 0.030 | 5.888 | 0.015 | 74.8 | 2.0 | 7.043 | 0.058 |
| 1810-12 D | 9.53 | 9626 | 3.157 | 0.019 | 5.889 | 0.009 | 74.3 | 1.4 | 7.036 | 0.054 |
| 1810-13 D | 10.19 | 10240 | 3.094 | 0.018 | 5.904 | 0.008 | 72.2 | 1.3 | 7.016 | 0.052 |
| 1810-14 D | 10.64 | 14463 | 3.155 | 0.030 | 5.958 | 0.010 | 73.1 | 1.9 | 7.099 | 0.058 |
| 1810-15 E | −0.384 | 146.036 | 1.965 | 0.186 | – | – | – | – | ||
| 1810-16 E | −1.060 | 48.168 | 1.014 | 0.108 | – | – | – | – | ||
| 1810-17 E | 5.403 | 17.573 | 2.357 | 0.194 | – | – | – | – | ||
| 1810-18 E | 3.195 | 9.109 | 4.054 | 0.062 | – | – | – | – | ||
| 1810-19 E | 0.54 | 426 | 4.009 | 0.186 | 5.054 | 0.109 | 130.8 | 21.8 | 6.872 | 0.466 |
| 1810-20 E | 0.85 | 328 | 3.625 | 0.119 | 4.287 | 0.137 | 146.8 | 22.7 | 5.984 | 0.524 |
| 1810-21 E | 5.009 | 4.474 | 4.494 | 0.186 | – | – | – | – | ||
| 1810-22 E | 7.690 | 8.225 | 4.349 | 0.351 | – | – | – | – | ||
| 1810-23 E | 9.912 | 1.843 | 5.153 | 0.599 | – | – | – | – | ||
| 1810-24 E | 0.661 | 166.056 | 1.877 | 0.144 | – | – | – | – | ||
| 1810-25 E | 7.408 | 9.386 | 4.964 | 0.557 | – | – | – | – | ||
| 1810-26* E | 0.73 | 3.762 | 4.100 | 4.735 | 0.100 | – | – | – | – | |
| 1810-27* E | 0.14 | 3 | 5.271 | 4.510 | 4.255 | 0.112 | – | – | – | – |
| 1810-28* E | 0.18 | 5 | 3.541 | 8.079 | 4.562 | 0.081 | – | – | – | – |
| 1810-29* E | 0.25 | 9 | 3.511 | 7.095 | 4.562 | 0.058 | – | – | – | – |
| 1810-30* E | 0.21 | 3 | 4.027 | 5.291 | 4.073 | 0.149 | – | – | – | – |
| 1810-31* E | 0.09 | 1 | 3.875 | 39.136 | 4.029 | 0.072 | – | – | – | – |
| 1810-32* E | 0.05 | 2 | 2.469 | 9.099 | 4.187 | 0.072 | – | – | – | – |
| 1810-33* E | 0.06 | 1 | 2.602 | 24.169 | 4.426 | 0.141 | – | – | – | – |
| 1810-34* E | 0.91 | 2010 | 3.131 | 0.068 | 4.561 | 0.032 | 105.2 | 7.0 | 5.798 | 0.128 |
| 1810-35 E | 1.01 | 3 | 4.291 | 15.514 | 4.085 | 0.025 | – | – | – | – |
| 1810-36 E | 0.04 | 99 | 6.297 | 8.890 | 4.060 | 0.242 | – | – | – | – |
| 1810-37 E | 528 | 5.753 | 3.932 | 4.385 | 0.234 | – | – | – | – | |
| 1810-38 E | 0.02 | 55 | 5.687 | 28.490 | 4.211 | 0.437 | – | – | – | – |
| 1810-39 E | 0.01 | 17 | 4.203 | 31.048 | 4.474 | 0.314 | – | – | – | – |
| 1810-40 E | 2.09 | 1586 | 3.993 | 0.049 | 4.993 | 0.037 | 132.5 | 6.2 | 6.814 | 0.146 |
| Mean: | ||||||||||
| 1810 D | 9.07 | 5332 | 3.107 | 0.030 | 5.922 | 0.0145 | 72.3 | 1.9 | 7.040 | 0.060 |
| 1810 E | 1.10 | 1088 | 3.690 | 0.105 | 4.724 | 0.0788 | 128.8 | 14.4 | 6.595 | 0.316 |
| Sample1841 | U (ppm) | U/Th | 230Th/238U | 2σ | 234U/238U | 2σ | Age (ka) | 2s (ka) | (234U/238U)i | 2σ |
| 1841-1 E | 2.51 | 4.415 | 3.252 | 5.851 | 0.035 | – | – | – | – | |
| 1841-2 E | 1.96 | 4.268 | 7.631 | 5.842 | 0.044 | – | – | – | – | |
| 1841-3 E | 2.37 | 218 | 4.319 | 0.041 | 5.871 | 0.021 | 115.5 | 3.5 | 7.758 | 0.090 |
| 1841-4 E | 1.88 | 350 | 4.261 | 0.046 | 5.891 | 0.016 | 112.6 | 3.6 | 7.730 | 0.082 |
| 1841-5 E | 2.5 | 214 | 4.378 | 0.045 | 5.846 | 0.032 | 118.7 | 4.3 | 7.784 | 0.124 |
| 1841-6 E | 2.5 | 12 | 4.428 | 2.744 | 5.881 | 0.044 | – | – | – | – |
| 1841-7 E | 2.4 | 63 | 4.484 | 1.744 | 5.946 | 0.044 | – | – | – | – |
| 1841-8 E | 2.14 | 47 | 4.499 | 2.467 | 5.962 | 0.037 | – | – | – | – |
| Mean: | ||||||||||
| 1841 E | 2.25 | 261 | 4.319 | 0.044 | 5.869 | 0.023 | 115.6 | 3.8 | 7.757 | 0.099 |
Table 5
Summary table of U-Th disequilibrium ages obtained for two H. naledi teeth (samples 1788 and 1810) from the Dinaledi Chamber obtained by GU-ANU. No age calculations were carried out for U concentrations of ≤0.5 ppm or U/Th ≤250 (indicated in red and underlined). Negative U/Th values are due to the Th background being higher than the measured values. Mean values in this table only incorporate values from which meaningful ages could be calculated (indicated in black). All uncertainties are given as 2σ. CS = Closed System; Diff = diffusion (i.e., calculated ages are based on the assumption of continuous diffusion after Sambridge et al. (2012).
| Sample 1810a | U (ppm) | U/Th | 230Th/238U | 2σ | 234U/238U | 2σ | Age – CS (ka) | 2σ (ka) | Age – Diff (ka) | 2σ (ka) | (234U/238U)i* | 2σ |
|---|---|---|---|---|---|---|---|---|---|---|---|---|
| 1 E | 0.03 | −27 | 3.7113 | 1.2508 | 4.4302 | 0.8881 | n/a | – | – | – | – | – |
| 2 E | 0.02 | −19 | 3.1648 | 0.9390 | 4.2083 | 0.4703 | n/a | – | – | – | – | – |
| 3 E | 0.04 | −33 | 3.0257 | 1.0531 | 5.1220 | 0.4988 | n/a | – | – | – | – | – |
| 4 E | 0.05 | −35 | 3.6352 | 1.3897 | 4.9224 | 0.4912 | n/a | – | – | – | – | – |
| 5 E | 0.19 | −258 | 3.4504 | 0.1965 | 4.8106 | 0.1376 | n/a | – | – | – | – | – |
| 6 D | 6.07 | −2972 | 3.2909 | 0.0666 | 5.9801 | 0.0559 | 77.2 | 2.3 | 87.3 | 2.7 | 7.19 | 0.11 |
| 7 D | 6.10 | −5354 | 3.2618 | 0.0824 | 5.9768 | 0.0312 | 76.3 | 2.6 | 86.2 | 3.3 | 7.17 | 0.08 |
| 8 D | 6.39 | 11436 | 3.3169 | 0.0800 | 5.9827 | 0.0514 | 77.9 | 2.6 | 88.3 | 3.3 | 7.21 | 0.11 |
| 9 D | 6.47 | 6193 | 3.3318 | 0.0899 | 5.9470 | 0.0873 | 79.0 | 3.2 | 89.7 | 3.8 | 7.18 | 0.17 |
| 10 D | 6.65 | −5055 | 3.4985 | 0.1048 | 6.0462 | 0.0403 | 82.5 | 3.4 | 94.4 | 4.5 | 7.37 | 0.11 |
| 11 D | 6.95 | 5149 | 3.5465 | 0.0910 | 6.0531 | 0.0406 | 83.8 | 3.0 | 96.3 | 4.0 | 7.40 | 0.11 |
| 12 D | 7.15 | 3244 | 3.5238 | 0.0997 | 6.0501 | 0.0423 | 83.2 | 3.3 | 95.4 | 4.3 | 7.39 | 0.11 |
| Mean: | ||||||||||||
| 1–5 E | 0.07 ± 0.06 | 3.4321 | 0.3003 | 4.7962 | 0.1504 | 112.0 | 15.7 | 137.1 | 25.5 | – | – | |
| 6–12 D | 6.54 ± 0.31 | 3.4018 | 0.0749 | 6.0070 | 0.0428 | 80.1 | 2.5 | 91.1 | 3.2 | 7.27 | 0.11 | |
| Sample 1810b | U (ppm) | U/Th | 230Th/238U | 2σ | 234U/238U | 2σ | Age – CS (ka) | 2σ (ka) | Age – Diff (ka) | 2σ (ka) | (234U/238U)i* | 2σ |
|---|---|---|---|---|---|---|---|---|---|---|---|---|
| 1 E | 0.01 | 17 | 6.8442 | 14.0435 | 0.0228 | 5.5626 | n/a | – | – | – | – | – |
| 2 E | 0.00 | 3 | 9.2330 | 16.2333 | −2.2838 | 4.6085 | n/a | – | – | – | – | – |
| 3 E | 0.00 | –2 | 16.1688 | 27.6564 | −0.1033 | 7.6336 | n/a | – | – | – | – | – |
| 4 E | 0.00 | –3 | 14.9980 | 967.0421 | −0.7695 | 259.2590 | n/a | – | – | – | – | – |
| 5 E | 0.02 | −182 | 7.1338 | 296.1136 | 3.6250 | 48.0742 | n/a | – | – | – | – | – |
| 6 E | 0.86 | −2493 | 4.5176 | 0.1786 | 4.6588 | 0.0795 | 189.1 | 16.7 | 381.3 | 137.9 | 7.24 | 0.44 |
| 7 E | 0.98 | −603 | 4.8797 | 0.1416 | 4.8737 | 0.0681 | 201.4 | 14.0 | 0.0 | 0.0 | 7.84 | 0.40 |
| 8 D | 4.49 | 20423 | 3.5778 | 0.0670 | 5.9327 | 0.0773 | 87.1 | 2.7 | 100.8 | 3.1 | 7.31 | 0.15 |
| 9 D | 5.35 | −10128 | 3.3046 | 0.0659 | 5.9142 | 0.0677 | 78.7 | 2.4 | 89.2 | 2.8 | 7.14 | 0.13 |
| 10 D | 5.67 | −4197 | 3.4077 | 0.0777 | 5.9480 | 0.0459 | 81.3 | 2.6 | 92.8 | 3.3 | 7.23 | 0.10 |
| Mean: | ||||||||||||
| 1–5 E | 8.7750 | 204.6988 | 1.6547 | 93.9630 | n/a | - | - | - | - | - | ||
| 6–7 E | 0.92 ± 0.12 | 4.7101 | 0.1465 | 4.7730 | 0.0602 | 195.7 | 13.8 | 471.0 | 269.4 | 7.54 | 0.42 | |
| 8–10 D | 5.17 ± 0.70 | 3.4214 | 0.0790 | 5.9319 | 0.0523 | 82.1 | 2.7 | 93.7 | 3.6 | 7.23 | 0.13 | |
| Sample 1788a | U (ppm) | U/Th | 230th/238U | 2σ | 234U/238U | 2σ | Age – CS (ka) | 2σ (ka) | Age – Diff (ka) | 2σ (ka) | (234U/238U)i* | 2σ |
|---|---|---|---|---|---|---|---|---|---|---|---|---|
| 1E | 0.03 | 4877 | 2.1095 | 3.3058 | 3.5740 | 1.6107 | n/a | – | – | – | – | – |
| 2E | 0.01 | −21 | 3.7845 | 5.5271 | 1.3525 | 2.7713 | n/a | – | – | – | – | – |
| 3E | 0.00 | –1 | 10.5030 | 27.8940 | −2.4909 | 10.1171 | n/a | – | – | – | – | – |
| 4E | 0.00 | –1 | 9.0249 | 113.8912 | −0.7120 | 32.3636 | n/a | – | – | – | – | – |
| 5E | 0.00 | –2 | 6.6795 | 66.2750 | 0.7769 | 18.7506 | n/a | – | – | – | – | – |
| 6E | 0.01 | –6 | 3.0231 | 0.9844 | 2.1904 | 0.4875 | n/a | – | – | – | – | – |
| 7E | 0.24 | −105 | 2.8139 | 0.2076 | 6.3791 | 0.1624 | n/a | – | – | – | – | – |
| 8E | 0.24 | −204 | 1.6495 | 1.5811 | 6.0123 | 0.2961 | n/a | – | – | – | – | – |
| 9E | 0.19 | 579 | 2.4075 | 4.2620 | 6.3341 | 1.3187 | n/a | – | – | – | – | – |
| 10E | 0.48 | 189 | 3.1717 | 2.2862 | 6.1006 | 0.1341 | n/a | – | – | – | – | – |
| 11E | 1.34 | 13833 | 3.8792 | 0.2864 | 6.3521 | 0.1024 | 88.5 | 9.2 | 102.9 | 12.6 | 7.87 | 0.32 |
| 12E | 2.57 | 755 | 4.1770 | 0.0609 | 6.3275 | 0.0972 | 98.6 | 3.0 | 117.7 | 3.1 | 8.04 | 0.19 |
| Mean: | ||||||||||||
| 1–6 E | 3.5188 | 4.4531 | 2.3471 | 7.1463 | n/a | - | - | - | – | – | ||
| 7–10 E | 0.29 ± 0.13 | 2.6484 | 0.2469 | 6.1824 | 0.0978 | 56.2 | 6.5 | 61.0 | 7.7 | – | – | |
| 11–12 E | 1.96 ± 1.23 | 4.0746 | 0.0941 | 6.3361 | 0.0482 | 95.1 | 3.2 | 112.3 | 4.7 | 7.96 | 0.26 | |
| Sample 1788b | U (ppm) | U/Th | 230Th/238U | 2σ | 234U/238U | 2σ | Age – CS (ka) | 2σ (ka) | Age – Diff (ka) | 2σ (ka) | (234U/238U)i* | 2σ |
|---|---|---|---|---|---|---|---|---|---|---|---|---|
| 1E | 0.02 | 4 | 2.3945 | 1.8774 | 3.5040 | 1.4368 | n/a | – | – | – | – | – |
| 2E | 0.02 | 14 | 1.9656 | 1.3299 | 3.3099 | 0.9022 | n/a | – | – | – | – | – |
| 3E | 0.01 | –8 | 2.8156 | 2.1034 | 2.5359 | 0.8082 | n/a | – | – | – | – | – |
| 4E | 0.02 | 160 | 2.1024 | 58.1854 | 3.2342 | 7.4009 | n/a | – | – | – | – | – |
| 5E | 0.03 | −31 | 2.3859 | 1.4084 | 4.1285 | 1.5222 | n/a | – | – | – | – | – |
| 6E | 0.03 | −20 | 2.8951 | 11.2911 | 4.1046 | 3.9747 | n/a | – | – | – | – | – |
| 7E | 0.02 | −10 | 2.8486 | 3.5383 | 4.9362 | 2.3343 | n/a | – | – | – | – | – |
| 8E | 0.03 | −18 | 2.8325 | 1.6113 | 5.7052 | 0.7139 | n/a | – | – | – | – | – |
| Mean: | ||||||||||||
| 1–8 E | 2.5597 | 6.7618 | 4.1308 | 1.2209 | n/a | – | – | – | – | – | ||
| Sample 1788c | U (ppm) | U/Th | 230th/238U | 2σ | 234U/238U | 2σ | Age – CS (ka) | 2σ (ka) | Age – Diff (ka) | 2σ (ka) | (234U/238U)i* | 2σ |
|---|---|---|---|---|---|---|---|---|---|---|---|---|
| 1D | 5.44 | 21578 | 3.9281 | 0.0707 | 6.4260 | 0.0740 | 88.6 | 2.6 | 103.0 | 3.1 | 7.97 | 0.15 |
| 2D | 5.39 | 155037 | 3.8908 | 0.0565 | 6.4416 | 0.0524 | 87.2 | 2.0 | 101.0 | 2.4 | 7.96 | 0.11 |
| 3D | 4.95 | 1708 | 3.8901 | 0.0828 | 6.4085 | 0.0792 | 87.8 | 3.0 | 102.0 | 3.6 | 7.93 | 0.16 |
| 4D | 3.87 | 1653 | 3.8033 | 0.0859 | 6.3786 | 0.1068 | 85.8 | 3.3 | 99.0 | 3.6 | 7.85 | 0.20 |
| 5D | 4.25 | 1168 | 3.9569 | 0.0800 | 6.4051 | 0.0957 | 90.0 | 3.1 | 105.0 | 3.6 | 7.97 | 0.19 |
| 6D | 5.12 | 1493 | 3.9433 | 0.0579 | 6.4951 | 0.0961 | 87.8 | 2.5 | 102.0 | 2.5 | 8.04 | 0.17 |
| 7D | 5.34 | 2659 | 3.8020 | 0.0581 | 6.4713 | 0.0581 | 84.0 | 2.0 | 96.7 | 2.4 | 7.94 | 0.11 |
| 8D | 5.06 | 1093 | 3.9948 | 0.0672 | 6.4479 | 0.0630 | 90.3 | 2.4 | 105.5 | 3.0 | 8.03 | 0.13 |
| 9D | 4.78 | 1018 | 4.0481 | 0.0718 | 6.4468 | 0.0586 | 92.0 | 2.5 | 108.0 | 3.3 | 8.06 | 0.13 |
| 10D | 5.22 | 817 | 3.9011 | 0.0582 | 6.5187 | 0.0813 | 86.1 | 2.3 | 99.6 | 2.4 | 8.04 | 0.15 |
| 11D | 5.25 | 425 | 3.8872 | 0.0850 | 6.4415 | 0.0624 | 87.1 | 2.8 | 101.0 | 3.6 | 7.96 | 0.14 |
| 12D | 5.46 | 345 | 3.9561 | 0.0584 | 6.4658 | 0.0733 | 88.8 | 2.3 | 103.3 | 2.5 | 8.03 | 0.14 |
| Mean: | ||||||||||||
| 1–12 D | 5.01 ± 0.28 | 3.9175 | 0.0796 | 6.4479 | 0.0461 | 87.9 | 2.6 | 102.0 | 3.6 | 7.98 | 0.06 | |
Table 6
Summary table of model parameters used in ESR dating separated by sample number and laboratory. See text for detailed discussion.
| Sample: | 1767 | 1788 | 1810 | 1841 | ||
|---|---|---|---|---|---|---|
| Laboratory: | SCU | SCU | Cenieh-gu | SCU | Cenieh-gu | SCU |
| Enamel: | ||||||
| De (Gy) | 194 ± 4 | 231 ± 8 | 159 ± 10 | 296 ± 14 | 232 ± 30 | 1676 ± 127 |
| U (ppm) | 2.52 ± 0.53 | 0.38 ± 0.17 | 0.07 ± 0.07 | 0.32 ± 0.12 | 0.16 ± 0.16 | 2.28 ± 0.48 |
| 234U/238U | 6.21 ± 0.03 | 5.95 ± 0.32 | 6.258 ± 0.349 | 4.04 ± 0.18 | 4.773 ± 0.060 | 5.87 ± 0.03 |
| 230Th/234U | 0.37 ± 0.05 | 0.55 ± 0.52 | 0.598 ± 0.038 | 0.92 ± 0.05 | 0.950 ± 0.034 | 0.785 ± 0.038 |
| Alpha efficiency* | 0.13 ± 0.02 | 0.13 ± 0.02 | 0.13 ± 0.02 | 0.13 ± 0.02 | 0.13 ± 0.02 | 0.13 ± 0.02 |
| Initial thickness (μm) | 1027 ± 210 | 1049 ± 277 | 1486 ± 248 | 1150 ± 250 | 1527 ± 257 | 650 ± 145 |
| Water (%) | 0 | 0 | 0 | 0 | 0 | 0 |
| Dentine: | ||||||
| U (ppm) | 7.88 ± 0.66 | 5.76 ± 0.86 | 4.71 ± 0.27 | 9.08 ± 0.44 | 5.81 ± 0.37 | – |
| 234U/238U | 6.28 ± 0.09 | 6.40 ± 0.03 | 6.448 ± 0.046 | 5.93 ± 0.03 | 5.969 ± 0.035 | – |
| 230Th/234U | 0.35 ± 0.11 | 0.62 ± 0.02 | 0.608 ± 0.012 | 0.52 ± 0.09 | 0.572 ± 0.010 | – |
| Water (%) | 10 ± 5 | 10 ± 5 | 10 ± 5 | 10 ± 5 | 10 ± 5 | – |
| Sediment: | ||||||
| U (ppm) | 3.0 ± 0.3 | 2.9 ± 0.1 | 2.9 ± 0.1 | 3.2 ± 0.3 | 3.2 ± 0.3 | 0.64 ± 0.06† |
| Th (ppm) | 7.9 ± 0.4 | 8.3 ± 0.6 | 8.3 ± 0.6 | 8.6 ± 0.4 | 8.6 ± 0.4 | 4.72 ± 0.47† |
| K (%) | 1.17 ± 0.14 | 1.21 ± 0.14 | 1.21 ± 0.14 | 1.23 ± 0.14 | 1.23 ± 0.14 | 1.47 ± 0.15† |
| Water (%) | 25 ± 10 | 25 ± 10 | 25 ± 10 | 25 ± 10 | 25 ± 10 | 25 ± 10 |
| Depth below ground surface (cm) | 0 | 2 | 2 | 5 | 5 | 55 |
| Gamma Dose rate (μGy a−1) | ||||||
| 25 ± 10% Water, 80% Rn degassing 25 ± 10% Water, no Rn degassing | 534 ± 69 724 ± 116 | 534 ± 69 724 ± 116 | 534 ± 69 724 ± 116 | 534 ± 69 724 ± 116 | 534 ± 69 724 ± 116 | 534 ± 69 724 ± 116 |
| Cosmic dose rate (μGy a−1) | 15 ± 1 | 15 ± 1 | 15 ± 1 | 15 ± 1 | 15 ± 1 | 15 ± 1 |
-
*After Woodroffe et al. (1991);
-
†A relative error of ± 10% was assumed.
Table 7
Summary of ESR dating results (2σ uncertainties) for two end-member scenarios: (i) complete burial of the samples, 80% Rn loss in the sediment and post Th-230 equilibrium in dental tissue (i.e., maximum age scenario); (ii) complete burial of the samples and post-Rn equilibrium in sediment (i.e., minimum age scenario). See text for detailed discussion.
| Sample: | 1767 | 1788 | 1810 | 1841 | ||
|---|---|---|---|---|---|---|
| Laboratory: | SCU | SCU | Cenieh-gu | SCU | Cenieh-gu | SCU |
| internal dose rate (μGy a−1) | 1142 ± 515 | 190 ± 129 | 47 ± 47 | 323 ± 175 | 176 ± 176 | 1411 ± 596 |
| alpha (μGy a−1)* | 0 | 0 | 8 ± 2 | 0 | 8 ± 2 | 0† |
| beta dose rate, dentine (μGy a−1) | 73 ± 33 | 91 ± 62 | 64 ± 16 | 75 ± 41 | 51 ± 14 | –‡ |
| beta dose rate, sediment (μGy a−1) | 101 ± 24 | 105 ± 31 | 86 ± 17 | 95 ± 24 | 86 ± 18 | 358 ± 74 |
| gamma and cosmic (μGy a−1) | 549 ± 69 | 549 ± 69 | 549 ± 69 | 549 ± 69 | 549 ± 69 | 549 ± 69 |
| total dose rate (μGy a−1) | 1865 ± 521 | 935 ± 162 | 754 ± 87 | 1042 ± 194 | 870 ± 190 | 2318 ± 606 |
| p enamel | −0.03 | 0.49 | −0.02 | −0.70 | −0.77 | 0.91 |
| p dentine | 0.08 | 0.13 | −0.06 | 1.02 | 0.54 | – |
| Age (ka) | 104 ± 29 | 247 ± 42 | 211 ± 28 | 284 ± 51 | 267 ± 68 | 723 ± 181 |
| Combined SCU/CENIEH-GU age (ka) | 229 + 60/–46 | 276 + 59/–77 | ||||
| Average age for 1788 & 1810 (ka) | 253 + 82/–70 | |||||
| internal dose rate (μGy a−1) | 1277 ± 552 | 216 ± 165 | 51 ± 51 | 335 ± 193 | 184 ± 184 | 1520 ± 630 |
| alpha (μGy a−1)* | 0 | 0 | 8 ± 2 | 0 | 8 ± 2 | 0 |
| beta dose rate, dentine (μGy a−1) | 82 ± 35 | 102 ± 78 | 69 ± 18 | 87 ± 50 | 59 ± 16 | -- |
| beta dose rate, sediment (μGy a−1) | 132 ± 26 | 134 ± 33 | 111 ± 19 | 126 ± 26 | 112 ± 19 | 380 ± 81 |
| gamma and cosmic (μGy a−1) | 739 ± 116 | 739 ± 116 | 739 ± 116 | 739 ± 116 | 739 ± 116 | 739 ± 116 |
| total dose rate (μGy a−1) | 2230 ± 586 | 1191 ± 219 | 978 ± 129 | 1287 ± 232 | 1102 ± 219 | 2639 ± 647 |
| p enamel | −0.31 | 0.06 | −0.37 | −0.83 | −0.91 | 0.67 |
| p dentine | −0.22 | −0.22 | −0.40 | 0.54 | 0.10 | – |
| Age (ka) | 87 ± 22 | 194 ± 34 | 163 ± 24 | 230 ± 40 | 210 ± 50 | 635 ± 148 |
| Combined SCU/CENIEH-GU age (ka) | 179 + 49/–40 | 220 + 50/–60 | ||||
| Average age for 1788 & 1810 (ka) | 200 + 70/–61 | |||||
-
*using alpha attenuation values of Grün (1987).
-
†considered as negligible given the low radioelement concentrations in the sediment and the high total dose rate value.
-
‡for 1841, the beta dose rate on both sides of the enamel layer is derived from the sediment.
Table 8
Summary of OSL results obtained by the University of the Witwatersrand for samples of Unit 1 from the Dinaledi Chamber (samples OSL3, 4 and 5). The ages were calculated using effective U concentration values (taking disequilibrium into account; see text for details). CAM = Central Age Model; MAM = Minimum Age Model.
| Sample ID | H2O (%) | Th (ppm) | U (ppm) pre-Rn | U (ppm) post-Rn | K (%) | Total dr (Gy/ka) | 2σ | Total de (Gy) CAM | 2σ | Total de (Gy) MAM | 2σ | CAM Age (ka) | CAM 2σ | MAM age (ka) | MAM 2σ | Over dispersion (%) |
|---|---|---|---|---|---|---|---|---|---|---|---|---|---|---|---|---|
| OSL3 | 18.9 ± 5 | 3.71 ± 1.60 | 0.75 ± 0.177 | 0.193 ± 0.044 | 0.45 ± 0.12 | 0.76 | 0.07 | 428.59 | 68.92 | 176.4 | 27.7 | 560 | 103 | 231 | 41 | 63 |
| OSL4 | 25.8 ± 5 | 3.38 ± 1.60 | 0.485 ± 0.177 | 0.097 ± 0.044 | 0.47 ± 0.12 | 0.70 | 0.06 | 379.89 | 43.58 | 168.0 | 20.7 | 546 | 79 | 241 | 37 | 55 |
| OSL5 | 22.7 ± 5 | 5.11 ± 1.60 | 0.692 ± 0.177 | 0.138 ± 0.044 | 0.56 ± 0.12 | 0.90 | 0.07 | 759.54 | 102.33 | 315.67 | 48.68 | 849 | 132 | 353 | 61 | 68 |
Table 9
Final mean palaeomagnetic data for all subsamples analysed from each phase of Flowstone 1a as shown in Figure 13. MAD = mean maximum angular deviation for individual samples; K = precision/sample dispersal parameter; Plat = palaeolatitude).
| Flowstone 1a | Declination (O) | Inclination (O) | MAD | K | Plat. | Polarity |
|---|---|---|---|---|---|---|
| Phase C | 15.5 | −39.7 | 3 | 70.8 | 75.4 | N |
| Phase B | 26 | −28.1 | 7.4 | 156.2 | 63.3 | N |
| Phase A | 156.4 | 15.9 | 5.7 | 30.2 | −60.0 | R |
Table 10
ESR fitting results obtained by SCU and CENIEH-GU. Both laboratories employed a Single Saturating Exponential (SSE) fitting function. Dmax was selected in accordance with Duval and Grün (2016) to avoid DE overestimation. SCU results in brackets show DE values that were obtained by SCU using the CENIEH-GU procedure (see text for details).
| SCU | Cenieh-gu | |||||
|---|---|---|---|---|---|---|
| Sample | DE (Gy) | Dmax (Gy) | Dmax/DE | DE (Gy) | Dmax (Gy) | Dmax/DE |
| 1767 | 194 ± 4 (193 ± 6) | 1264 | 7 | – | – | – |
| 1788 | 232 ± 8 (232 ± 22) | 1204 | 5 | 159 ± 11 | 1649 | 10 |
| 1810 | 296 ± 14 (281 ± 34) | 2735 | 9 | 232 ± 29 | 1649 | 7 |
| 1841 | 1676 ± 127 (1648 ± 500) | 3526 | 2 | – | – | – |
Download links
A two-part list of links to download the article, or parts of the article, in various formats.
Downloads (link to download the article as PDF)
Open citations (links to open the citations from this article in various online reference manager services)
Cite this article (links to download the citations from this article in formats compatible with various reference manager tools)
The age of Homo naledi and associated sediments in the Rising Star Cave, South Africa
eLife 6:e24231.
https://doi.org/10.7554/eLife.24231


