The comprehensive connectome of a neural substrate for ‘ON’ motion detection in Drosophila
- Janelia Research Campus, Howard Hughes Medical Institute, United States
- Simons Foundation, United States
- NYU Medical Center, United States
- Dalhousie University, Canada
Figures
Figure 1
Visual motion-detection pathways and circuits in Drosophila.
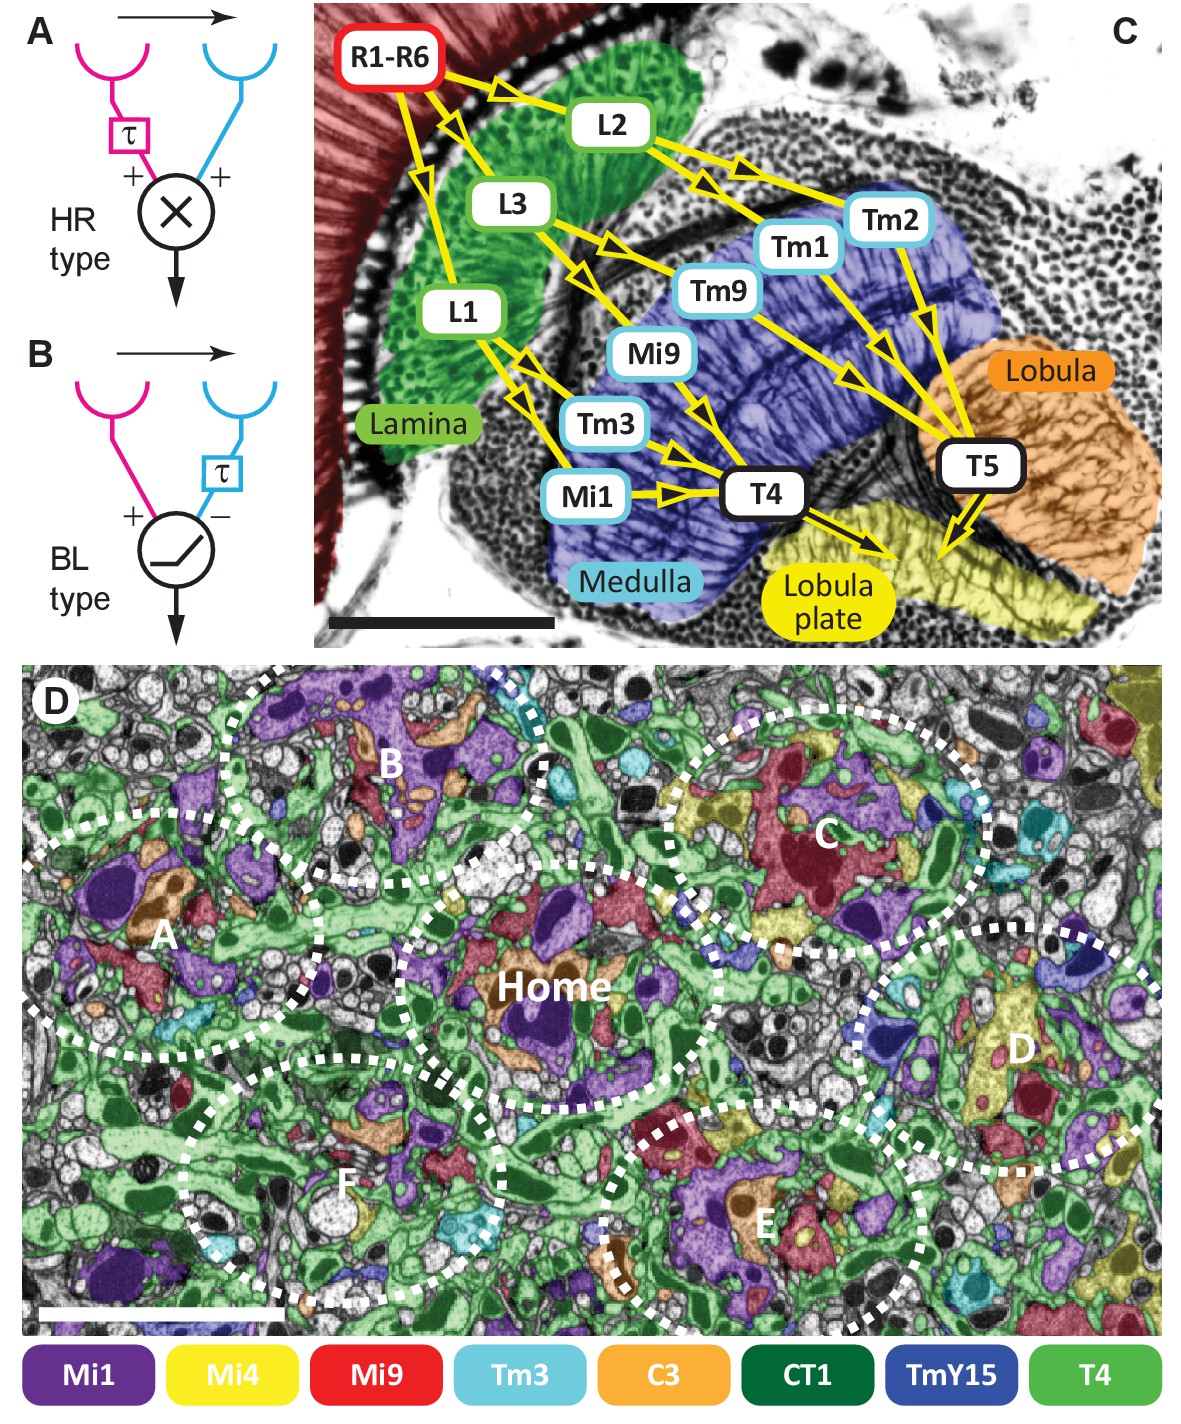
(A, B) Diagrams of two major predicted models of motion detection: (A) the Hassenstein-Reichardt (HR) and (B) Barlow-Levick (BL) type. In both models, two input channels with spatially offset fields of view, one with a delay component (τ), are combined non-linearly to generate directionally-selective responses. The illustrated detectors respond preferentially to rightwards-moving objects. (C) Bodian-stained horizontal section of the Drosophila optic lobe revealing the four optic neuropiles, lamina, medulla, lobula and lobula plate. Visual signals generated by photoreceptors R1-R6 are encoded by second-order interneurons in the lamina. ON-edge signals are fed by L1 and transmitted to direction-selective T4 cells via medulla interneurons (e.g. Mi1 and Tm3). OFF-edge signals are fed by L2 to direction-selective T5 cells in the lobula via transmedulla neurons (e.g. Tm1 and Tm2). (D) EM cross section at the level of T4 dendrites in medulla stratum M10. Neurites of T4 cells and their input neurons are colour-labelled (key). Unlabelled profiles are mostly axons that penetrate this layer without synapsing onto T4s. Seven reconstructed columns (Home, and A through F) are roughly outlined (dotted ovals). Scale bars, 50 µm (A) and 5 µm (D).
Figure 2 with 1 supplement
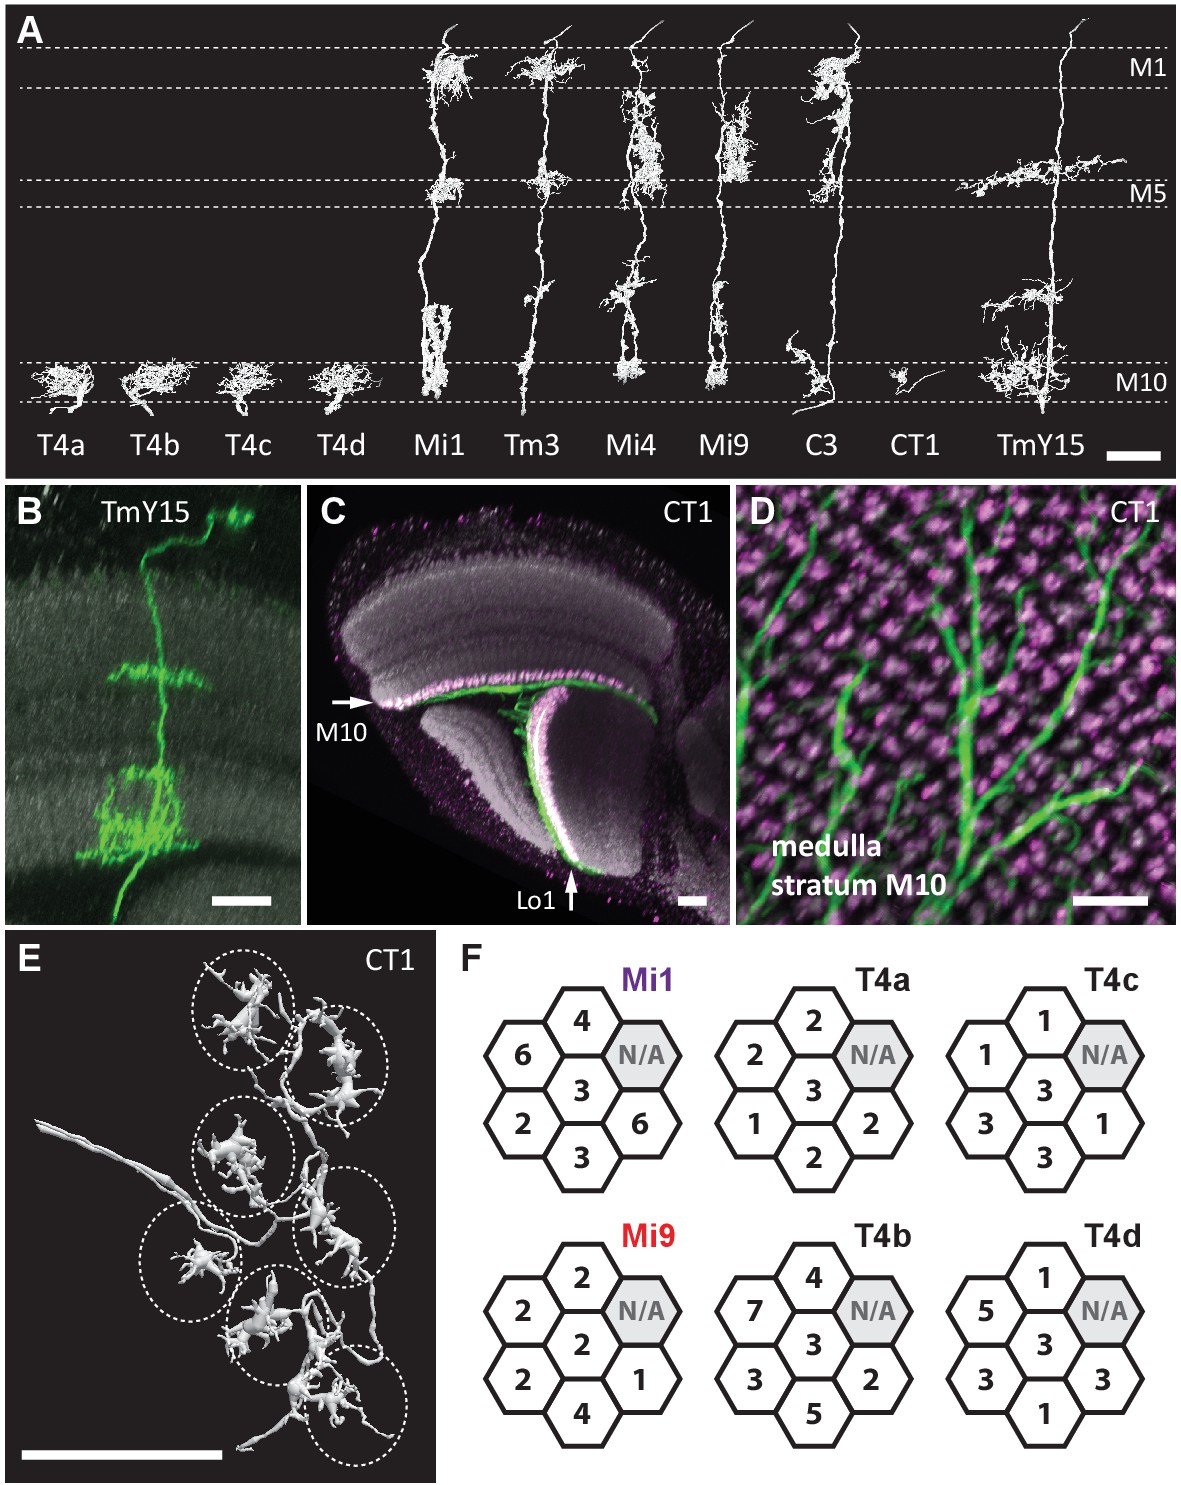
Eight cell types that provide >96% of synaptic inputs to T4 cells.
(A) Reconstructions of four T4 subtypes (T4a-T4d) identified in the central ‘Home’ column, and seven other cell types providing synaptic input to these. T4 also connects reciprocally with other T4s and is hence considered the eighth type. (B) Light microscopy of single-cell labelling for the medulla arbours of a TmY15 cell. TmY15 arbours extend to >10 medulla columns in stratum M10 (see Figure 2—figure supplement 1 for additional TmY15 anatomy). Grey: a neuropile marker. (C) Light microscopy of a single CT1 cell widely innervating M10 and distalmost lobula stratum Lo1. The cell body is located in the central brain (see Figure 2—figure supplement 1). Green: membrane marker; magenta: a presynaptic marker, both expressed in CT1; grey: a general neuropile marker (For details see Experimental Procedures). (D) Plan view of the CT1 cell in (C) generated from the same confocal stack. In medulla stratum M10, CT1 sends its arbour terminals to each medulla column, tiled highly regularly. (E) EM-reconstructions of CT1 terminal arbours in M10. CT1 terminals present in each column match light microscopy images. (F) CT1 is postsynaptic to Mi1, Mi9 and T4 cells. Synaptic inputs from these cell types shown separately for the CT1 terminal in each of the seven columns. In each column, CT1 receives a few (1-7) inputs from all cell types. The arbour in the upper-right column (N/A) was not reconstructed because it lay too close to the volume edge. Scale bars, 10 µm throughout.
Figure 2—figure supplement 1
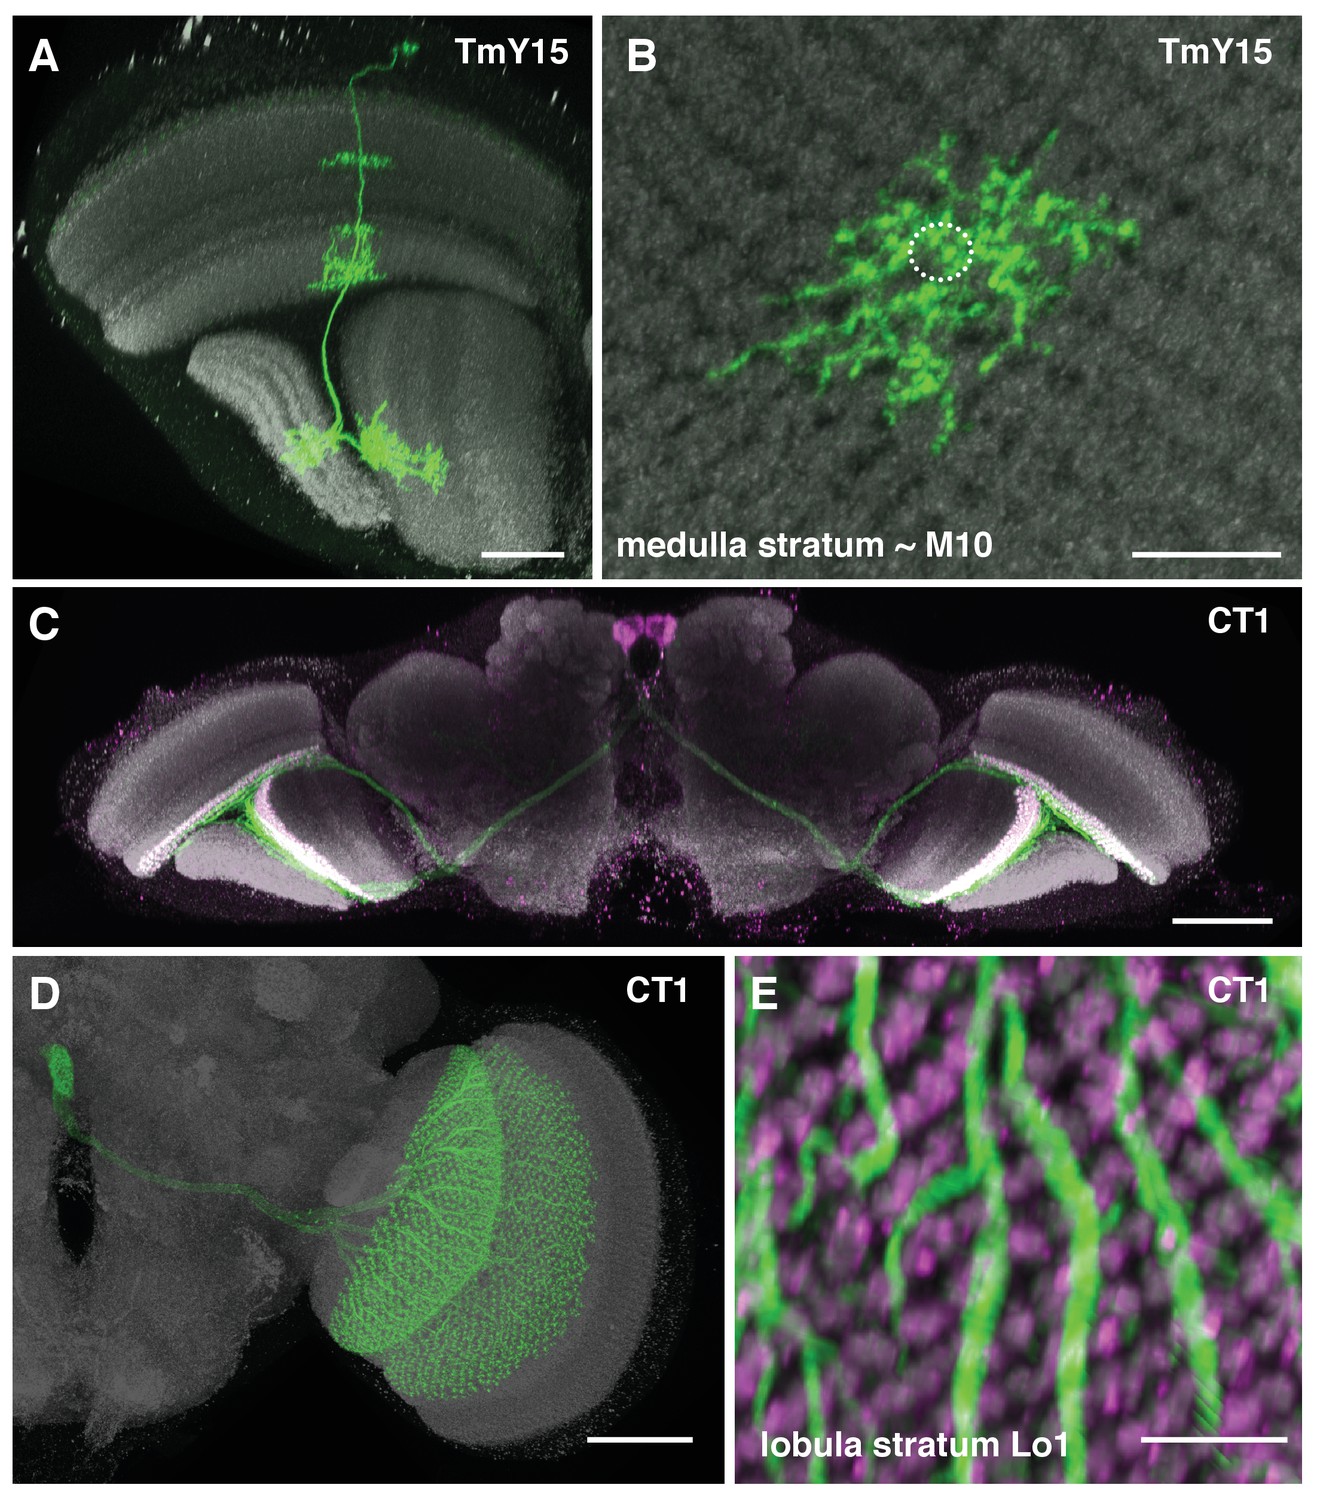
Additional TmY15 and CT1 anatomy.
(A) TmY15 neurons have arbours in the medulla, lobula and lobula plate neuropiles. In the lobula, the presence of some TmY15 branches in the distalmost layer is compatible with TmY15 being a synaptic partner of OFF-pathway T5 neurons. (B) Plan view of TmY15 arbours in the inner medulla (in and near stratum M10). Column structure of the medulla is apparent in the anti-Brp pattern. The approximate outline of one column is indicated (dotted circle). (C) Projection pattern of the two CT1 cells in an entire fly’s brain. Each cell has arbours in the medulla (stratum M10) and lobula (stratum Lo1). The cell bodies are located near the midline in the anterior central brain close to the antennal lobes; each cell projects to the contralateral optic lobe. (D) Image of an MCFO labeled single CT1 cell. Note the highly regular column pattern of the cells arbours. (E) CT1 arbours in a plan view of lobula layer Lo1. The regular columnar structure of CT1 in this layer (which contains T5 dendrites) is highly similar to its medulla arbours (which synapse with T4 dendrites). Scale bars, 20 µm (A), 10 µm (B, E), and 50 µm (C, D).
Figure 3
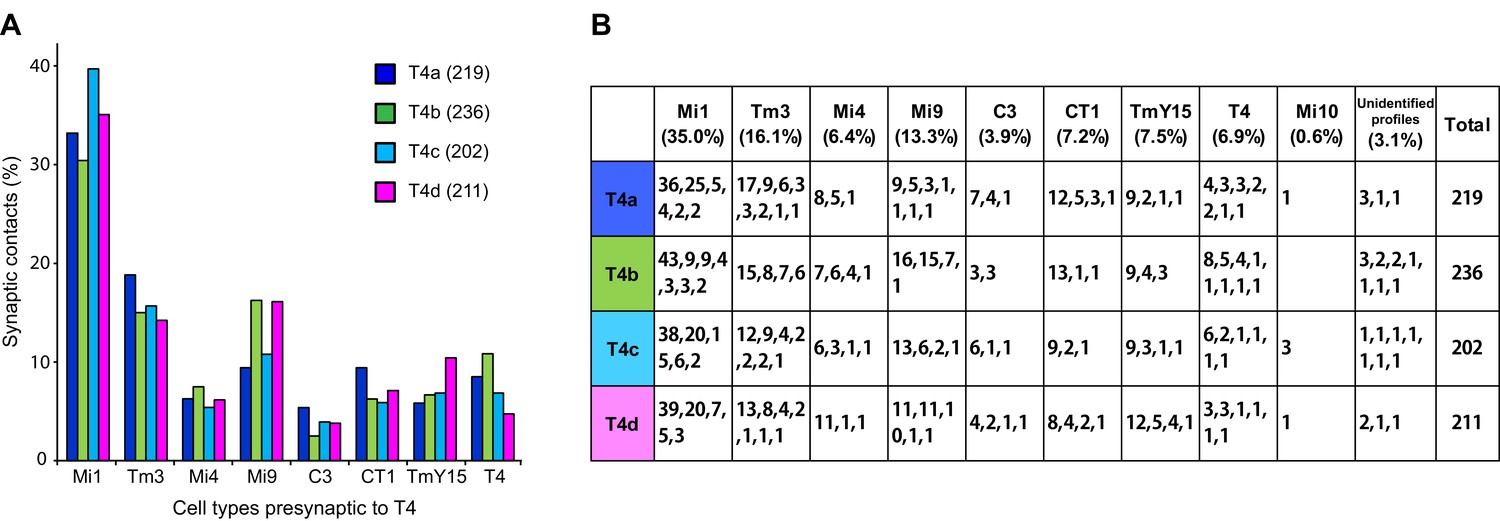
Total counts of synaptic inputs to T4 subtypes of the Home column.
(A) Fraction of the total synaptic connections for eight cell types presynaptic to T4s. Numbers in parentheses (key, upper right) are the gross synaptic input counts to each T4 subtype. (B) Number of synaptic inputs from individual presynaptic cells to the four T4 subtypes. Percentages for each input cell type are the mean fractions among the four T4 subtypes. Note that connections having only a single synapse are not used in the plots in Figure 4A.
Figure 4 with 3 supplements
Distributions of synaptic inputs onto T4.
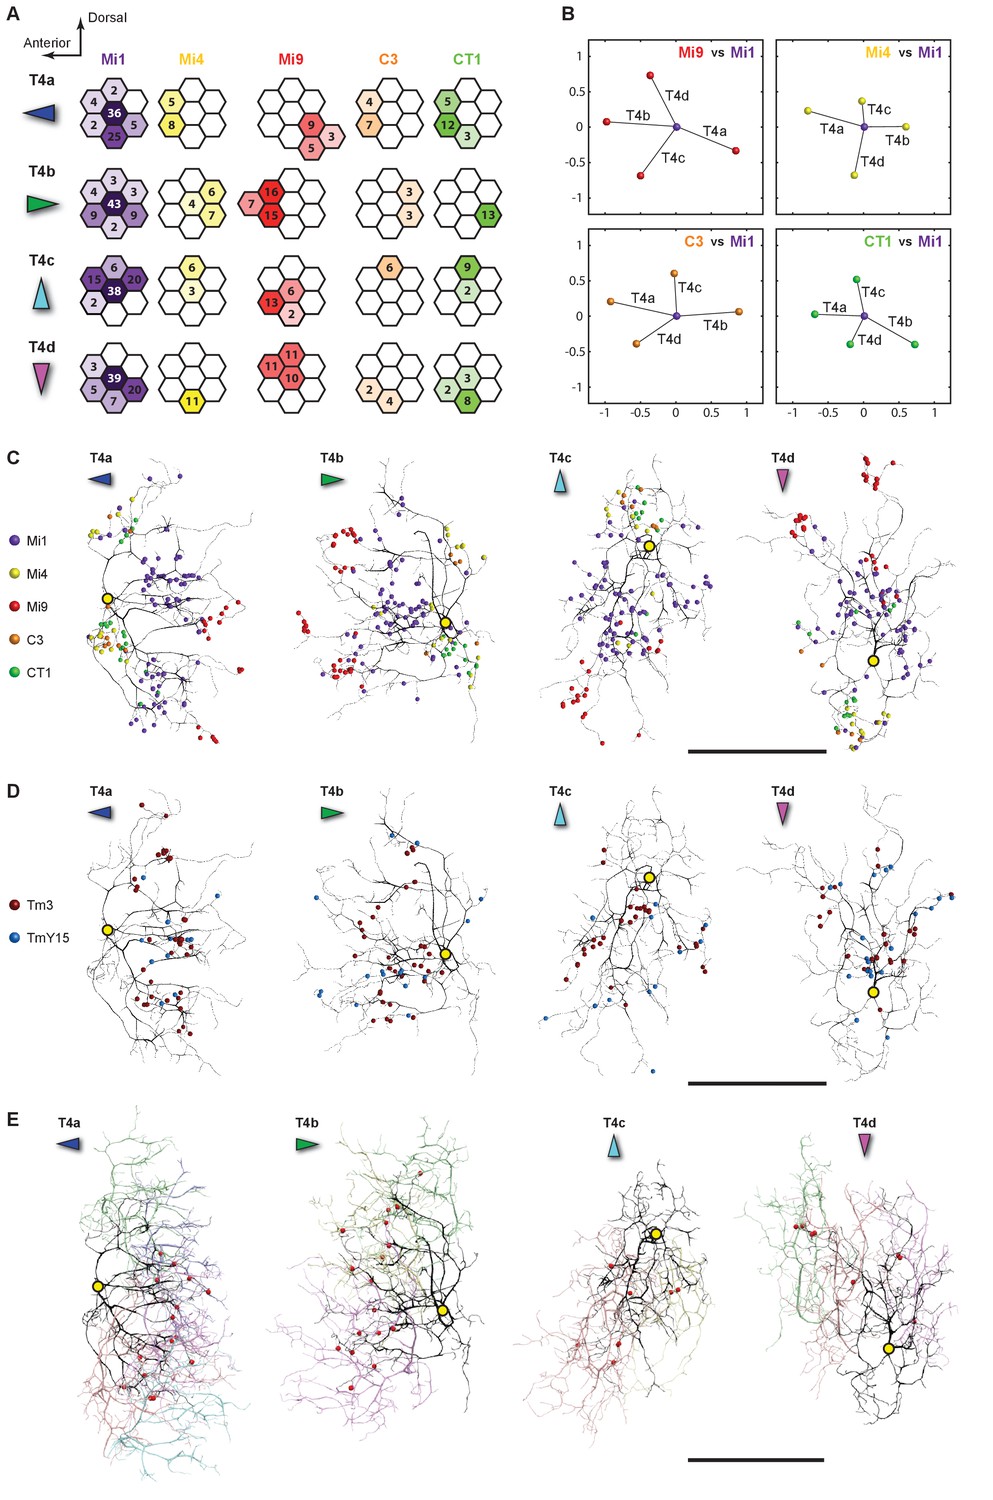
(A) Counts of synaptic inputs to T4s from each class of input neuron from neighbouring columns are shown in the corresponding hexagonal array. Cell types for which individual neurons cannot be unambiguously assigned to single columns are not included. Thus, Tm3 cells cannot be assigned to a particular column because they are multicolumnar (Figure 4—figure supplement 1). Analysis on another set of T4s confirms the results of the Home column T4s (Figure 4—figure supplement 3). (B) Angular subtense between weighted anatomical subfield centres for Mi1 paired with four other medulla cell input neurons for the four T4 subtypes. Axes of X and Y show centre-to-centre distances between adjacent columns. The plots show considerable spatial displacements, in some cases more than an inter-ommatidial distance (see Figure 4—figure supplement 2 for the limited analyses of Tm3 to Mi1-offset). (C) Distributions of synaptic inputs onto T4 dendrites. Colours of puncta correspond to presynaptic cell types. Yellow circles indicate the locations of the axon’s main trunk, relative to which dendrites spread in one of four predominant directions. The locations of inputs from Mi9 (red) are spatially segregated from those of Mi4/C3/CT1 (yellow/orange/green). Mi1’s inputs (purple) spread between these locations. These data are used to compute the anatomical subfield centres in (B). (D) Distributions of synaptic inputs from Tm3 and TmY15. Synapses are rather uniformly distributed over the T4 dendrites. (E) Distributions of synaptic inputs from T4s in the surrounding columns. The T4 subtypes in the Home column (black) each receive input from other T4s (colours) that have the same dendritic branch orientation (i.e. the same preferred direction). Red puncta indicate the synaptic contacts from the neighbouring T4s onto the T4s. Scale bar, 10 µm (C–E).
Figure 4—figure supplement 1
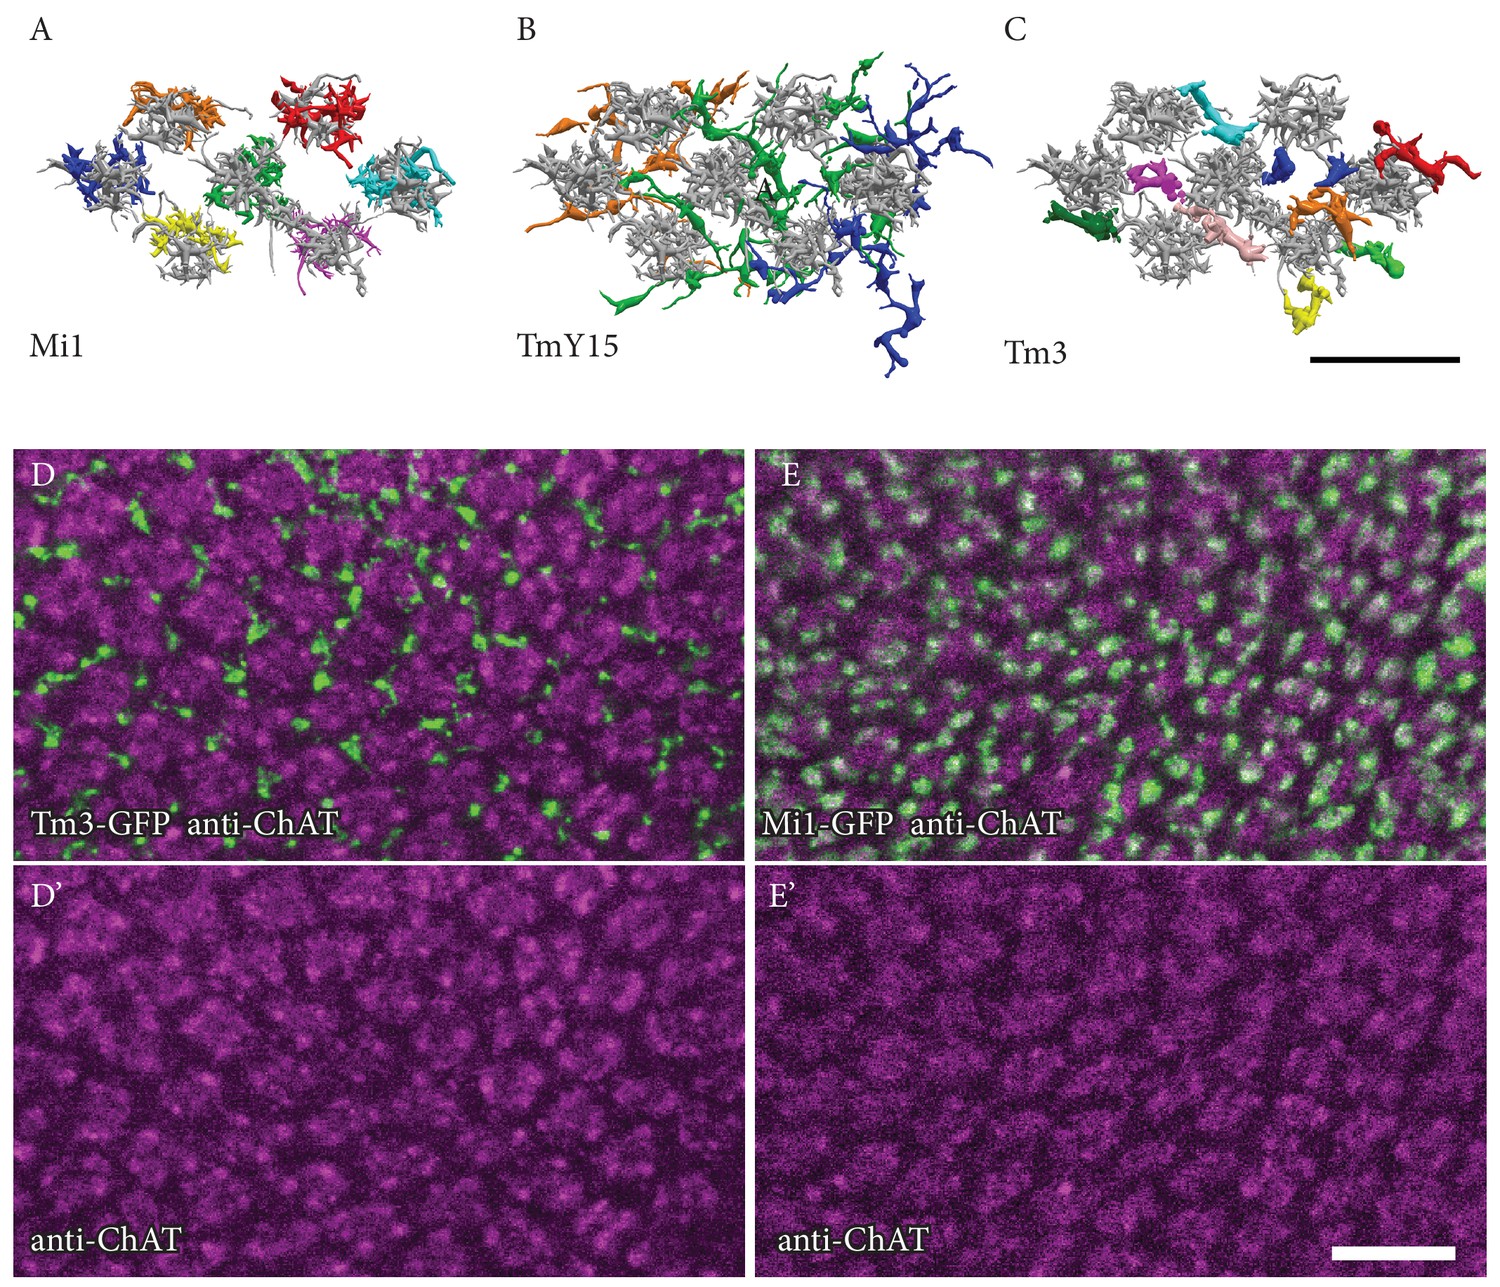
Positions of Mi1, TmY15 and Tm3 arbours relative to medulla columns in stratum M10.
(A, B, C) EM reconstructions of the M10 arbours of Mi1 (A), Tm3 (B) and TmY15 (C) cells presynaptic to the home column T4 cells. Each input cell type is shown in a different colour. Shown in gray, Mi4 and Mi9 (A) or Mi4, Mi9 and Mi1 (B, C) provide column markers. (A) Mi1 cells, as well as Mi4, Mi9 and C3 neurons and individual terminals of CT1 cells [see Figure 2D and E] are unicolumnar, and can be unambiguously assigned to specific medulla columns based on the relative positions of their arbours in M10 and/or other medulla layers. (B) Individual TmY15 cells provide input to T4 cells in several medulla columns and, unlike CT1, their branches fail to show obvious columnar subdivisions. See also Figure 2—figure supplement 1B. (C) The positions of individual Tm3 processes in M10 show no precise correspondence to individual medulla columns, as defined by the arbours of Mi1, Mi4 and Mi9. (D, D’, E, E’) Confocal images of Tm3 (D, D’) and Mi1 (E, E’) arbours in ~50 medulla columns in ~M9/M10. Anti-ChAT immunolabeling is used as a column marker. Consistent with EM results, Tm3 processes are located in the spaces between the Mi1/anti-ChAT defined columns and are not clearly associated with specific columns. Scale bars, 10 µm.
Figure 4—figure supplement 2
Limitations of the reconstructed volume and analyses.
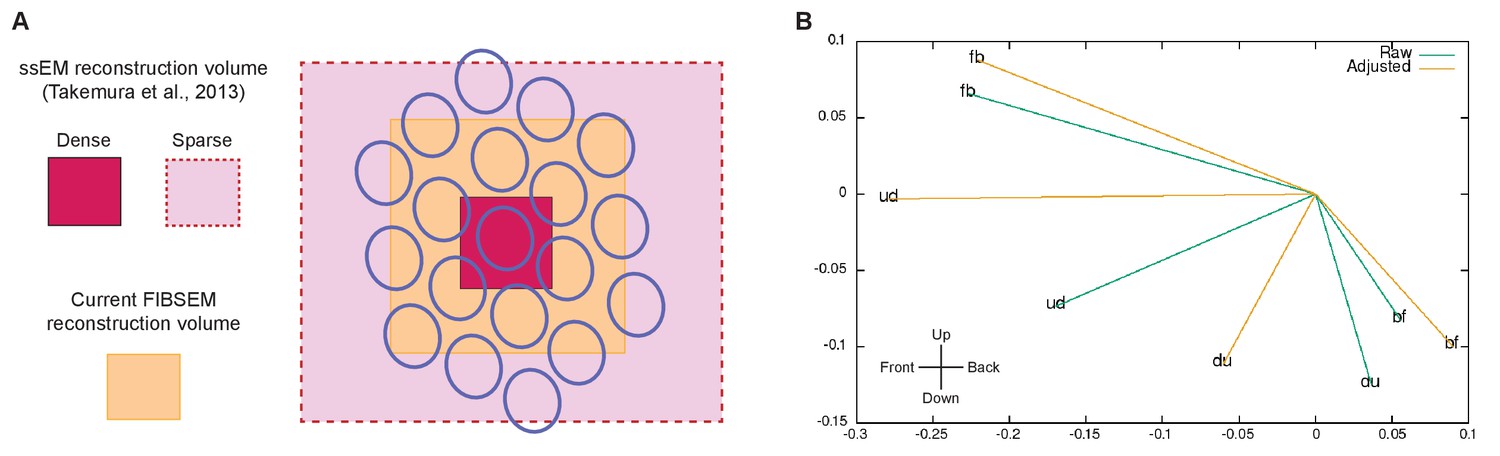
(A) Differences in the reconstructed volumes between the current FIBSEM dataset and our previous ssEM reconstruction (Takemura et al., 2013). With ssEM, we densely reconstructed a single medulla column, but applied additional tracing of L1 and Tm3 cells in 18 surrounding columns. This was possible because we collected the original TEM images from thin sections that covered a much larger area than the cropped image series used to reconstruct the single column. The FIBSEM dataset used in the current study is superior to ssEM in the comprehensiveness of the dense reconstruction it supports, but was limited to seven medulla columns (Home and its six neighbors) contained wholly within the imaged volume. We thus lacked complete access to any columns beyond this FIB-imaged volume. (B) Calculation of the Tm3 to Mi1-offset, computed from the current FIBSEM data according the method used in Takemura et al., 2013. For each Mi1 and Tm3, we found a field centre of L1 connections, assumed to originate from within a regular hexagonal grid, weighted by their respective synapse counts as reported in Takemura et al., 2013. Then, for each T4, the Mi1 and Tm3 field centres were calculated, also weighted by their respective synapse counts. The Tm3 to Mi1 offset is plotted in x,y dimensions, with Mi1 at 0, 0, where 1.0 represents the distance between two adjacent ommatidia. A significant limitation is that most Tm3 cells extend beyond the FIB-imaged volume and hence are not fully reconstructed. The eight Tm3s that feed the 'fb' T4, for example, have an estimated completeness of 100, 100, 94, 85, 72, 61, 49, and 42%. Given this incompleteness we compute 'raw' displacements (from the partial cells) and 'adjusted' displacements, using estimates of completeness supplemented by the locations for input connections. While the direction and magnitude of these offsets are roughly within the previously reported range (Takemura et al., 2013), no consistent alignment with a T4’s directional sensitivity is observed. However, the errors are large, as shown by the difference between 'raw' and 'adjusted' values, and given only one fully reconstructed T4 for each direction no statistics are possible. Thus, we can neither confirm nor refute the previously reported displacements between Mi1 and Tm3 field centres.
Figure 4—figure supplement 3
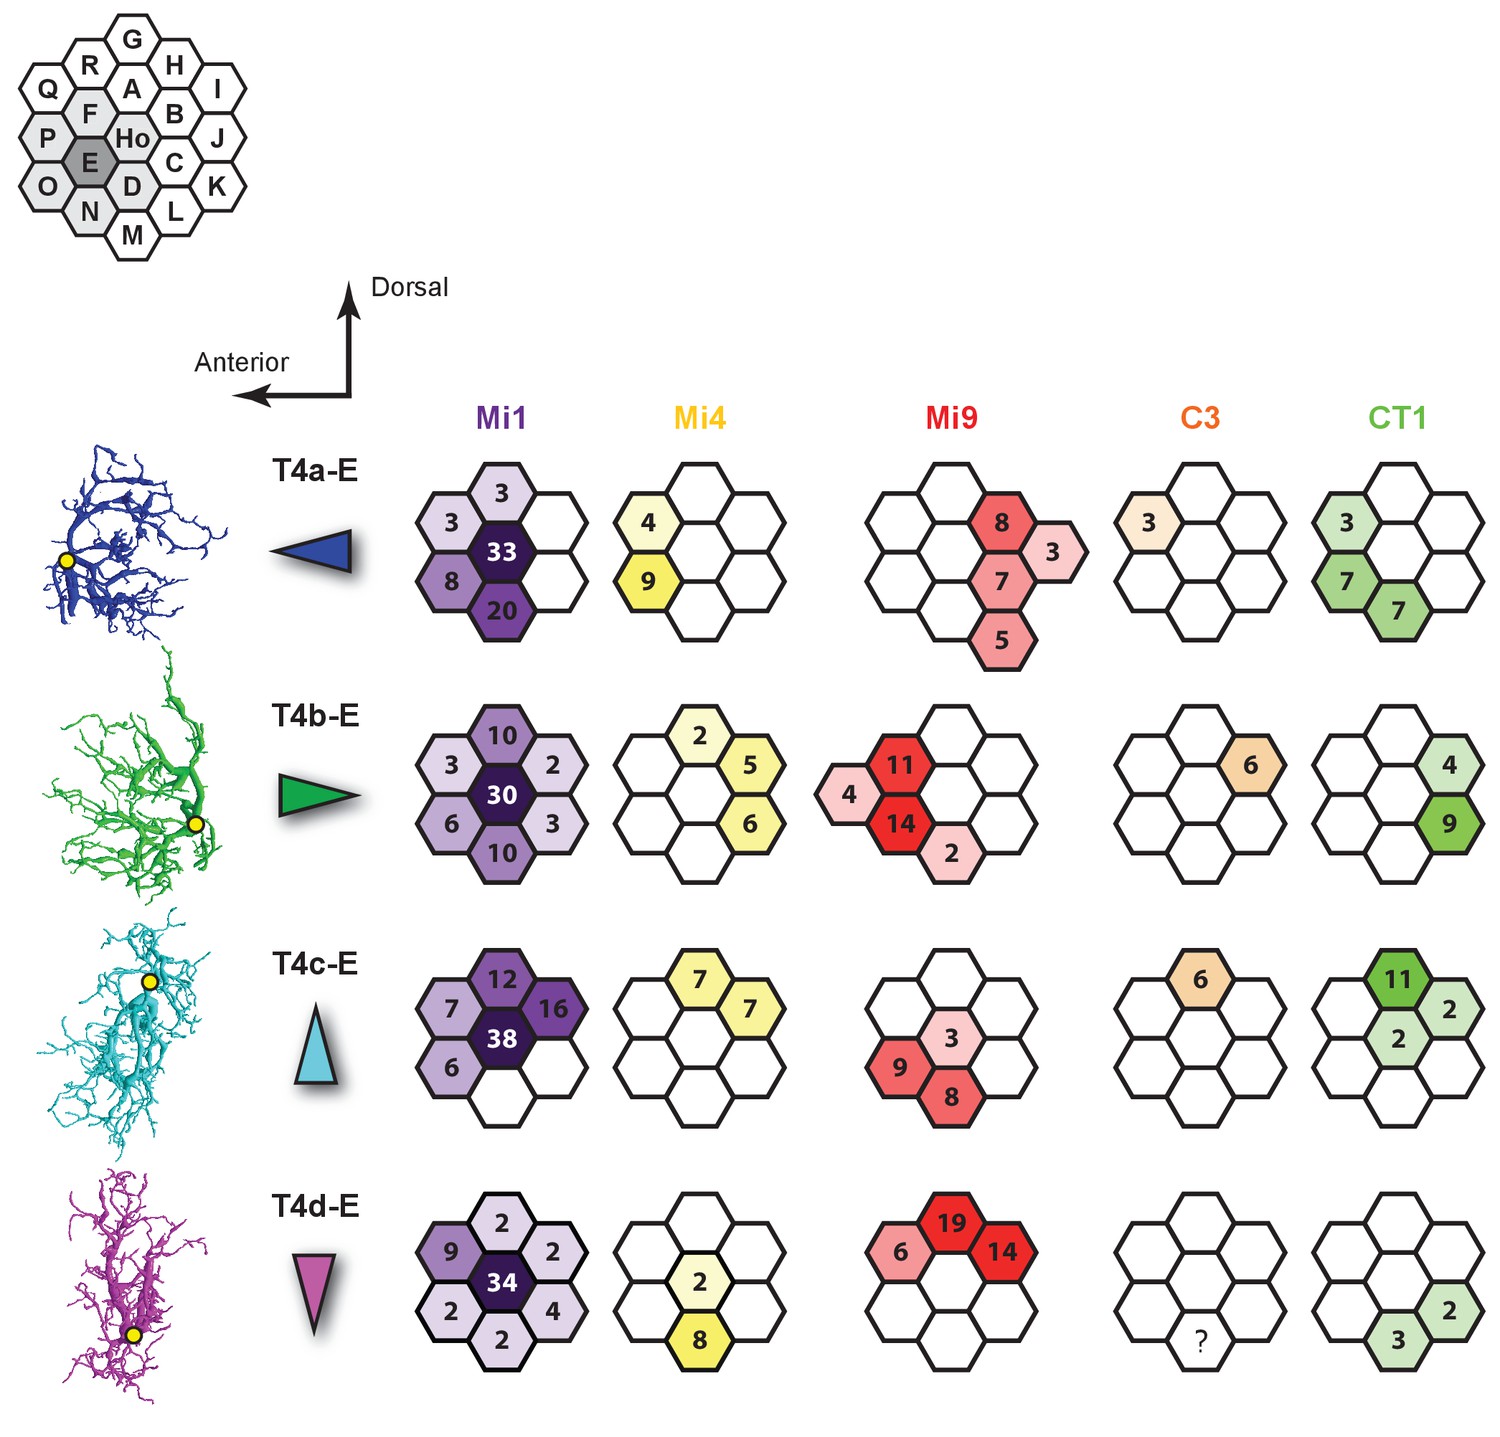
Synaptic inputs to T4 cells in Column E.
Left: Four subtypes of T4 cells each with dendrites orientated primarily in a single direction. Yellow dots indicate the location of each axon’s main trunk. Synaptic inputs of C3 to T4d-E are not available because the C3 cell in Column N could not be reconstructed successfully given the finite size of the reconstructed volume.
Figure 5
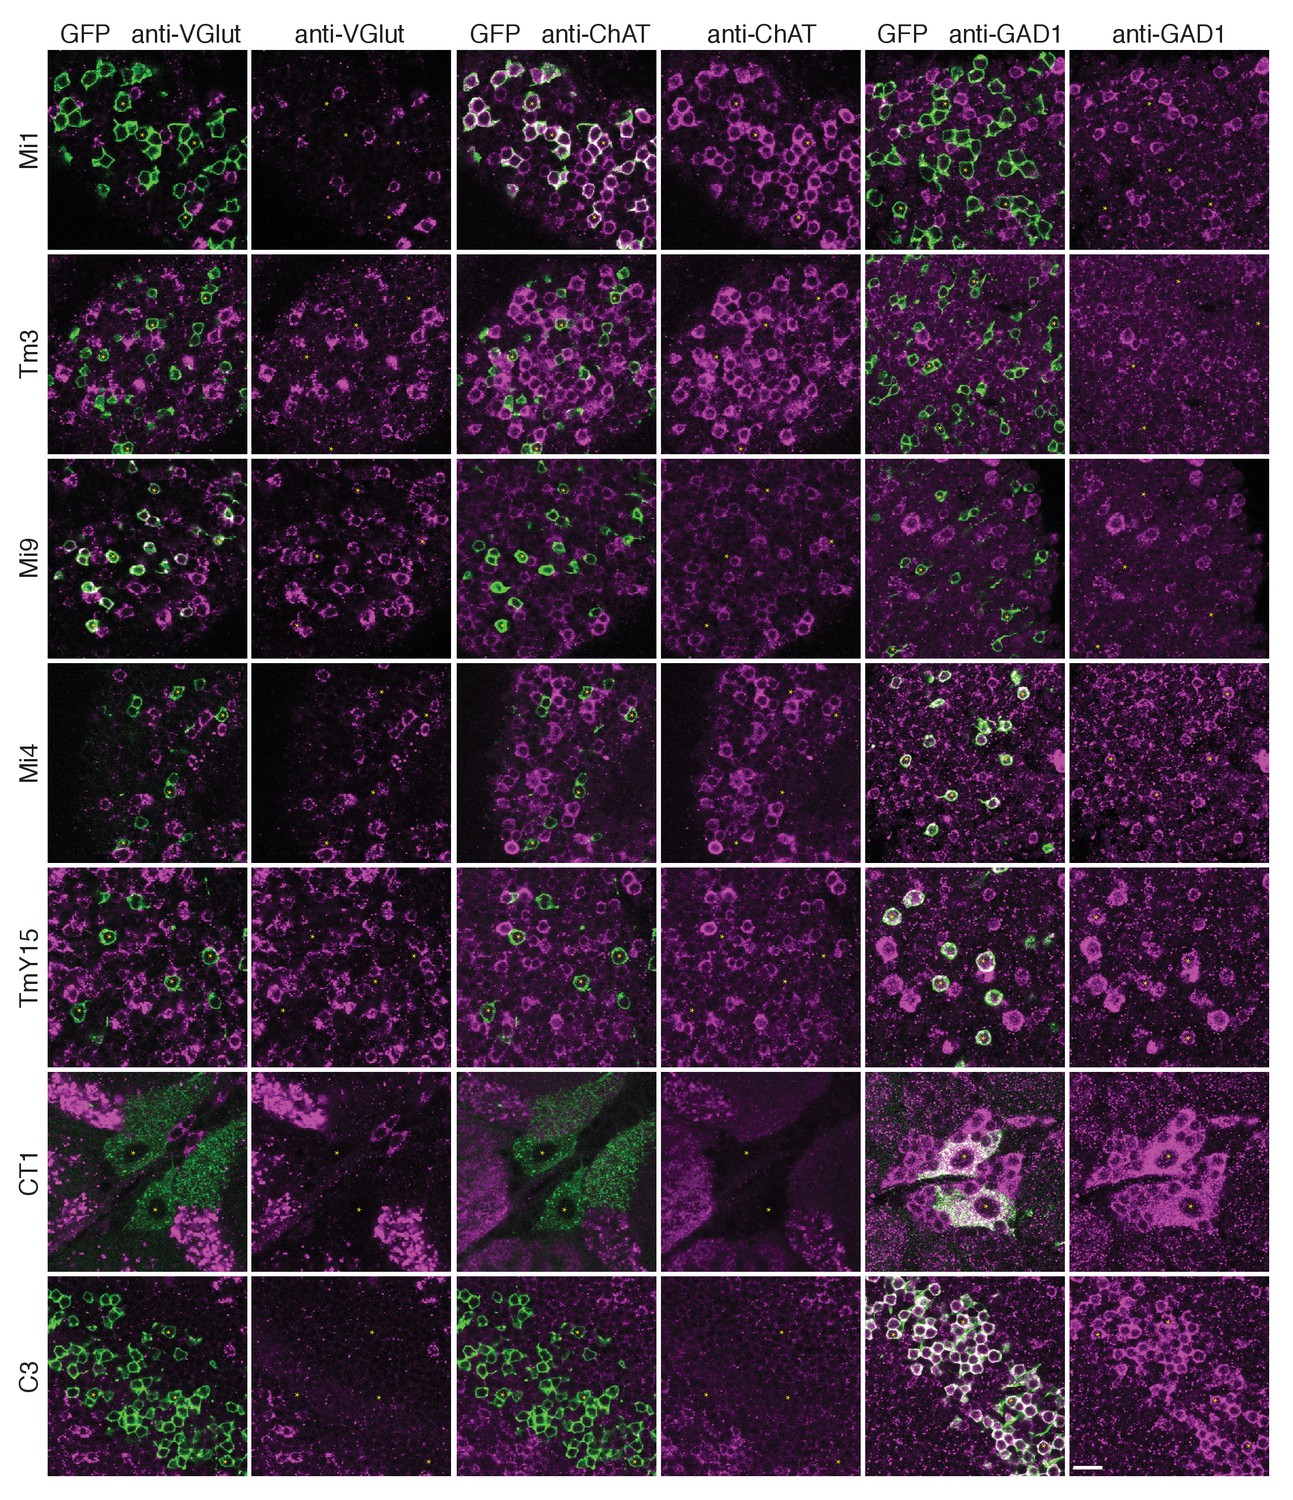
Anti-VGlut, anti-ChAT and anti-GAD1 immunoreactivity of T4’s input neurons.
Confocal sections showing GFP-labeled cell bodies. Small yellow asterisks are intended to facilitate comparison between the single channel panels. At least four brains (CT1) or at least two optic lobes from two brains (all other cell types) were examined for each condition. The main observed variation within a genotype was that the VT048653 driver line used as marker for TmY15, also included a small number of GAD1 negative cells (~12%; 15/130 cells counted) and VGlut positive cells (not counted). Supporting other recent evidence (Pankova and Borst, 2017), ChAT-immunoreactivity of Tm3 cells was detectable, although, under the conditions used here much weaker than that of Mi1 neurons. The GFP labeled arbours located to the top and right of the CT1 cell bodies in the VGlut and ChAT panels belong top a different cell type. ChAT expression in M1 and Tm3, GAD1 in Mi4 and C3 and VGlut in Mi9 were also observed in a transcriptomics study (L. Henry, F. Davis and S. Eddy, personal communication). Scale bar represents 10 µm.
Figure 6

Pathways to T4 input channels.
(A) Matrix of connections between R8, L1, L3, L5, C3, Mi1, Mi4, Mi9, Tm3, TmY15, CT1, and T4. Pathways are colour-coded at intercepts by strength, to highlight those with <10 synapses (yellow), 10–20 synapses (orange) and with >20 synapses (red). Note that single Tm3, TmY15 and T4 cells receive inputs from multiple cells of the same type because of their multicolumnar branching arbours. (B) T4 motion detection input circuits. T4a and T4b are shown, with opposite direction preferences. Each T4 extends its dendritic arbour across roughly three columns (dotted lines at column boundaries). Synaptic inputs from Mi1 and Tm3 spread along the shaft of T4 dendrites, whereas those from C3, CT1 and Mi4 are localized to T4’s dendrite bases. Mi9 is located at the dendrite tips. Putative neurotransmitter phenotypes (see text and Figure 5) suggest that excitatory (+) and inhibitory (-) inputs onto T4’s dendrites are segregated. These synaptic arrangements correspond not only to those predicted for a Hassenstein-Reichardt detector, as previously recognized, but also a Barlow-Levick-type detector (see text for details). Note that Mi1 provides inputs to all the presynaptic cells as well as directly to T4 cells (black arrows, see also matrix in (A)). Mi9’s synaptic polarity (+ or -) is tentative (half-filled circles).
Download links
A two-part list of links to download the article, or parts of the article, in various formats.
Downloads (link to download the article as PDF)
Open citations (links to open the citations from this article in various online reference manager services)
Cite this article (links to download the citations from this article in formats compatible with various reference manager tools)
The comprehensive connectome of a neural substrate for ‘ON’ motion detection in Drosophila
eLife 6:e24394.
https://doi.org/10.7554/eLife.24394


