Cyclophilin A-regulated ubiquitination is critical for RIG-I-mediated antiviral immune responses
- Institute of Microbiology, Chinese Academy of Sciences, China
- University of Chinese Academy of Sciences, China
- Shandong Agricultural University, China
- Chinese Academy of Sciences, China
- Ministry of Health, Institute of Laboratory Animal Science, Chinese Academy of Medical Sciences and Comparative Medical Center, Peking Union Medical College, China
- University of Chicago, United States
- School of Life Sciences, Peking University, China
Figures
Figure 1 with 4 supplements
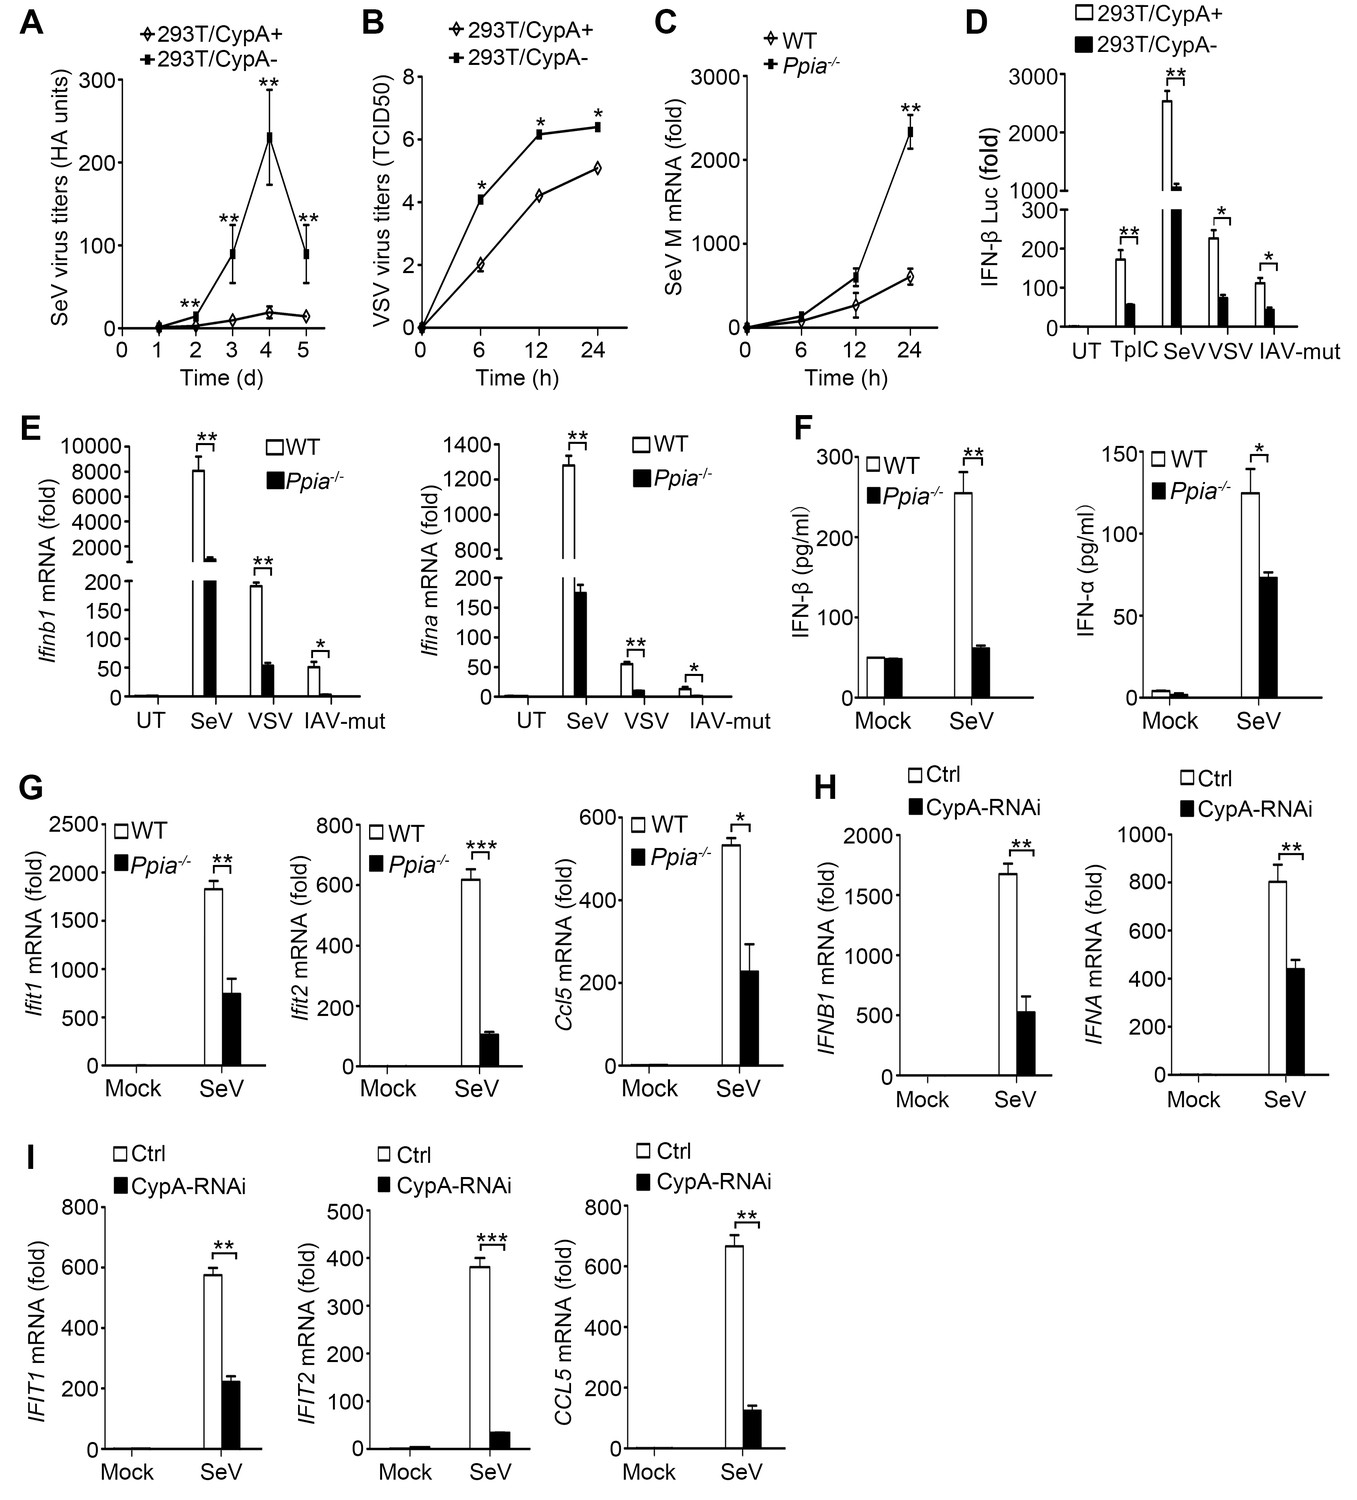
CypA promotes production of type I IFNs against virus infection.
(A) HA assays of SeV in 293T/CypA+ or 293T/CypA- cells infected with SeV (MOI = 1) for the indicated time periods. (B) TCID50 assays of proliferation level of VSV in 293T/CypA+ or 293T/CypA- cells infected with VSV (MOI = 1) for the indicated time periods. (C) Quantitative PCR analysis of SeV M mRNA in wild-type (WT) or CypA-deficient (Ppia−/−) BMDMs infected with SeV for the indicated time periods. (D) Luciferase activity of lysates in 293T/CypA+ or 293T/CypA- cells transfected for 24 hr with IFN-β luciferase reporter (IFN-β-Luc), together with Poly (I:C) (TpIC) or then treated with SeV, VSV, IAV-mut for 6 hr. (E) Quantitative PCR analysis of Ifnb1 and Ifna mRNA in WT or Ppia−/− BMDMs infected with SeV, VSV or IAV-mut for 6 hr. (F) ELISA of IFN-β and IFN-α production in the supernatants of WT or Ppia−/− BMDMs treated with SeV for 12 hr. (G) Quantitative PCR analysis of Ifit1, Ifit2, and Ccl5 mRNA in WT or Ppia−/− BMDMs treated with SeV for 6 hr. (H and I) Quantitative PCR analysis of IFNB1, IFNA (H) IFIT1, IFIT2, or CCL5 (I) mRNA in human monocytes transfected with CypA siRNA or scrambled siRNA for 48 hr and then treated with SeV for 6 hr. Data are shown as mean ± SD (A: n = 5; B-I: n = 3). *p<0.05, **p<0.01, ***p<0.001 (unpaired, two-tailed Student’s t-test). Data are from one representative of at least three independent experiments.
-
Figure 1—source data 1
Quantification of viral replication and type I IFN production for Figure 1.
- https://doi.org/10.7554/eLife.24425.004
Figure 1—figure supplement 1
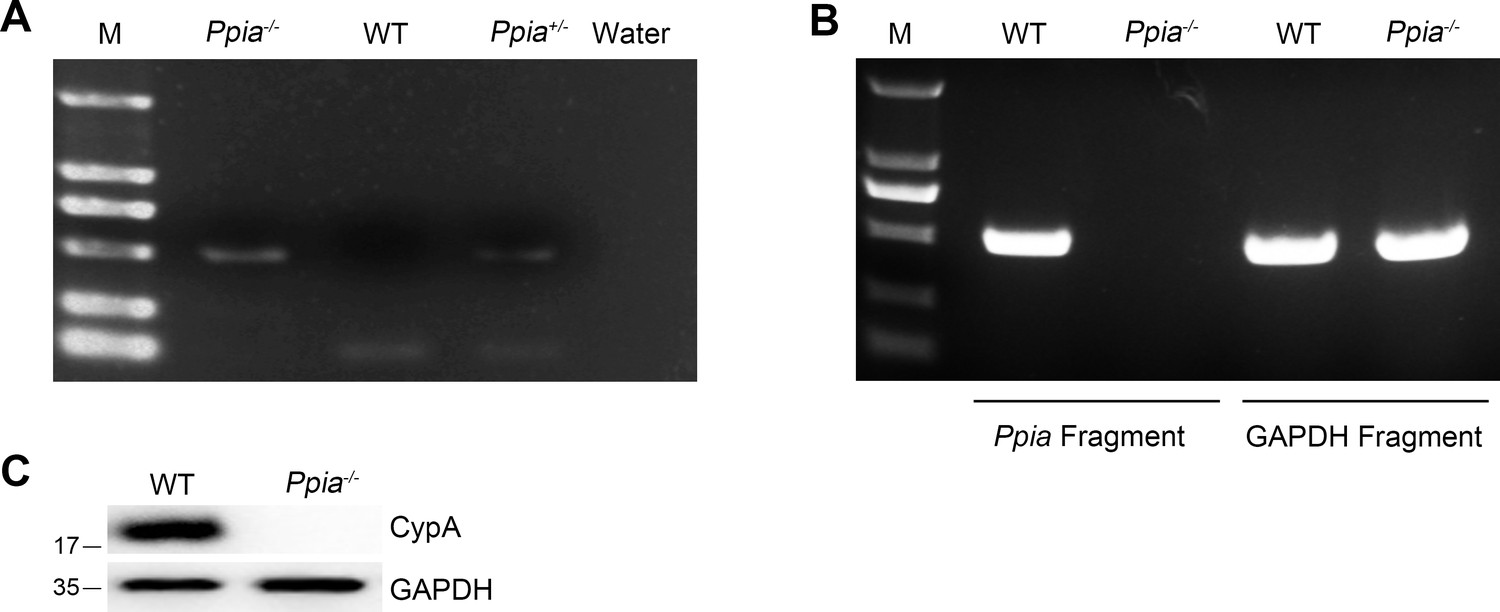
Identification of Ppia-deficient mice.
(A) PCR analysis of genomic DNA from tail tissue of Ppia-deficient mice. Water was used as a negative control for the PCR reaction. (B) Semi-quantitative analysis of Ppia mRNA in BMDMs from WT and Ppia−/− mice. Primers were designed to amplify Ppia or the housekeeping gene GAPDH (PCR primers: Ppia forward, 5′- ATGGTCAACCCCACCGTGTTC-3′; Ppia reverse, 5′- TTAGAGCTGTCCACAGTCGG-3′; GAPDH forward, 5’-ACCACAGTCCATGCCATCAC-3’; and GAPDH reverse, 5’- TCCACCACCCTGTTGCTGTA -3’). (C) Immunoblot analysis of lysates in WT and Ppia−/− BMDMs.
Figure 1—figure supplement 2
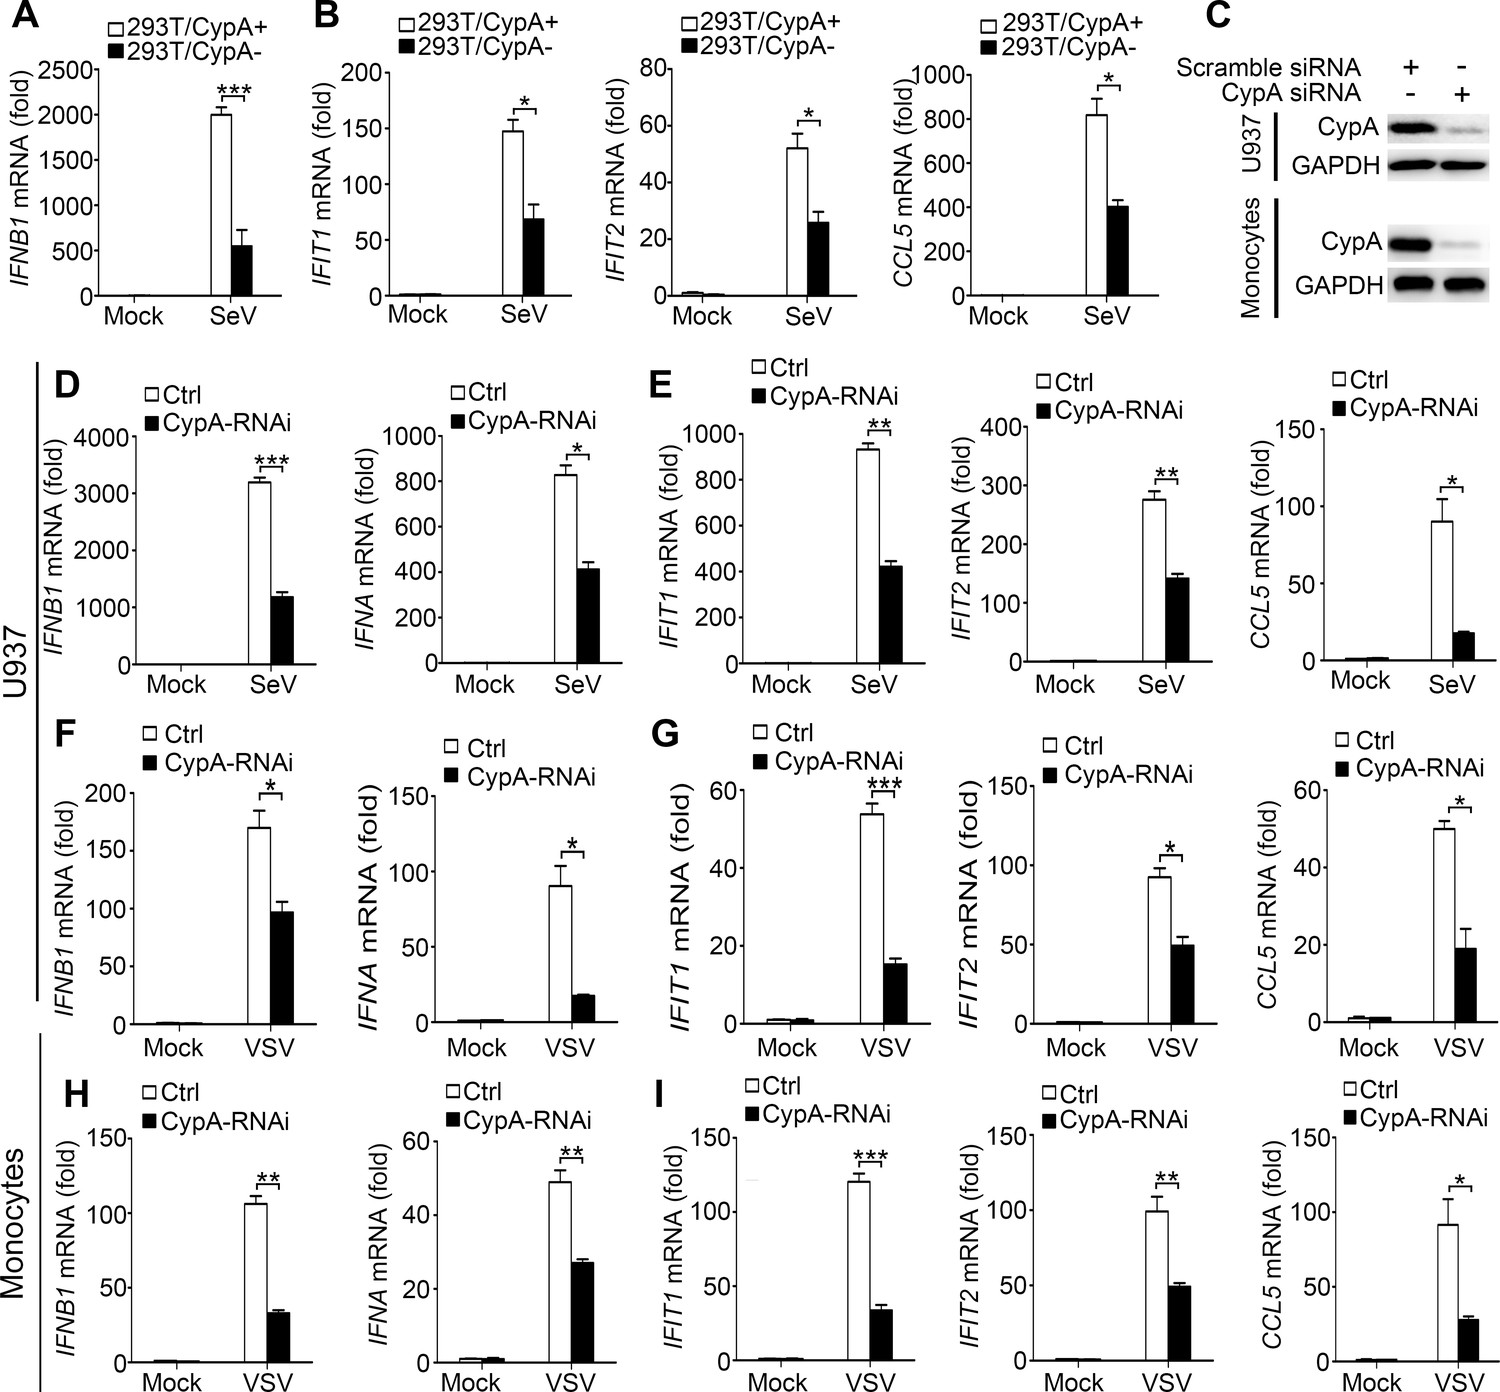
CypA promotes production of type I IFNs against virus infection in 293T, U937 cells and human monocytes.
(A and B) Quantitative PCR analysis of IFNB1 (A), IFIT1, IFIT2, or CCL5 (B) mRNA in 293T/CypA+ and 293T/CypA- cells infected with SeV (MOI = 1) for 6 hr. (C) Immunoblot analysis of lysates in U937 or human primary monocytes transfected with CypA siRNA or scrambled siRNA for 48 hr. (D–G) Quantitative PCR analysis of IFNB1, IFNA (D and F) IFIT1, IFIT2, or CCL5 (E and G) mRNA in U937 cells transfected with CypA siRNA or scrambled siRNA for 48 hr and then treated with SeV (D and E) or VSV (F and G) for 6 hr. (H and I) Quantitative PCR analysis of IFNB1, IFNA (H) IFIT1, IFIT2, or CCL5 (I) mRNA in human monocyte cells transfected with CypA siRNA or scrambled siRNA for 48 hr and then treated with VSV for 6 hr. Data are shown as mean ± SD (n = 3). *p<0.05 and **p<0.01 (unpaired, two-tailed Student’s t-test). Data are representative of at least three independent experiments.
Figure 1—figure supplement 3
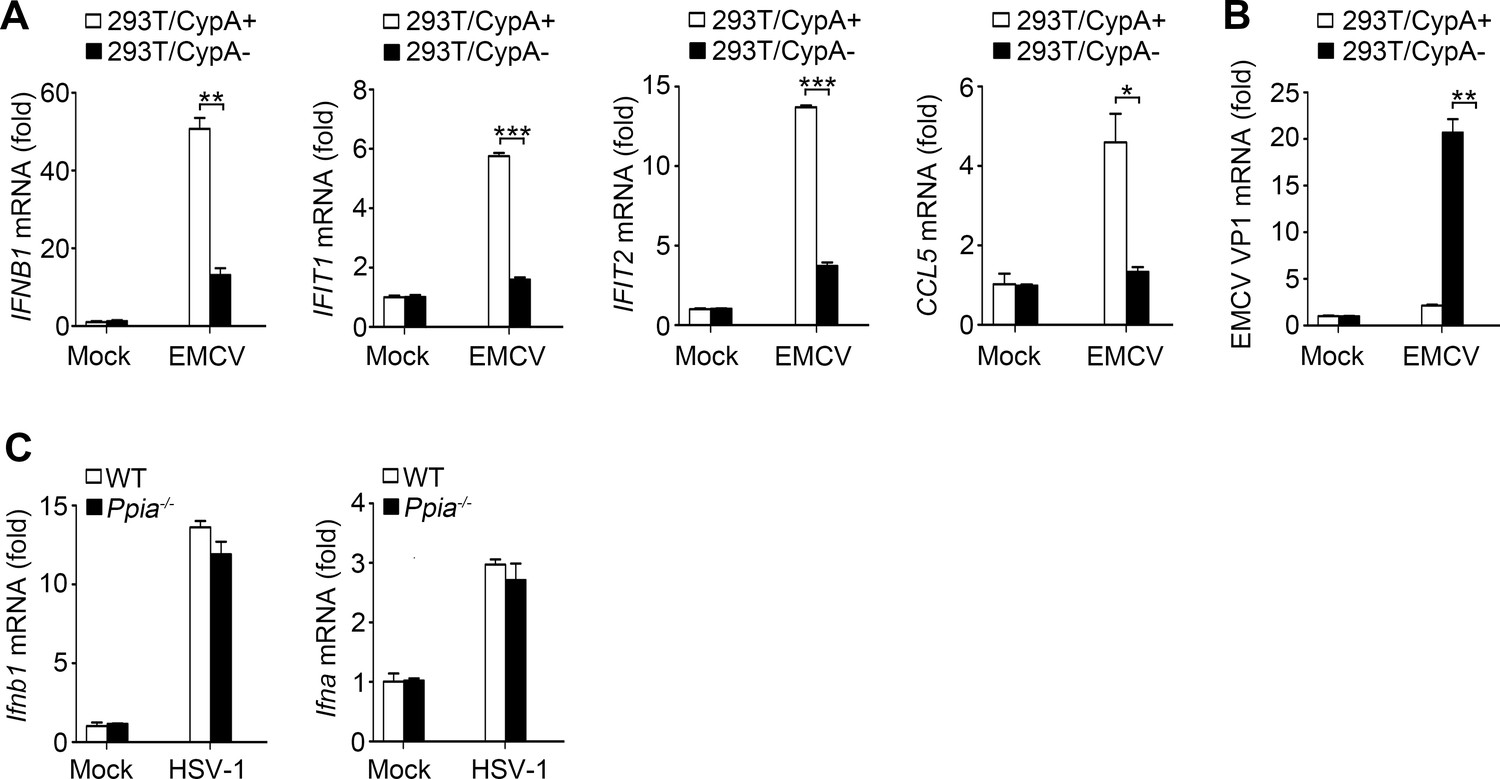
Effect of CypA on RIG-I-independent signaling.
(A and B) Quantitative PCR analysis of IFNB1, IFIT1, IFIT2, CCL5 (A), or EMCV VP1 mRNA (B) in 293T/CypA+ and 293T/CypA- cells infected with EMCV (MOI = 0.5) for 6 hr. (C) Quantitative PCR analysis of Ifnb1 and Ifna mRNA in WT or Ppia−/− BMDMs cells infected with HSV-1 (MOI = 10) for 6 hr.
Figure 1—figure supplement 4
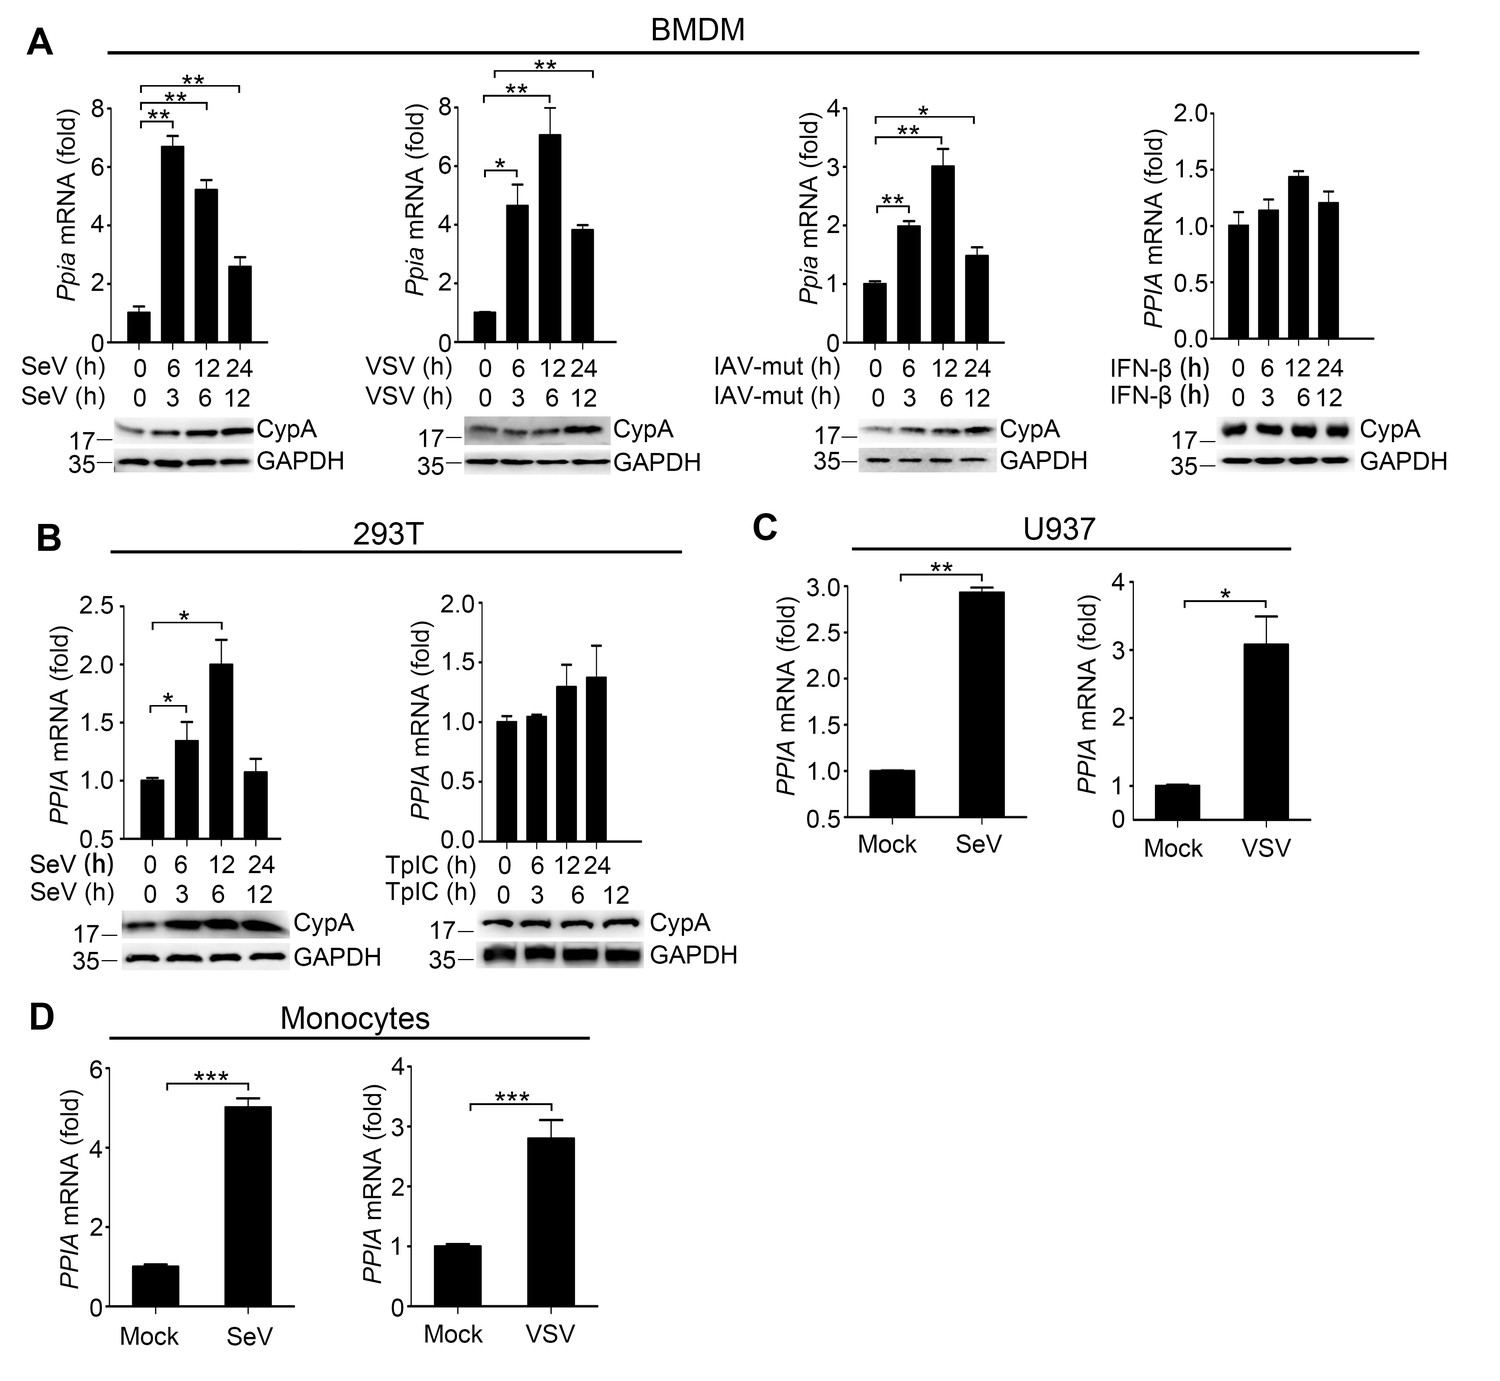
CypA is inducible against virus infection.
(A) Quantitative PCR analysis of Ppia mRNA (top) and immunoblot analysis of CypA (below) in WT BMDMs treated with SeV, VSV, IAV-mut or IFN-β for the indicated time points. (B) Quantitative PCR analysis of PPIA mRNA (top) and immunoblot analysis of CypA (below) in 293T/CypA+ cells treated with SeV or transfected with Poly (I:C) for the indicated time points. (C and D) Quantitative PCR analysis of PPIA in U937 cells (C) or human monocytes (D) treated with SeV or VSV for 12 hr. Data are shown as mean ± SD (n = 3). *p<0.05 and **p<0.01 (unpaired, two-tailed Student’s t-test). Data are representative of at least three independent experiments.
Figure 2 with 1 supplement
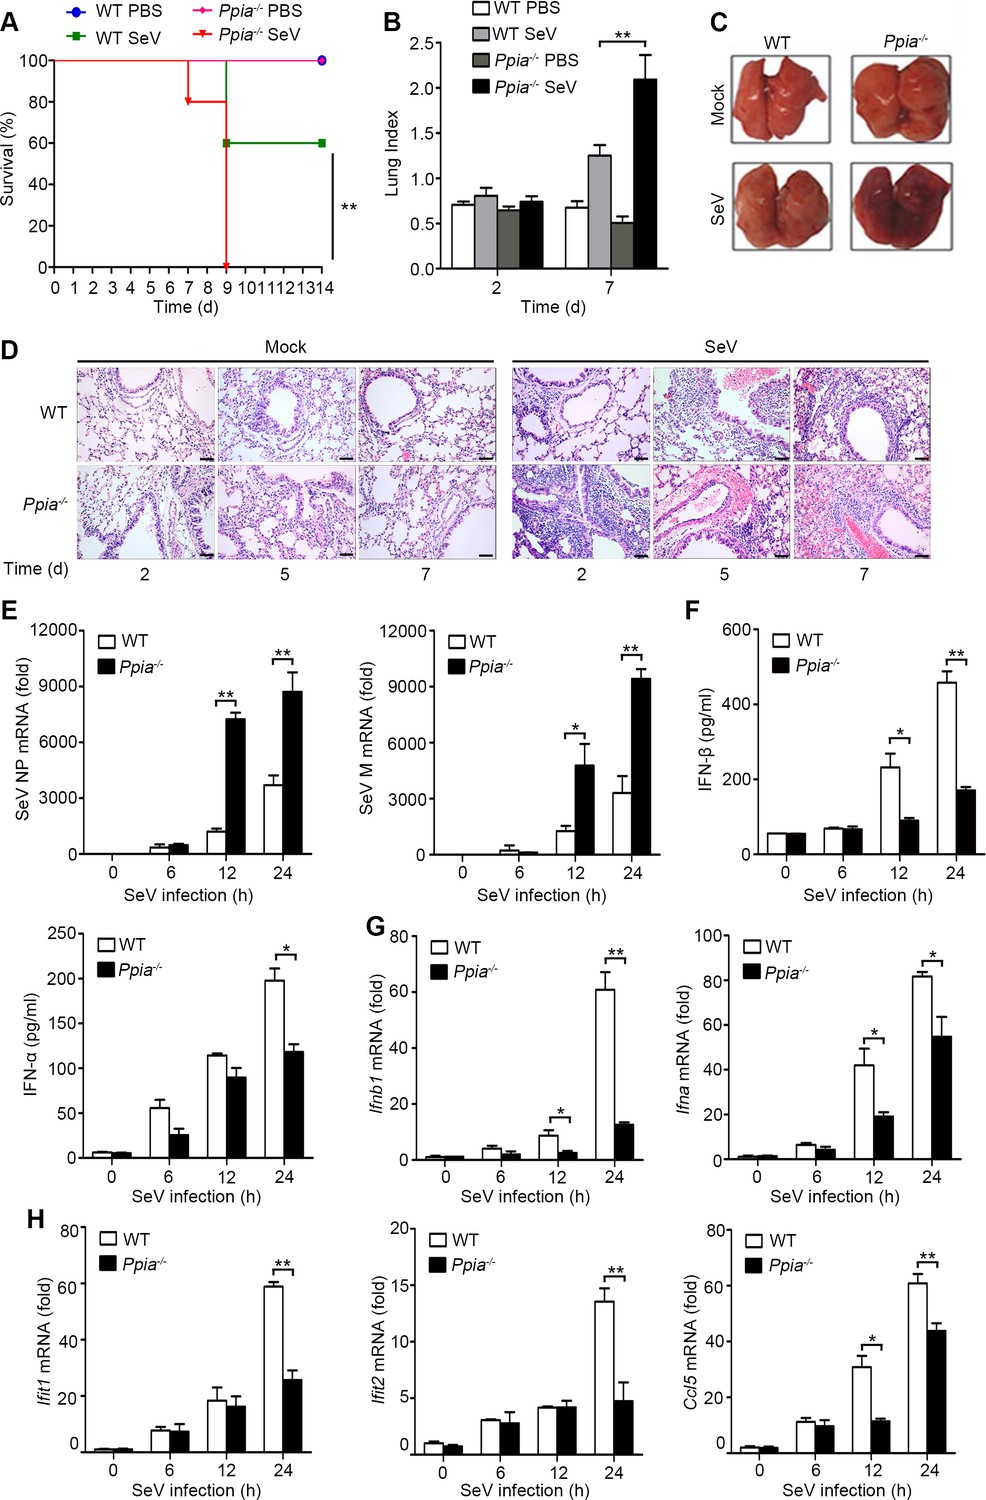
CypA positively regulates type I IFN production and antiviral responses in vivo.
(A) Survival of WT and Ppia−/− mice (n = 5) infected with SeV (2000 PFU/mouse) via nasal inoculation and monitored for 14 days. (B) Lung index (100× lung/body weight) of WT and Ppia−/− mice (n = 5) infected with SeV for 2 and 7 days. (C) Gross lesion of lungs from WT and Ppia−/− mice inoculated with SeV for 7 days. (D) H & E stainings of lungs of WT and Ppia−/− mice (n = 3) infected with SeV or mock-infected with PBS for 2, 5, and 7 days. Scale bars, 100 μm. (E) Quantitative PCR analysis of SeV NP or M mRNA in WT or Ppia−/− mice treated with SeV for the indicated time points. (F) ELISA of IFN-β and IFN-α production in lung tissues of WT or Ppia−/− mice treated with SeV for the indicated time points. (G and H) Quantitative PCR analysis of Ifnb1, Ifna (G), Ifit1, Ifit2, and Ccl5 (H) mRNA in lung tissues of WT or Ppia−/− mice treated with SeV for the indicated time points. Data are shown as mean ± SD (B: n = 5; E-H: n = 3). *p<0.05 and **p<0.01 (unpaired, two-tailed Student’s t-test). Data are representative of two independent experiments.
-
Figure 2—source data 1
Quantification of survival, lung index, viral replication and type I IFN production for Figure 2.
- https://doi.org/10.7554/eLife.24425.010
Figure 2—figure supplement 1

CypA positively regulates type I IFN production and the antiviral responses in vivo.
(A and B) H&E stainings of nasal turbinate (A) and trachea (B) tissues of WT and Ppia−/− mice (n = 3) infected with SeV or mock-infected with PBS for 2, 5, and 7 days. Scale bars, 100 μm. (C) ELISA of IFN-β and IFN-α production in spleen tissues of WT or Ppia−/− mice treated with SeV for the indicated time points. (D) Quantitative PCR analysis of Ifnb1, Ifna, Ifit1, Ifit2, and Ccl5 mRNA in spleen tissues of WT or Ppia−/− mice treated with SeV for the indicated time points. Data are shown as mean ± SD (n = 3). *p<0.05 and **p<0.01 (unpaired, two-tailed Student’s t-test). Data are representative of two independent experiments.
Figure 3
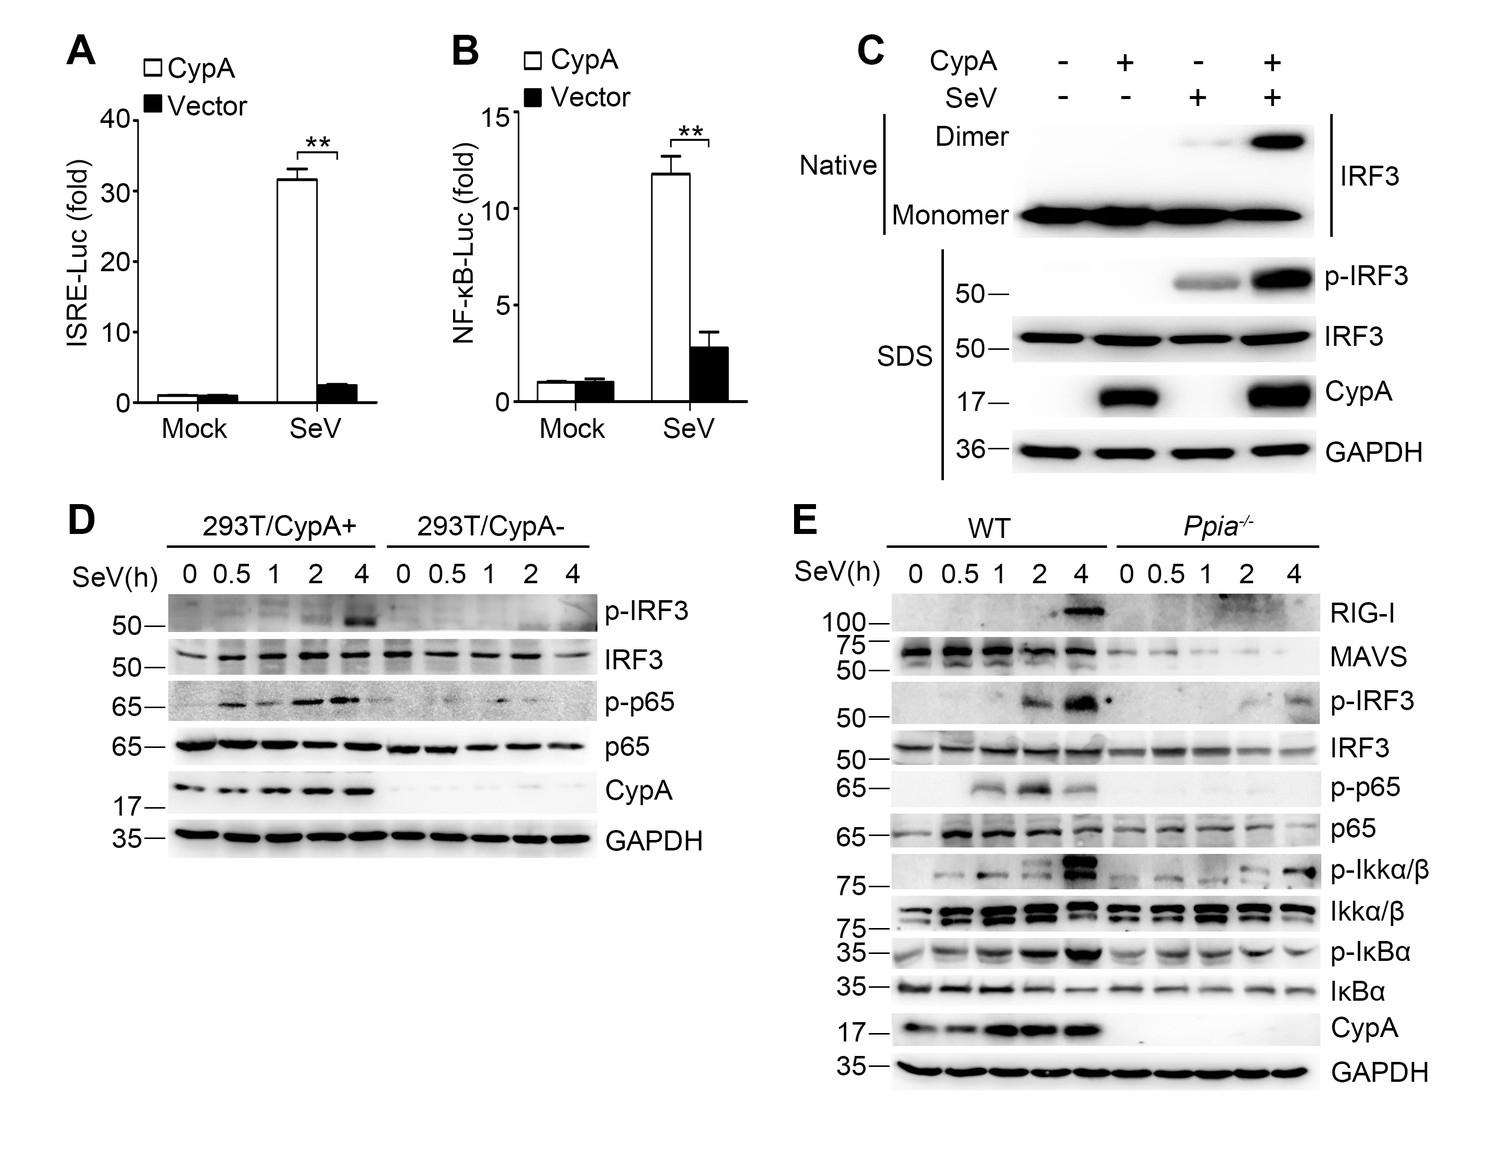
CypA deficiency suppresses IRF3 and NF-κB activation.
(A and B) Luciferase activity of lysates in 293T/CypA- cells transfected for 24 hr with CypA or control vector, together with either ISRE-Luc (A) or NF-κB-Luc (B) and then treated with SeV for 6 hr. Results are presented relative to the luciferase activity in control cells treated with luciferase reporter and empty vector. (C) Native PAGE and immunoblot analysis of IRF3 in dimer or monomer form and phosphorylated IRF3 in 293T/CypA+ and 293T/CypA- cells infected with SeV for 6 hr. (D) Immunoblot analysis of the indicated proteins in 293T/CypA+ and 293T/CypA- cells infected with SeV for the indicated time periods. (E) Immunoblot analysis of the indicated proteins in WT and Ppia−/− BMDMs from infected with SeV for the indicated time points. Data are shown as mean ± SD (n = 3). *p<0.05 and **p<0.01 (unpaired, two-tailed Student’s t-test). Data are representative of at least three independent experiments.
-
Figure 3—source data 1
Quantification of luciferase activity for Figure 3.
- https://doi.org/10.7554/eLife.24425.013
Figure 4

CypA interacts with RIG-I and MAVS to activate RIG-I signaling pathway.
(A–C) Luciferase activity of lysates in 293T/CypA- cells transfected for 24 hr with luciferase reporter constructs IFN-β-Luc (A), ISRE-Luc (B) or NF-κB-Luc (C), plus Flag-MAVS, Flag-RIG-I-N, Flag-MDA5-N, Flag-IRF3/5, or Myc-TBK1, along with Myc-CypA or an empty vector. Results are presented relative to the luciferase activity in control cells treated with luciferase reporter and empty vector. (D) Native PAGE and immunoblot analysis of IRF3 in dimer or monomer form and phosphorylated IRF3 in 293T/CypA- cells transfected for 24 hr with Flag-MAVS, Flag-RIG-I, Flag-MDA5, or Myc-TBK1, along with an empty vector or Myc-CypA. (E) Immunoblot analysis of lysates of 293T/CypA+ cells transfected for 24 hr with Flag-MAVS, Flag-RIG-I, Flag-MDA5, or Flag-IRF3, along with Myc-CypA, followed by immunoprecipitation with anti-Flag beads. (F and G) Immunoblot analysis of lysates in WT BMDMs infected with SeV for 6 hr, followed by immunoprecipitation with control mouse IgG or anti-CypA antibodies. Lysates and immunoprecipitation extracts were probed with CypA and RIG-I (F) or MAVS (G) antibodies. (H) Confocal microscopy of endogenous CypA and MAVS or RIG-I in 293T/CypA+ cells, treated with SeV for 6 hr. Scale bars, 10 μm. Data are shown as mean ± SD (n = 3). *p<0.05 and **p<0.01 (unpaired, two-tailed Student’s t-test). Data are representative of at least three independent experiments.
-
Figure 4—source data 1
Quantification of luciferase activity for Figure 4.
- https://doi.org/10.7554/eLife.24425.015
Figure 5
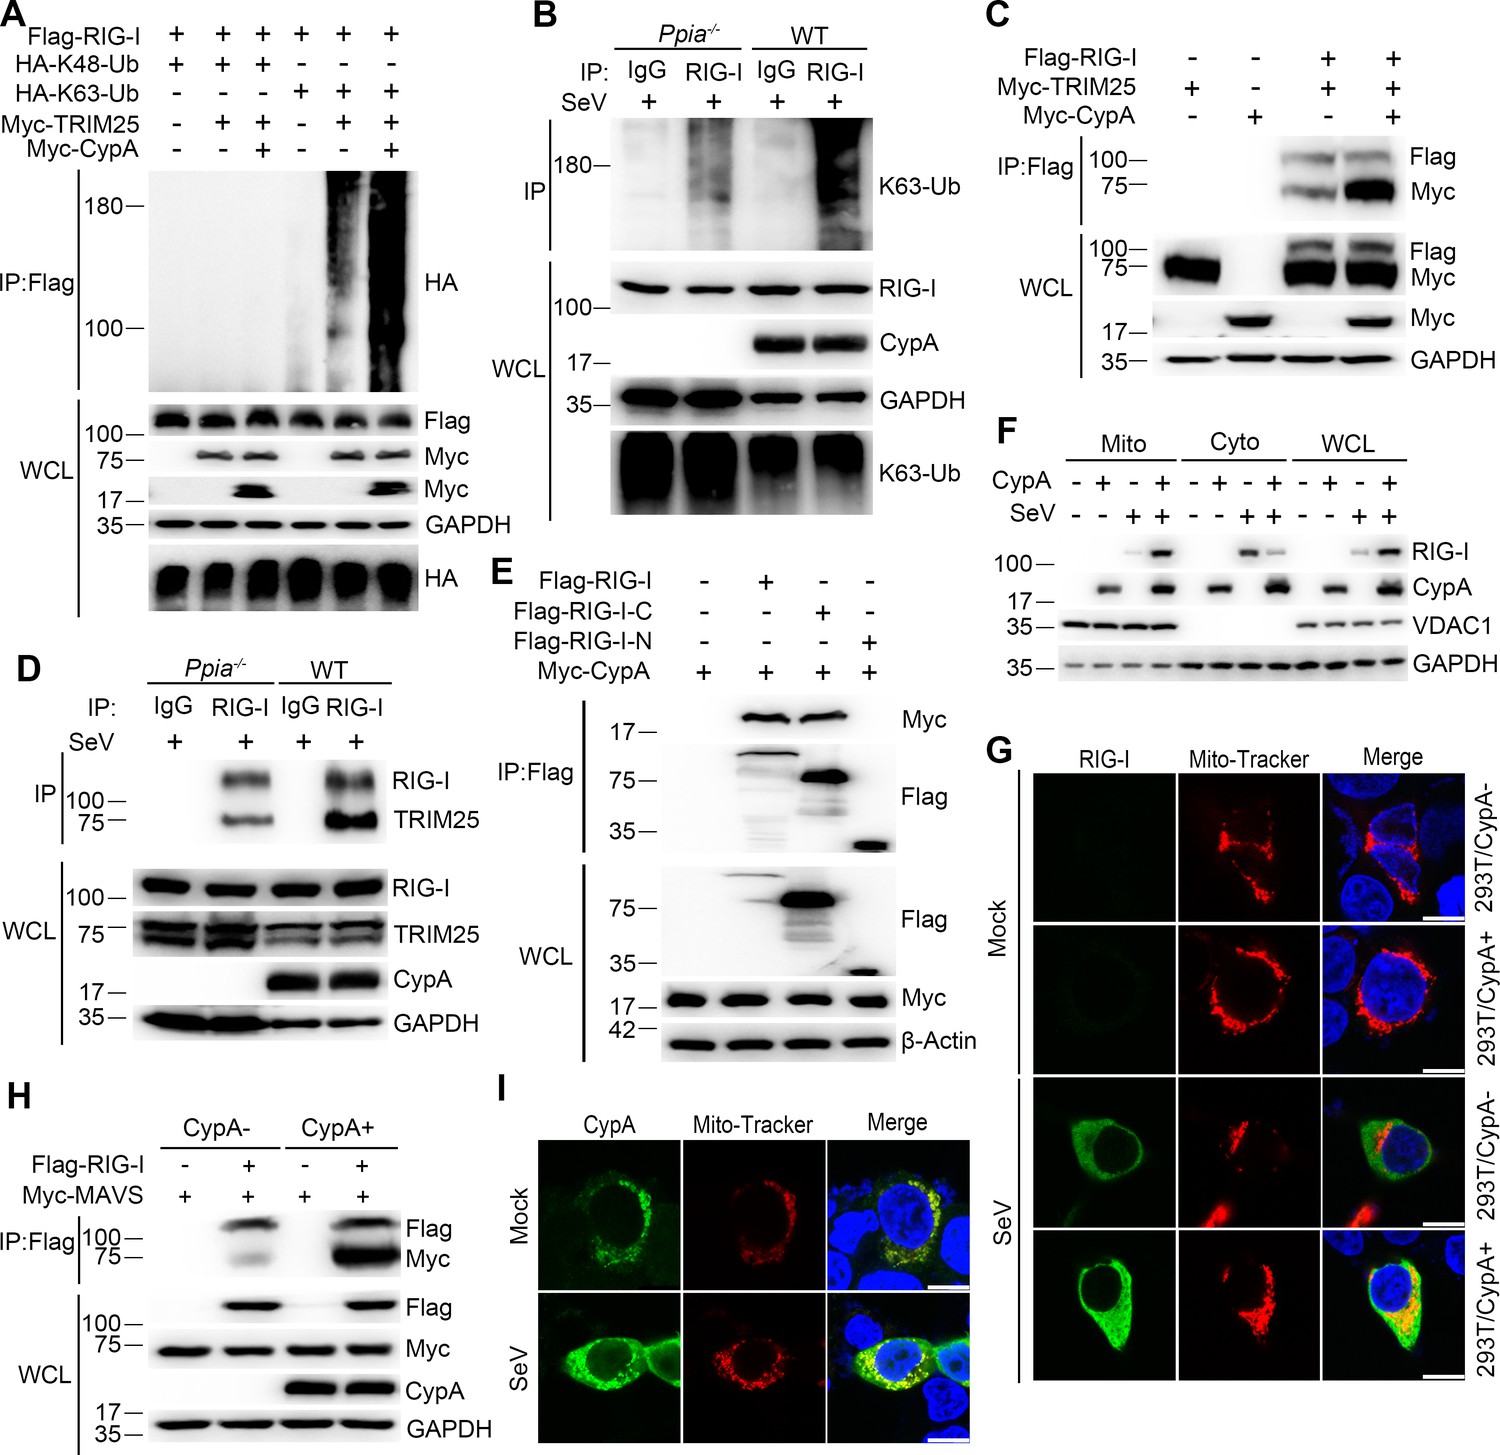
CypA enhances TRIM25-mediated K63-linked ubiquitination of RIG-I and facilitates recruitment of RIG-I to MAVS.
(A) Immunoblot analysis of lysates in 293T/CypA- cells transfected for 24 hr with Flag-RIG-I, along with HA-K63-Ub, HA-K48-Ub, Myc-TRIM25, or Myc-CypA, followed by immunoprecipitation with anti-Flag beads. (B) Immunoblot analysis of lysates in WT and Ppia−/− BMDMs infected with SeV for 6 hr, followed by immunoprecipitation with control mouse IgG or anti-RIG-I antibodies. Lysates and immunoprecipitation extracts were probed with K63-Ub, RIG-I and CypA antibodies. (C) Immunoblot analysis of lysates in 293T/CypA- cells transfected with Flag-RIG-I, Myc-TRIM25, or Myc-CypA for 24 hr, and immunoprecipitated with anti-Flag beads. (D) Immunoblot analysis of lysates in WT and Ppia−/− BMDMs infected with SeV for 6 hr, followed by immunoprecipitation with control mouse IgG or anti-RIG-I antibodies. Lysates and immunoprecipitation extracts were probed with RIG-I, TRIM25, CypA and antibodies. (E) Immunoblot analysis of lysates in 293T/CypA- cells transfected with Myc-CypA and Flag-RIG-I, Flag-RIG-I-C or Flag-RIG-I-N for 24 hr, and immunoprecipitated with anti-Flag beads. (F) Immunoblot analysis of lysates in WT and Ppia−/− BMDMs after SeV infection or mock-infection for 6 hr, followed by mitochondrial-cytoplasm extraction. (G) Confocal microscopy of endogenous RIG-I in 293T/CypA+ and 293T/CypA- cells stained with Mito-Tracker after SeV infection or mock infection for 6 hr. Scale bars, 10 μm. (H) Immunoblot analysis of lysates in 293T/CypA+ and 293T/CypA- cells transfected with Flag-RIG-I and Myc-MAVS for 24 hr, and immunoprecipitated with anti-Flag beads. (I) Confocal microscopy of endogenous CypA in 293T/CypA+ cells stained with Mito-Tracker after SeV infection or mock-infection for 6 hr. Scale bars, 10 μm. Data are representative of at least three independent experiments.
Figure 6
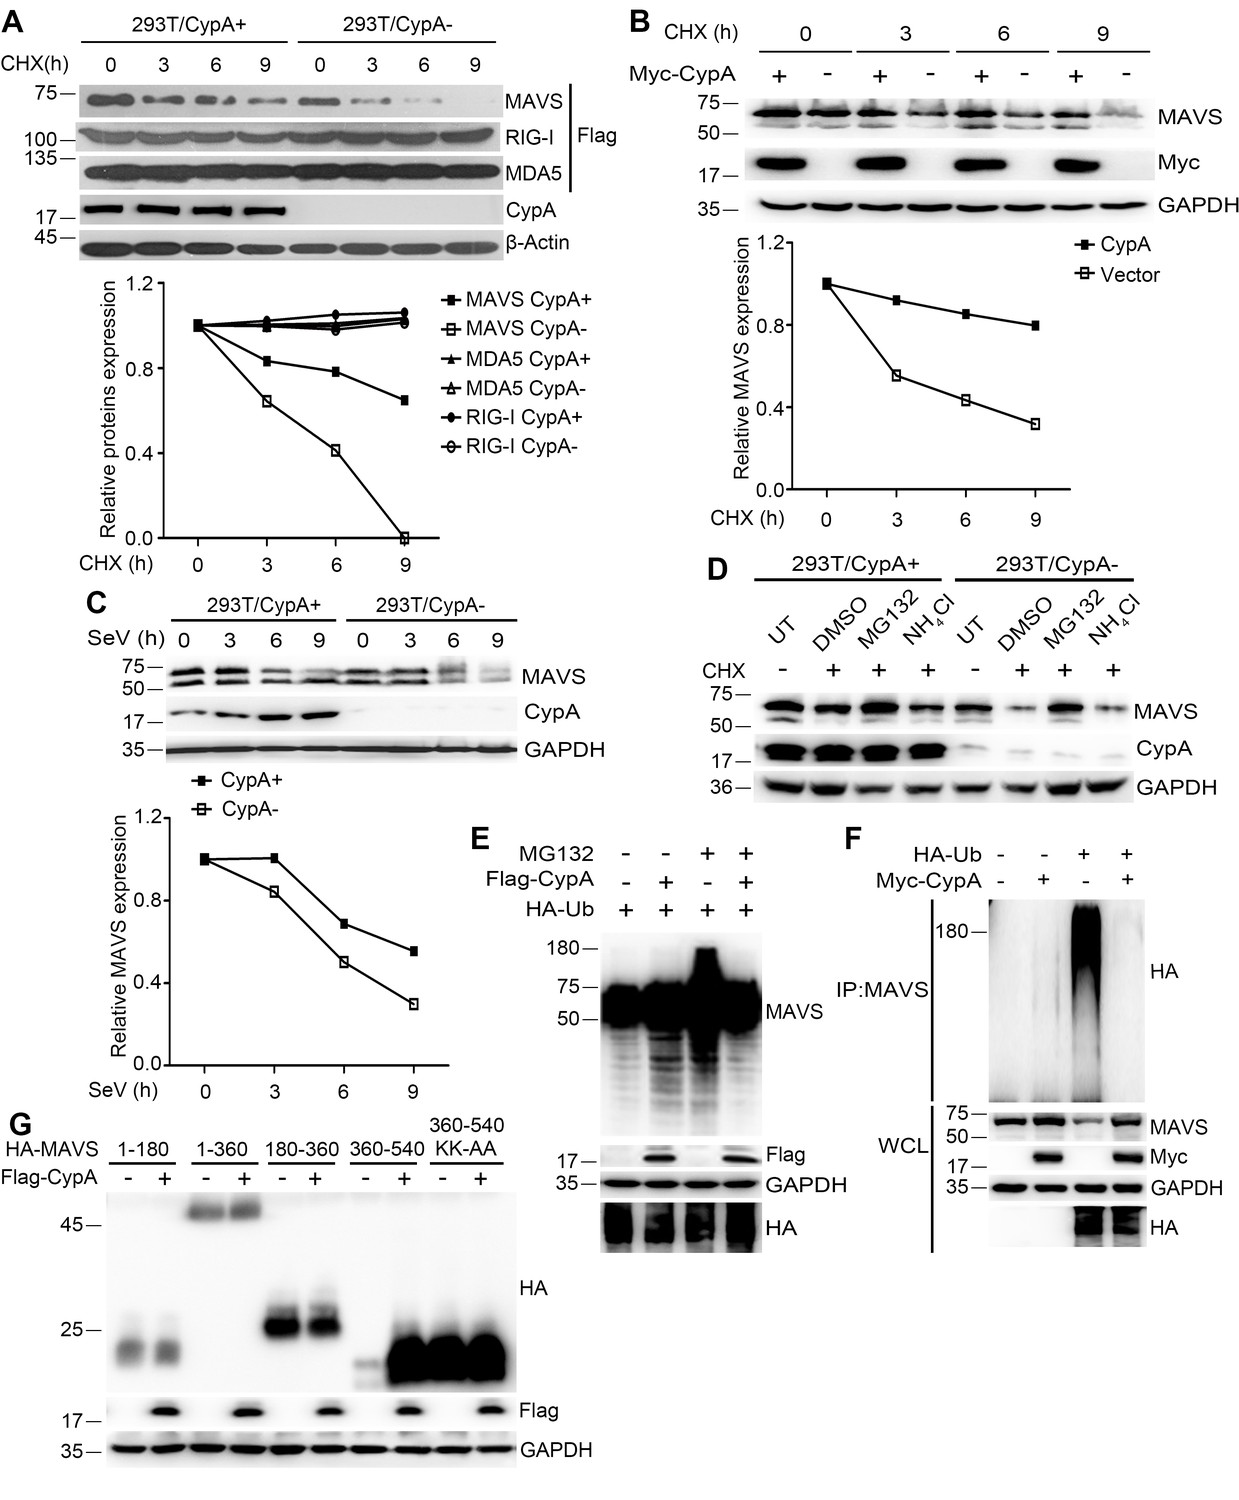
CypA suppresses ubiquitin-mediated proteasome degradation of MAVS.
(A) Immunoblot analysis of lysates in 293T/CypA+ and 293T/CypA- cells transfected with Flag-RIG-I, Flag-MDA5 or Flag-MAVS for 24 hr and then treated with 100 μg/ml CHX for the indicated durations (top). The relative expression levels of RIG-I, MDA5 and MAVS were quantified (below). (B) Immunoblot analysis of lysates in 293T/CypA- cells transfected with Myc-CypA or control vector for 24 hr and then treated with 100 μg/ml CHX for the indicated time points (top). The relative expression levels MAVS were quantified (below). (C) Immunoblot analysis of lysates in 293T/CypA+ and 293T/CypA- cells incubated with SeV for the indicated times (top). The relative expression levels of MAVS were quantified (below). (D) Immunoblot analysis of lysates in 293T/CypA+ and 293T/CypA- cells treated for 6 hr with 100 μg/ml CHX, along with 10 μM NH4Cl, 10 μM MG132, or DMSO. (E) Immunoblot analysis of lysates in 293T/CypA- cells transfected for 24 hr with HA-Ub, along with Flag-CypA or control vector and then treated with 10 μM MG132 for 6 hr. (F) Immunoblot analysis of lysates in 293T/CypA- cells transfected for 24 hr with HA-Ub, along with Myc-CypA or control vector and then immunoprecipitated with anti-MAVS antibody. (G) Immunoblot analysis of lysates in 293T/CypA- cells transfected for 24 hr with HA-tagged deletion constructs of MAVS (amino acids remaining, above lanes) and point substitution constructs containing amino acids 360–540 (KK-AA, K371A plus K420A), along with Myc-CypA or control vector. Data are representative of at least three independent experiments.
Figure 7
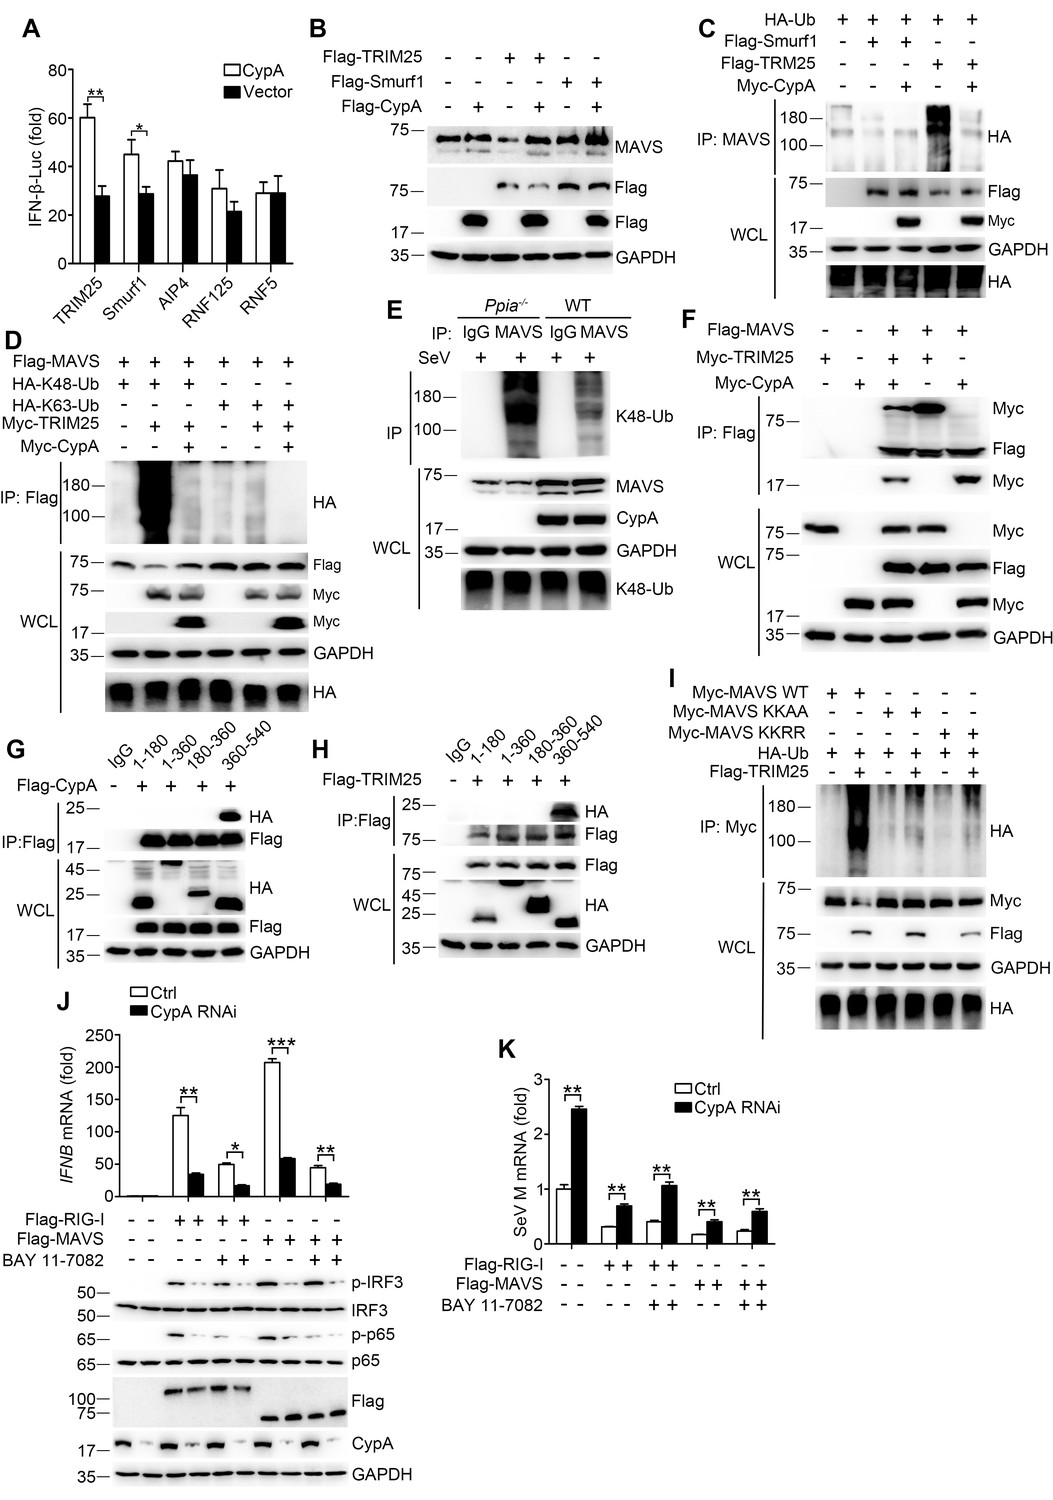
CypA inhibits TRIM25-mediated K48-linked ubiquitination of MAVS.
(A) Luciferase activity of lysates in 293T/CypA- cells transfected for 24 hr with IFN-β-Luc and Flag-TRIM25, Flag-Smurf1, Flag-AIP4, Flag-RNF125, or Flag-RNF5, along with CypA or an empty vector and then treated with SeV for 6 hr. Results are presented relative to the luciferase activity in control cells transfected with luciferase reporter and empty vector. (B) Immunoblot analysis of lysates in 293T/CypA- cells transfected with various combinations of plasmids for 24 hr. (C) Immunoblot analysis of lysates in 293T/CypA- cells transfected with various combinations of plasmids for 24 hr, followed by immunoprecipitation with anti-MAVS antibody. (D) Immunoblot analysis of lysates in 293T/CypA- cells transfected with various combinations of plasmids for 24 hr, followed by immunoprecipitation with anti-Flag beads. (E) Immunoblot analysis of lysates in WT and Ppia−/− BMDMs infected with SeV for 6 hr, followed by immunoprecipitation with control mouse IgG or anti-MAVS antibodies. Lysates and immunoprecipitation extracts were probed with K48-Ub, MAVS and CypA antibodies. (F) Immunoblot analysis of lysates in 293T/CypA- cells transfected with various combinations of plasmids, followed by immunoprecipitation with anti-Flag beads. (G and H) Immunoblot analysis of lysates in 293T/CypA+ cells transfected for 24 hr with Flag-CypA (G) or Flag-TRIM25 (H), along with HA-tagged deletion constructs of MAVS, followed by immunoprecipitation with anti-Flag beads. (I) Immunoblot analysis of lysates in 293T/CypA+ cells transfected with HA-Ub, plus Myc-MAVS, Myc-MAVS KK-AA (K371A plus K420A), or the double point substitution construct Myc-MAVS KK-RR (K7R plus K10R), along with Flag-TRIM25 or an empty vector, followed by immunoprecipitation with anti-Myc beads. (J) Quantitative PCR analysis of IFNB1 mRNA in 293T/RIG-I−/− cells pretreated for 1 hr with BAY 11–7082 (5 μM) or DMSO, and then transfected for 48 hr with Flag-RIG-I, Flag-MAVS or an empty vector, along with scrambled siRNA or CypA siRNA (top). The phosphorylated IRF3 and p65 were detected by immunoblot (below). (K) Quantitative PCR analysis of SeV M mRNA in 293T/RIG-I−/− cells pretreated for 1 hr with BAY 11–7082 (5 μM) or DMSO, then transfected for 48 hr with Flag-RIG-I, Flag-MAVS or an empty vector, along with scrambled siRNA or CypA siRNA, and then infected with SeV for 6 hr. Results are presented relative to mRNA level of SeV M in control cells transfected with empty vector and infected with SeV. Data are shown as mean ± SD (n = 3). *p<0.05 and **p<0.01 (unpaired, two-tailed Student’s t-test). Data are representative of at least three independent experiments.
-
Figure 7—source data 1
Quantification of luciferase activity, IFN-β production and SeV replication for Figure 7.
- https://doi.org/10.7554/eLife.24425.019
Download links
A two-part list of links to download the article, or parts of the article, in various formats.
Downloads (link to download the article as PDF)
Open citations (links to open the citations from this article in various online reference manager services)
Cite this article (links to download the citations from this article in formats compatible with various reference manager tools)
Cyclophilin A-regulated ubiquitination is critical for RIG-I-mediated antiviral immune responses
eLife 6:e24425.
https://doi.org/10.7554/eLife.24425


