Structural basis of cooperativity in kinesin revealed by 3D reconstruction of a two-head-bound state on microtubules
- Yale University, United States
Figures
Figure 1 with 3 supplements

Schematic illustration of the FINDKIN algorithm.
(A) Step I: Conventional helical analysis (IHRSR) is applied to low-defocus framesets to determine the XY-shifts and Euler angles of all tubulin dimers in the microtubule. Step II: FINDKIN determines which tubulin dimers are associated with kinesin with a cross-correlation-based search algorithm. Step III: Single-particle reconstruction using only the selected sites yields density map of dimeric kinesin. (B) Illustration of the search area associated with a particular pair of tubulin dimer under examination (shown in dark green). Other overlapping kinesin-binding sites in the search area are shown in light green. The search area is determined by the angle of projection. (C) Enumeration of all kinesin-binding patterns in the search area (shown as the black box). Two binding states (occupied or empty) are shown in red and purple. Some examples of the possible binding patterns in the search area are depicted. In this illustration, there are nine tubulin dimers in the search area, so there are 29 possible binding patterns in total. The binding state of the site under examination is assigned according to the best-matched pattern. Raw images from our dataset and results from conventional helical analysis are shown in Figure 1—figure supplement 1. Specific details of the FINDKIN analysis are illustrated for a single microtubule in Figure 1—figure supplement 2. The FINDKIN algorithm is summarized in step-by-step flowcharts as shown in Figure 1—figure supplement 3.
Figure 1—figure supplement 1
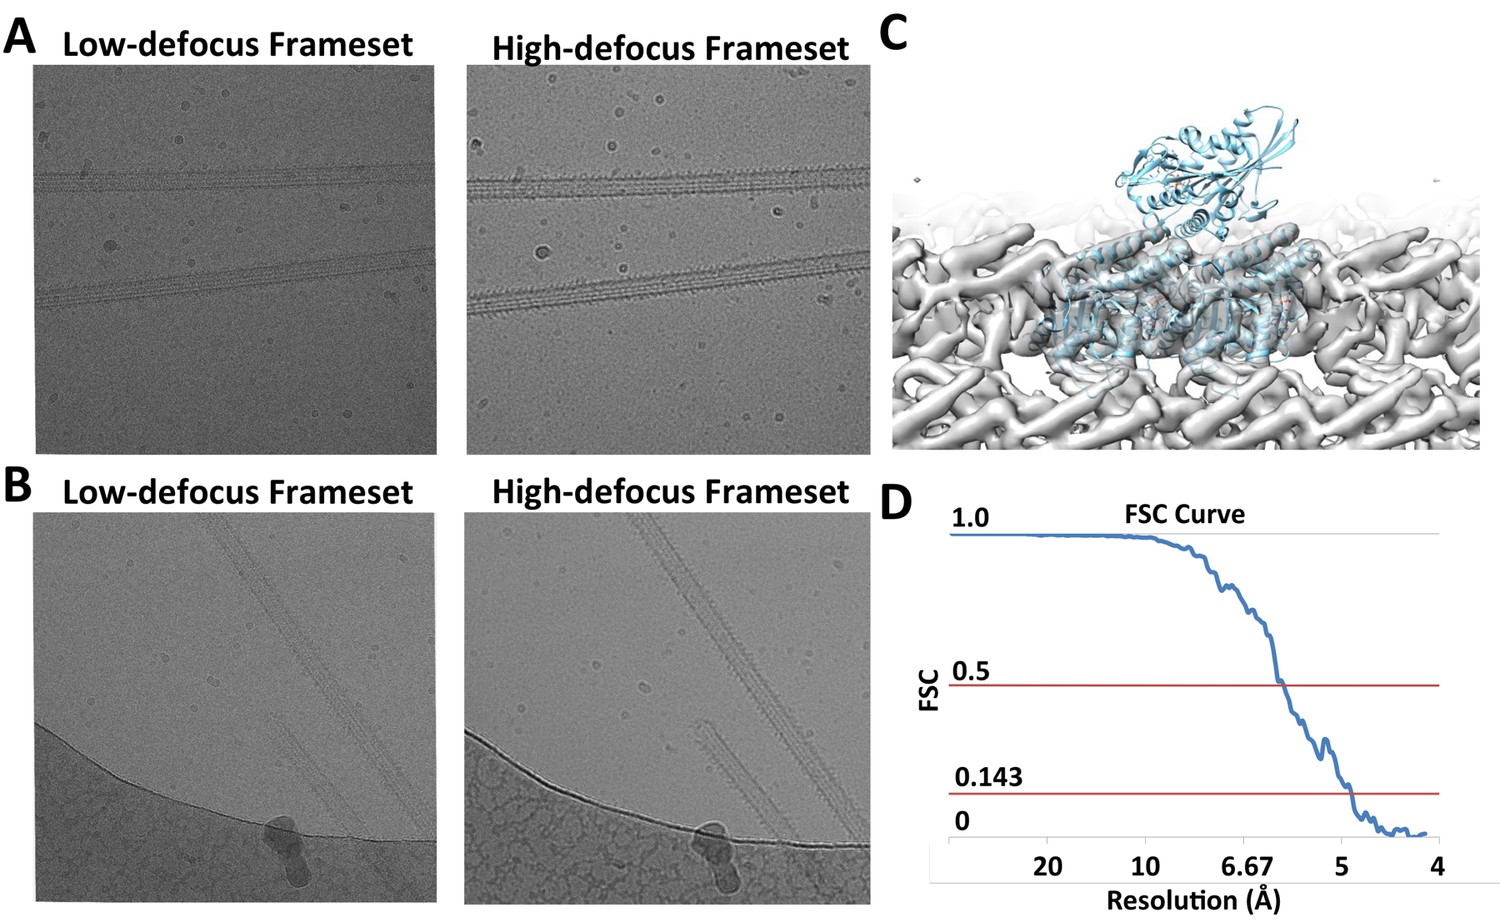
Raw Images and conventional helical reconstruction.
(A) and (B) show two examples of raw images. The videos are segregated into low- and high-defocus framsets. (C) Conventional helical reconstruction of 13-protofilament microtubules from the dataset, low-pass filtered to 6 Å. (D) FSC curve corresponding to the density map shown in (C).
Figure 1—figure supplement 2
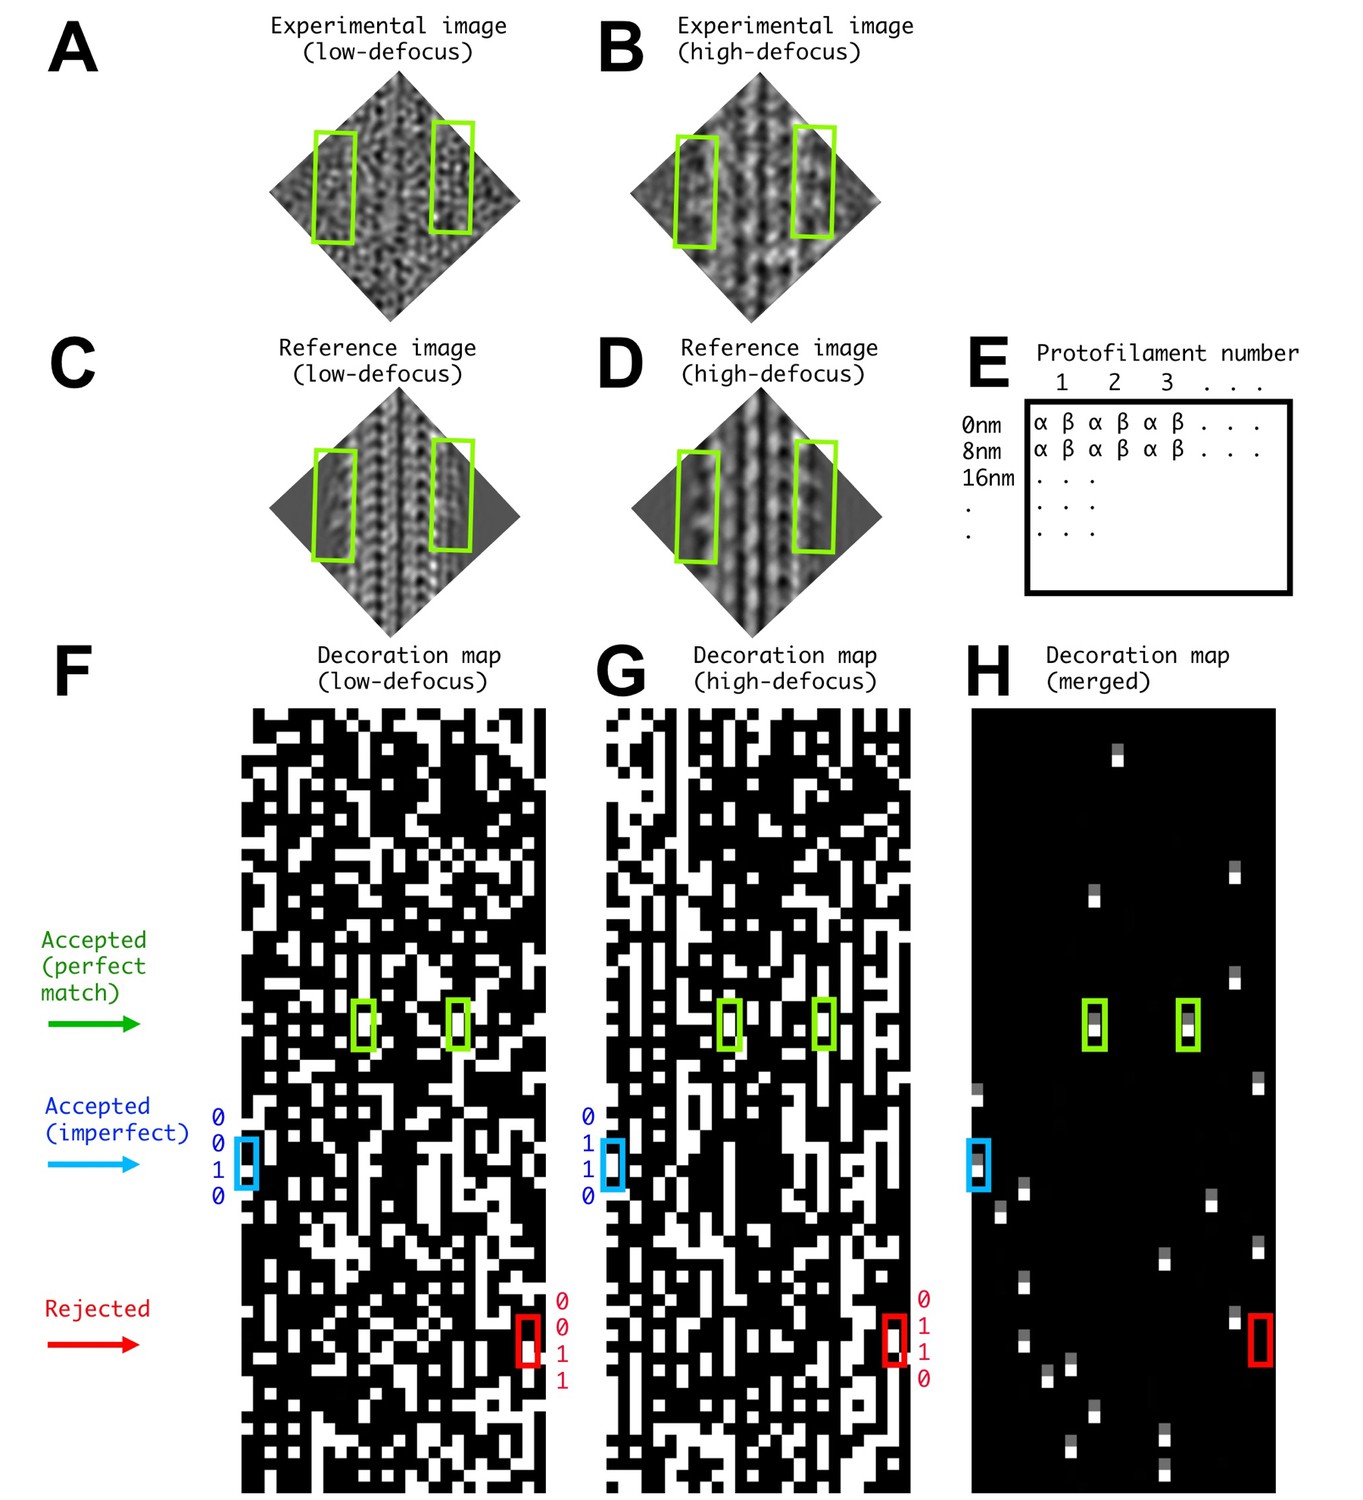
Illustration of FINDKIN analysis for a single microtubule segment.
(A) and (B) show the low- and high-defocus experimental images of one microtubule segment. The corresponding reference images, revealing the best-matched kinesin-binding patterns, are shown in (C) and (D). Two kinesin dimers are identified in this example (green boxes), corresponding to the green boxes in panels (F–H). The dimer densities are plainly visible in the high-defocus experimental image but not in the low-defocus one. Panel (E) shows the format of the binding matrices. The lanes correspond to the protofilaments and the lines correspond to consecutive 8 nm repeats. While conventional helical analysis usually determines the αβ-registry of the protofilaments with high confidence, the current FINDKIN algorithm does not rely on this information and considers both αβ- and the alternative βα-registries of each 8 nm repeat. For each protofilament, the kinesin-binding states for both registries are recorded in two separate lanes, labeled by ‘α’ and ‘β’ in panel (E). In practice, binding sites determined with the wrong registry of the protofilaments are discarded. (F) and (G) are illustrations of the low- and high-defocus binding matrices of one microtubule, respectively. (F) and (G) follow the format shown in (E), and an occupied site (‘1’ in the binding pattern) is shown in white while an empty site (‘0’ in the binding pattern) is shown in black. (H) shows the ‘0110’ sites selected by FINDKIN. Note that the two sites in green boxes are determined to be ‘0110’ in both low- and high-defocus binding matrices and are designated as ‘perfect match’. The site in the blue box is ‘0110’ in the high-defocus binding pattern, but ‘0010’ in the low-defocus binding pattern. Because we only enforce the ‘0’ sites adjacent to the dimer with the information from the low-defocus binding pattern, the blue site is still selected. In practice, all ‘0110’ sites from the high-defocus binding pattern whose corresponding sites in the low-defocus binding pattern have the form of ‘0??0’ will be selected. This procedure rejects a potentially ‘frame shifted’ dimer site in the red box.
Figure 1—figure supplement 3
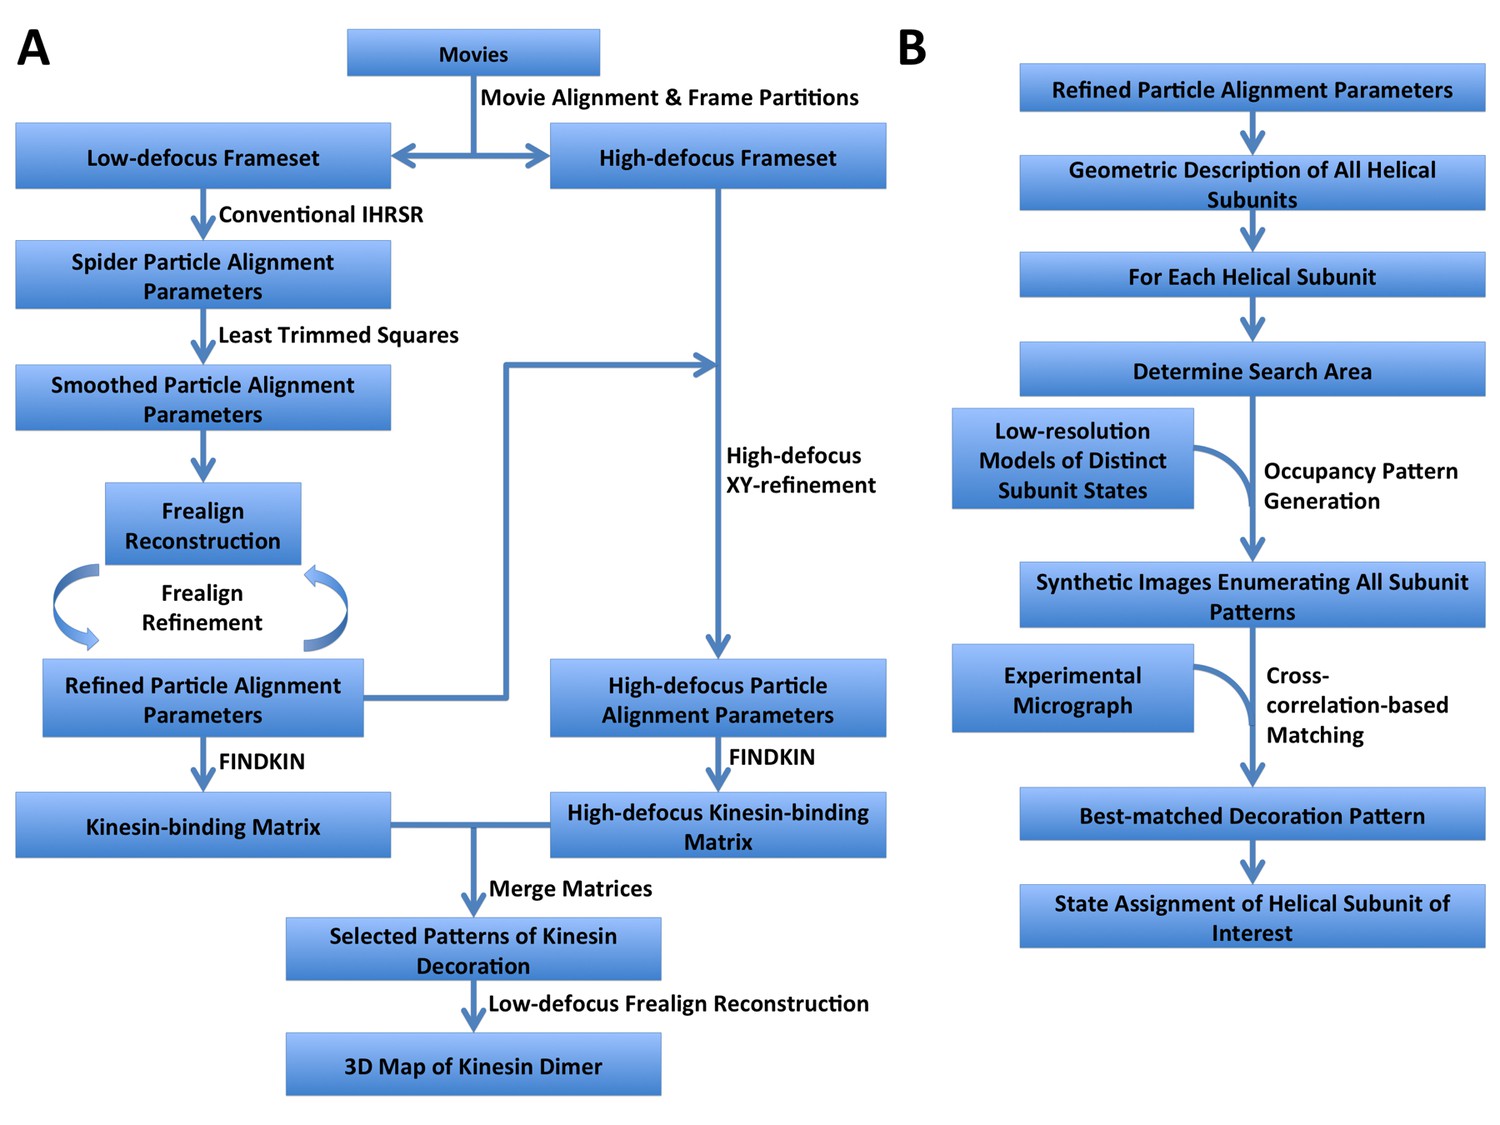
Step-by-step flowcharts of the FINDKIN algorithm.
(A) Flowchart showing the overall scheme of FINDKIN. (B) Flowchart showing the detailed steps in pattern matching by cross-correlation in FINDKIN.
Figure 2 with 1 supplement
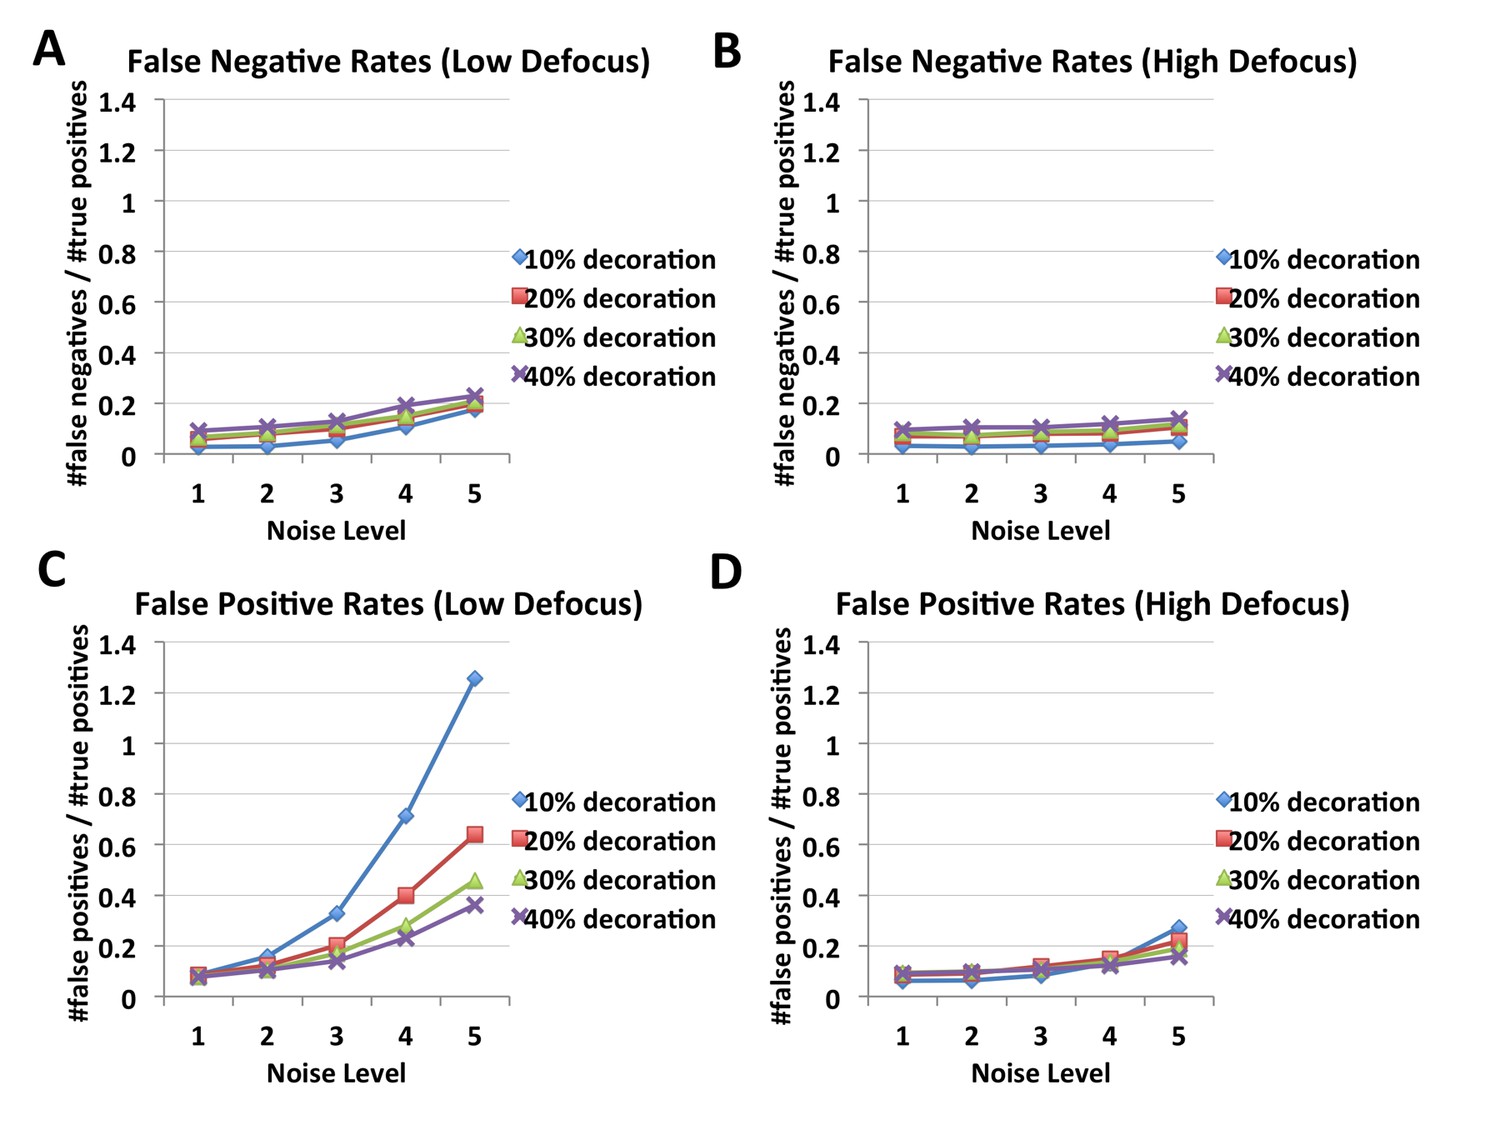
FINDKIN performances on synthetic microtubules, affected by noise level, occupancy and defocus.
Panels (A) and (B) show the false negative rates of FINDKIN at low and high defocus respectively. False negative rates stay below or around 20%. Panel (C) shows false positive rates at low defocus, which increase dramatically with higher noise, especially at low occupancy. In contrast, panel (D) shows the false positive rates at high defocus, which reach around 20% even at the highest noise level tested. Examples of the synthetic microtubules are shown in Figure 2—figure supplement 1.
Figure 2—figure supplement 1
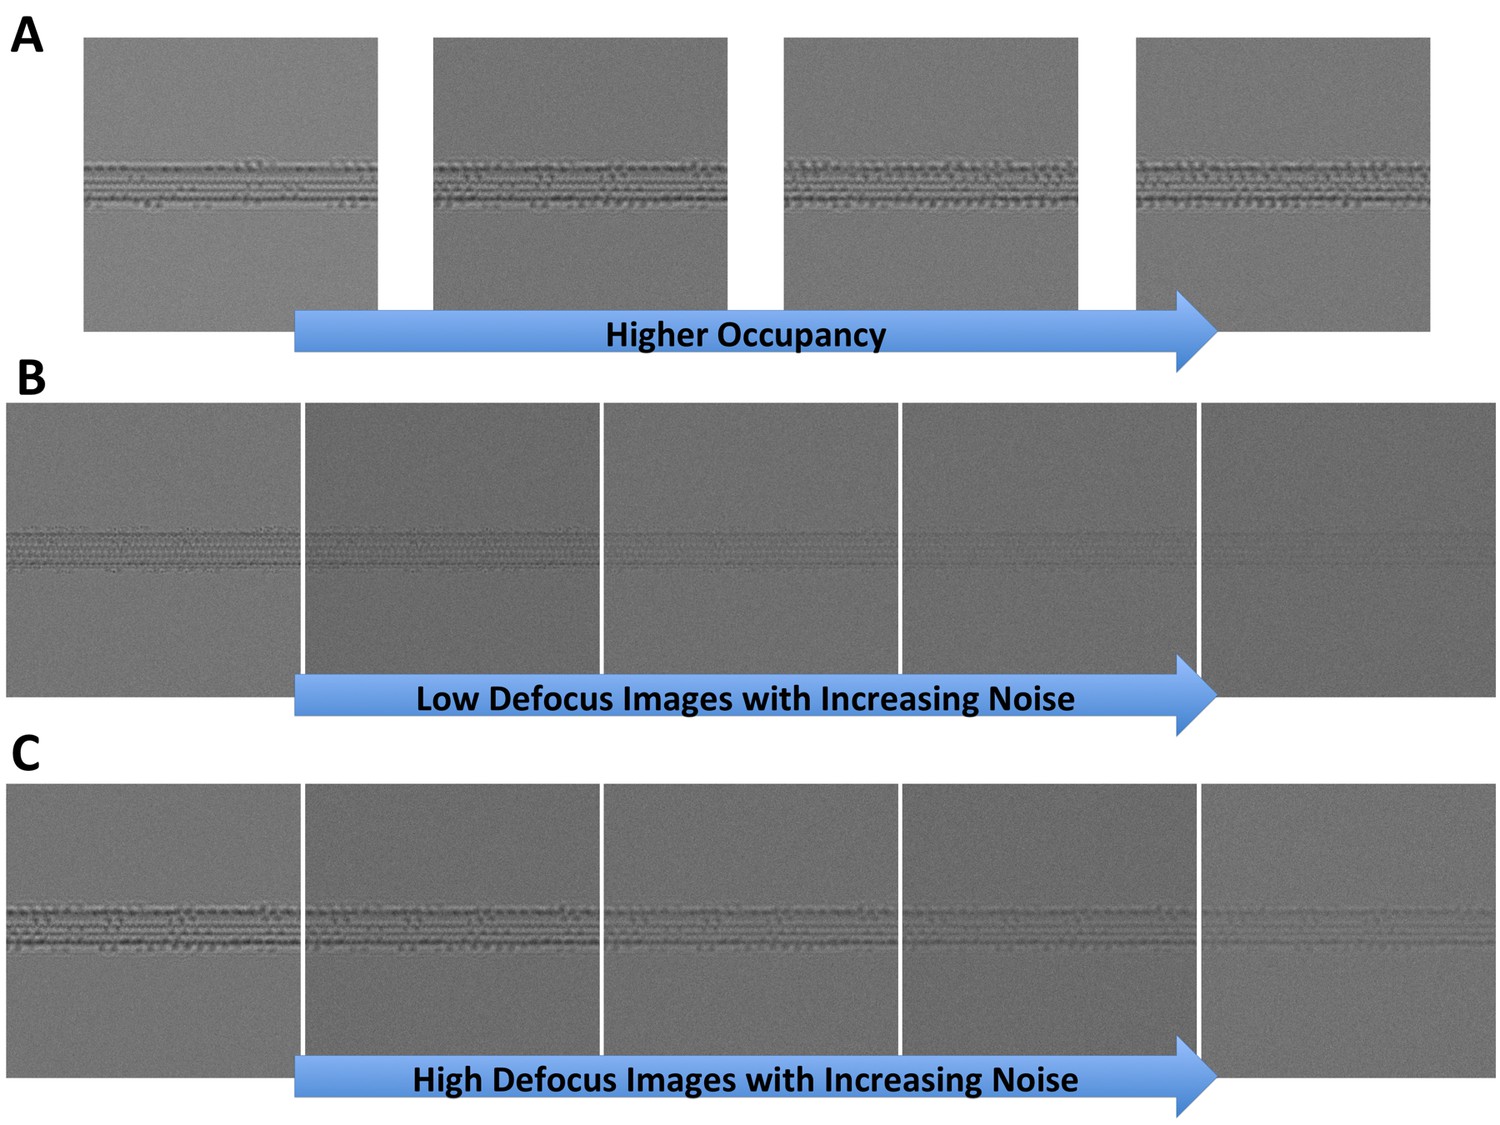
Synthetic microtubules.
(A) Synthetic microtubules with increasing occupancy (10, 20, 30% and 40% from left to right). (B) Synthetic microtubules at low defocus with increasing noise (level 1 through 5). (C) Synthetic microtubules at high defocus with increasing noise (level 1 through 5).
Figure 3 with 1 supplement
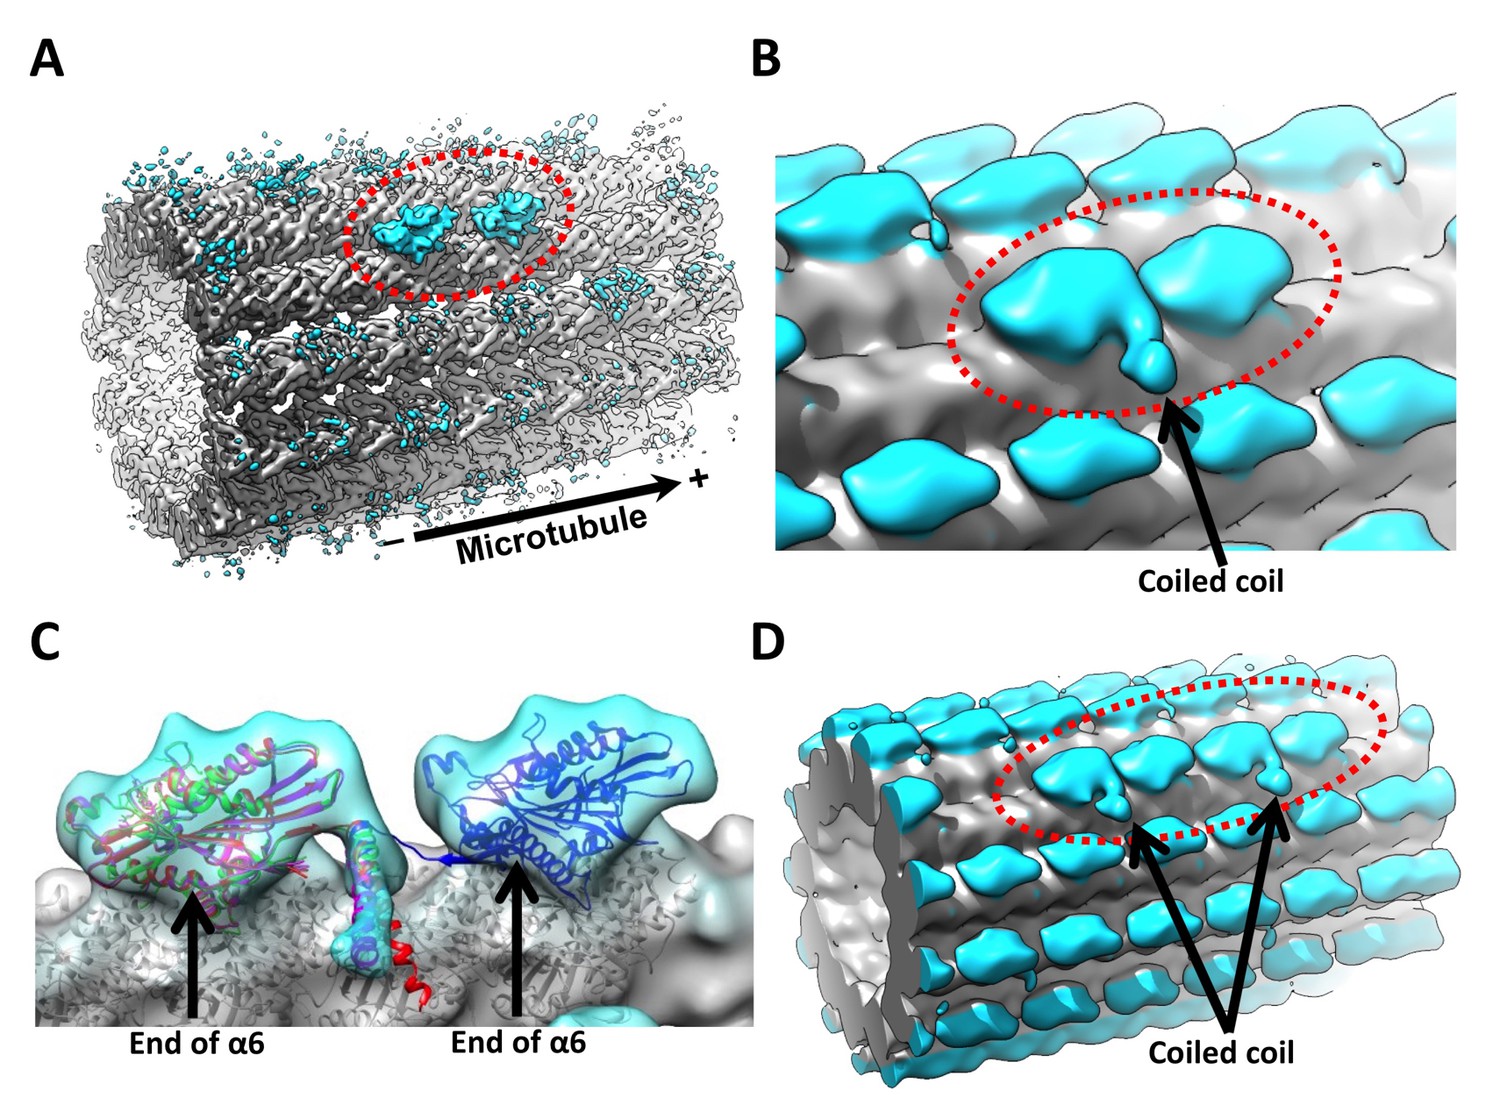
3D reconstruction of kinesin dimer.
(A) The kinesin dimer density map (low-pass filtered to 8.5 Å) shows two heads (circled with red dashed line) that bind sequentially along one protofilament. (B) Same map low-pass filtered to 15 Å. Arrow points to the density corresponding to the coiled coil. No contact between the coiled coil density and the microtubule surface is evident in our map. (C) Crystal structures of kinesin motor domain (PDB ID: 1MKJ, 3KIN) are fit into the trailing head. Direction of the coiled coil density in the map is consistent with the PDB models. Additionally, 3J8X is fit into the leading head. Arrows point to the ends of helices α6, where the neck linkers originate. The coiled coil density appears closer to the trailing head, because the end of helix α6 is closer to the minus-end side of the motor domain. The neck linker from 1MKJ can extend from the coiled coil to the ends of helices α6 in both heads. (D) Parallel 3D reconstruction derived from ‘011110’ sites, showing two neighboring pairs of kinesin dimers. FSC curves are shown in Figure 3—figure supplement 1.
Figure 3—figure supplement 1
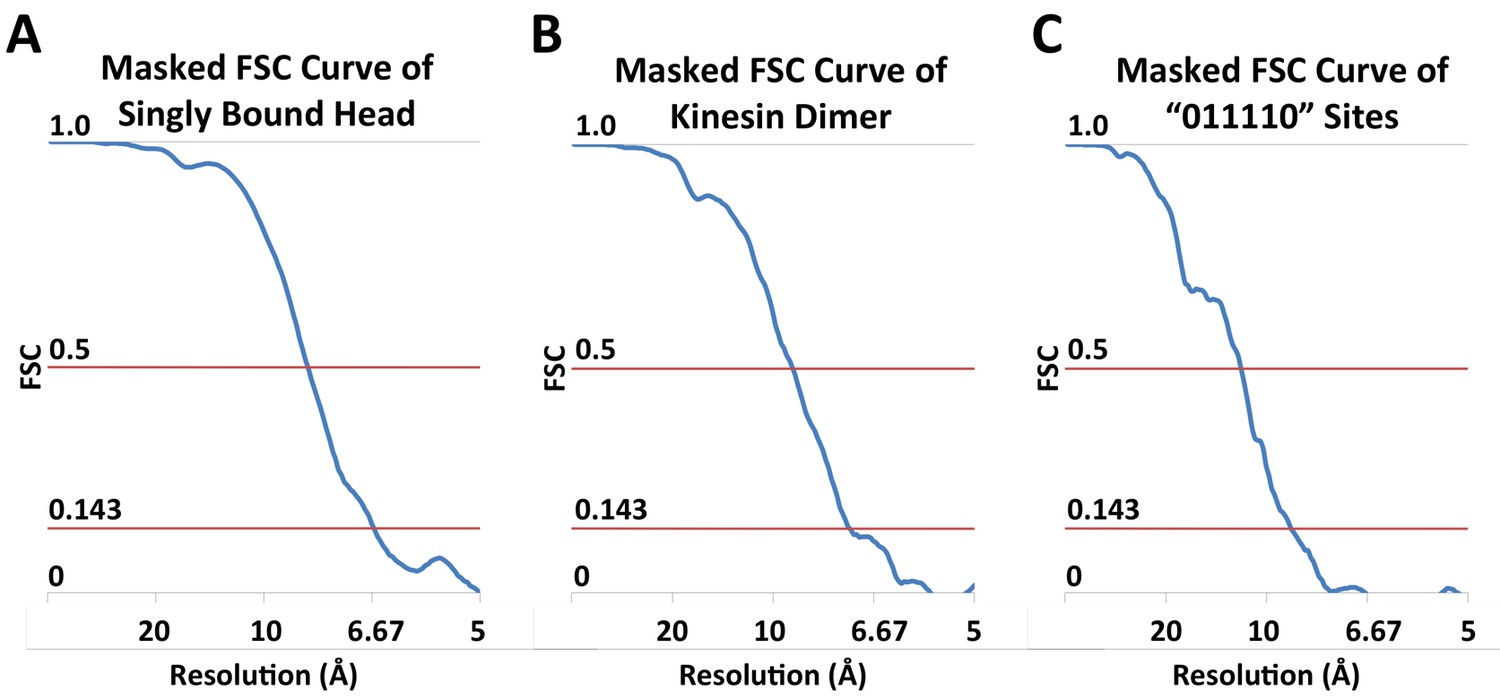
FSC curves.
(A) Masked FSC curve of the reconstruction of singly-bound head. (B) Masked FSC curve of the kinesin dimer map ('0110' pattern). (C) Masked FSC curve of the four-head map derived from the ‘011110’ pattern.
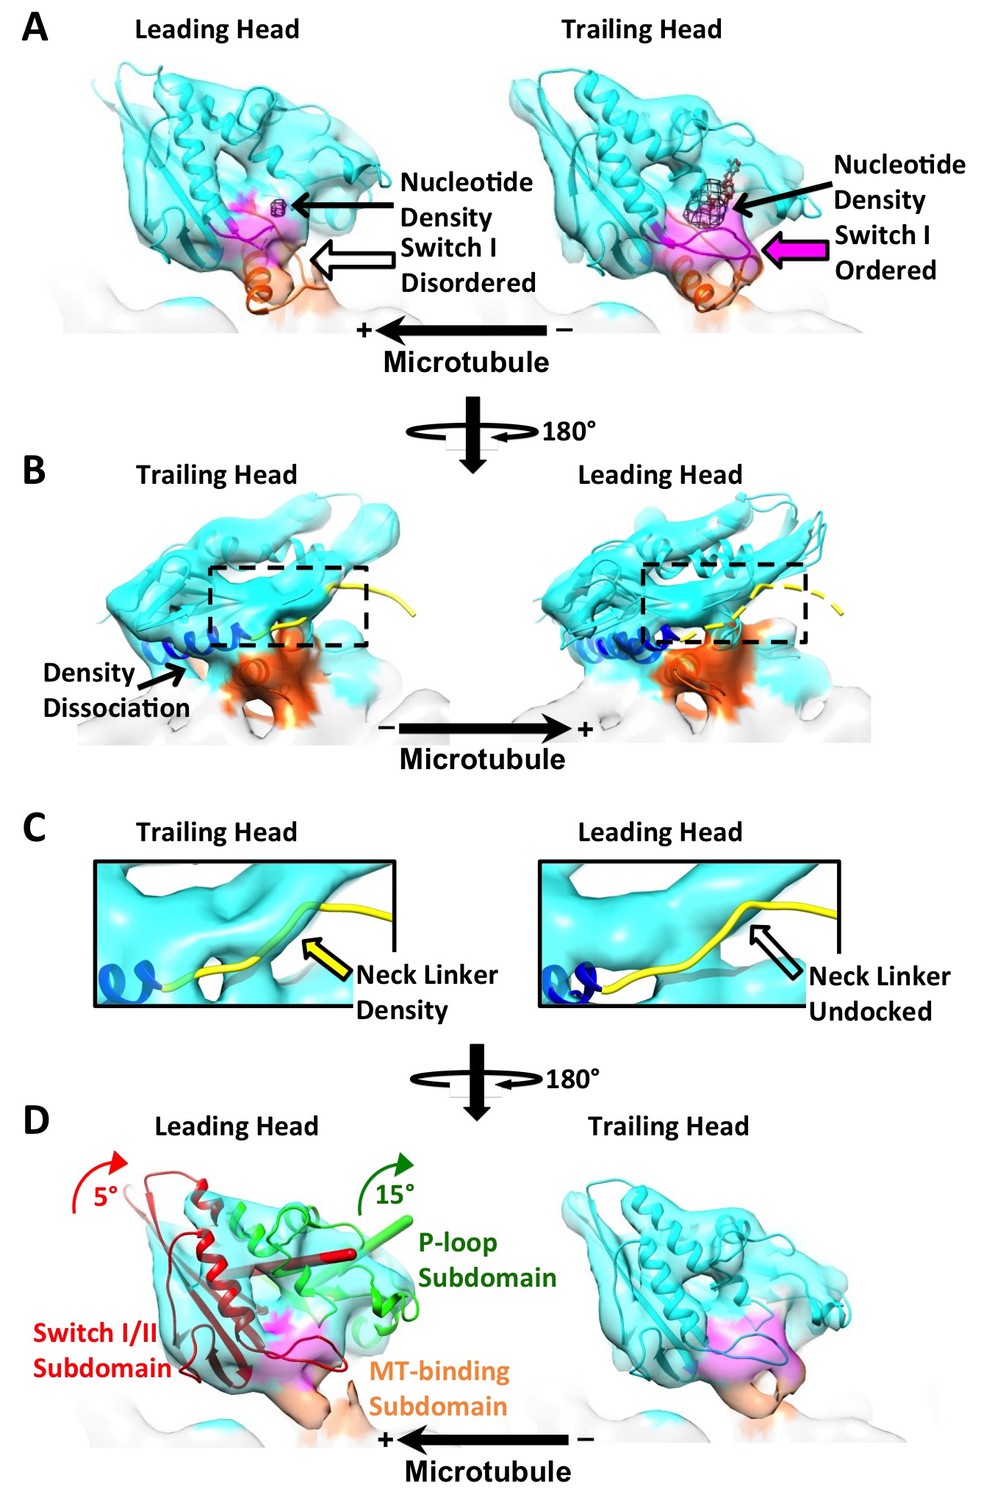
Figure 4 with 3 supplements

The leading and trailing heads show substantial conformational differences in the dimer map.
Panels (A) and (B) are views from opposite angles. Density features corresponding to the switch I loop and the microtubule-binding subdomain are shown in magenta and orange respectively. In panel (A), two PDB models, 4LNU (no-nucleotide state) and 4HNA (ATP-like state), are fit into the leading and trailing heads respectively. Black mesh shows the nucleotide density. (Nucleotide corresponds to the strongest density feature in the kinesin map, so a higher threshold is chosen in Chimera to show only the nucleotide density). Solid and hollow magenta arrows denote ordered and absent density feature corresponding to switch I loop respectively. In panel (B), both 4LNU and 4HNA are fit into the leading head. Helix α6 is shown in blue. In the trailing head, this helix is tilted upwards, reflected by the dissociation of density with the microtubule. In the leading head, density is continuous between α6 and the microtubule surface. As a result, α6 from 4LNU and 4HNA can both be fit into the density so that its precise orientation is not clear from our map. To better visualize the conformational states of the neck linkers, regions within the dashed boxes are enlarged and shown in Panel (C). The neck linker from 4HNA is shown as a yellow strand. In the trailing head, portions of the density overlap with the neck linker in the PDB model (denoted by the solid yellow arrows), but not in the leading head. Panel (D) is in the same viewing angle as in Panel (A). In the leading head, ribbons of the P-loop and switch I/II subdomains are shown in green and red, with their respective rotation axis and magnitudes colored accordingly. Both subdomains are shown in cyan in the trailing head. Similar results are observed from a parallel reconstruction of kinesin dimer from the ‘011110’ patterns, shown in Figure 4—figure supplement 1. Comparison of the subdomain rotations with published structures of monomeric kinesins is shown in Figure 4—figure supplement 2. Comparison of the kinesin conformations by cross-correlation is summarized in Figure 4—figure supplement 3.
Figure 4—figure supplement 1
Parallel reconstruction of kinesin dimer derived from the ‘011110’ sites.
These sites show a repeat of two neighboring dimers. Densities of the two pairs of dimer are averaged together to generate the map shown here. All panels follow the exact same labeling and formatting as in Figure 4.
Figure 4—figure supplement 2
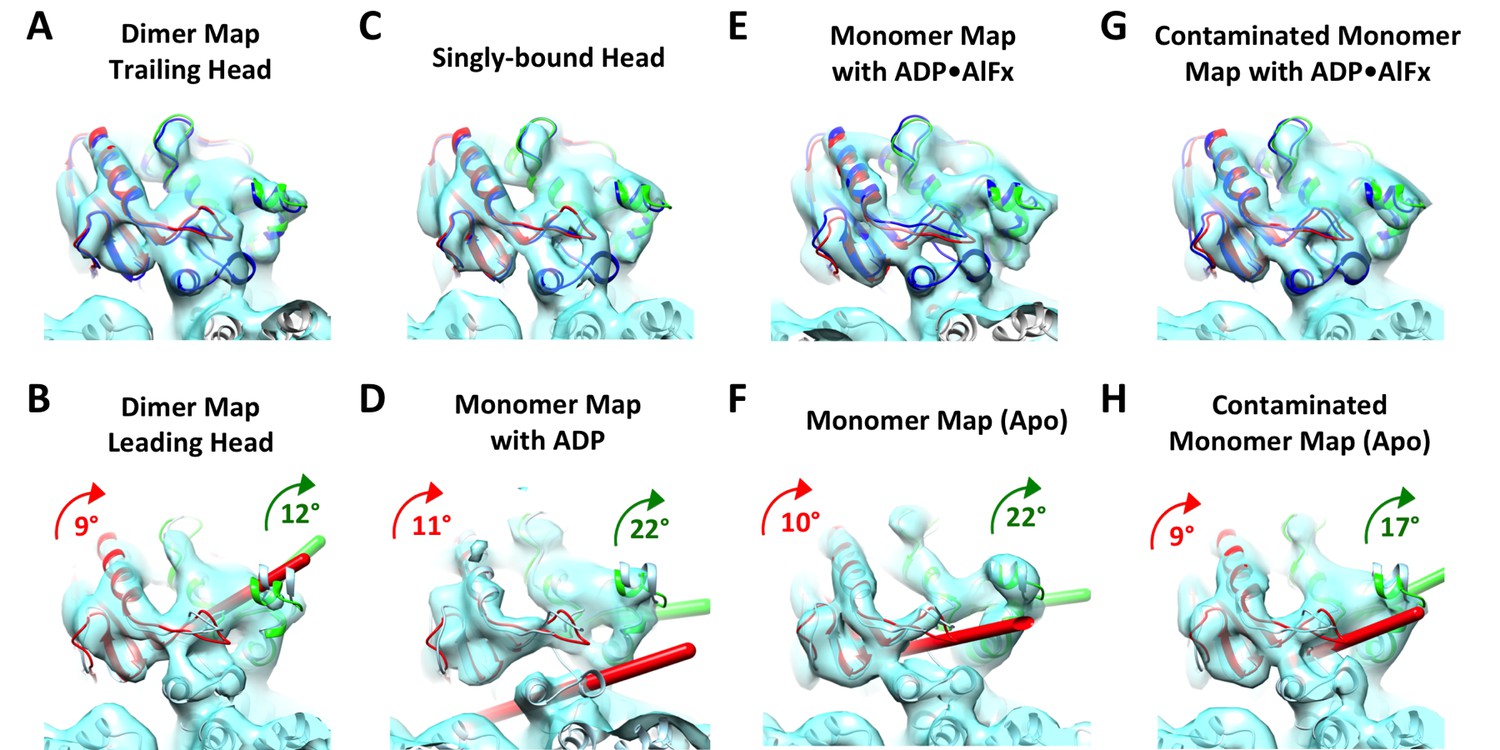
Kinesin subdomain rotations in the dimer map and in published monomeric structures.
(A) Trailing head in the current dimer map. (B) Leading head in the current dimer map. (C) Singly-bound head. (D) Monomeric kinesin with ADP. (E) Monomeric kinesin with ADP•AlFx. (F) Monomeric kinesin in the no-nucleotide state. (G) ATP-like state contaminated with singly-bound head by averaging C and E. (H) No-nucleotide state contaminated with singly-bound head by averaging C and F. No significant subdomain rotation is apparent in A, C, E and G. In contrast, rotations of the P-loop and switch I/II subdomains in B, D, F and H are shown in green and red respectively, following the same illustration formatting as in Figure 4D.
Figure 4—figure supplement 3
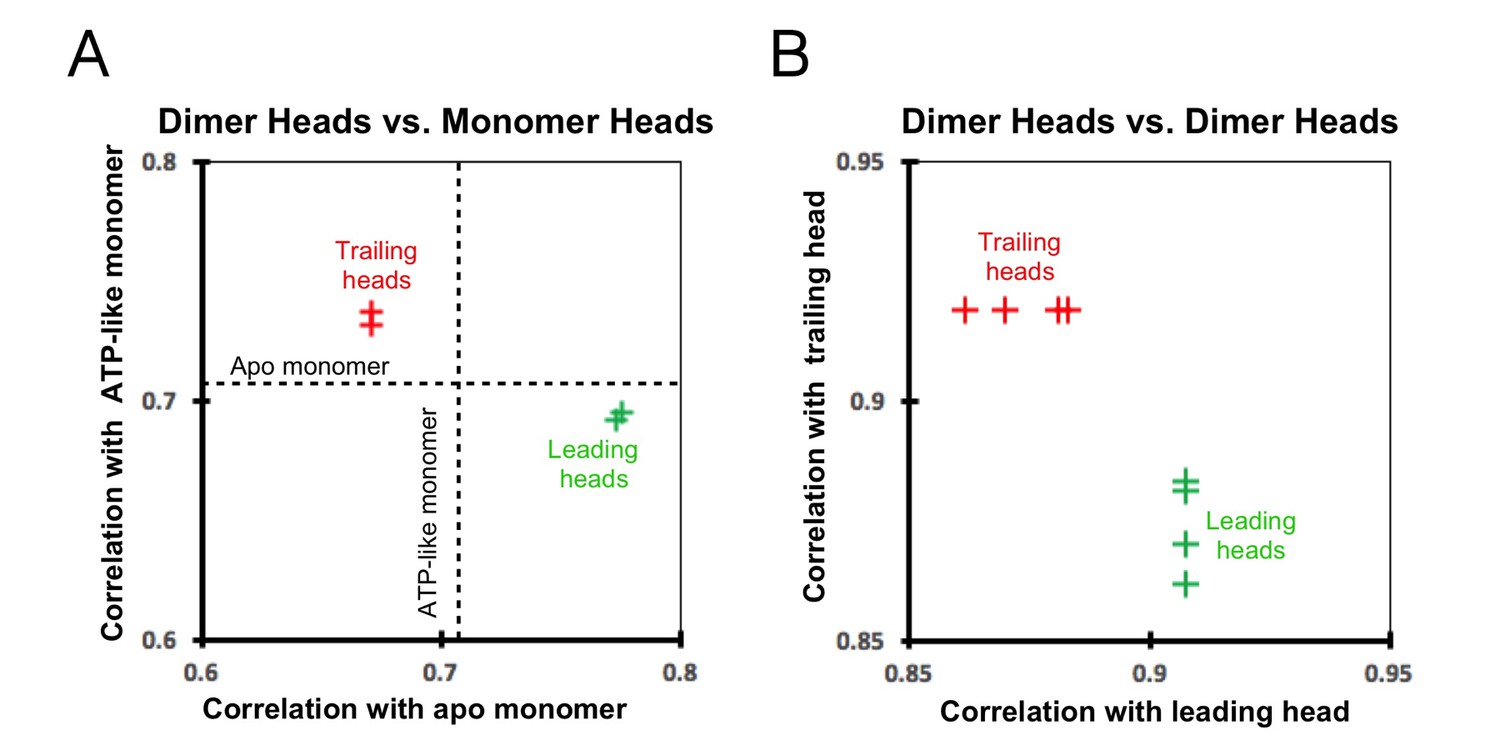
Cross-correlation scores between kinesin heads.
(A) Correlation graph between our dimer maps and monomer maps. The cross-correlation score between the ATP-like and apo (no-nucleotide) monomers (0.7059; dashed lines) provides a reference value. The trailing heads (from both ‘0110’ and ‘011110’ maps) correlate more closely with the ATP-like monomer than with the apo monomer and are indicated as the red crosses in the upper-left section of the graph. In contrast, the leading heads correlate more closely with the apo monomer and are indicated as green crosses in the lower-right section of the graph. (B) Correlation graph between various dimer heads. The trailing heads are indicated as red crosses and the leading heads as green crosses. The correlation between two trailing heads is stronger than that between a trailing and a leading head, reflected in the graph by the y coordinate of the red crosses (0.9188) being larger than the y coordinates of the green crosses (0.8616, 0.8698, 0.8808, 0.8831). Likewise, the correlation between two leading heads is also stronger than that between a trailing and a leading head, reflected in the graph by the x coordinate of the green crosses (0.9077) being larger than the x coordinates of the red crosses (0.8616, 0.8698, 0.8808, 0.8831).
Figure 5
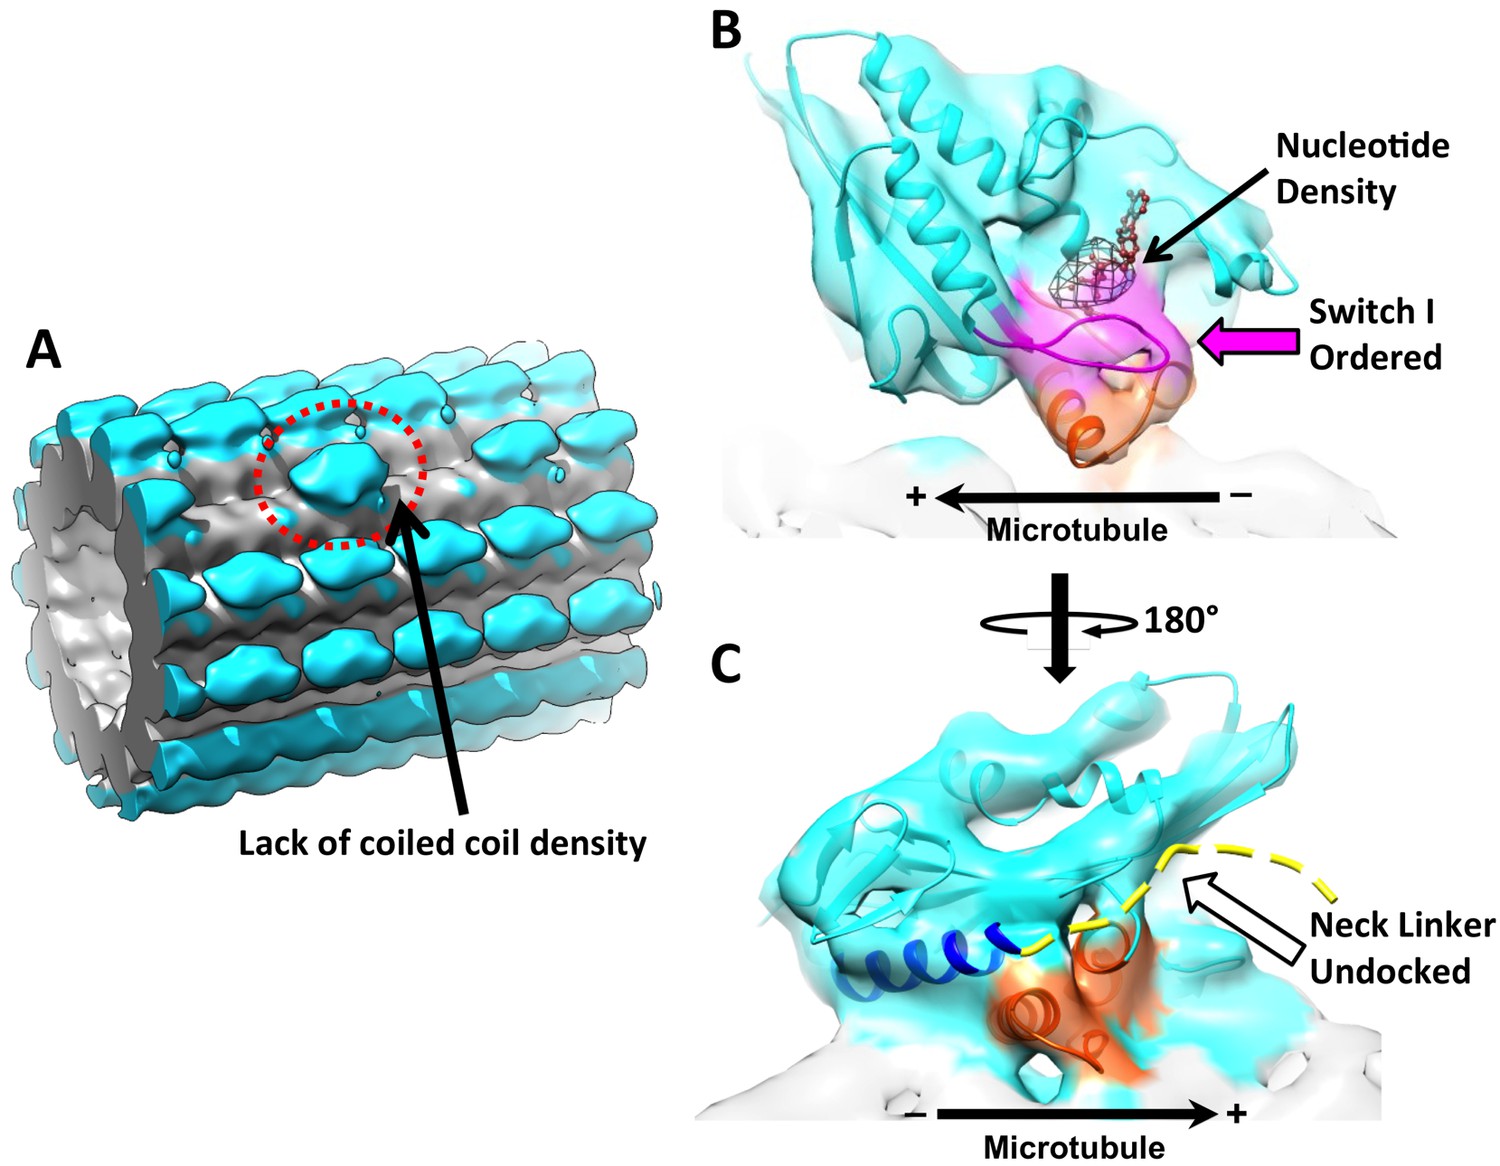
3D reconstruction of ‘010’ sites reveals singly-bound heads.
(A) The singly-bound head is circled with red dashed line. Panels (B) and (C) follow the same labeling and formatting as in Figure 4. (B) The singly bound head adopts a closed conformation of the nucleotide cleft. (C) There is continuous density between helix α6 and the microtubule surface and no density overlaps with the neck linker strand in 4HNA fit into the map.
Figure 6

Schematic of conformational and chemical states of dimeric kinesins.
(A) Model for the conformational and chemical states of dimeric kinesins with ADP•AlFx in our sample. State 1 corresponds to kinesin dimer in the two-head-bound state. State 2 corresponds to a highly transient state where the leading head detaches from the microtubule but the neck linker of the trailing head remains docked. This state transitions into state 3, driven by the entropy gain from a bigger space that the tethered head can explore once neck linker of the trailing head is undocked. State 3 corresponds to the singly-bound head. (B) Model for three key states in the regular motility cycle of dimeric kinesin with ATP. In state 1, after Pi releases, the trailing head (bound with ADP) has low affinity for the microtubule. After ATP binding in the leading head, the kinesin dimer enters a transitional state 2, where the nucleotide cleft is closed in the microtubule-bound head, but its neck linker is undocked. This state can be modeled by the singly-bound head. After ATP hydrolysis, the tethered head completes forward stepping, as seen in state 3. This state can be modeled by our two-head-bound kinesin dimer.
Videos
Video 1
Animation depicting our current model of the kinesin motility cycle, based on cryo-EM maps of dimeric kinesins in both two- and one-head bound states, in combination with previous structural and biochemical studies.
This video highlights two principle features of this model. First, in the two-head-bound state, inter-head tension keeps the neck linkers in the two heads pointing in opposite directions; in the leading head, backward orientation of the neck linker favors an open nucleotide cleft, thus discouraging ATP binding/hydrolysis. Second, ATP binding in the one-head-bound state closes the nucleotide cleft, but fails to dock the neck linker (precise structural details of this novel conformational state remain unclear from the current data). Consequently, ATP hydrolysis is required to commit to a forward step, returning to the beginning of the depicted motility cycle.
Download links
A two-part list of links to download the article, or parts of the article, in various formats.
Downloads (link to download the article as PDF)
Open citations (links to open the citations from this article in various online reference manager services)
Cite this article (links to download the citations from this article in formats compatible with various reference manager tools)
Structural basis of cooperativity in kinesin revealed by 3D reconstruction of a two-head-bound state on microtubules
eLife 6:e24490.
https://doi.org/10.7554/eLife.24490


