Synergistic interactions with PI3K inhibition that induce apoptosis
- Broad Institute of Massachusetts Institute of Technology and Harvard, United States
- Dana-Farber Cancer Institute, United States
- Massachusetts Institute of Technology, United States
- Dana Farber Cancer Institute, United States
- Harvard Medical School, United States
- Brigham and Women’s Hospital, Harvard Medical School, United States
Figures
Figure 1 with 1 supplement

Genome scale shRNA screen identifies genes whose suppression facilitates PI3Ki-induced cell death.
(A) A schematic representation of the pooled shRNA screen design. (B) Z-scores for fold-change of proliferation of MDA-MB-453-eGFP cells infected with multiple shRNAs targeting the indicated genes and treated for 9 days with GDC0941 (0.625 μM; red), or vehicle (DMSO; blue). Cells infected with five different control shRNAs (shCTRLs) were used to calculate Z-scores. Bars indicate standard deviation between the different shRNAs targeting each gene. Data shown are representative of three independent experiments. (C–D) MDA-MB-453 cells were infected with the indicated shRNAs, and then treated for 4 days with GDC0941 (0.625 μM) (C) or left untreated (D). Adherent and floating cells were collected and subjected to immunoblot analysis for induction of PARP cleavage. Cells infected with a shRNA targeting ZNF565 and treated with GDC0941 (0.625 μM) for 4 days were used as positive control for PARP cleavage (D). Data shown are representative of two independent experiments. (E) MDA-MB-453 cells were infected as in B and treated for 4 days with GDC0941 (0.625 μM). Adherent and floating cells were collected and analyzed for DNA content by flow cytometry. Bars indicate standard deviation between the different shRNAs targeting each gene.
Figure 1—figure supplement 1
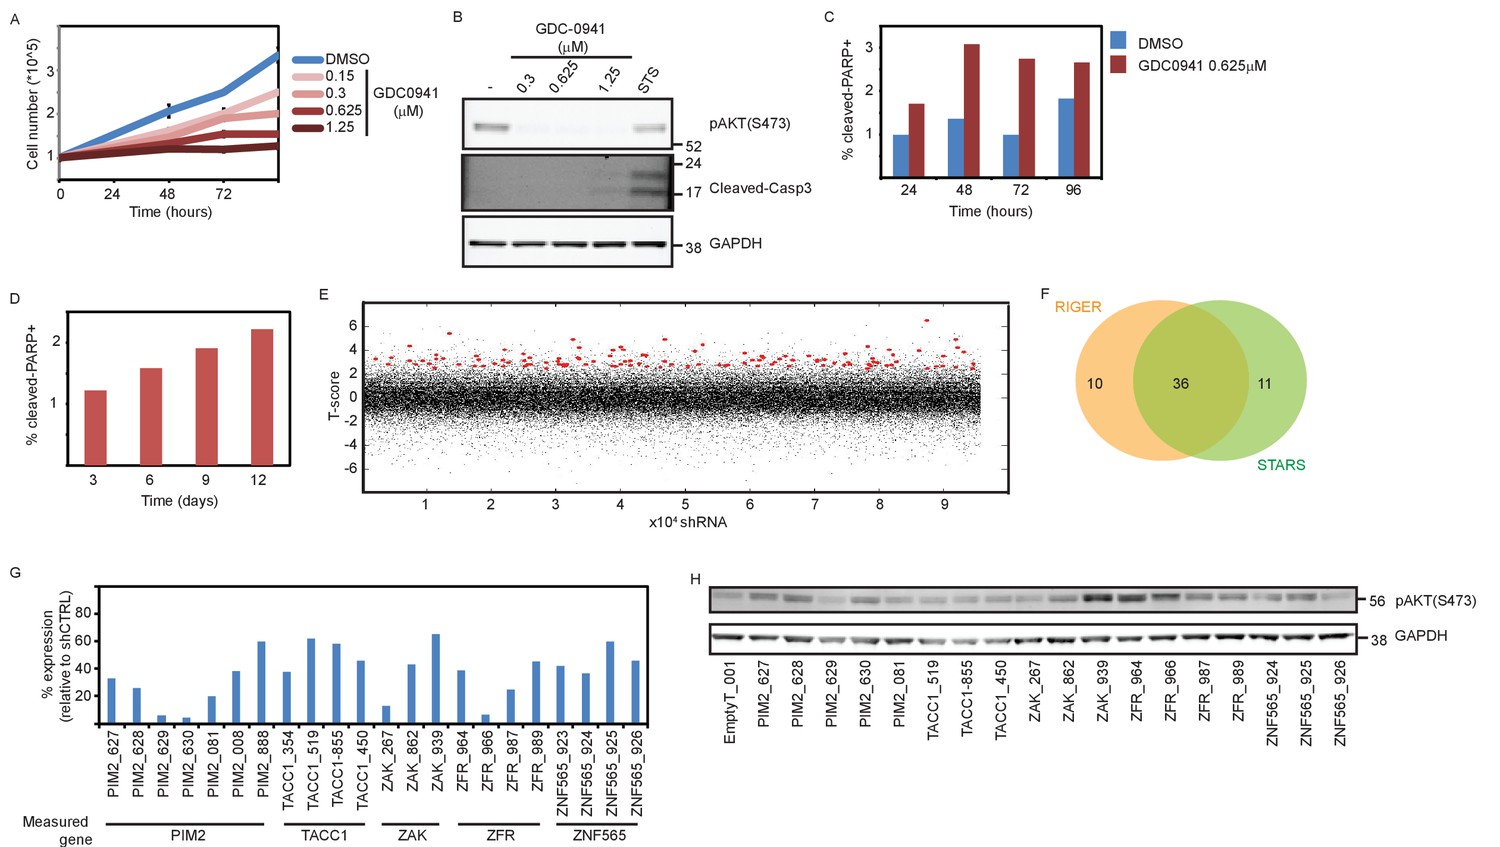
Supporting information for shRNA screen setup and scoring.
(A) MDA-MB-453 cells were counted at the indicated time points after initiation of treatment with either DMSO or GDC0941 at the indicated concentrations. Experiments were performed in triplicates, with error bars representing standard deviation. Data shown are representative of two independent experiments. (B) MDA-MB-453 cells were seeded and treated as in A. Seventy-two hours after treatment initiation, cells were lysed and Western blotting analysis was performed using the indicated antibodies. Staurosporine (STS, 1 μM, 6 hr) was used as a positive control for cleaved-Caspase3 antibody. (C–D) MDA-MB-453 cells were seeded and treated as in A. Adherent and floating cells were collected and fixed at the indicated time-points. Cells were then stained with cleaved-cPARP antibody and analyzed by flow cytometry. At least 30,000 cells were acquired per sample. (E) Scoring of individual shRNAs according to a T-statistic. Each dot represents an individual shRNA T-statistic value. Red dots represent shRNAs that contributed to the nomination of genes by STARS. (F) Venn diagram summarizes the gene calling by either RIGER or STARS algorithms. (G) qPCR was used to measure the expression of the targeted genes in MDA-MB-453 cells infected with the indicated shRNAs relative to their mean expression in cells infected with five different control shRNA. Data shown are representative of two independent experiments. (H) MDA-MB-453 cells were infected with the indicated shRNAs. Five days post-infection cells were collected and subjected to Western blot analysis of AKT phosphorylation.
Figure 2 with 1 supplement
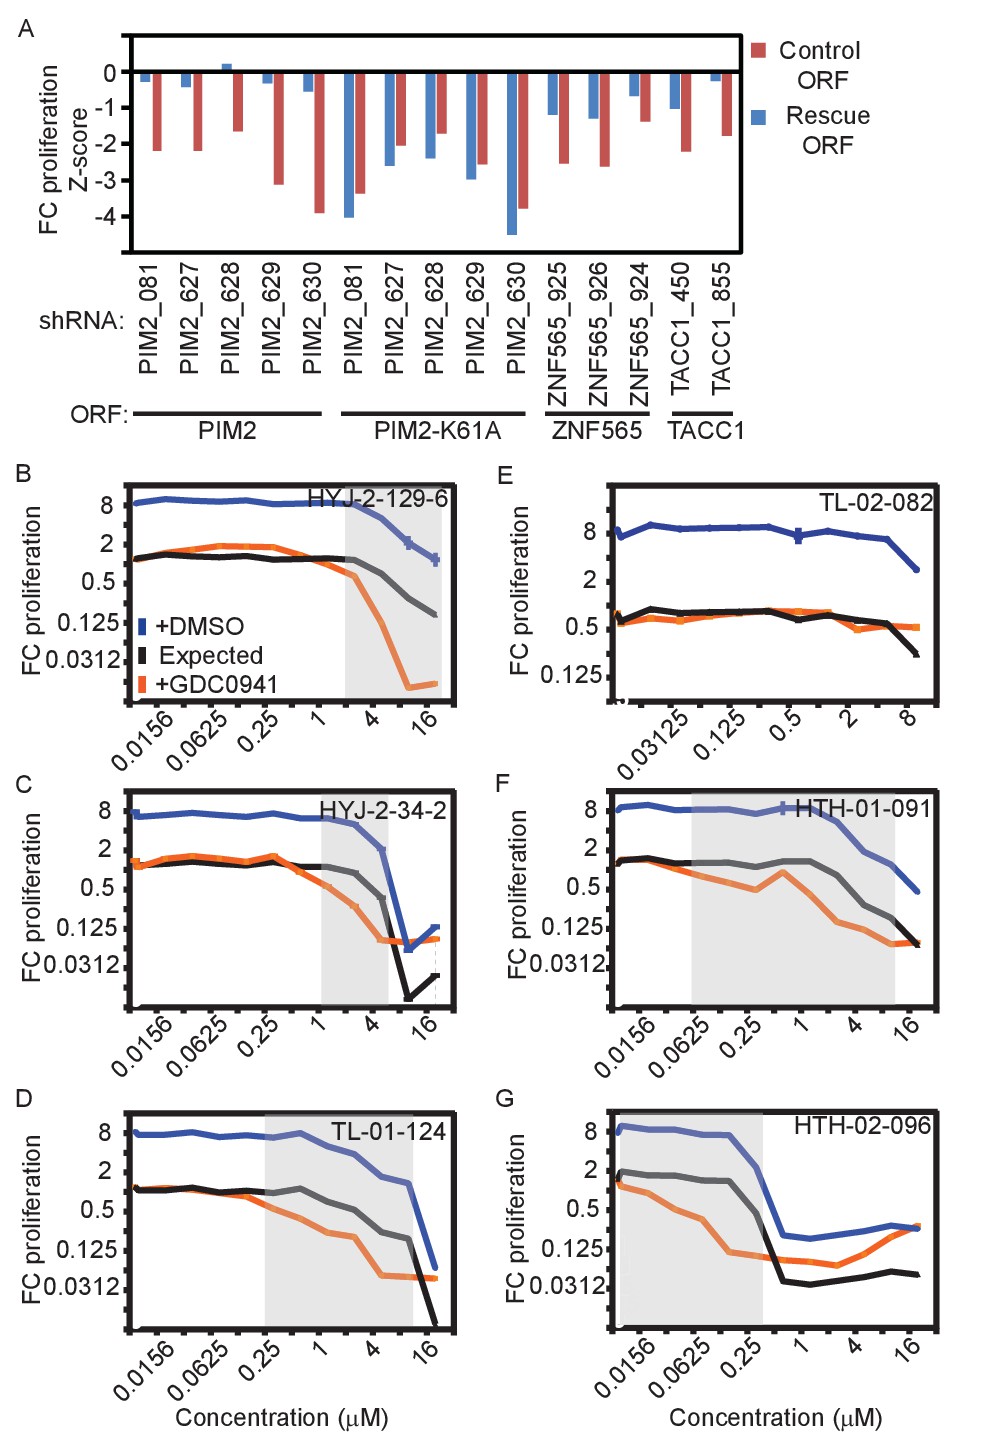
Validation of genes identified in the screen.
(A) MDA-MB-453 cells were infected with the indicated ORFs and shRNAs. Cells were then treated with GDC0941 (0.625 μM) for 9 days, followed by detection of V5-expressing cells by ICW. Cells infected with five different control shRNAs were used to calculate Z-scores. Data shown are representative of three independent experiments. (B–G) MDA-MB-453 cells were treated for 9 days with the indicated inhibitors (0.01–20 μM) combined with GDC0941 (0.625 μM; red), or vehicle (DMSO; blue). Plotted are mean and standard deviation of fold-change proliferation from quadruplicates. The expected fold-change of proliferation for treatment combination (black) was calculated according to the Bliss independence model using single treatment effects. The gray shading indicates compound concentrations for which significant synergy with GDC0941 was observed. Data shown are representative of two independent experiments.
Figure 2—figure supplement 1

Supporting information for ORF rescue validation.
(A) MDA-MB-453 cells were infected with the indicated ORFs and shRNAs. V5 expression was detected by ICW 5 days after shRNA infection. The average V5 stain value of 5 different control shRNAs (shCTRL) was used to normalize the stain of the targeting shRNAs. Data shown are representative of two independent experiments. (B) MDA-MB-453 cells were infected with the indicated ORF vectors. 5 days after infection, cell viability was determined by using DRAQ5 DNA stain. Bars indicate standard deviation from 4 replicates. (C) MDA-MB-453 cells were infected with the indicated ORF and shRNAs. Cells were then treated with GDC0941 (0.625 μM) for 9 days, followed by detection of V5-expressing cells by ICW. Cells infected with five different control shRNAs were used to calculate Z-scores. Data shown are representative of two independent experiments. (D) MDA-MB-453 cells were infected with the indicated ORFs (columns) and shRNAs (rows). Cells were then treated with GDC0941 (0.625 μM) for 9 days, followed by detection of V5-expressing cells by ICW. Cells infected with five different control shRNAs along with each of the ORFs were used to calculate Z-scores. Presented are Z-scores color-coded as indicated by the colorbar.
Figure 3 with 1 supplement
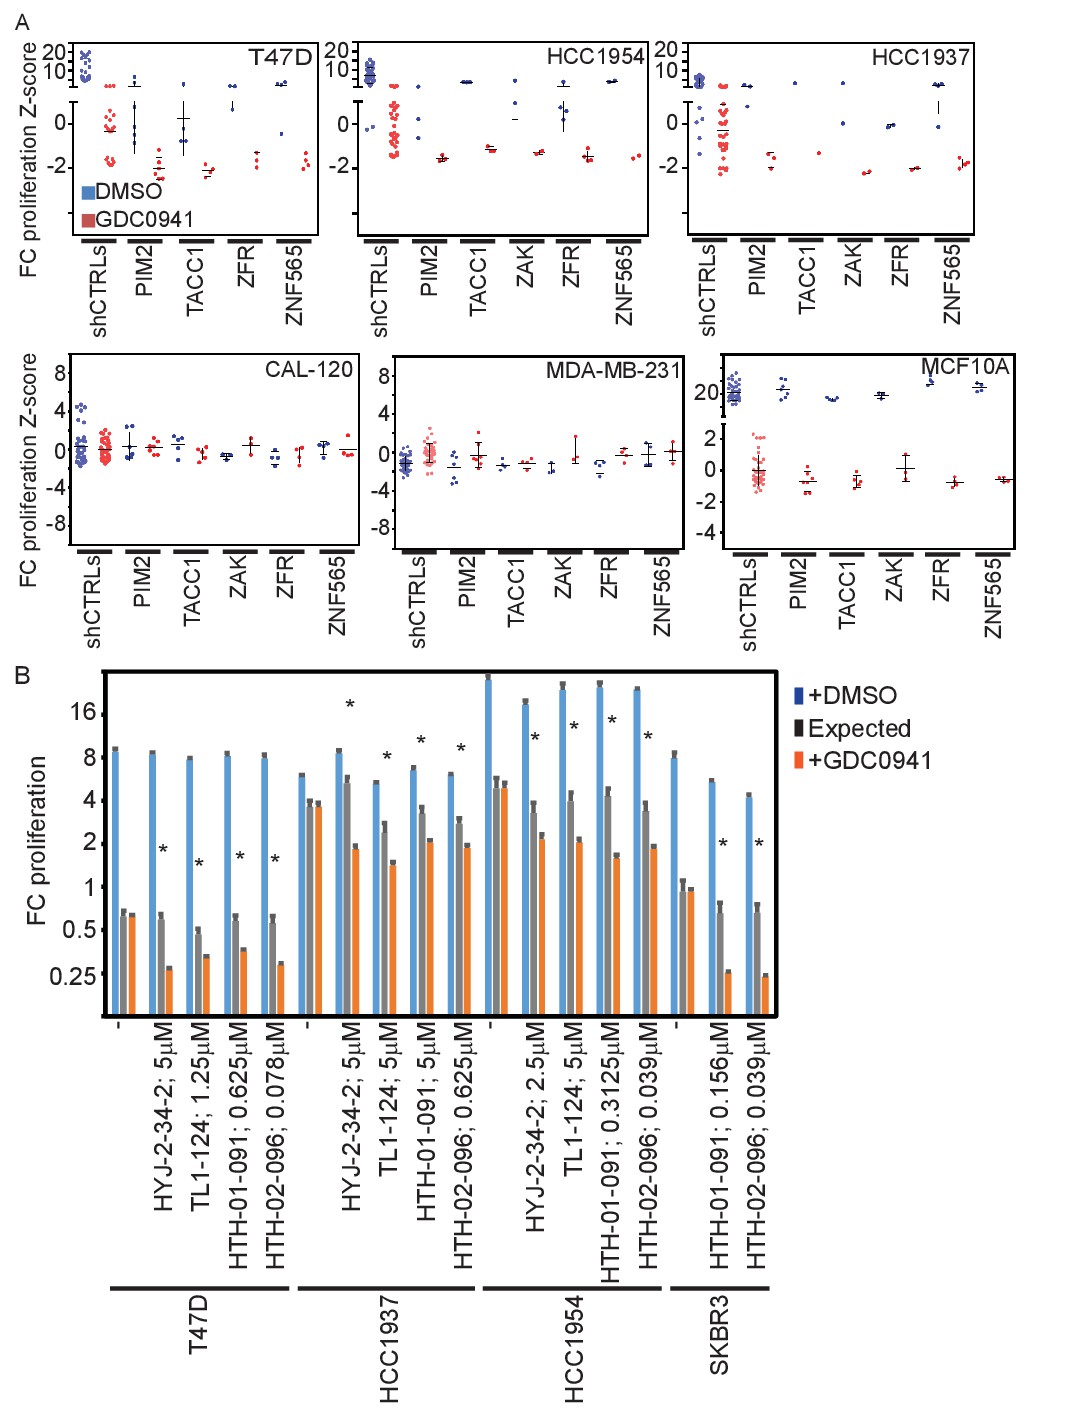
Effects of manipulating candidate gene expression in multiple cell lines.
(A) T47D-eGFP, HCC1954-eGFP, HCC1937-eGFP, CAL-120-eGPF, MDA-MB-231-eGPF, and MCF10A-eGPF were infected with shRNAs targeting the indicated genes. Cells were then treated with GDC0941 (0.5, 1.25, 1, 0.312, 0.312, and 0.156 μM, respectively) or vehicle (DMSO) for 9 days. Z-scores for the fold-change of proliferation were calculated based on control shRNAs. Bars indicate standard deviation between the different shRNAs targeting each gene. Data shown are representative of at least two independent experiments. (B) T47D-eGFP, HCC1954-eGFP, HCC1937-eGFP, and SKBR3-eGFP were treated for 9 days with the indicated inhibitors (0.01–10 μM) combined with GDC0941 (0.5, 1.25, 1, and 0.625 μM, respectively; red), or vehicle (DMSO; blue). Plotted are mean and standard deviation of fold-change of proliferation from 4 replicates. Expected effect of combination treatment (gray) was calculated as in Figure 2. Significant synergistic combinations according to Bliss independence model are indicated by asterisks.
Figure 3—figure supplement 1
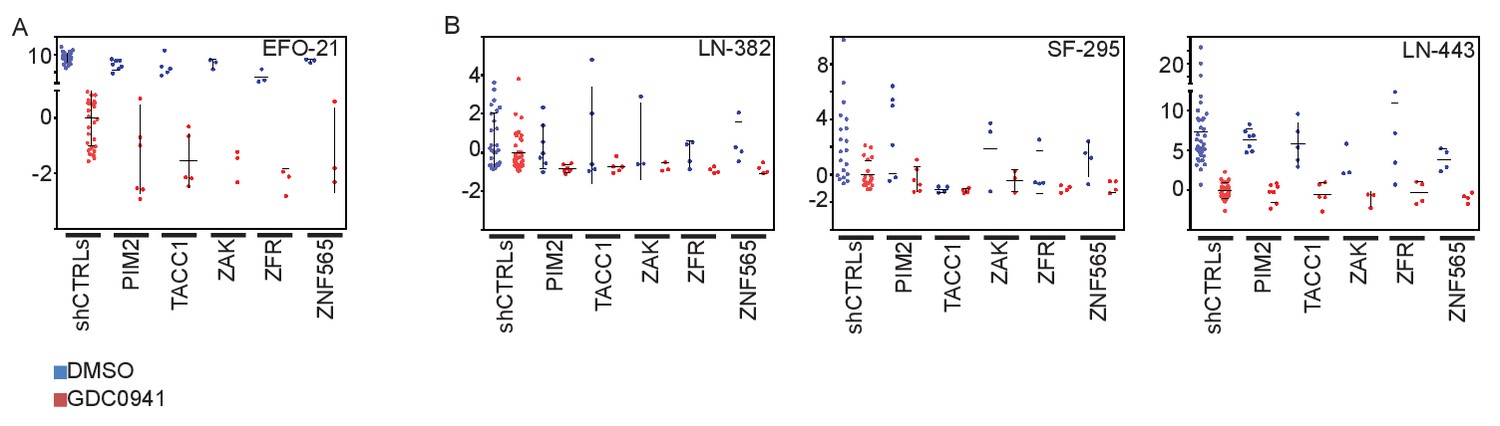
Effects of manipulating candidate genes in non-breast cancer cell lines.
(A-B) EFO-21-eGPF, LN443-eGFP, LN382-eGFP and SF295-eGFP were infected with shRNAs targeting the indicated genes. Cells were then treated with GDC0941 (0.625 μM) or vehicle (DMSO) for 9 days. Z-scores for the fold-change of proliferation were calculated based on control shRNAs. Bars indicate standard deviation between the different shRNAs targeting each gene.
Figure 4 with 1 supplement

PI3K pathway specificity of identified interactions.
(A) Z-scores for fold-change of proliferation of MDA-MB-453-eGFP cells infected with shRNAs targeting the indicated genes and treated for 9 days with GDC0941 (0.625 μM; red), MK2206 (0.5 μM; green), BIBW2992 (1 μM; yellow) or vehicle (DMSO; blue). Cells infected with five different control shRNAs were used to calculate Z-scores. Bars indicate standard deviation between the different shRNAs targeting each gene. Data shown are representative of two independent experiments. (B) Z-scores for fold-change of proliferation of MDA-MB-453-eGFP cells infected with shRNAs targeting the indicated genes and treated for 9 days with GDC0941 (0.625 μM; red), BYL-719 (1 μM; green), GSK2636771 (2.5 μM; brown), GDC0032 (50 nM; purple) or vehicle (DMSO; blue). Cells infected with five different control shRNAs were used to calculate Z-scores. Bars indicate standard deviation between the different shRNAs targeting each gene. Data shown are representative of three independent experiments. (C) Z-scores for fold-change of proliferation of T47D-eGFP cells infected with shRNAs targeting the indicated genes and treated for 9 days with GDC0941 (0.5 μM; red), Palbociclib (0.3 μM; green), Fulvestrant (0.1 μM; yellow) or vehicle (DMSO; blue). Cells infected with five different control shRNAs were used to calculate Z-scores. Bars indicate standard deviation between the different shRNAs targeting each gene. Data shown are representative of three independent experiments.
Figure 4—figure supplement 1
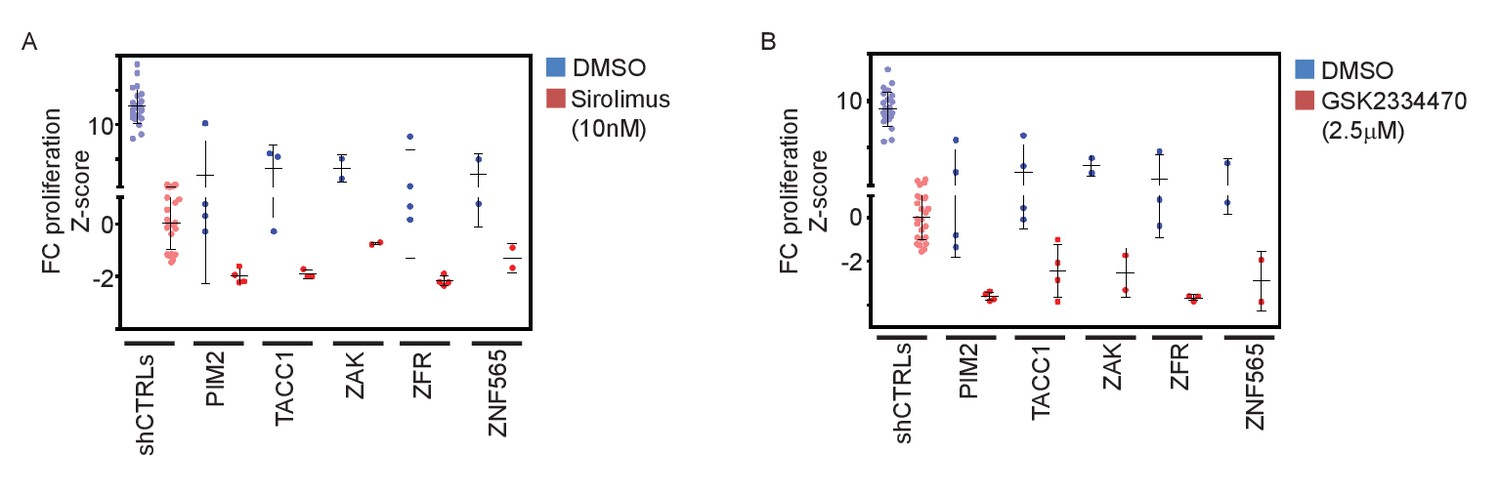
Validation of pathway specificity with additional PI3K-pathway inhibitors.
(A–B) Z-scores for fold-change of proliferation of MDA-MB-453-eGFP cells infected with shRNAs targeting the indicated genes and treated for 9 days with Sirolimus (10 nM; red)(A), GSK2334470 (2.5 μM; red)(B), or vehicle (DMSO; blue). Cells infected with five different control shRNAs were used to calculate Z-scores. Bars indicate standard deviation between the different shRNAs targeting each gene. Data shown are representative of two independent experiments.
Figure 5 with 1 supplement
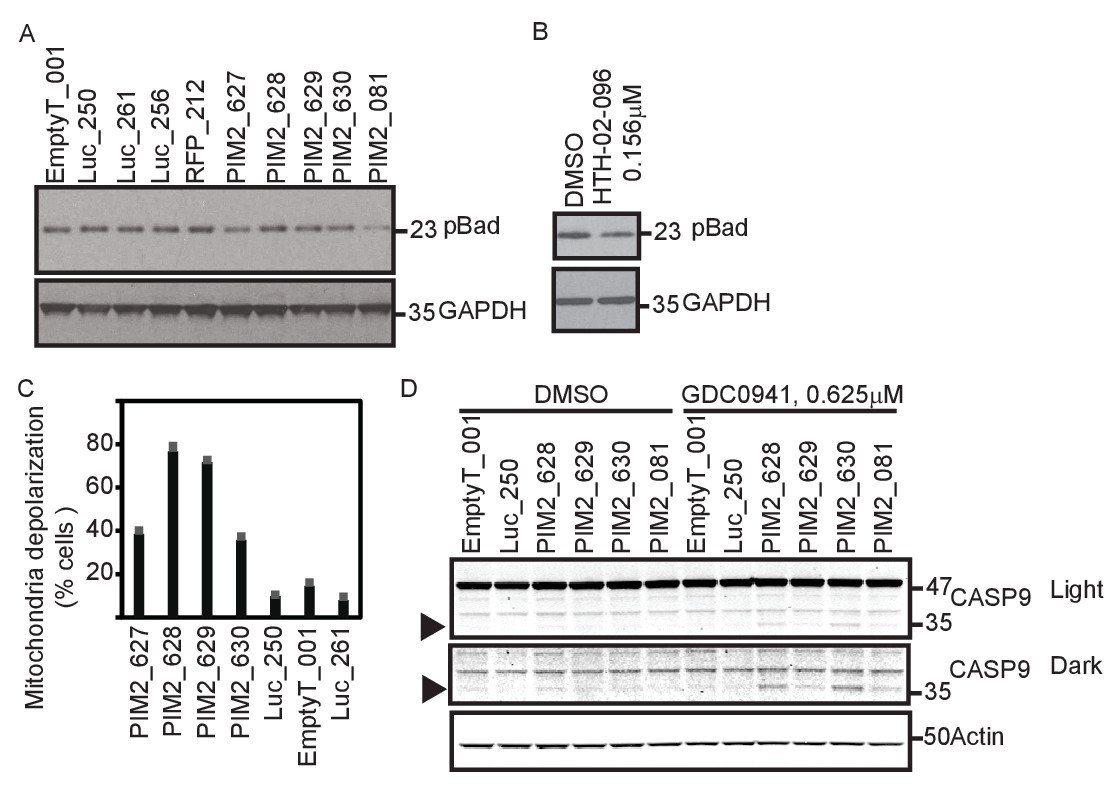
PIM2 suppression increases mitochondrial priming.
(A) MDA-MB-453 cells were infected with the indicated shRNAs. Five days after infection, cells were collected and phosphorylation of Bad was detected by Western blotting. (B) MDA-MB-453 cells were treated with PIM2 inhibitor HTH-02–096 for 24 hr, and Bad phosphorylation was detected as in A. (C) MDA-MB-453 cells were infected with the indicated shRNAs. Five days after infection, cells were collected and subjected to BH3 profiling. The percentage of cells exhibiting mitochondrial depolarization at 0.4 μM BIM peptide is plotted. Bars indicate standard deviation of 3 replicates. Data shown are representative of three independent experiments. (D) MDA-MB-453 cells were infected with the indicated shRNAs, and then treated for 30 hr with GDC0941 (0.625 μM) or left untreated. Adherent and floating cells were collected and subjected to immunoblot analysis for caspase 9. Triangle marks the product of cleaved caspase 9.
Figure 5—figure supplement 1
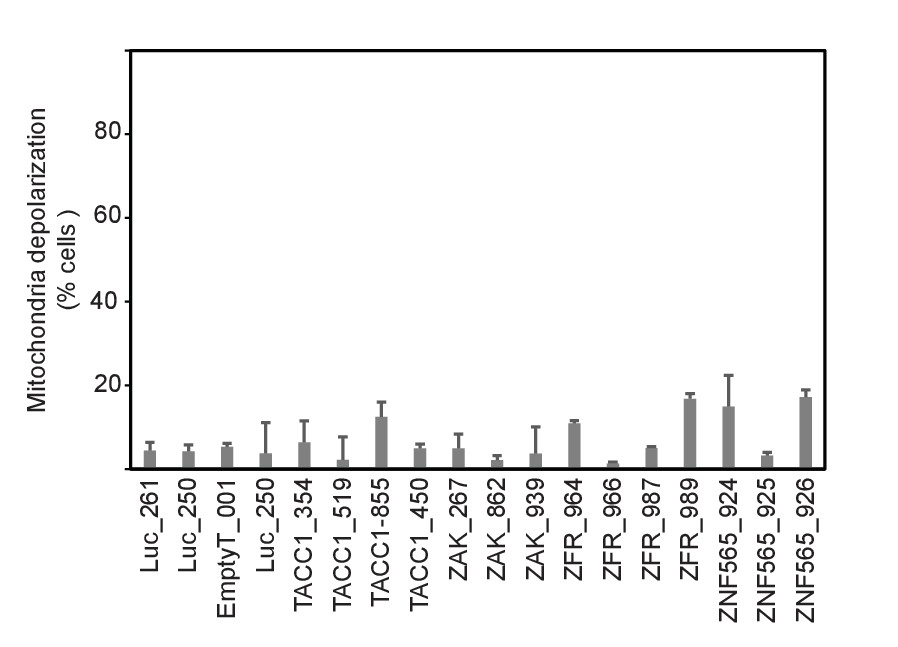
MDA-MB-453 cells were infected with the indicated shRNAs.
Five days after infection, cells were collected and subjected to BH3 profiling. Percent cells exhibiting mitochondrial depolarization at 0.8 μM BIM peptide is plotted. Bars indicate standard deviation from 3 replicates. Data shown are representative of two independent experiments.
Figure 6 with 1 supplement
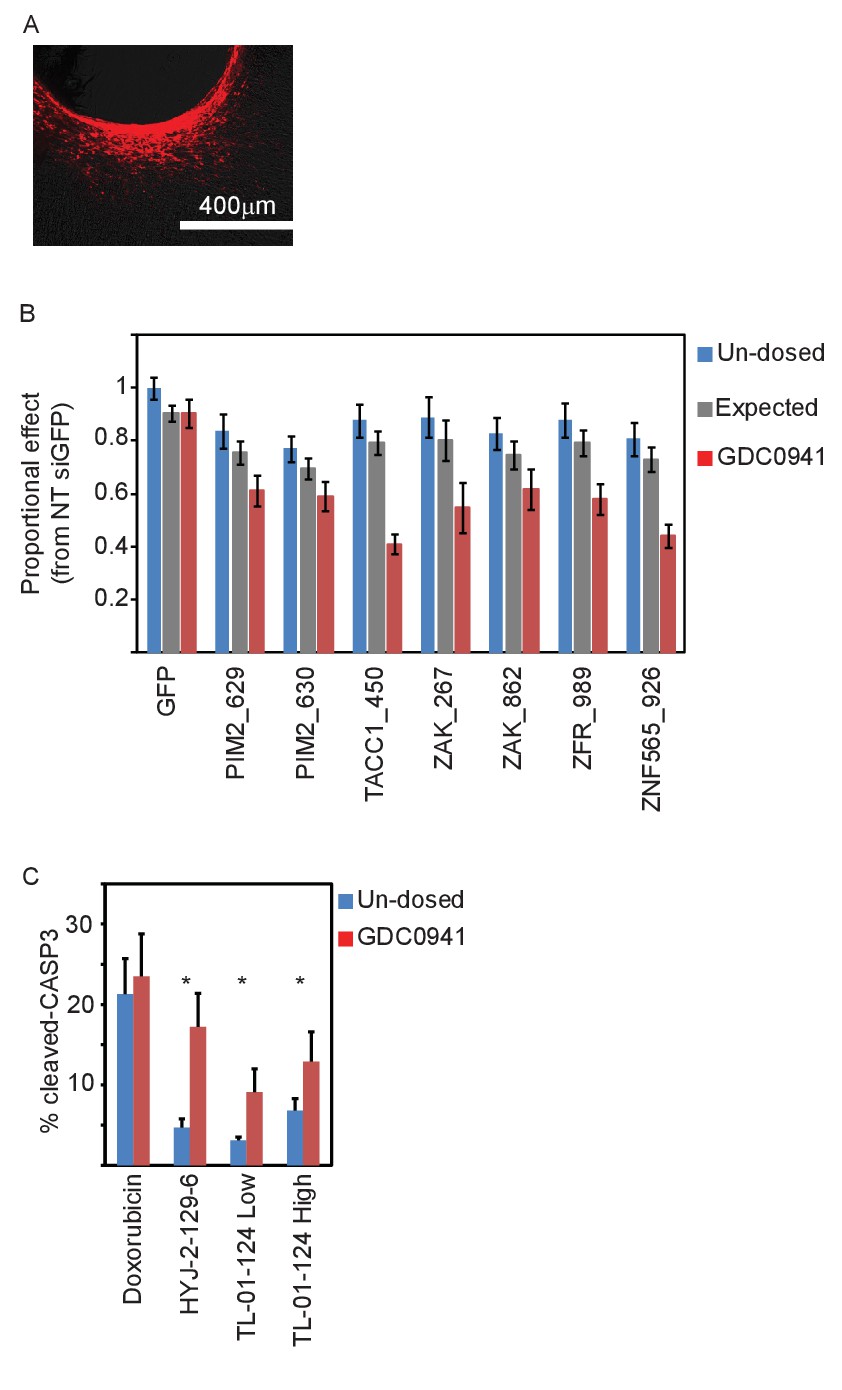
In vivo validation of the five identified genes.
(A) A representative image showing siRNA (red) spreading in tumor tissue. (B) Devices loaded with the indicated siRNAs were implanted into MDA-MB-453 xenografts of un-dosed mice (blue) or mice that were pre-dosed with GDC0941 (75 mg/kg) for 5 days (red). Two days later, the devices were removed, xenograft tissue surrounding each reservoir was stained for Hematoxylin and Eosin, and the density of intact nuclei was quantified. Plotted are the proportional effects of the indicated siRNAs with or without PI3K inhibition as compared to the effect of siGFP in non-treated mice. Bars indicate SD from at least 4 replicates. The expected proportional effect for treatment combination (grey) was calculated according to the Bliss independence model using single treatment effects. (C) Devices were loaded with the indicated small molecules and were implanted into MDA-MB-453 xenografts of un-dosed mice (blue) or mice that were pre-dosed with GDC0941 (75 mg/kg) for 5 days (red). 24 hr later, the devices were removed, xenograft tissue surrounding each reservoir was stained for hematoxylin and eosin and for cleaved-CASP3. Percentage of cells stained positive for cleaved caspase 3 was quantified. Mean and SD of at least 6 replicates is shown, asterisks indicate T-test p-value<0.05.
Figure 6—figure supplement 1
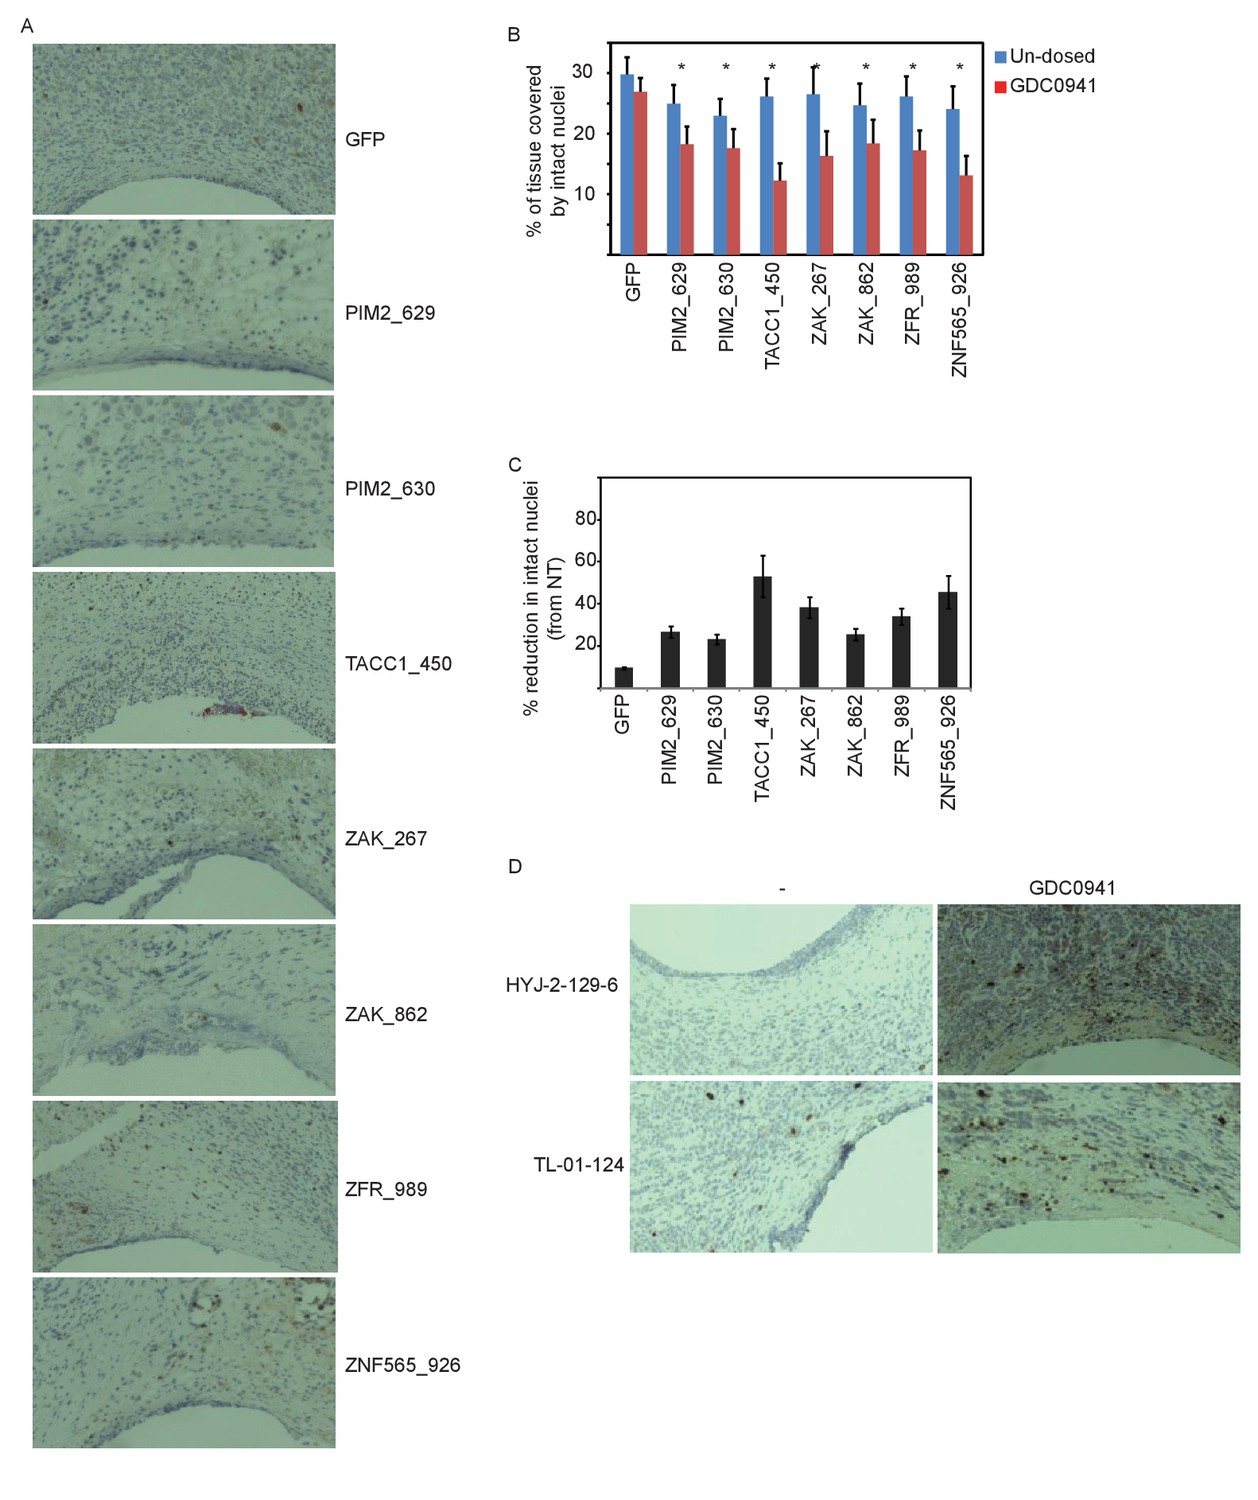
Supporting information for in vivo validation.
(A) Representative images of tumor tissue surrounding the microscale device loaded with the indicated siRNAs and implemented into xenografts of GDC0941-pre-dosed mice. Tissue stained with hematoxylin and eosin. (B–C) Devices loaded with the indicated siRNAs were implanted into MDA-MB-453 xenografts of un-dosed mice (blue) or mice that were pre-dosed with GDC0941 (75 mg/kg) for 5 days (red). Two days later, the devices were removed, xenograft tissue surrounding each reservoir was stained for Hematoxylin and Eosin. Density quantification of intact nuclei (B) and % reduction in intact nuclei upon PI3K inhibition (C) are presented. Shown is the mean and SD of at least 4 replicates, asterisks indicate T-test p-value<0.05. (D) Representative images of tumor tissue surrounding the microscale device loaded with the indicated small molecules, and implanted into xenografts of GDC0941-pre-dosed mice. Tissue was stained with anti-cleaved-CASP3 antibody.
Author response image 1
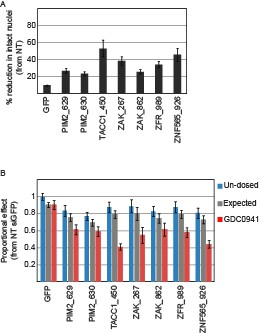
Devices loaded with the indicated siRNAs were implanted into MDA-MB-453 xenografts of un-dosed mice or mice that were pre-dosed with GDC0941 (75mg/kg) for 5 days.
Two days later, the devices were removed, xenograft tissue surrounding each reservoir was stained for Hematoxylin and Eosin., and density of intact nuclei was quantified.% reduction in intact nuclei upon PI3K inhibition is presented. Shown is the mean and SD of at least 4 replicates. B. Proportional effects of the indicated siRNAs with (red) or without (blue) PI3K inhibition as compared to the effect of siGFP in non-treated mice. Bars indicate SD from at least 4 replicates. The expected proportional effect for treatment combination (grey) was calculated according to the Bliss independence model using single treatment effects.
Author response image 2
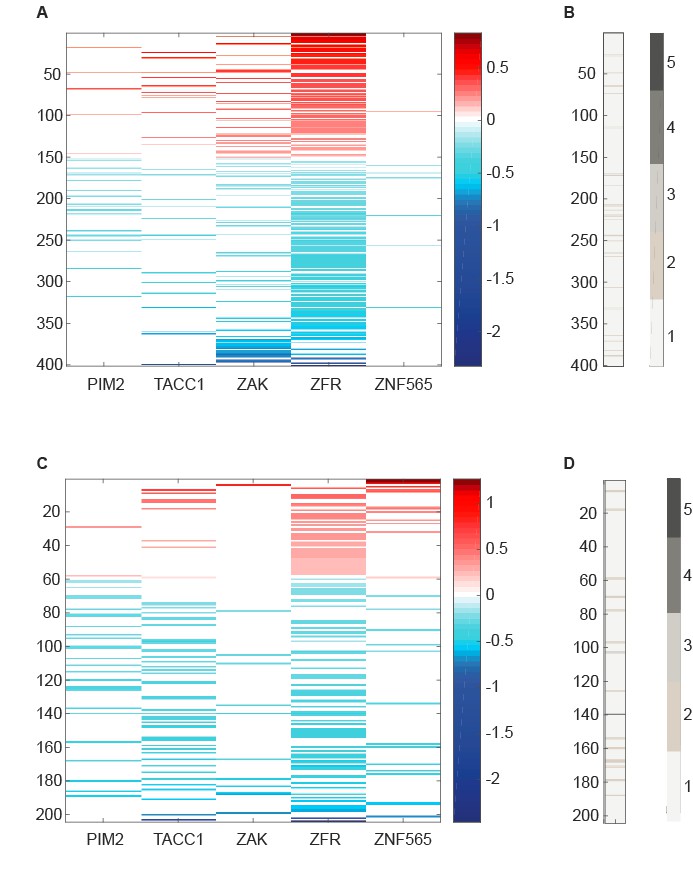
RNA-seq data analyzed to identify differentially expressed genes upon suppression of candidate genes.
(A,C) Centered log2 fold change over control shRNAs of genes that exhibit significant differential expression (Adjusted p value<0.05 according to DESeq2) upon suppression of the indicated candidate gene. B,D. Number of candidate genes whose suppression induces a significant differential expression of the genes plotted in A and C, respectively.
Author response image 3
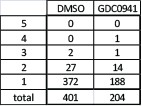
Total number of genes that are significantly differentially expressed upon suppression of any of the five candidate genes under control or PI3K inhibition conditions.
Number of genes that are affected by more than one candidate gene are detailed.
Author response image 4
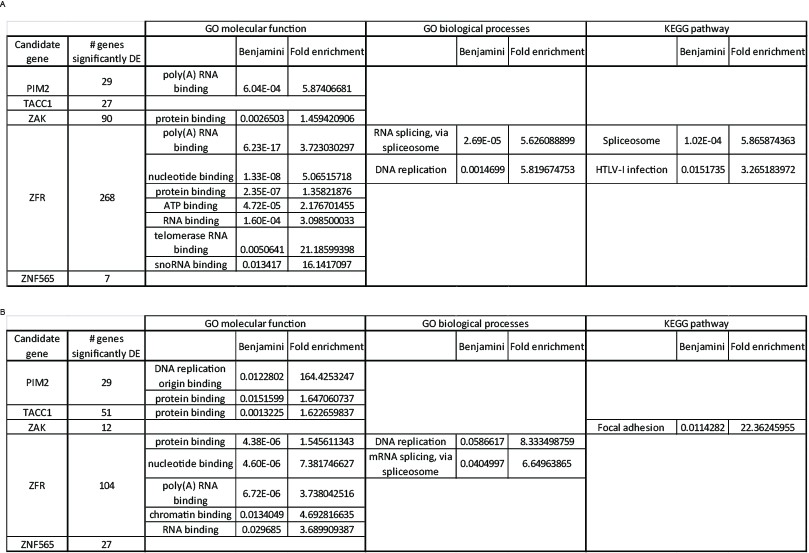
Functional annotation analysis of significantly differentially expressed genes.
We listed the genes significantly affected by each of the candidate genes, under either control (A) or PI3K inhibition (B) condition, and queried these lists to identify enriched functions or pathways using DAVID. A Benjamini-Hochberg value of 0.05 was used as a threshold for enrichment.
Additional files
-
Supplementary file 1
Genes ranked as significant by either STARS or RIGER.
- https://doi.org/10.7554/eLife.24523.015
-
Supplementary file 2
Details for shRNAs used for the five identified genes.
- https://doi.org/10.7554/eLife.24523.016
-
Supplementary file 3
Structure, kinase selectivity and potency information of small molecule inhibitors targeting PIM2 or ZAK.
- https://doi.org/10.7554/eLife.24523.017
Download links
A two-part list of links to download the article, or parts of the article, in various formats.
Downloads (link to download the article as PDF)
Open citations (links to open the citations from this article in various online reference manager services)
Cite this article (links to download the citations from this article in formats compatible with various reference manager tools)
Synergistic interactions with PI3K inhibition that induce apoptosis
eLife 6:e24523.
https://doi.org/10.7554/eLife.24523


