Contributions of local speech encoding and functional connectivity to audio-visual speech perception
- Institut de Neurosciences de la Timone UMR 7289, Aix Marseille Université – Centre National de la Recherche Scientifique, France
- University of Glasgow, United Kingdom
- Istituto Italiano di Tecnologia, Italy
Figures
Figure 1
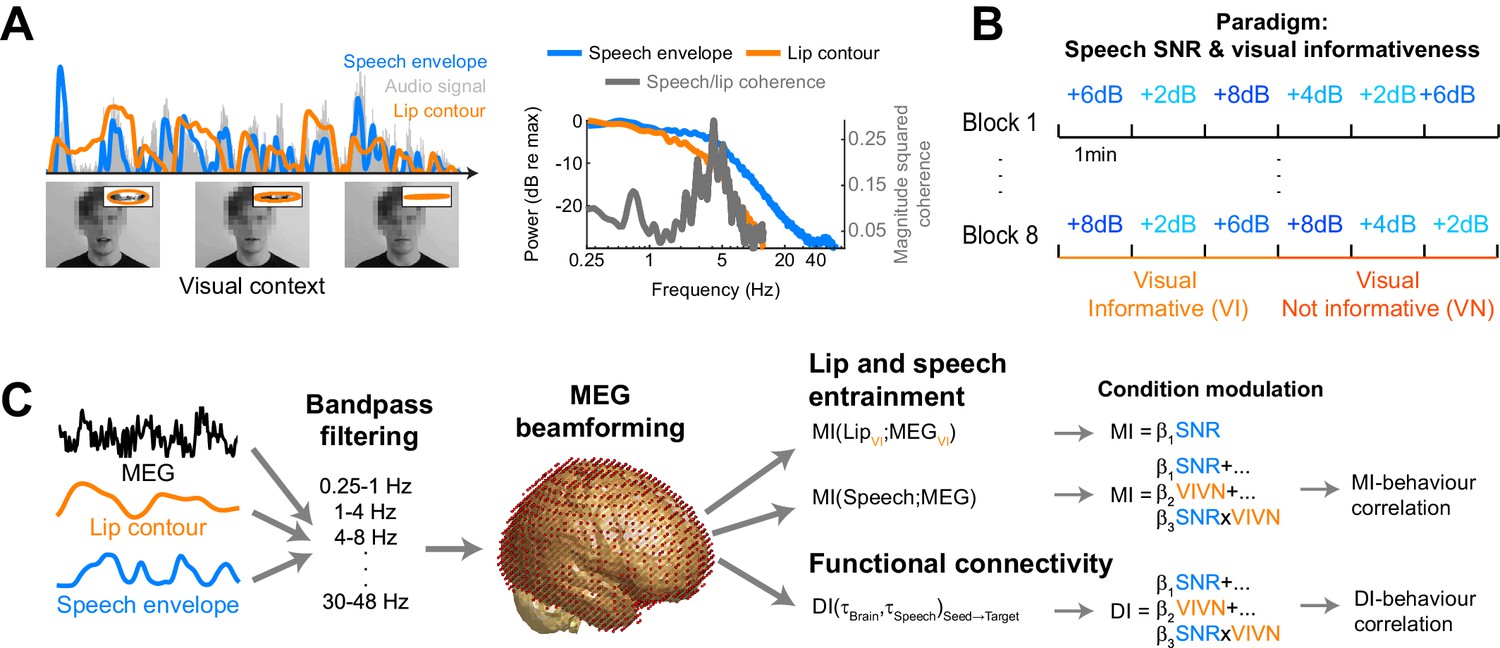
Experimental paradigm and analysis.
(A) Stimuli consisted of 8 continuous 6 min long audio-visual speech samples. For each condition we extracted the acoustic speech envelope as well as the temporal trajectory of the lip contour (video frames, top right: magnification of lip opening and contour). (B) The experimental design comprised eight conditions, defined by the factorial combination of 4 levels of speech to background signal to noise ratio (SNR = 2, 4, 6, and 8 dB) and two levels of visual informativeness (VI: Visual context Informative: video showing the narrator in synch with speech; VN: Visual context Not informative: video showing the narrator producing babble speech). Experimental conditions lasted 1 (SNR) or 3 (VIVN) minutes, and were presented in pseudo-randomized order. (C) Analyses were carried out on band-pass filtered speech envelope and MEG signals. The MEG data were source-projected onto a grey-matter grid. One analysis quantified speech entrainment, i.e. the mutual information (MI) between the MEG data and the acoustic speech envelope (speech MI), as well as between the MEG and the lip contour (lip MI), and the extent to which these were modulated by the experimental conditions. A second analysis quantified directed functional connectivity (DI) between seeds and the extent to which this was modulated by the experimental conditions. A final analysis assessed the correlation of either MI or DI with word-recognition performance. Relevant variables in deposited data (doi:10.5061/dryad.j4567): SE_speech; LE_lip.
Figure 2
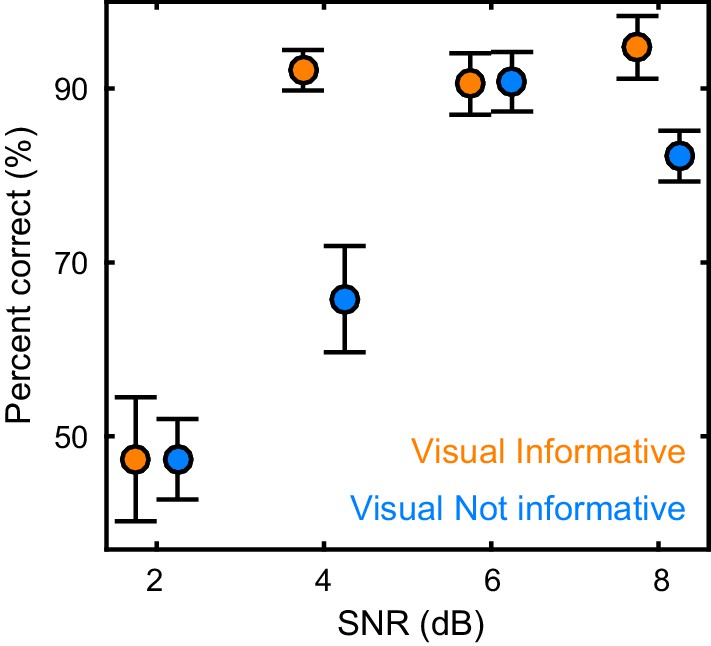
Behavioral performance.
Word recognition performance for each of the experimental conditions (mean ± SEM across participants n = 19). Deposited data: BEHAV_perf.
Figure 3 with 3 supplements

Modulation of speech-to-brain entrainment by acoustic SNR and visual informativeness.
Changes in speech MI with the experimental factors were quantified using a GLM for the condition-specific speech MI based on the effects of SNR (A), visual informativeness VIVN (B), and their interaction (SNRxVIVN) (C). The figures display the cortical-surface projection onto the Freesurfer template (proximity = 10 mm) of the group-level significant statistics for each GLM effect (FWE = 0.05). Graphs show the average speech MI values for each condition (mean ± SEM), for local and global (red asterisk) of the T maps. Lines indicate the across-participant average regression model and numbers indicate the group-average standardized regression coefficient for SNR in the VI and VN conditions (>/ < 0.0 = positive/negative, rounded to 0). (D) T maps illustrating the opposite SNR effects within voxels with significant SNRxVIVN effects. MI graphs for the peaks of these maps are shown in (C) (IFGor-R and SFG-R = global T peaks for SNR effects in VI and VN, respectively). (E) Location of global and local seeds of GLM T maps, used for the analysis of directed connectivity. See also Tables 1 and 2 and Figure 3—figure supplements 1–2. Deposited data: SE_meg; SE_speech; SE_miS.
Figure 3—figure supplement 1
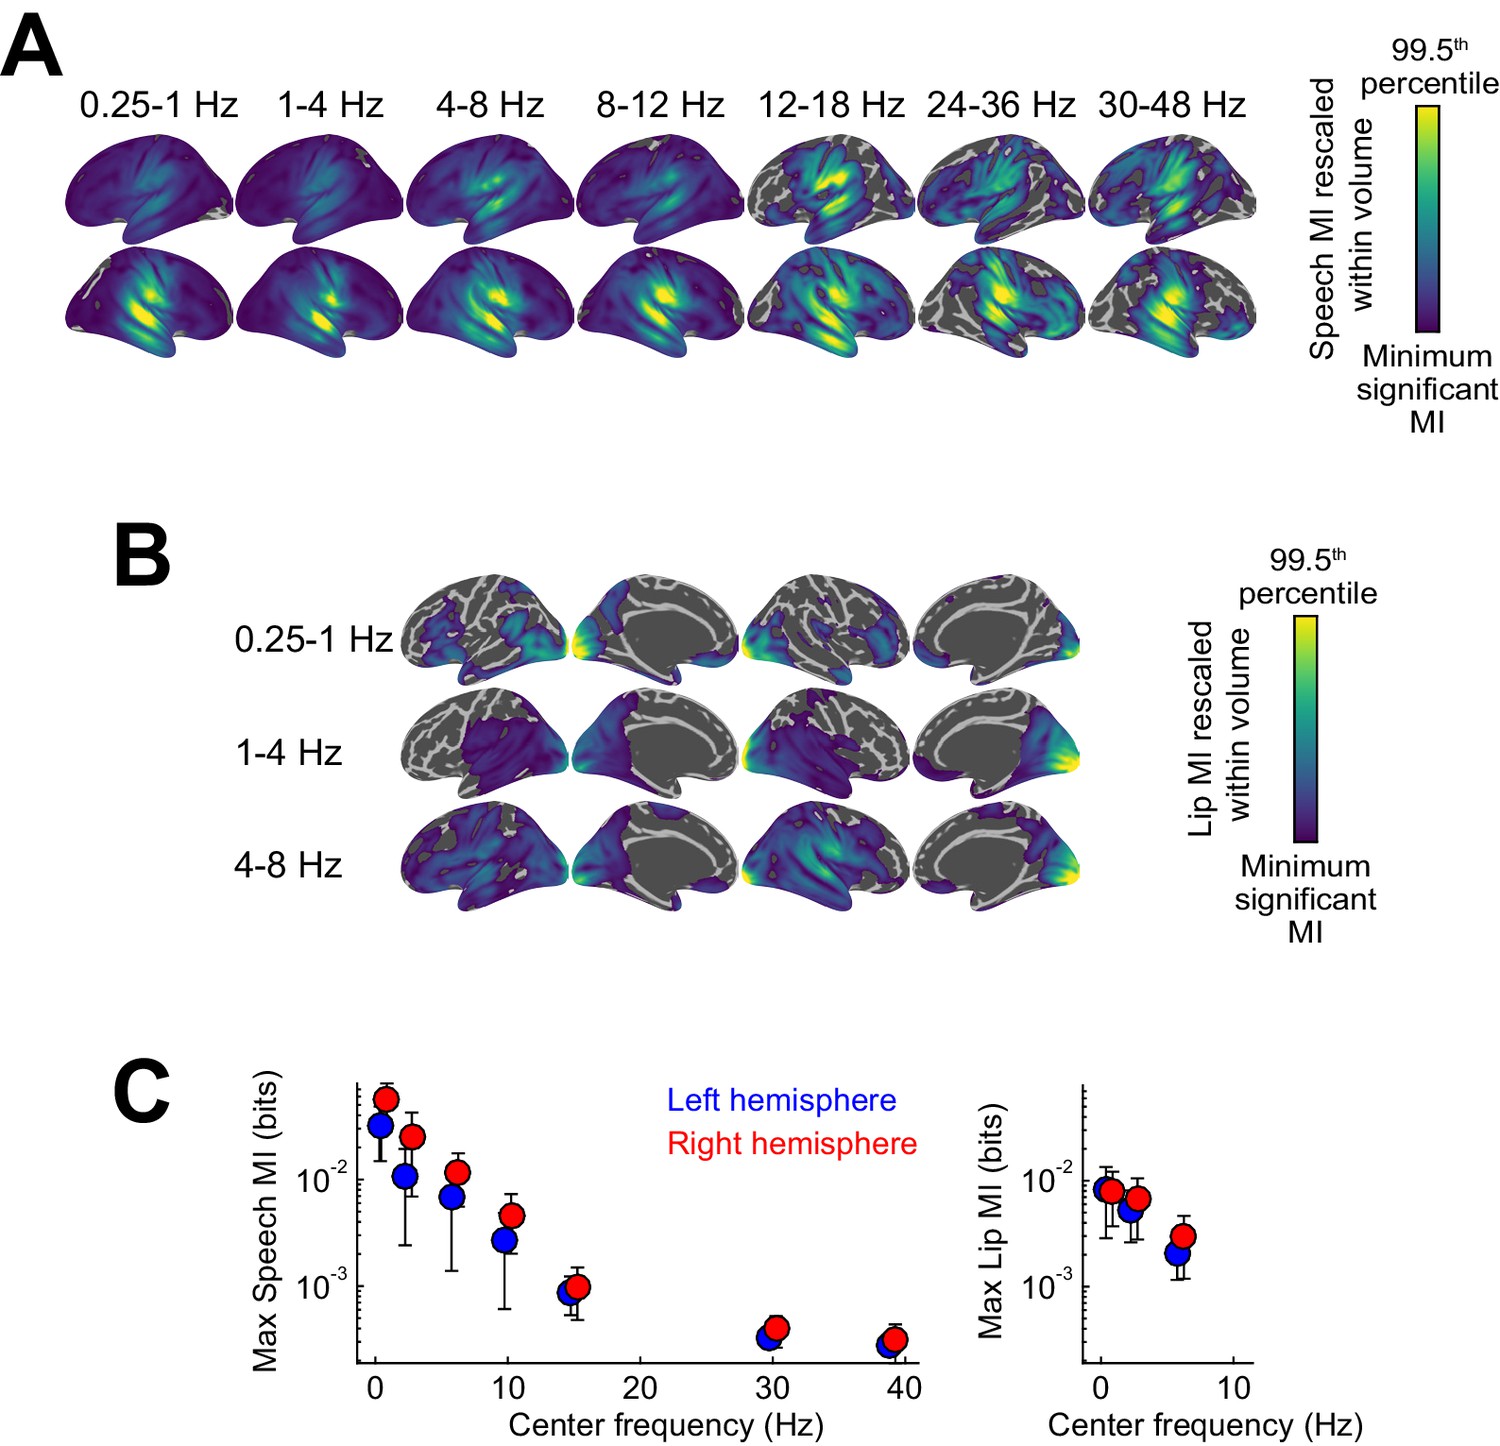
Entrainment of rhythmic MEG activity to the speech envelope and lip movements.
(A) Projection of significant speech MI maps, which quantify the entrainment of MEG source activity to the speech envelope, onto the Freesurfer template (FWE = 0.05; proximity = 10 mm; surface-projected significant MI maps rescaled within volume from minimum significant MI to the 99.5th percentile of the surface projection). (B) Projection of significant lip MI maps. (C) Peak speech / lip MI values in the two hemispheres as a function of frequency (mean ± SEM). Deposited data: SE_meg; SE_speech; SE_miS; LE_meg; LE_lip; LE_miL.
Figure 3—figure supplement 2
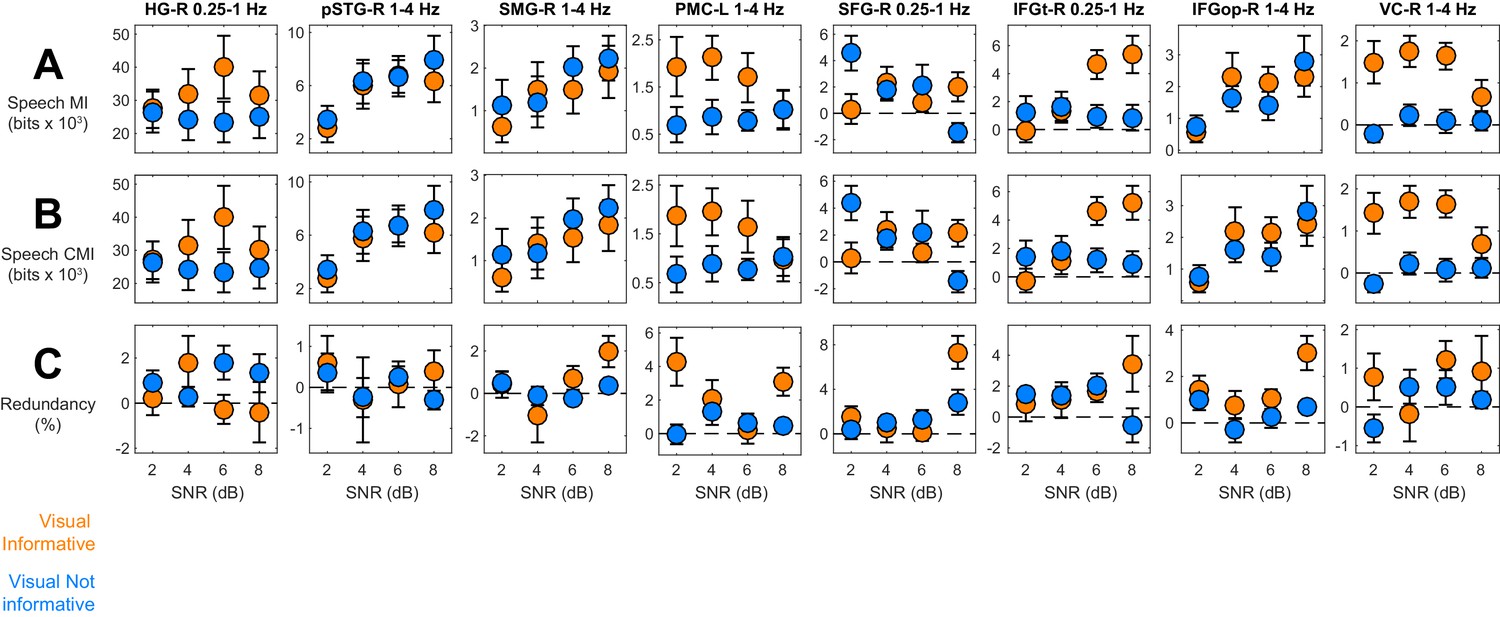
Information theoretic decomposition of speech entrainment.
The figure shows condition-specific information terms for the relevant ROIs / bands (c.f. Figure 3E). (A) Speech MI. (B) Conditional mutual information, CMI(MEG;Speech), factoring out common influences between speech and lip signals. (C) Information theoretic redundancy between speech and lip MI. error-bars = ± SEM. See also Table 2. Deposited data: ID_meg; ID_speech; ID_lip; ID_infoterms.
Figure 3—figure supplement 3
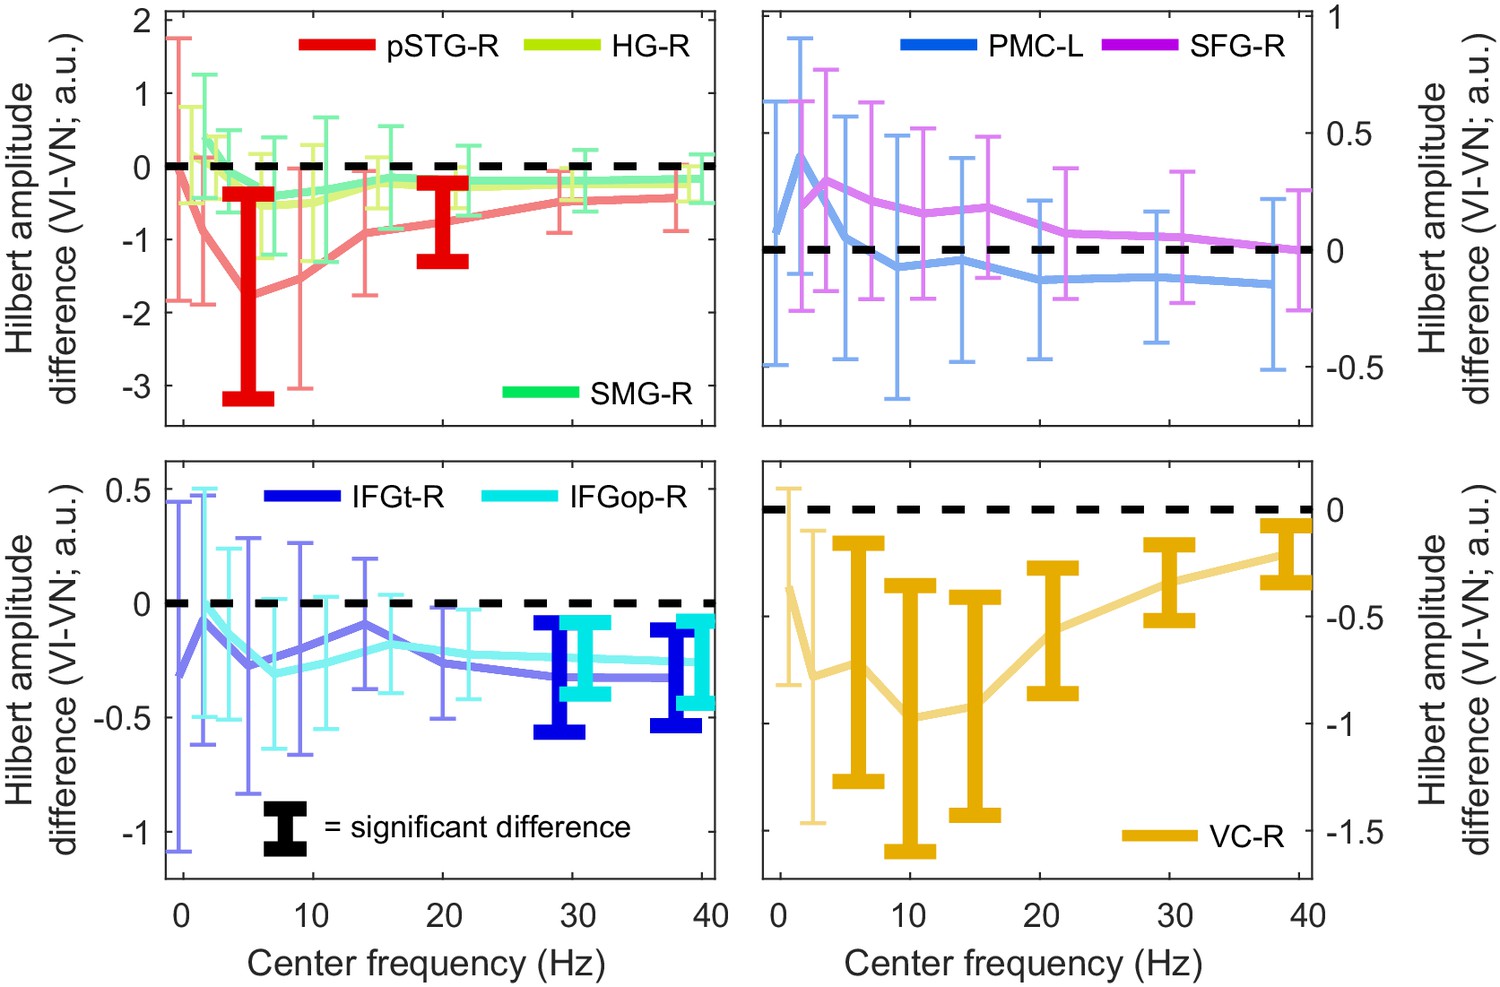
Condition-changes in the amplitude of oscillatory activity.
Difference in the time-averaged Hilbert amplitude of the MEG signal between the VI and VN conditions for each ROI, as a function of frequency. Error bars bracket the 99% parametric confidence interval for the participant averaged difference. Thick bars highlight significant differences (FWE = 0.05 across ROIs and frequencies). a.u. = arbitrary units. Deposited data: SE_meg; AMP_amp.
Figure 4 with 1 supplement
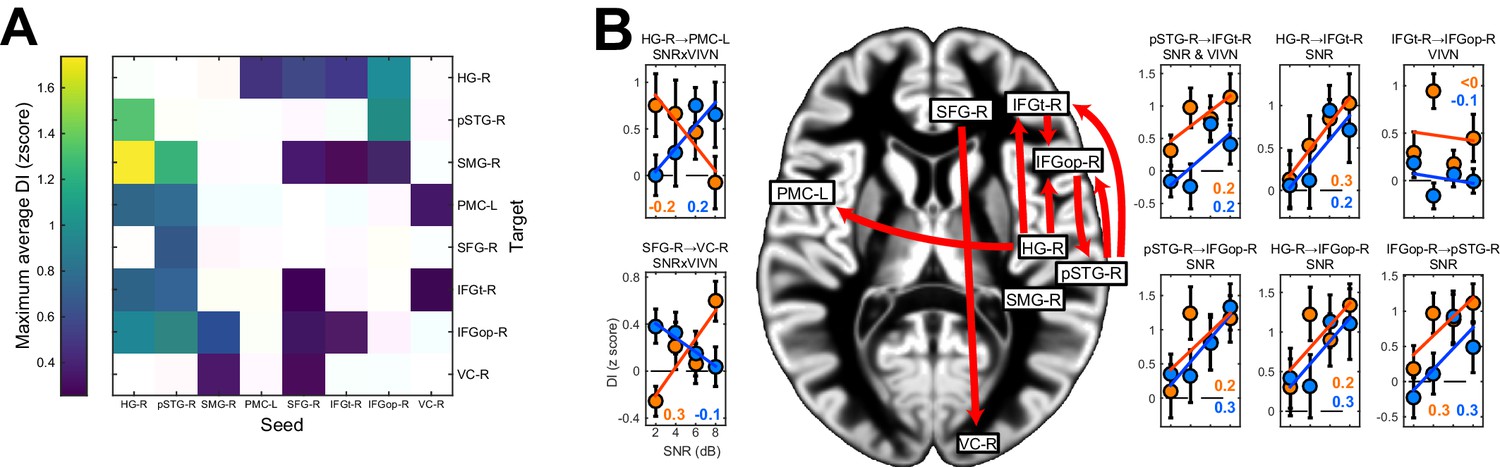
Directed causal connectivity within the speech-entrained network.
Directed connectivity between seeds of interest (c.f. Figure 3E) was quantified using Directed Information (DI). (A) Maximum significant condition-average DI across lags (FWE = 0.05 across lags; white = no significant DI). (B) Significant condition effects (GLM for SNR, VIVN or their interaction) on DI (FWE = 0.05 across speech/brain lags and seed/target pairs). Bar graphs display condition-specific DI values for each significant GLM effect along with the across-participants average regression model (lines). Numbers indicate the group-average standardized betas for SNR in the VI and VN conditions, averaged across lags associated with a significant GLM effect (>/ < 0.0 = positive/negative, rounded to 0). Error-bars = ± SEM. See also Table 3 and Figure 4—figure supplement 1. Deposited data: DI_meg; DI_speech; DI_di; DI_brainlag; DI_speechlag.
Figure 4—figure supplement 1
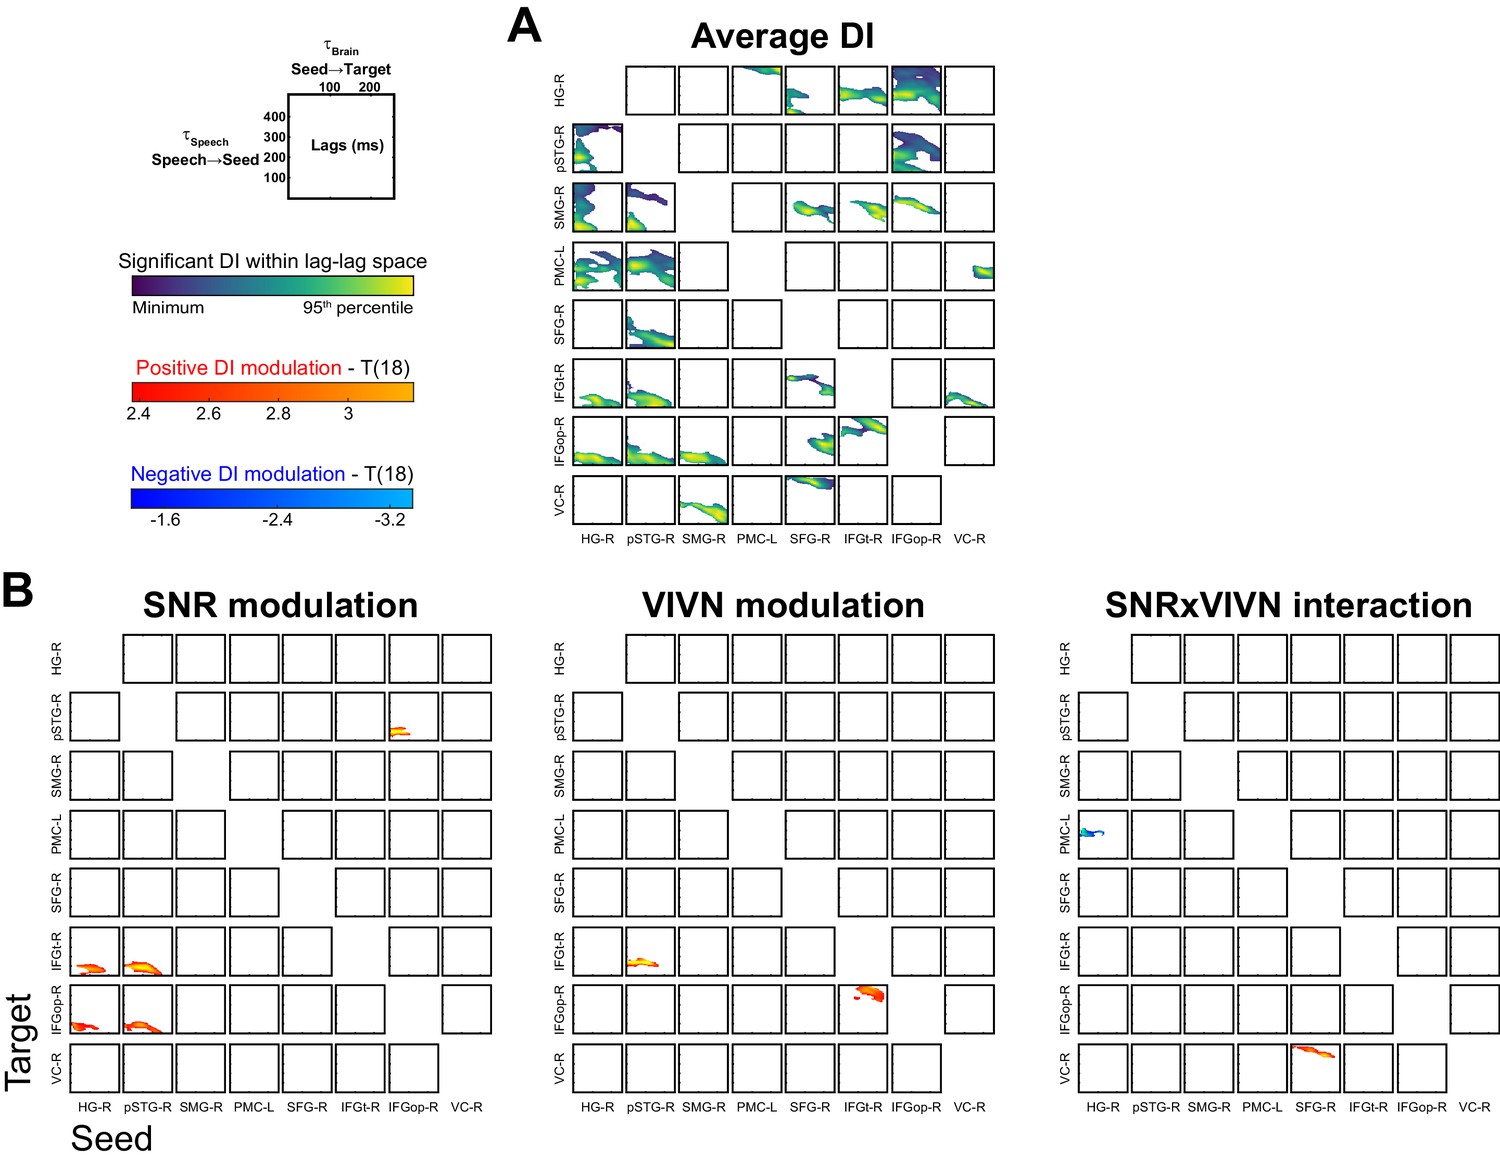
Directed functional connectivity within the speech-entrained network.
(A) Significant condition-averaged directed information (DI) values between all seed-target pairs as a function of the speech (τSpeech) and brain lags (τBrain). (B) Group-level statistical maps for the GLM effects on DI of acoustic signal quality (SNR), visual informativeness (VIVN) and their interaction. Deposited data: DI_meg; DI_speech; DI_di; DI_brainlag; DI_speechlag.
Figure 5
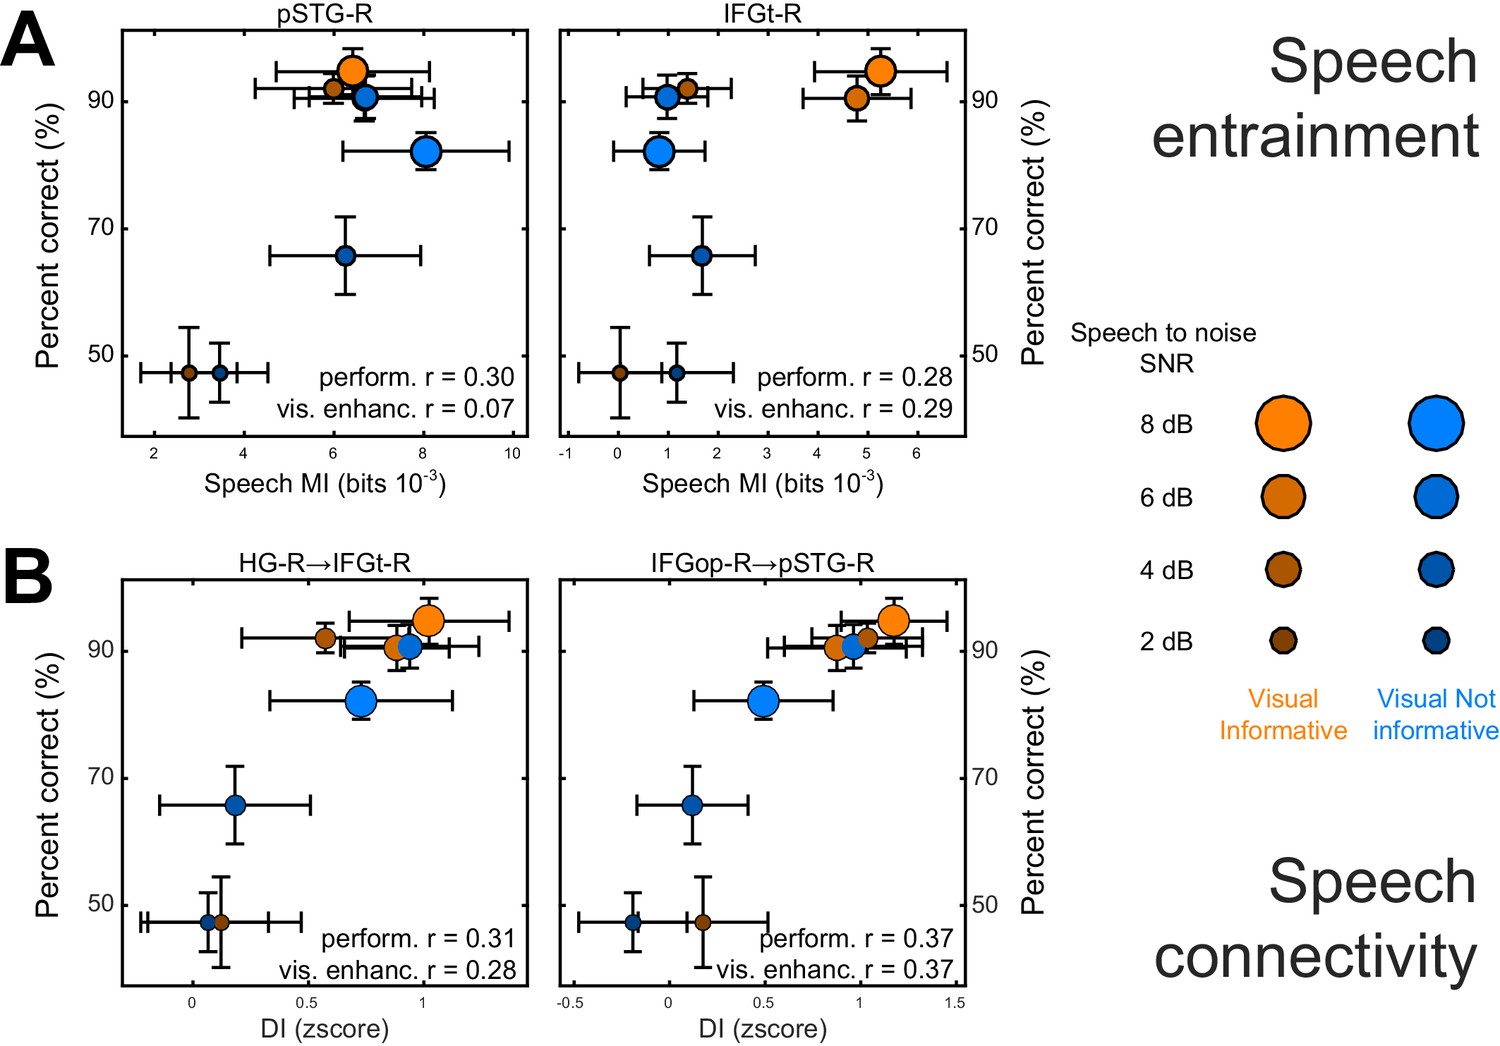
Neuro-behavioral correlations.
(A) Correlations between behavioral performance and condition-specific speech MI (perform. (r), and correlations between the visual enhancement of performance and the visual enhancement in MI (vis. enhanc. (r). (B) Same for DI. Only those ROIs or connections exhibiting significant correlations are shown. error-bars = ± SEM. See also Tables 2–3. Deposited data: BEHAV_perf; SE_meg; DI_meg; SE_miS; DI_di; NBC_miS; NBC_di.
Tables
Table 1
Condition effects on speech MI. The table lists global and local peaks in the GLM T-maps. Anatomical labels and Brodmann areas are based on the AAL and Talairach atlases. β = standardized regression coefficient; SEM = standard error of the participant average. ROI-contralat. = T test for a significant difference of GLM betas between the respective ROI and its contralateral grid voxel.
| Anatomical label | Brodmann area | MNI coordinates | GLM effect | Frequency Band | T(18) | β(SEM) | T(18) ROI-contralat. | ||
|---|---|---|---|---|---|---|---|---|---|
| HG-R | 42 | 63 | −21 | 11 | VIVN | 0.25–1 Hz | 4.75* | 0.39 (0.06) | 2.00 |
| pSTG-R | 22 | 48 | −30 | 8 | SNR | 1–4 Hz | 4.46* | 0.48 (0.08) | 2.36 |
| SMG-R | 40 | 57 | −30 | 38 | SNR | 1–4 Hz | 3.94* | 0.29 (0.09) | 0.22 |
| PMC-L | 6 | −54 | 0 | 32 | VIVN | 1–4 Hz | 3.81* | 0.27 (0.06) | −0.65 |
| IFGt-R | 46 | 42 | 33 | 2 | SNRxVIVN | 0.25–1 Hz | 3.62* | 0.29 (0.07) | 1.48 |
| IFGop-R | 47 | 51 | 18 | 2 | SNR | 1–4 Hz | 5.06* | 0.36 (0.08) | 6.03* |
| IFGor-R | 47 | 30 | 26 | −16 | SNR in VI | 0.25–1 Hz | 5.07* | 0.44 (0.08) | 1.92 |
| SFG-R | 6 | 12 | 30 | 58 | SNR in VN | 0.25–1 Hz | −3.55* | −0.41 (0.09) | −2.21 |
| VC-R | 17/18 | 18 | −102 | -4 | VIVN | 1–4 Hz | 6.01* | 0.45 (0.06) | 1.84 |
-
*denotes significant effects (FWE = 0.05 corrected for multiple comparisons). Relevant variables in deposited data (doi:10.5061/dryad.j4567): SE_meg; SE_speech; SE_miS.
Table 2
Analysis of the contribution of audio-visual signals in shaping entrainment. For each region / effect of interest (c.f. Table 1) the table lists the comparison of condition-averaged speech and lip MI (positive = greater speech MI); the condition effects (GLM) on the conditional mutual information (CMI) between the MEG signal and the speech envelope, while partialling out effects of lip signals; and the condition-averaged information theoretic redundancy between speech and lip MI.
| Speech vs. lip MI | Speech-Lip redundancy | Speech CMI | |||||
|---|---|---|---|---|---|---|---|
| Label | T(18) | Avg(SEM) | T(18) | Avg(SEM) | Effect | T(18) | β(SEM) |
| HG-R | 4.27* | 28.16 (6.59) | 0.73 | 0.33 (0.44) | VIVN | 4.37* | 0.35 (0.06) |
| pSTG-R | 3.90* | 5.42 (1.39) | 0.49 | 0.19 (0.38) | SNR | 4.66* | 0.49 (0.08) |
| SMG-R | 2.95 | 1.32 (0.45) | 1.10 | 0.51 (0.47) | SNR | 4.10* | 0.29 (0.09) |
| PMC-L | 3.58* | 1.06 (0.30) | 3.83* | 2.42 (0.63) | VIVN | 3.47* | 0.24 (0.06) |
| IFGt-R | 1.21 | 0.87 (0.72) | 2.29 | 1.75 (0.77) | SNRxVIVN | 4.07* | 0.31 (0.07) |
| IFGopR | 3.68* | 1.50 (0.41) | 4.69* | 1.56 (0.33) | SNR | 4.70* | 0.35 (0.07) |
| SFG-R | 0.88 | 0.61 (0.70) | 4.13* | 2.37 (0.57) | SNR in VN | −3.62* | −0.43 (0.09) |
| VC-R | −3.35* | −2.19 (0.65) | 2.37 | 0.68 (0.29) | VIVN | 5.77* | 0.45 (0.06) |
-
*denotes significant effects (FWE = 0.05 corrected for multiple comparisons). Deposited data: ID_meg; ID_speech; ID_lip; ID_infoterms.
Table 3
Analysis of directed connectivity (DI). The table lists connections with significant condition-averaged DI, and condition effects on DI. SEM = standard error of participant average; β = standardized regression coefficients. T(18) = maximum T statistic within significance mask. All reported effects are significant (FWE = 0.05 corrected for multiple comparisons). Deposited data: DI_meg; DI_speech; DI_di; DI_brainlag; DI_speechlag.
| DI | Condition effects (GLM) | ||||
|---|---|---|---|---|---|
| Seed | Target | T(18) | Effect | T(18) | β(SEM) |
| HG-R | PMC-L | 3.38 | SNRxVIVN | −3.01 | −0.24 (0.08) |
| HG-R | IFGt-R | 3.03 | SNR | 3.32 | 0.31 (0.09) |
| HG-R | IFGopR | 4.54 | SNR | 3.19 | 0.26 (0.07) |
| pSTG-R | IFGt-R | 3.39 | SNR | 3.91 | 0.32 (0.09) |
| VIVN | 4.57 | 0.23 (0.05) | |||
| pSTG-R | IFGopR | 4.12 | SNR | 3.31 | 0.28 (0.08) |
| IFGt-R | IFGopR | 3.76 | VIVN | 3.56 | 0.21 (0.06) |
| IFGopR | pSTG-R | 4.16 | SNR | 4.65 | 0.31 (0.09) |
| SFG-R | VC-R | 4.40 | SNRxVIVN | 3.69 | 0.28 (0.08) |
Table 4
Association of behavioral performance with speech entrainment and connectivity. Performance: T statistic and average of participant-specific correlation (SEM) between behavioral performance and speech MI / DI. Visual enhancement: correlation between SNR-specific behavioral benefit (VI-VN) and the respective difference in speech-MI or DI.
| Speech MI | |||||
|---|---|---|---|---|---|
| Performance | Visual enhancement | ||||
| T(18) | r(SEM) | T(18) | r(SEM) | ||
| HG-R | 1.27 | 0.13(0.10) | 0.21 | 0.04(0.15) | |
| pSTG-R | 3.43 * | 0.30(0.09) | 0.53 | 0.07(0.11) | |
| SMG-R | 2.35 | 0.23(0.09) | -0.39 | -0.07(0.14) | |
| PMC-L | 0.47 | 0.04(0.08) | 0.13 | 0.03(0.16) | |
| IFGt-R | 3.09 * | 0.28(0.09) | 1.25 | 0.29(0.18) | |
| IFGopR | 2.38 | 0.24(0.09) | -0.25 | -0.05(0.17) | |
| SFG-R | -0.47 | -0.04(0.08) | 1.61 | 0.35(0.17) | |
| VC-R | 1.55 | 0.18(0.10) | -0.82 | -0.14(0.14) | |
| Directed connectivity | |||||
|---|---|---|---|---|---|
| Performance | Visual enhancement | ||||
| Seed | Target | T(18) | r(SEM) | T(18) | r(SEM) |
| HG-R | PMC-L | 0.90 | 0.06(0.06) | -0.07 | -0.01(0.14) |
| HG-R | IFGt-R | 4.83 * | 0.31(0.07) | 2.55 * | 0.28(0.11) |
| HG-R | IFGopR | 3.19 * | 0.24(0.07) | 1.86 | 0.31(0.17) |
| pSTG-R | IFGt-R | 4.28 * | 0.27(0.06) | 1.28 | 0.16(0.12) |
| pSTG-R | IFGopR | 3.59 * | 0.29(0.08) | 1.82 | 0.32(0.17) |
| IFGt-R | IFGopR | 1.11 | 0.08(0.07) | 2.27 | 0.33(0.14) |
| IFGopR | pSTG-R | 4.51 * | 0.37(0.08) | 2.55 * | 0.37(0.15) |
| SFG-R | VC-R | -0.04 | 0.00(0.08) | 0.90 | 0.17(0.18) |
-
*denotes significant effects (FWE = 0.05 corrected for multiple comparisons). Deposited data: BEHAV_perf; SE_meg; DI_meg; SE_miS; DI_di; NBC_miS; NBC_di.
Table 5
Changes in band-limited source signal amplitude with experimental conditions. The table lists GLM T-statistics, participant averaged standardized regression coefficients (and SEM) for significant VIVN effects on MEG source amplitude (FWE = 0.05 corrected across ROIs and frequency bands).. Effects of SNR and SNRxVIVN interactions were also tested but not significant Deposited data: SE_meg; AMP_amp.
| ROI | Band | T(18) | β(SEM) |
|---|---|---|---|
| pSTG-R | 4–8 Hz | −3.66 | −0.38 (0.09) |
| pSTG-R | 18–24 Hz | −4.11 | −0.40 (0.08) |
| IFGt-R | 24–36 Hz | −3.91 | −0.40 (0.06) |
| IFGt-R | 30–48 Hz | −4.49 | −0.39 (0.08) |
| IFGop-R | 24–36 Hz | −4.44 | −0.40 (0.07) |
| IFGop-R | 30–48 Hz | −4.14 | −0.41 (0.07) |
| VC-R | 4–8 Hz | −3.70 | −0.55 (0.08) |
| VC-R | 8–12 Hz | −4.53 | −0.70 (0.05) |
| VC-R | 12–18 Hz | −5.20 | −0.70 (0.05) |
| VC-R | 18–24 Hz | −5.57 | −0.66 (0.06) |
| VC-R | 24–36 Hz | −5.57 | −0.55 (0.08) |
| VC-R | 30–48 Hz | −4.54 | −0.46 (0.10) |
Table 6
Analysis of phase-amplitude coupling (PAC). The table lists the significant condition-averaged PAC values for all pairs or ROIs and frequency bands (FWE = 0.05 corrected across pairs of phase and power frequencies). SEM = standard error of participant average. None of these changed significantly with conditions (no GLM effects at FWE = 0.05). Deposited data: SE_meg.
| Phase ROI (band) | Power ROI (band) | T(18) | Pac(SEM) |
|---|---|---|---|
| pSTG-R (1–4 Hz) | pSTG-R (8–12 Hz) | 3.26 | 0.22 (0.07) |
| SMG-R (4–8 Hz) | SMG-R (30–48 Hz) | 3.58 | 0.27 (0.07) |
| IFGop-R (0.25–1 Hz) | VC-R (18–24 Hz) | 3.08 | 0.22 (0.07) |
| VC-R (4–8 Hz) | VC-R (8–12 Hz) | 3.06 | 0.35 (0.11) |
| VC-R (1–4 Hz) | VC-R (12–18 Hz) | 3.44 | 0.48 (0.13) |
| VC-R (4–8 Hz) | VC-R (24–36 Hz) | 3.76 | 0.26 (0.07) |
Download links
A two-part list of links to download the article, or parts of the article, in various formats.
Downloads (link to download the article as PDF)
Open citations (links to open the citations from this article in various online reference manager services)
Cite this article (links to download the citations from this article in formats compatible with various reference manager tools)
Contributions of local speech encoding and functional connectivity to audio-visual speech perception
eLife 6:e24763.
https://doi.org/10.7554/eLife.24763


