Salt-inducible kinase 3 regulates the mammalian circadian clock by destabilizing PER2 protein
- Research Institute of Environmental Medicine, Nagoya University, Japan
- Japan Science and Technology Agency, Japan
- Kindai University Faculty of Medicine, Japan
- School of Science, The University of Tokyo, Japan
- Ritsumeikan University, Japan
- National Institutes of Biomedical Innovation, Health and Nutrition, Japan
Figures
Figure 1 with 1 supplement
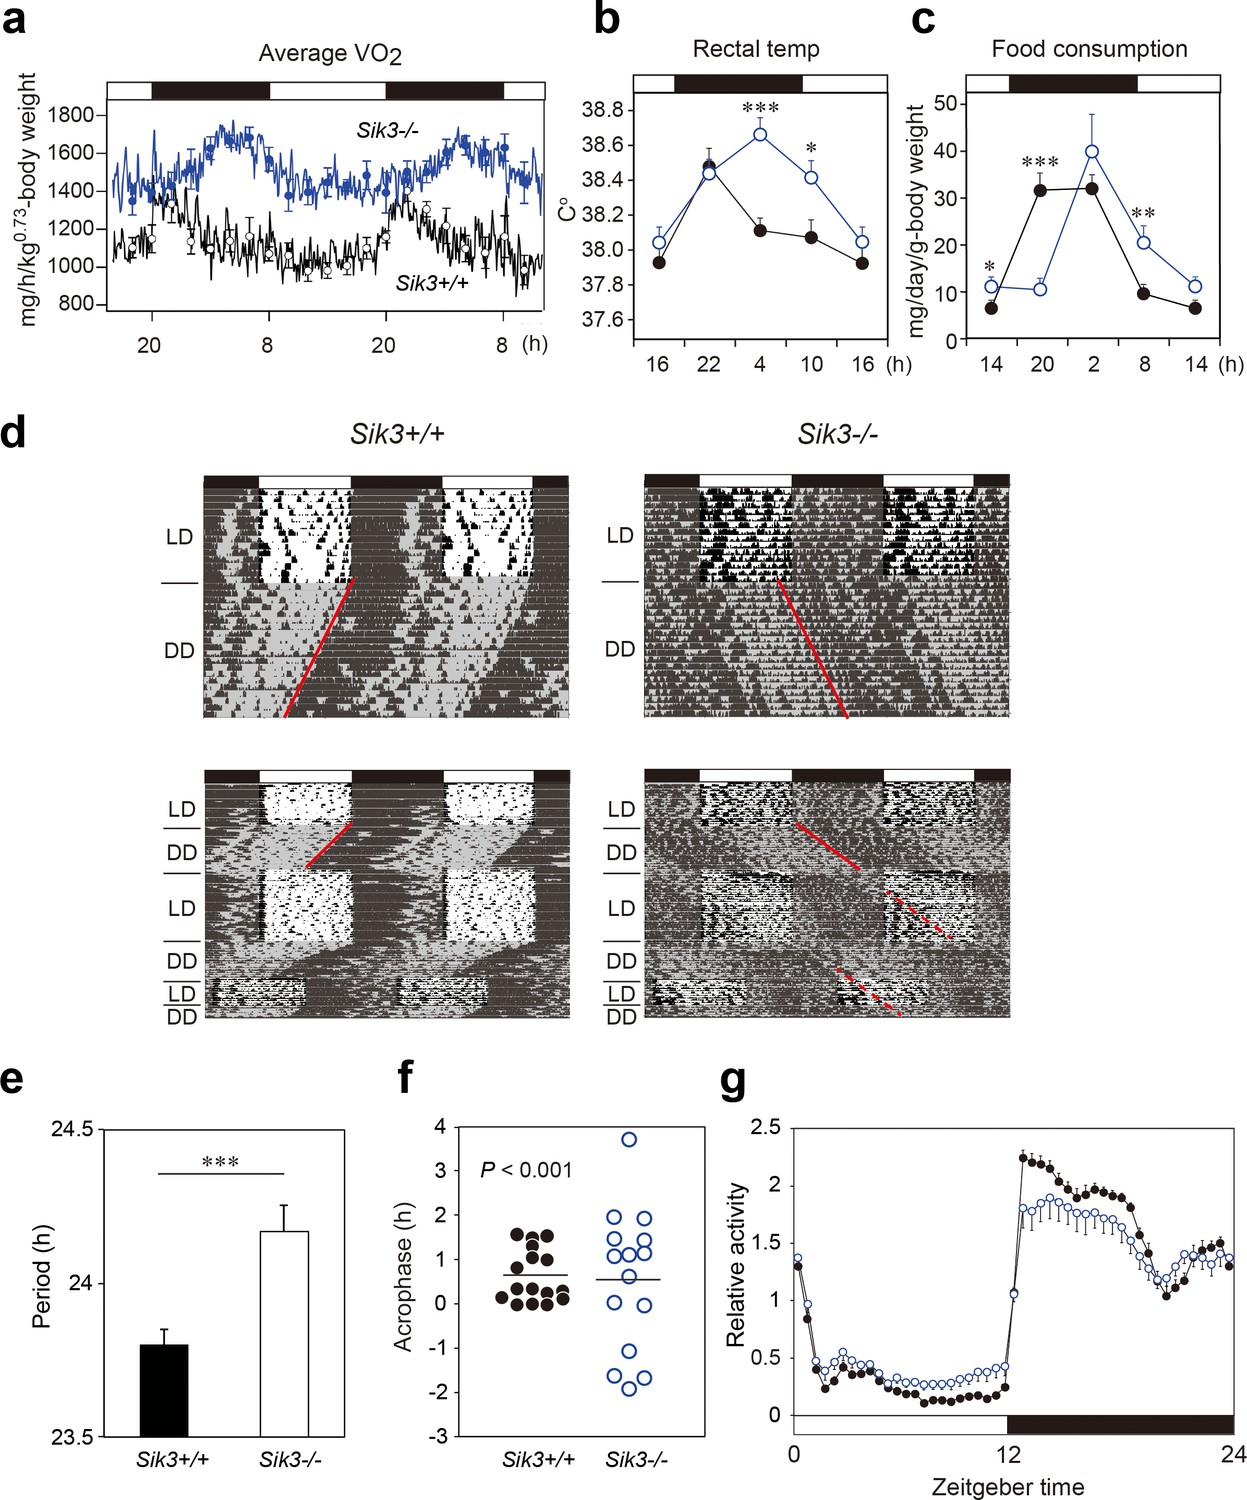
Sik3-/- mice exhibit aberrant circadian rhythms in physiology and behavior.
(a) Oxygen consumption rhythm was measured in Sik3-/- mice and Sik3+/+ controls for 2 days (n = 3 per group), and mean values are shown. The peak in the Sik3-/- mice (blue line) was phase-delayed by approximately 6 hr compared with that of Sik3+/+ mice (black line). (b) Rectal temperature rhythm in the Sik3-/- mice was phase-delayed (n = 3 each). (c) Food consumption rhythm also exhibited delayed phase (n = 3 per each). Note that continuous food intake was observed in the Sik3-/- mice during the resting phase (daytime). (d) Locomotor activity rhythms in the Sik3-/- mice and Sik3+/+ controls. Upper panels demonstrate impaired entrainment to the light-dark (LD) cycles, low amplitude, variable phases, and significantly longer free-running periods in Sik3-/- mice compared with Sik3+/+ controls (see angles of red lines). Lower panels show light re-entrainment experiments. In contrast to Sik3+/+ mice, in which behavioral rhythms entrained to LD cycles after transition from constant dark (DD) to LD, it took more than 2 weeks for Sik3-/- mice to become entrained to LD. In addition, a portion of the activity rhythms in DD persistently free-ran for as long as 3 weeks after conversion from DD to LD in the Sik3-/- mice (see dotted lines). (e) Average free-running periods in the Sik3-/- mice (n = 13) and Sik3+/+ mice (n = 15). (f) Distribution of average acrophase in individual Sik3-/- (n = 15) and Sik3+/+ (n = 16) mice. p<0.001 for the test for equality of variance (F-test) vs. Sik3+/+. (g) Averaged activity plots of Sik3+/+ mice (black line, n = 16, average of 16 days) and Sik3-/- mice (blue line, n = 15) in LD. *p<0.05, **p<0.01, ***p<0.001 vs. Sik3+/+ (Student’s t-test).
Figure 1—figure supplement 1
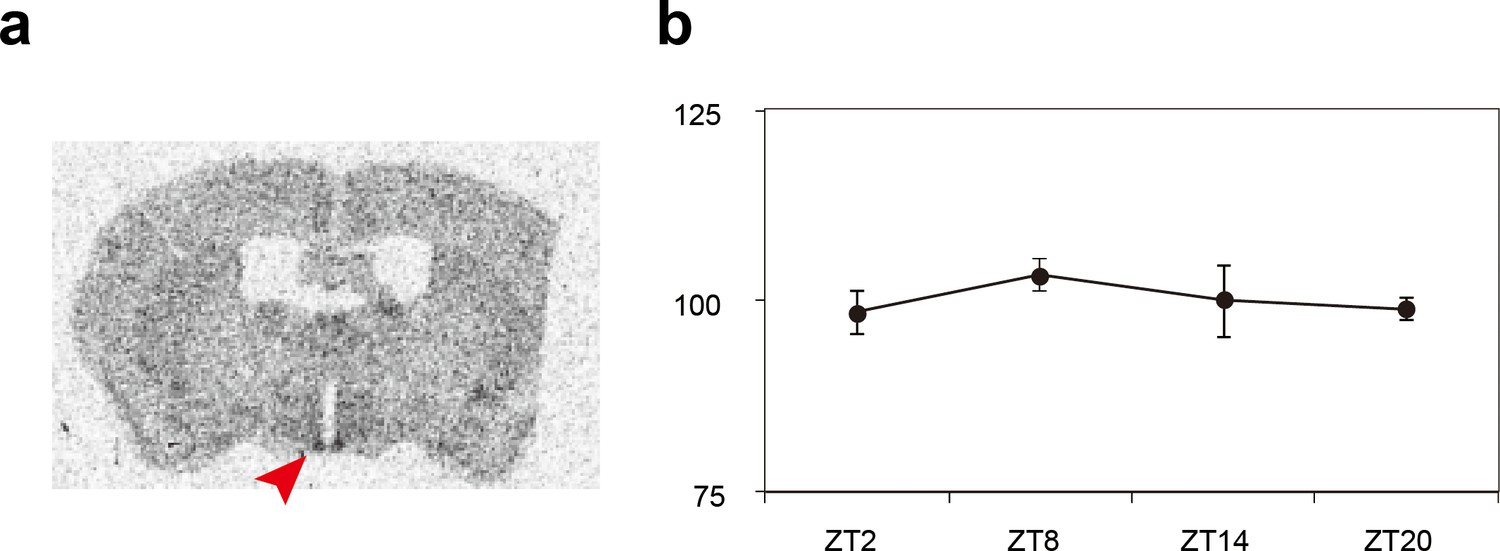
Expression patterns of the Sik3 mRNA in the mouse brain.
(a) Distribution of Sik3 mRNA in the mouse brain was detected by in situ hybridization using a 35S-labeled riboprobe. Note that the mRNA was expressed in almost entire areas of the brain and intense signal is observed in the suprachiasmatic nucleus (SCN) (arrowhead). (b) Quantitative analyses of the Sik3 mRNA demonstrated that Sik3 transcript in the SCN is consistently expressed and not regulated in a circadian manner (n = 3 each).
Figure 2 with 3 supplements
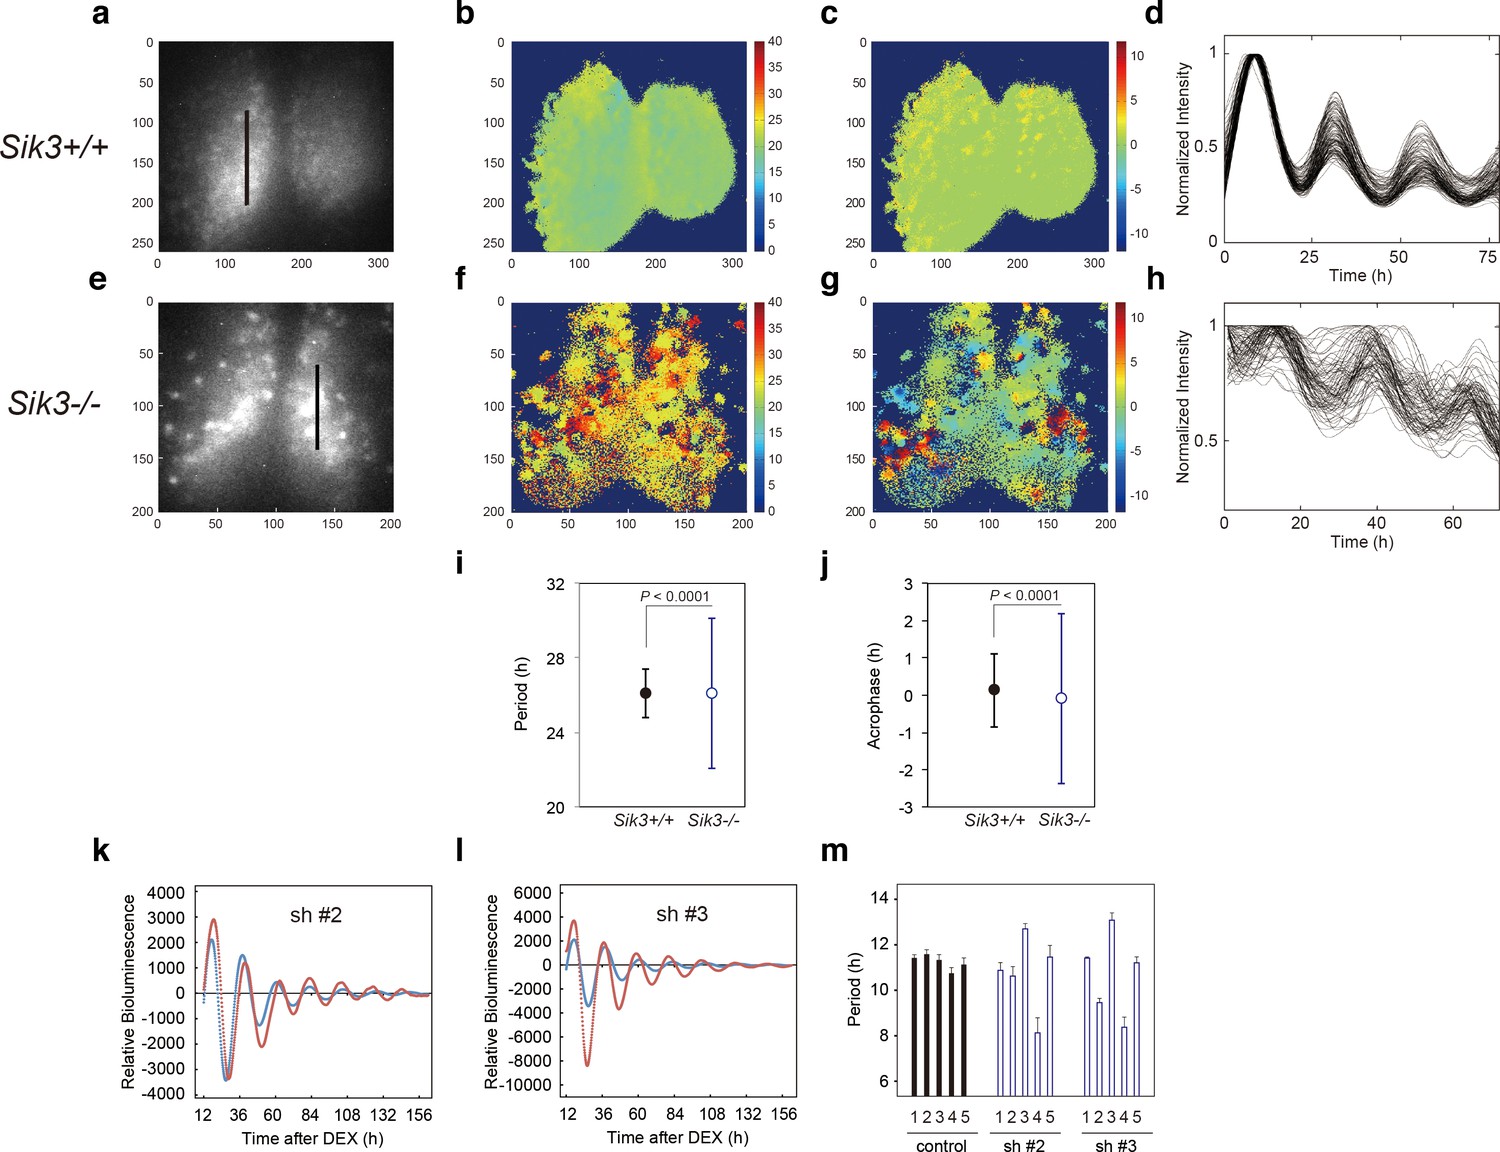
Varied circadian periods and phases in individual cells of the Sik3-/- suprachiasmatic nucleus (SCN).
Time-lapse single-cell bioluminescence images of ex vivo SCN explant cultures of (a) Sik3+/+; Per2Luc/Luc and (e) Sik3-/-; Per2 Luc/Luc mice were used for the following analyses: Period distribution on SCN slices of Sik3+/+ (b) and Sik3-/- (f). Acrophase distribution on SCN slices of Sik3+/+ (c) and Sik3-/- (g). Time series of the bioluminescence signals observed on a Sik3+/+ SCN slice along the bold line indicated in a) (d), and those from a Sik3+/+ SCN slice along the bold line indicated in (b) (h). The original signals were smoothed via a moving average filter, and then normalized. (i) Period distribution in representative Sik3+/+ and control slices. p<0.0001 vs. Sik3-/- (test for equality of variance, F-test). (j) Acrophase distribution of representative Sik3+/+ and Sik3-/- slices. p<0.0001 vs. Sik3-/- (F-test). (k) and l) Representative Bmal1-luc rhythms of Sik3-KD NIH3T3 (sh #2 and #3, red) and control cells (blue). (m) Averaged sequential half-periods (peak-to-trough or trough-to-peak) of Bmal1-luc rhythms in KD and control NIH3T3 cells as shown in (k and l) (n = 4 per group). Numbers (1–5) on the x-axis present the first half-period (hours from first trough to second peak) to the fifth half-period (hours from third trough to fourth peak).
Figure 2—figure supplement 1
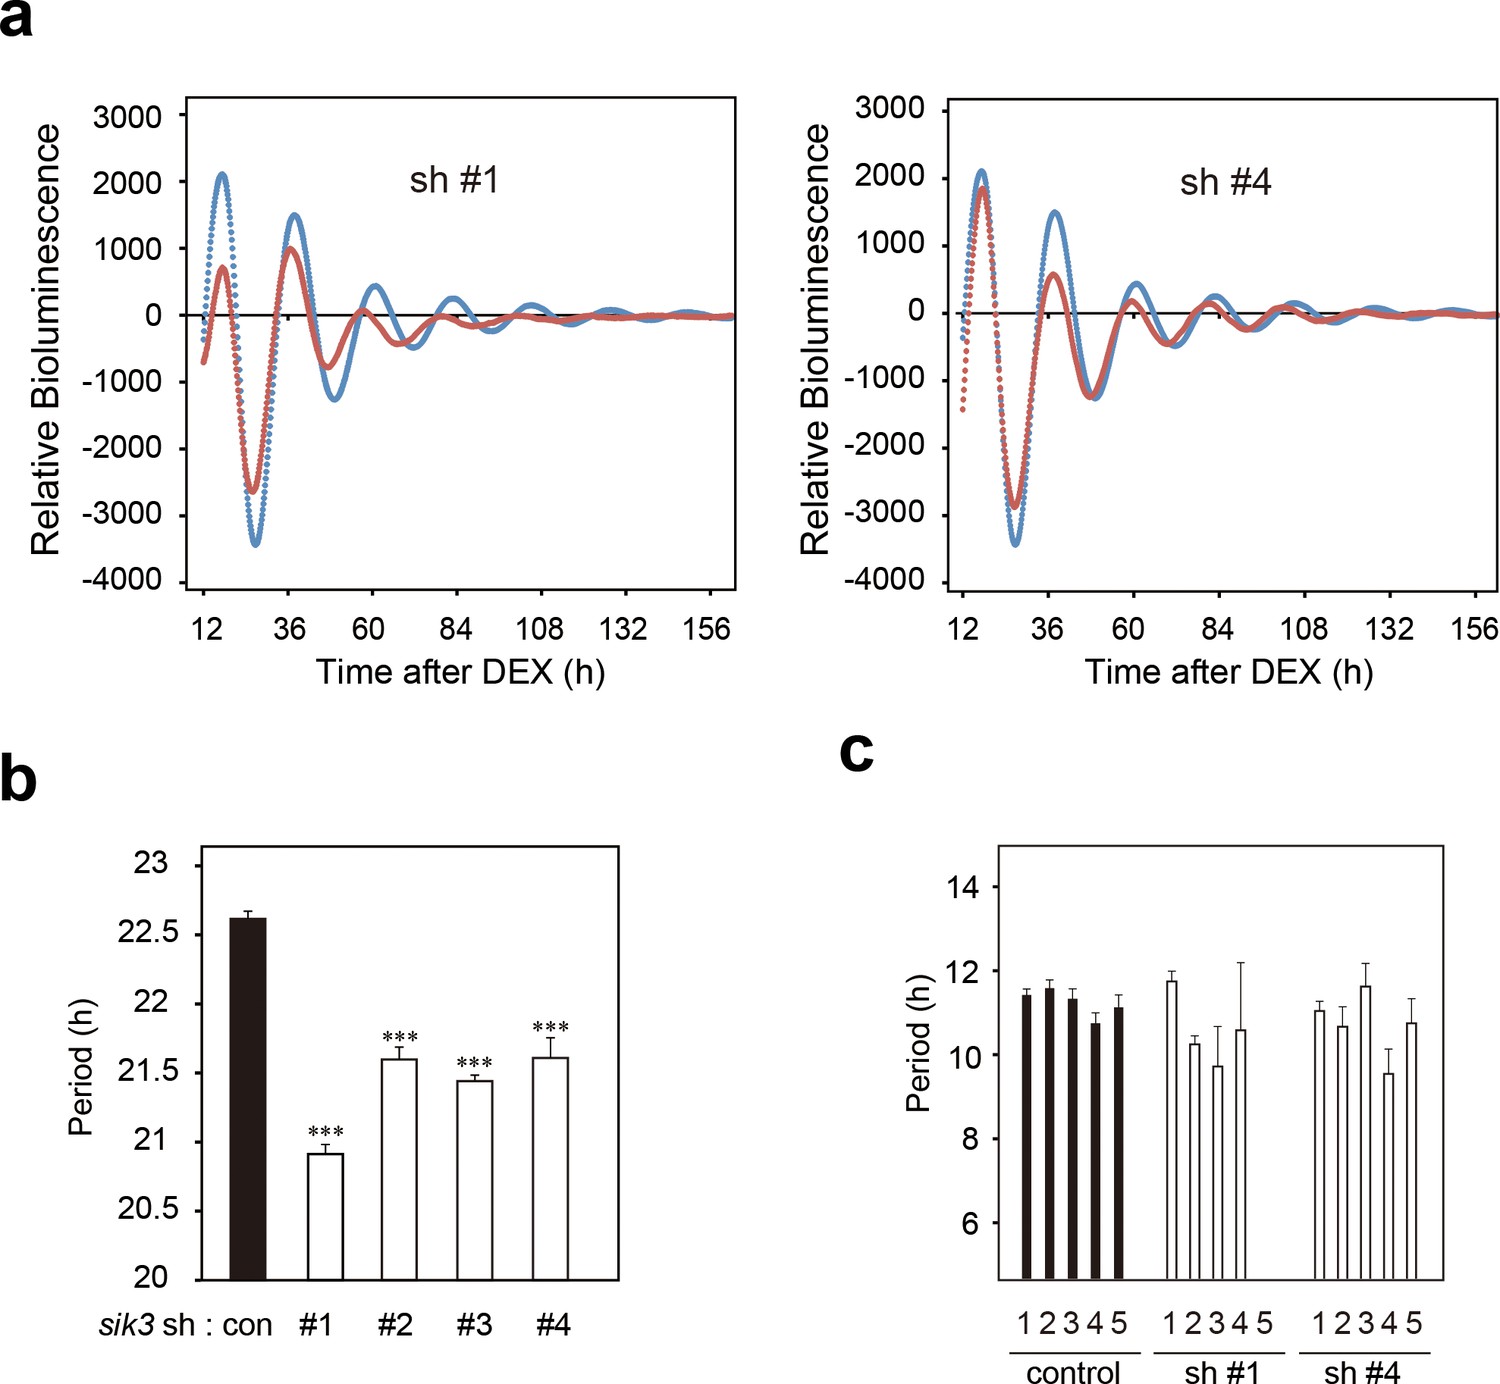
Sik3 knockdown cells exhibit shortened and unstable period of circadian Per2 Lucc rhythms.
(a) A representative Bmal1-luc bioluminescence rhythms of NIH3T3 cells transfected with Sik3-KD (sh #1 or sh #4, red) and control shRNA (blue) (n = 4) as shown in Figure 2k and l. (b) Average circadian periods from first trough to third trough of individual experiments as shown in (b) and Figure 2k–l. (n = 4, ***p<0.001 vs. controls by Dunnett’s test) (c) Averaged sequential half-periods (peak-to-trough or trough-to-peak) of Bmal1-luc rhythms in KD and control NIH3T3 cells as shown in (k and l) (n = 4 per group). Numbers (1–5) on the x-axis present the first half-period (hours from first trough to second peak) to the fifth half-period (hours from third trough to fourth peak).
Figure 2—video 1
Time-lapse bioluminescence imaging of a coronal SCN slice of a Sik3+/+; Per2 Luc/Luc mouse.
Exposure time for a single image was 20 min, and time-lapse images were captured for 4 consecutive days. Per2 Luc rhythms are well synchronized in majority of the cells in the SCN.
Figure 2—video 2
Time-lapse bioluminescence imaging of a SCN slice of a Sik3-/-; Per2 Luc/Luc mouse.
Exposure time for a single image was 55 min, and time-lapse images were captured for 3 consecutive days. Note that Per2 Luc rhythms were desynchronized among individual cells in the SCN.
Figure 3 with 3 supplements
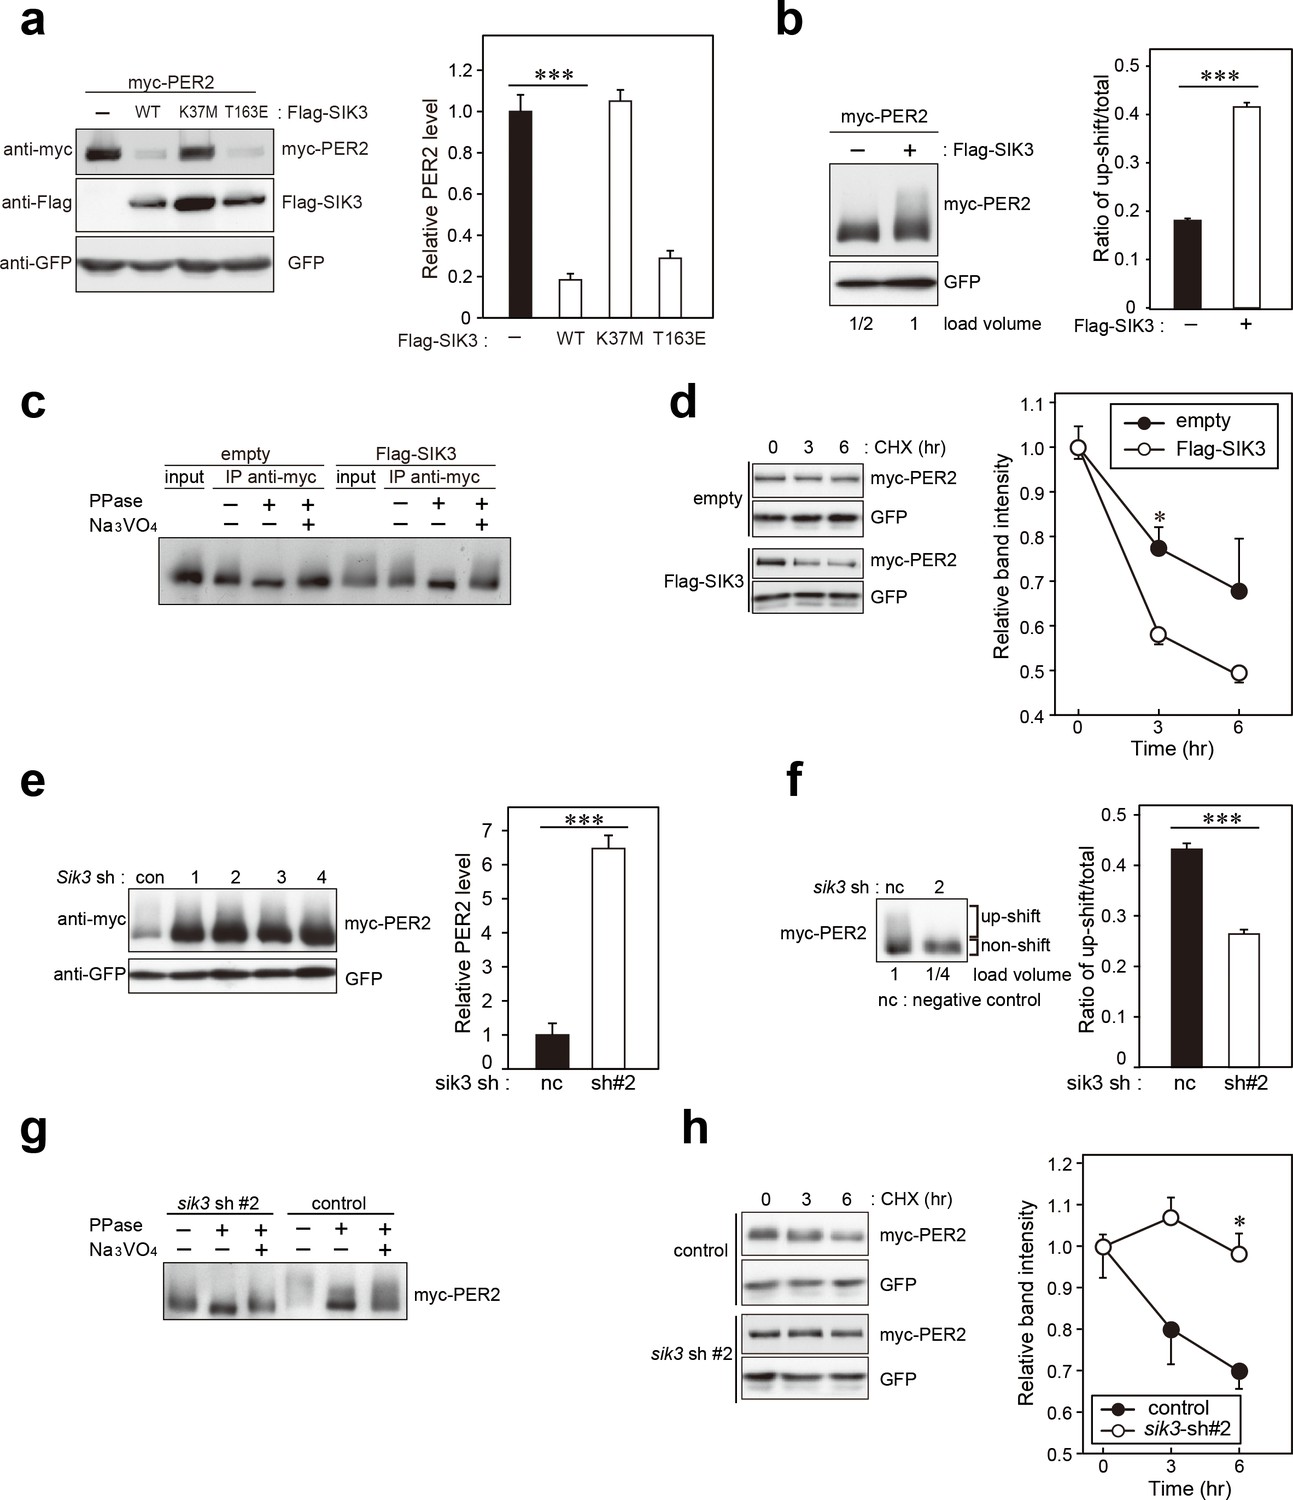
SIK3 alters expression levels and phosphorylation states of PER2 protein.
(a) HEK293T17 cells were transfected with SIK3 and PER2 expressing constructs, and the effect on PER2 expression levels was examined by western blotting analysis. Overexpression of SIK3 (SIK3-OX) in HEK293T17 cells (WT) and constitutively active SIK3 cells (T163E), but not kinase-deficient SIK3 mutant cells (K37M), significantly reduced PER2 protein levels (n = 3, p<0.001 by Tukey’s test). (b) Load volume of cell lysates in western blotting analysis was adjusted for comparison of phosphorylation rate. Adjustment of PER2 levels in SIK3-OX and non-OX controls revealed increased rates of upshifted PER2 protein (upshift/total) in NIH3T3 cells (n = 3, ***p<0.001 vs. controls by Student’s t-test). (c) Myc-tagged PER2 co-expressed with SIK3 was purified from HEK293T17 cell lysate and incubated with λPPase for 30 min at 30°C. PER2 up-shift was decreased after λPPase treatment in SIK3-OX cells, which was attenuated by phosphatase inhibitor, Na3VO4. (d) PER2 degradation assay was performed in Sik3-OX cells. Cells were collected at 0, 3, and 6 hr after the addition of CHX. PER2 protein levels at the starting point (t = 0) were normalized to 1. All data used for quantification are shown in Figure 3—figure supplement 2b (n = 3, *p<0.05 by Student’s t-test). Sik3-OX cells accelerated PER2 degradation. (e) NIH3T3 cells were transfected with each shRNAs of Sik3 (SIK3-KD, #1–4) or negative control shRNA. All SIK3-KD significantly increased PER2 levels (n = 3, p<0.05 by Tukey’s test). Another set of samples is also shown in Figure 3—figure supplement 3a. (f) Sik3-KD in NIH3T3 cells reduced PER2 up-shift. Load volume of cell lysates in western blotting analysis was adjusted for comparison of phosphorylation rate (n = 3 for control and shRNA#2, ***p<0.001 vs. controls by Student’s t-test). (g) λPPase treatment with Myc-PER2 purified from cell lysates of control cells or Sik3-KD cells. PER2 up-shift was decreased after λPPase treatment in SIK3-OX cells, which was attenuated by phosphatase inhibitor, Na3VO4. (h) PER2 degradation assay in Sik3-KD cells was performed. PER2 protein levels at the starting point (t = 0) were normalized to 1 (n = 3, *p<0.05 by Student’s t-test).
Figure 3—figure supplement 1
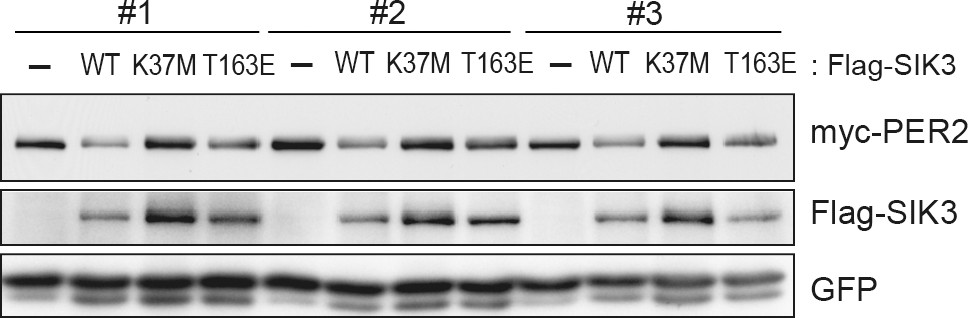
Constitutive active mutant, but not kinase-deficient SIK3, alters PER2 abundance in NIH3T3 cells.
Wild-type (WT) or mutant SIK3 (kinase dead from K37M or constitutive active from T163E) were expressed in NIH3T3 cells (n = 3). Expression levels of co-expressed PER2 were examined using western blotting analysis. Green fluorescent protein (GFP) was used for transfection and loading control.
Figure 3—figure supplement 2
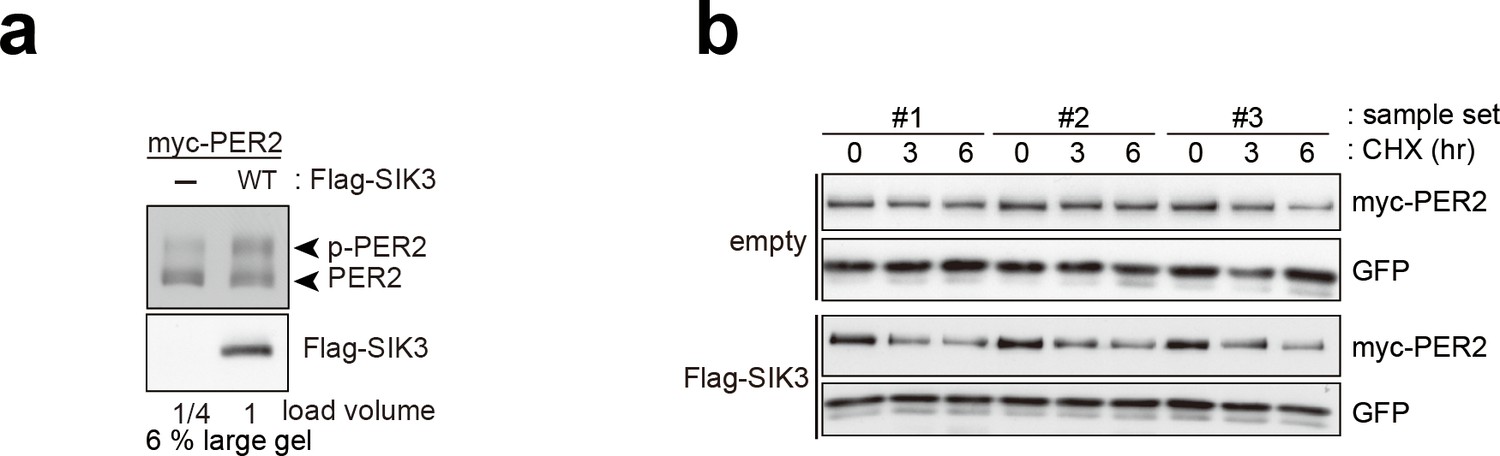
Overexpression of SIK3 promotes PER2 degradation.
(a) Upshifted band of PER2 was examined in HEK293T/17 cells expressing myc-PER2 and Flag-SIK3. SIK3-OX induces PER2 upshift. Load volume of cell lysate was adjusted for comparison of phosphorylation rate. (b) Other two sets (sample #2 and #3) of degradation assay indicate enhanced PER2 degradation in SIK3-OX cells. Sample set #1 is also shown in Figure 3d. NIH3T3 cells expressing SIK3 were treated with CHX for degradation assay of PER2 in cells.
Figure 3—figure supplement 3
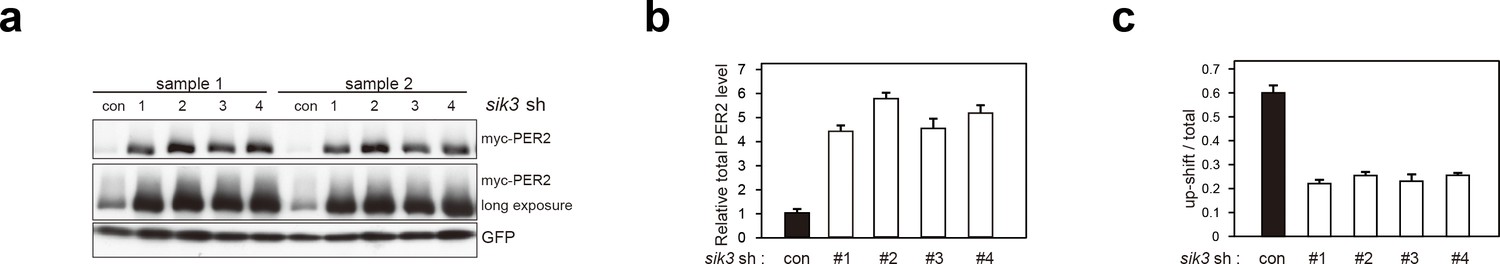
Sik3 knockdown reduces degradation of PER2 and increases its levels.
(a) Another set of experiment (sample set #1) showed the effect of Sik3 knockdown on PER2 levels in NIH3T3 cells. Sample set #2 was also shown in Figure 3e. All four different Sik3 shRNAs increased PER2 levels as shown in Figure 3e in NIH3T3 cells. (b) Quantification of the relative total PER2 levels shown in a. Data are shown as means ± SD (n = 2). (c) Quantification of phosphorylated/total PER2 levels shown in a. Data are shown as means ± SD (n = 2).
Figure 4
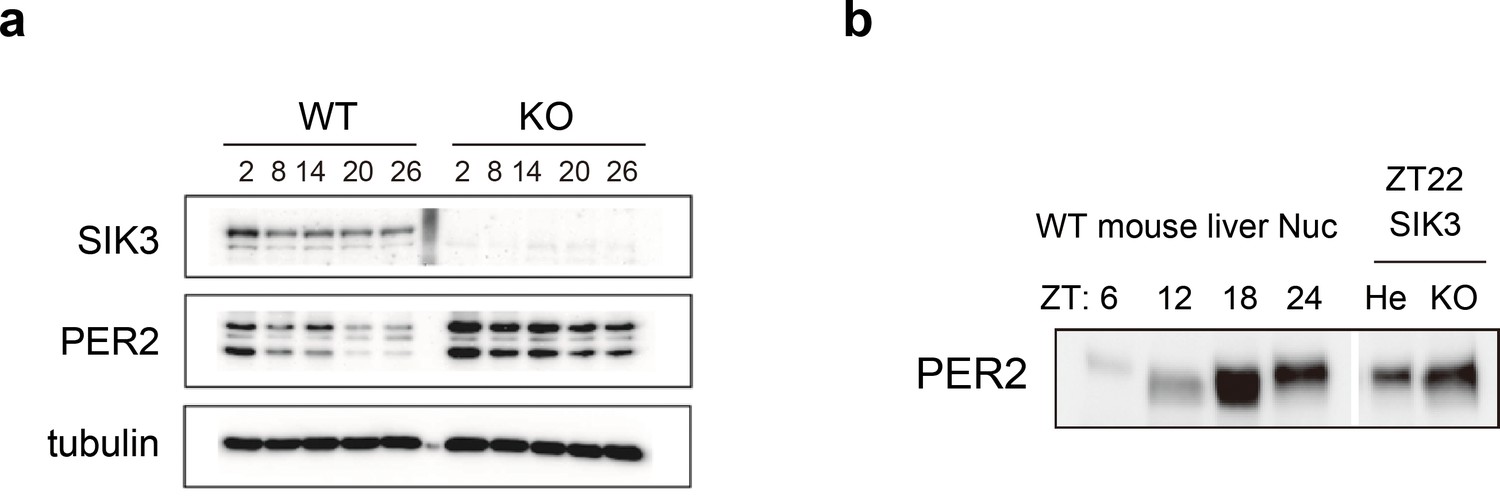
Elevated expression of PER2 in Sik3-/- fibroblasts and liver.
(a) MEFs were established from Sik3+/+ (WT) Per2Luc/+ mice and Sik3-/- (KO); Per2Luc/+ mice. The cellular rhythms were synchronized by dexamethasone (DEX, 100 nM) treatment to examine rhythmic expression by western blotting analysis. PER2 (bottom band) and PER2::LUC (upper bands) expression levels at all time points in knockout (KO) mouse embryonic fibroblast (MEFs) are higher than those in wild-type (WT) MEFs. (b) Western blotting performed on liver nuclear extracts, Sik3+/- (He); Per2Luc/+ mice, and littermate Sik3-/- (KO); Per2Luc/+ mice. PER2 expression in liver nucleus was higher in Sik3-/- mouse as compared to in Sik3+/- mouse ZT22, left). To confirm the protein mobility of endogenous PER2, rhythmic expression of PER2 in Sik3+/+ (±) mice was also detected. Note that Sik3+/+ (WT) mice do not have Per2Luc allele. Therefore, PER2 bands of Sik3 He and KO are from a single Per2 allele while those from WT are from both alleles.
Figure 5
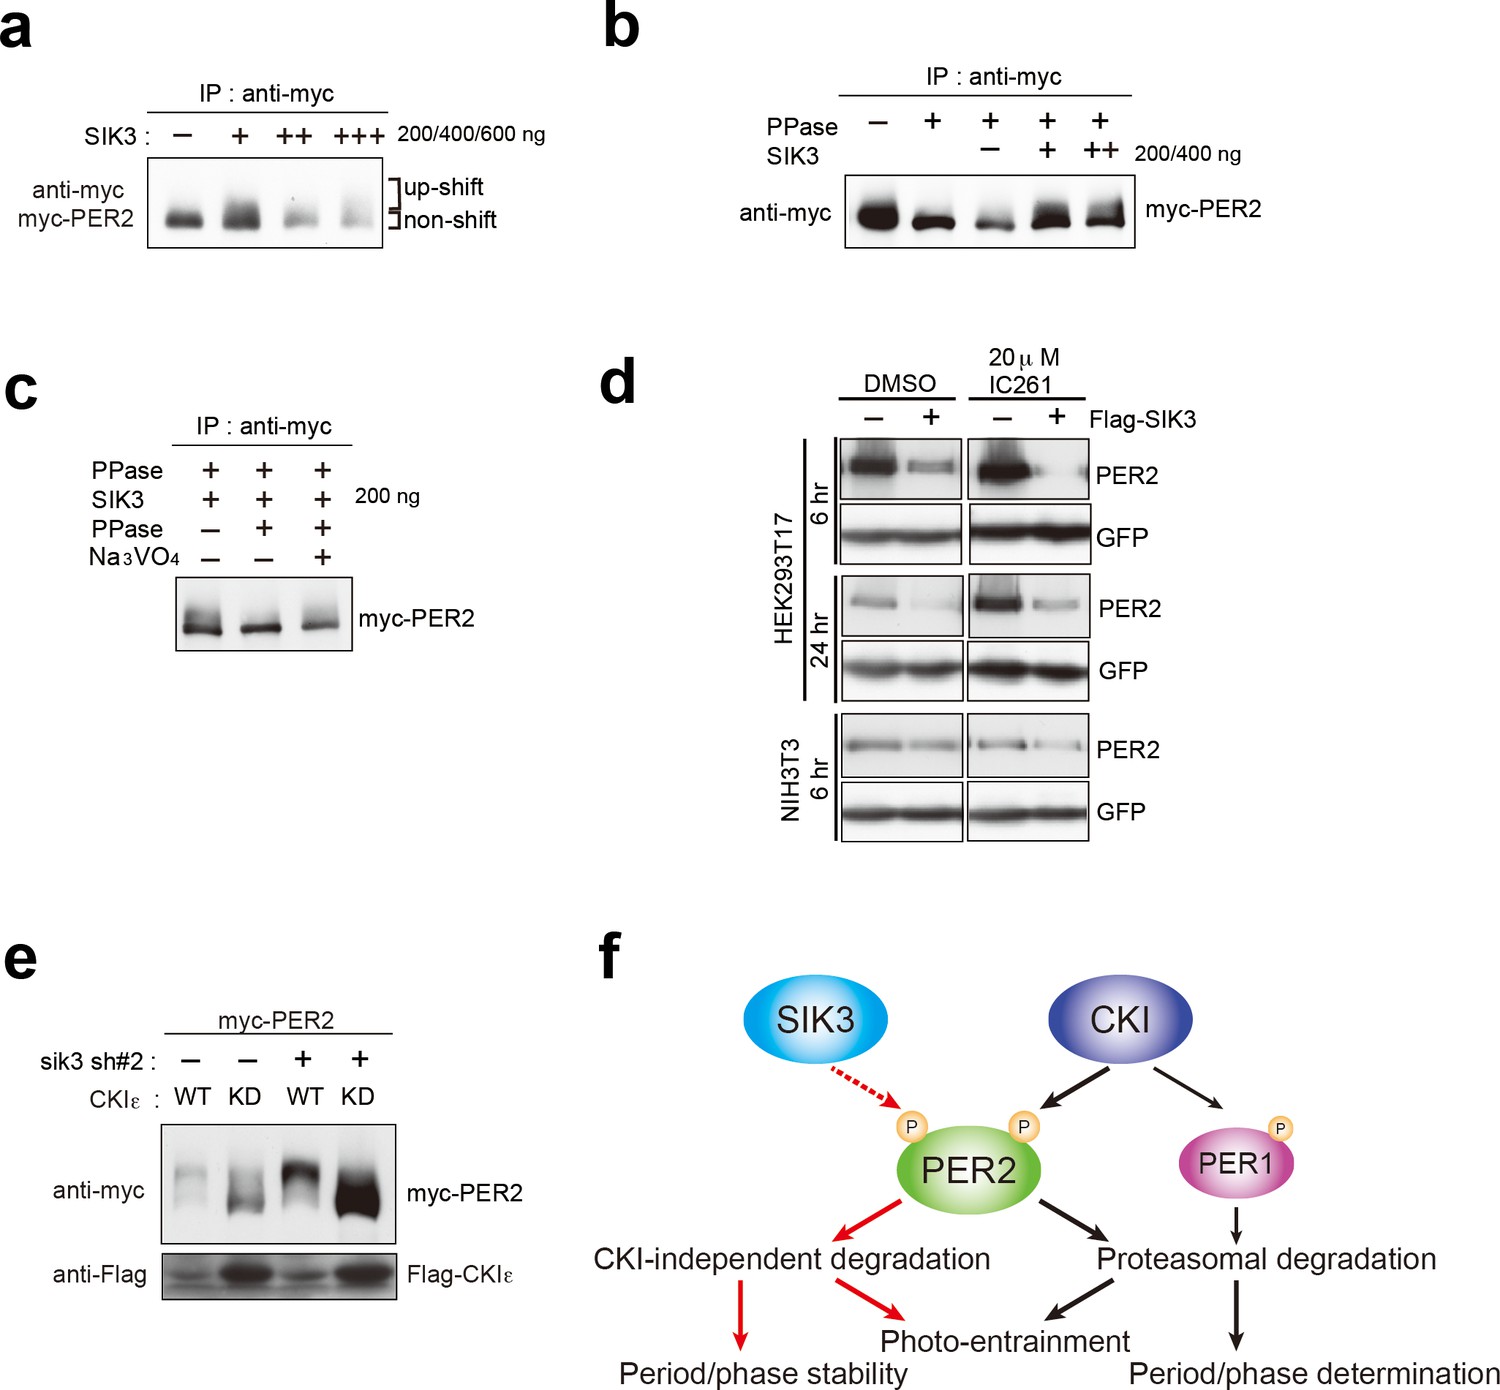
CSNK1-independent phosphorylation and destabilization of PER2 by SIK3.
(a) In vitro kinase assays of Myc-PER2 purified from HEK293T17 cell lysate and recombinant SIK3 catalytic domain. Incubation of PER2 protein with SIK3 increased the up-shifted PER2 band. (b) Purified Myc-PER2 was treated with λPPase prior to a kinase assay with SIK3. No-phosphorylated PER2 was also phosphorylated by recombinant SIK3. (c) Up-shifted band shown in b was confirmed as phosphorylation-form of PER2 by 2nd λPPase assay. Purified Myc-PER2 from cell lysates was incubated with λPPase and then with SIK3 (200 ng). After washing SIK3 away, PER2 was subjected to secondary λPPase treatment. (d) NIH3T3 and HEK293T/17 cells expressing SIK3 were incubated with CSNK1 inhibitor (IC261) for indicated time periods. CSNK1 inhibitor did not affect SIK3-mediated PER2 degradation in both cell lines. (e) NIH3T3 cells were transfected with Sik3-KD constructs as well as Csnk1e-WT or kinase dead form of Csnk1e (Csnk1e-KD). Knockdown of Sik3 did not affect CSNK1-mediated phosphorylation and degradation of PER2. (f) A schematic representation of a potential role for SIK3 compared with that of CSNK1. Although both SIK3 and CSNK1 mediate PER2 phosphorylation and degradation, their roles and degradation pathways appears to be different. Therefore, it may not be the case that SIK3 acts as a priming kinase for CSNK1, but the two kinases regulate PER2 independently. P represents phosphate.
Author response image 1
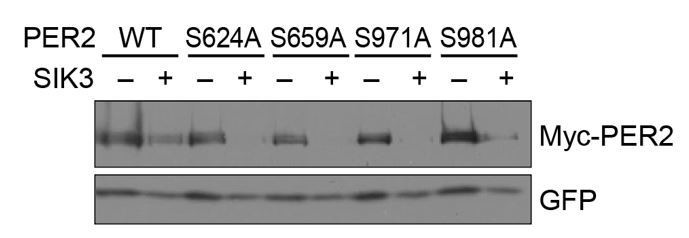
No significant effects of SA mutations at phosphorylation sites of PER2 on its degradation induced by SIK3.
HEK293T17 cells were transfected with SIK3 (or empty vector [–]) and mutant PER2 expression vectors with green-fluorescent protein (GFP) expression vector. The PER2 and GFP protein levels were analyzed using western botting. WT, Wild type.
Additional files
-
Transparent reporting form
- https://doi.org/10.7554/eLife.24779.014
Download links
A two-part list of links to download the article, or parts of the article, in various formats.
Downloads (link to download the article as PDF)
Open citations (links to open the citations from this article in various online reference manager services)
Cite this article (links to download the citations from this article in formats compatible with various reference manager tools)
Salt-inducible kinase 3 regulates the mammalian circadian clock by destabilizing PER2 protein
eLife 6:e24779.
https://doi.org/10.7554/eLife.24779


