Network-wide reorganization of procedural memory during NREM sleep revealed by fMRI
- Université de Montreal, Canada
- University of Ottawa, Canada
- University of Concordia, Quebec, Canada
- INSERM/UPMC, Pitié-Salpêtrière Hospital, France
Figures
Figure 1 with 2 supplements

Experimental design, behavioral performance, and task activation maps.
(A) Experimental procedure. On Day 1, subjects first experienced a screening and adaptation night in the mock scanner, which mimicked conditions experienced in both experimental and control nights. Subjects returned and underwent fMRI scans (Day seven and Day 14) while training (S1) on either the motor skill learning (MSL) or motor control (CTL) task in a counterbalanced order, interleaved by resting-state conditions (RS1 and RS2). This was followed by simultaneous EEG-fMRI sleep recording for up to ~2.5 hr. Subjects were then allowed to sleep for the remainder of the night in the sleep lab. Finally, on the following morning subjects underwent retest fMRI sessions (S2) on the same take as the previous training session (Day eight and Day 15), interleaved by resting-state conditions (RS3 and RS4). Arrows shows the experiment’s timeline. (B) Performance speeds (i.e., inter-key interval) averaged across all subjects show that the learning curves differed between the MSL (red) and CTL (blue) conditions during the learning session (S1). (C) Only the MSL task was consolidated overnight, as indicated by performance gain averaged across subjects (asymptotic performance at the end of S1 compared to the beginning of S2). (D) Color-coded activation maps representing motor sequence-related areas during the learning (S1) and retest (S2) sessions (corrected for multiple comparisons using Gaussian random field theory, cluster level threshold ). Bar plots illustrate the volume of cortical and subcortical activation in each map. As expected, the connectivity index (CI) within the learning (E) and the consolidated (F) patterns was significantly higher in the MSL compared to the CTL condition. Error bars represent s.e.m.; ** and *** indicate and , respectively.
-
Figure 1—source data 1
Summary of activation peaks related to the learning pattern.
The learning pattern represents all brain areas with greater activation in the MSL compared to the CTL condition during the learning practice session (S1). For each peak of activity, the anatomical label, MNI coordinates, the corrected cluster-level p value using GRF, and the associated Z-score are reported.
- https://doi.org/10.7554/eLife.24987.004
-
Figure 1—source data 2
Summary of activation peaks related to the consolidated pattern.
The consolidated pattern represents all brain areas with greater activation in the MSL compared to the CTL condition during the retest practice session (S2). Reporting conventions are as in Figure 1—source data 1.
- https://doi.org/10.7554/eLife.24987.005
Figure 1—figure supplement 1
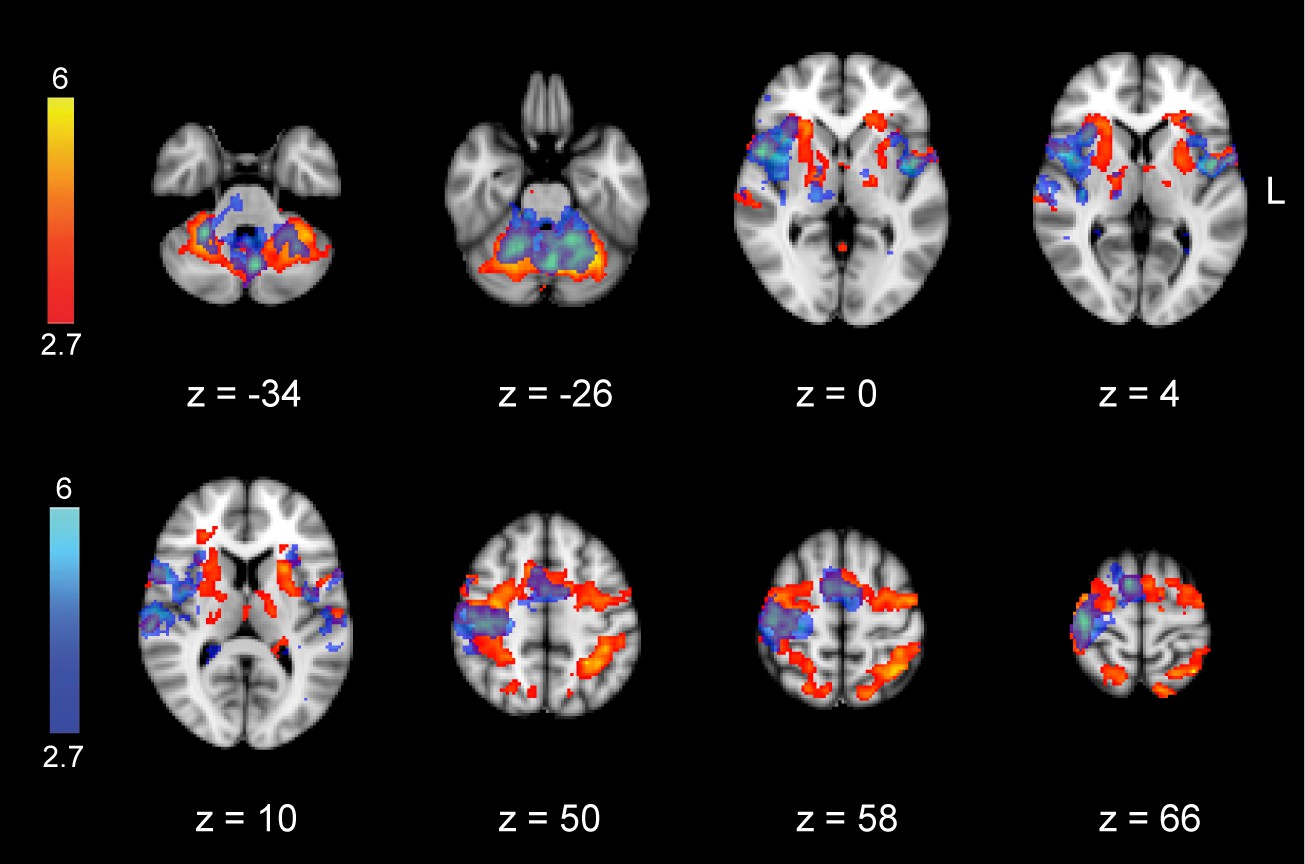
Task-related activation maps during the learning session (S1).
Figure shows the results of block-design analysis related to the MSL (color-coded in red) and CTL tasks (color-coded in blue). Color-coded activation maps indicate Z-score values and are corrected for multiple comparisons using GRF, p<0.05.
Figure 1—figure supplement 2
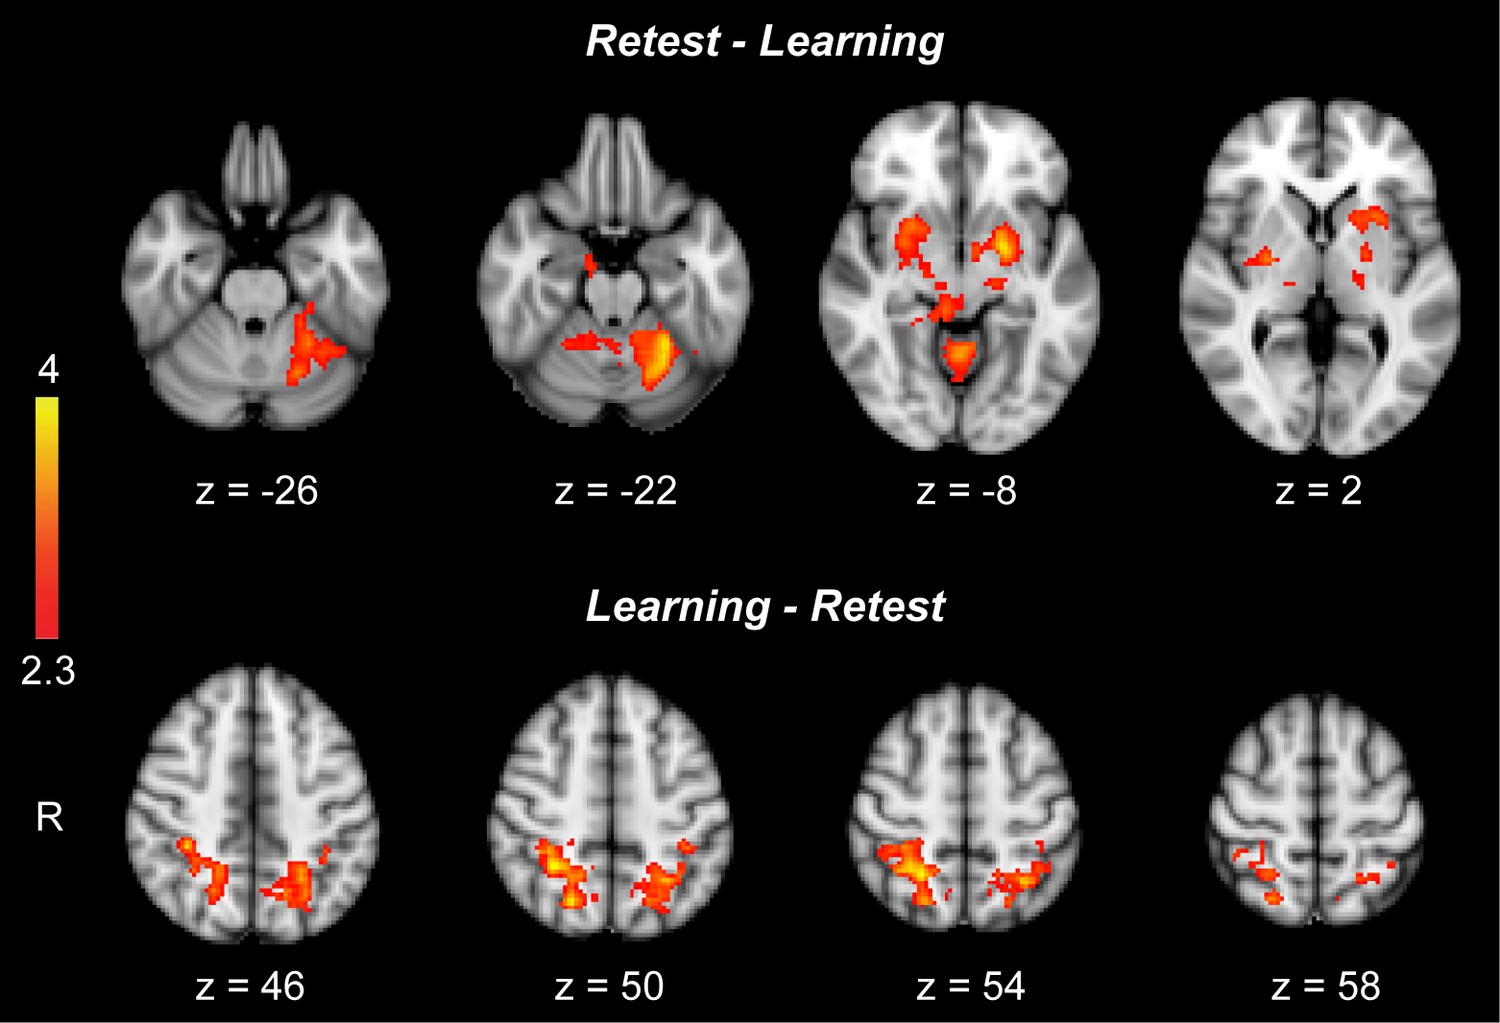
Differences in the activation of motor sequence-related areas between the learning (S1) and retest (S2) sessions.
Only subcortical areas including bilateral putamen and cerebellar cortex (lobules V-VI) revealed significantly greater activation during the retest compared to the learning session (contrast: retest [MSL-CTL] – learning [MSL-CTL]; top row), while two cortical clusters, including the superior parietal lobule and anterior intraparietal sulcus bilaterally, showed significantly greater activation during the learning compared to the retest session (contrast: learning [MSL-CTL] – retest [MSL-CTL];bottom row). Color-coded activation maps indicate Z-score values and are corrected for multiple comparisons using GRF, p<0.05.
Figure 2 with 3 supplements
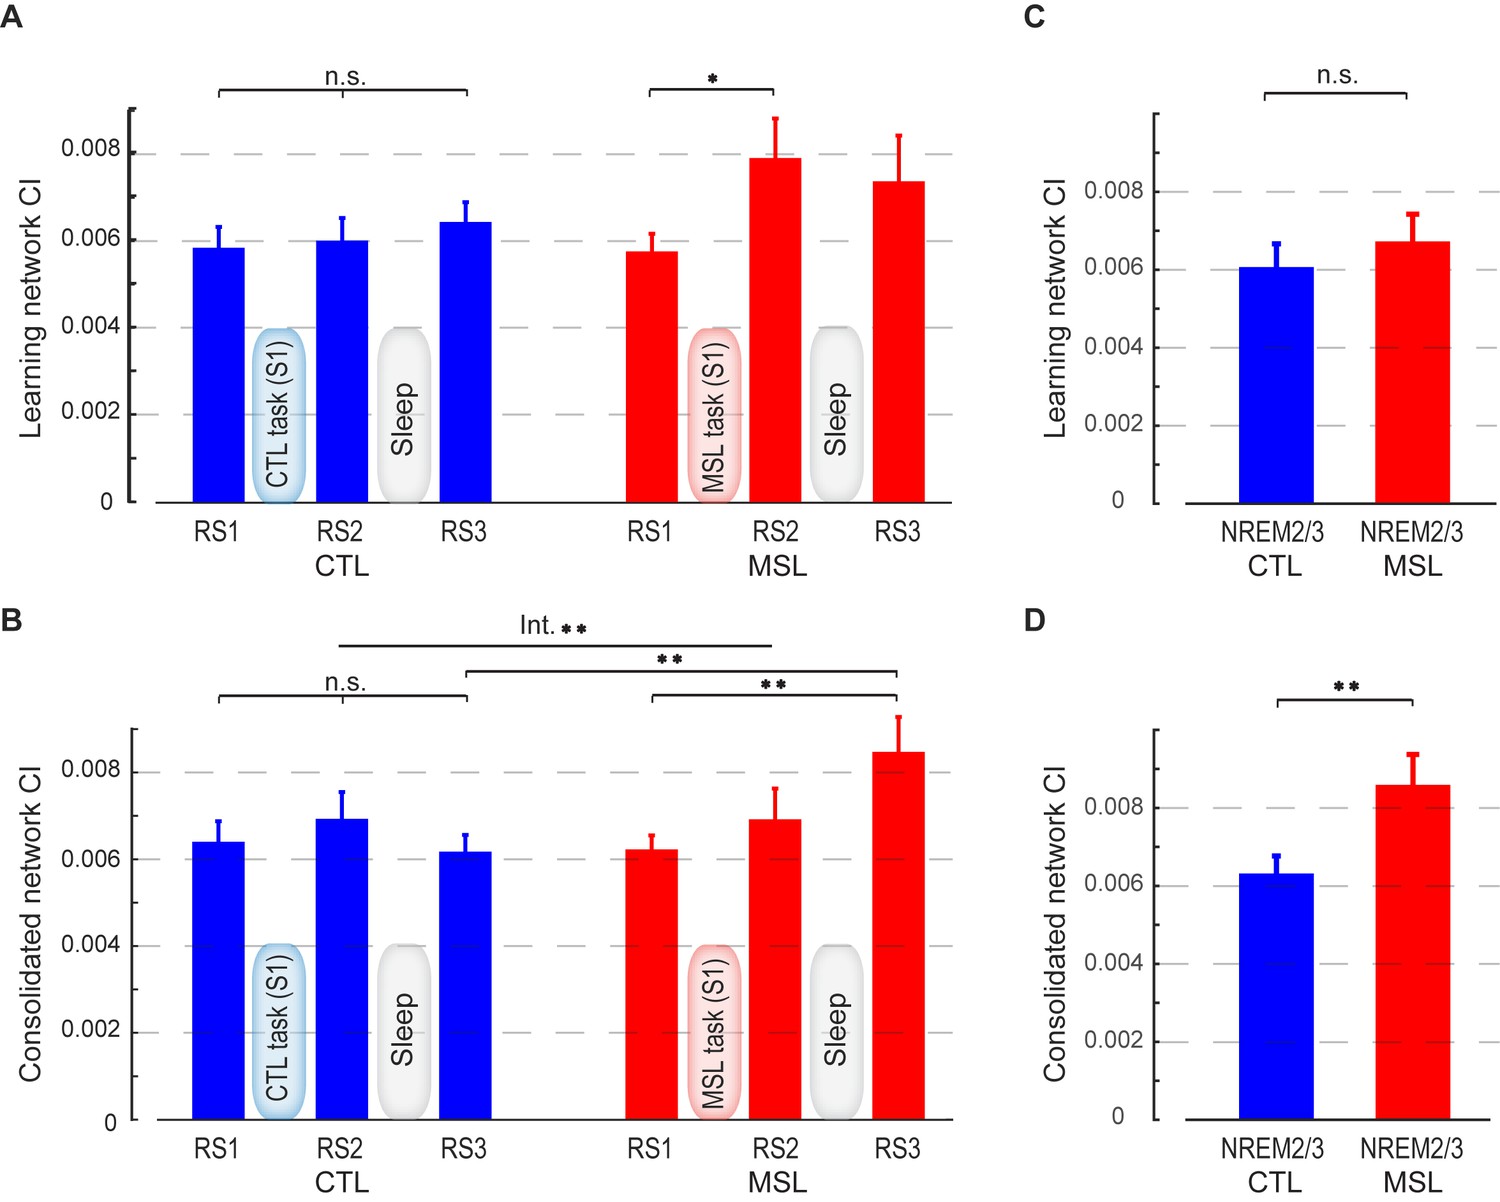
Connectivity index (CI) during resting-state and NREM sleep.
(A, B) show the CI within the learning and the consolidated patterns, respectively, averaged across subjects during the resting-state conditions before (RS1) and after (RS2) the training session (S1), as well as on the following morning before retest (RS3). The learning pattern’s CI was significantly increased in the MSL immediately following training (RS2), while the consolidated pattern’s CI increased significantly only post-sleep (RS3) in the MSL as compared to the CTL condition. (C, D) show, respectively, CI within the learning and the consolidated patterns averaged across subjects during NREM sleep. Only the consolidated pattern’s CI differed significantly between the MSL and CTL nights. Error bars represent s.e.m.; * and ** indicate and , respectively.
Figure 2—figure supplement 1
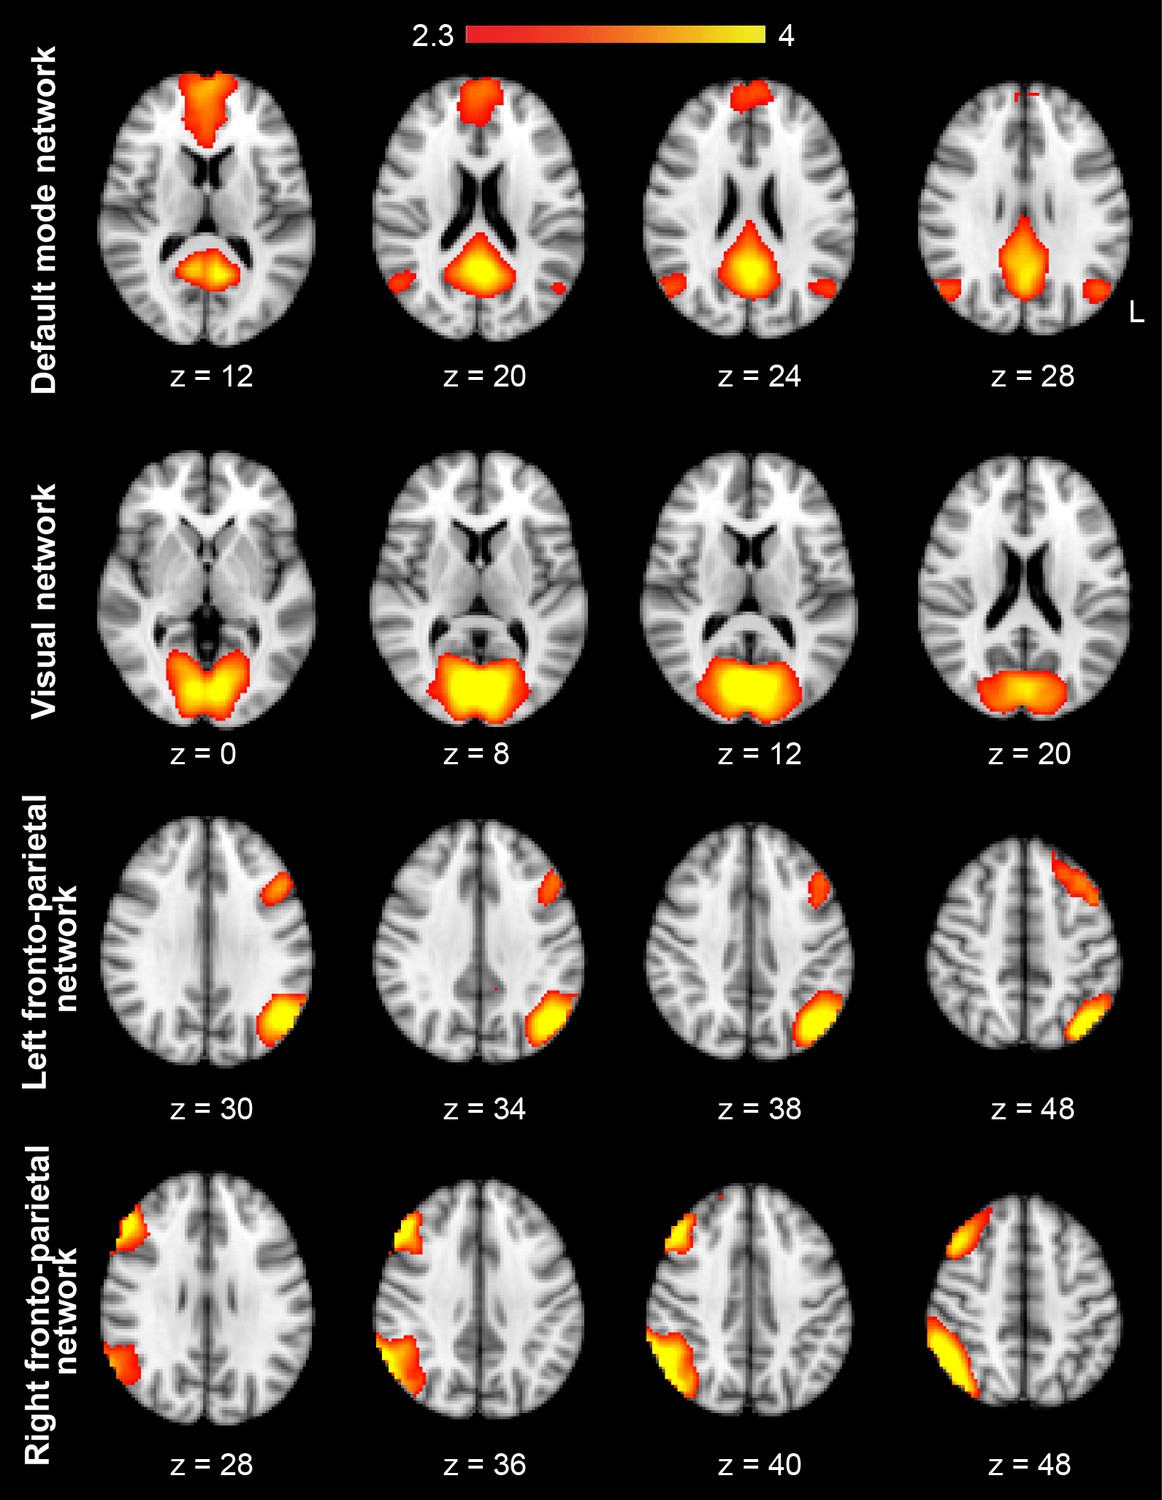
The group-level spatial maps of four highly-reproducible brain networks extracted during the MSL task.
Each row shows a spatial map extracted from the application of independent component analysis (ICA) on the time-concatenated data of the learning (S1) and retest (S2) sessions during the MSL task across all subjects. The label for each component is provided on the left. Color-coded activation maps indicate Z-score values.
Figure 2—figure supplement 2
Connectivity index (CI) during resting-state periods within the four control networks reported in Figure 2—figure supplement 1.
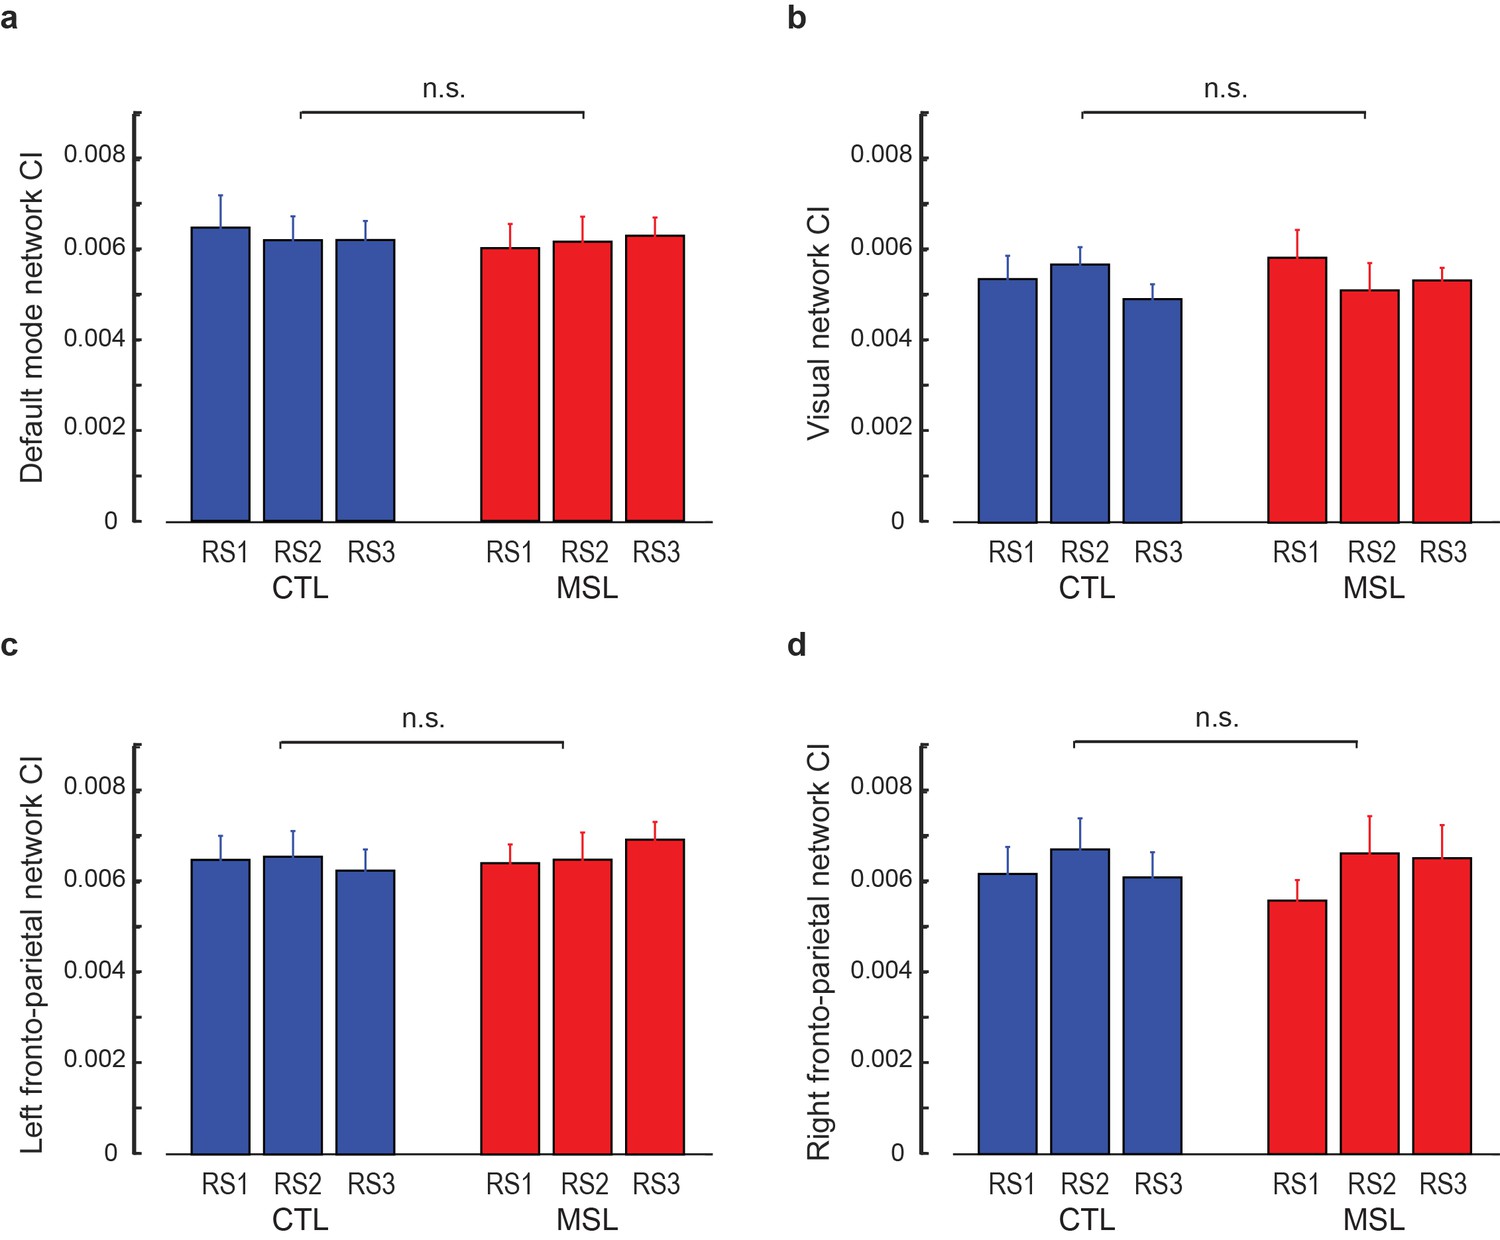
(a–d) show the CI within the default mode, visual, left and right fronto-parietal networks, respectively, averaged across subjects during the resting-state conditions before (RS1) and after (RS2) the training session (S1), as well as on the following morning before retest (RS3). No significant difference in CI between MSL and CTL tasks was observed in any of the four control networks (p>0.2, in all cases). Error bars represent s.e.m.; n.s. indicates not significant interaction.
Figure 2—figure supplement 3
Connectivity index (CI) during non-REM (NREM) sleep within the four control networks reported in Figure 2—figure supplement 1.
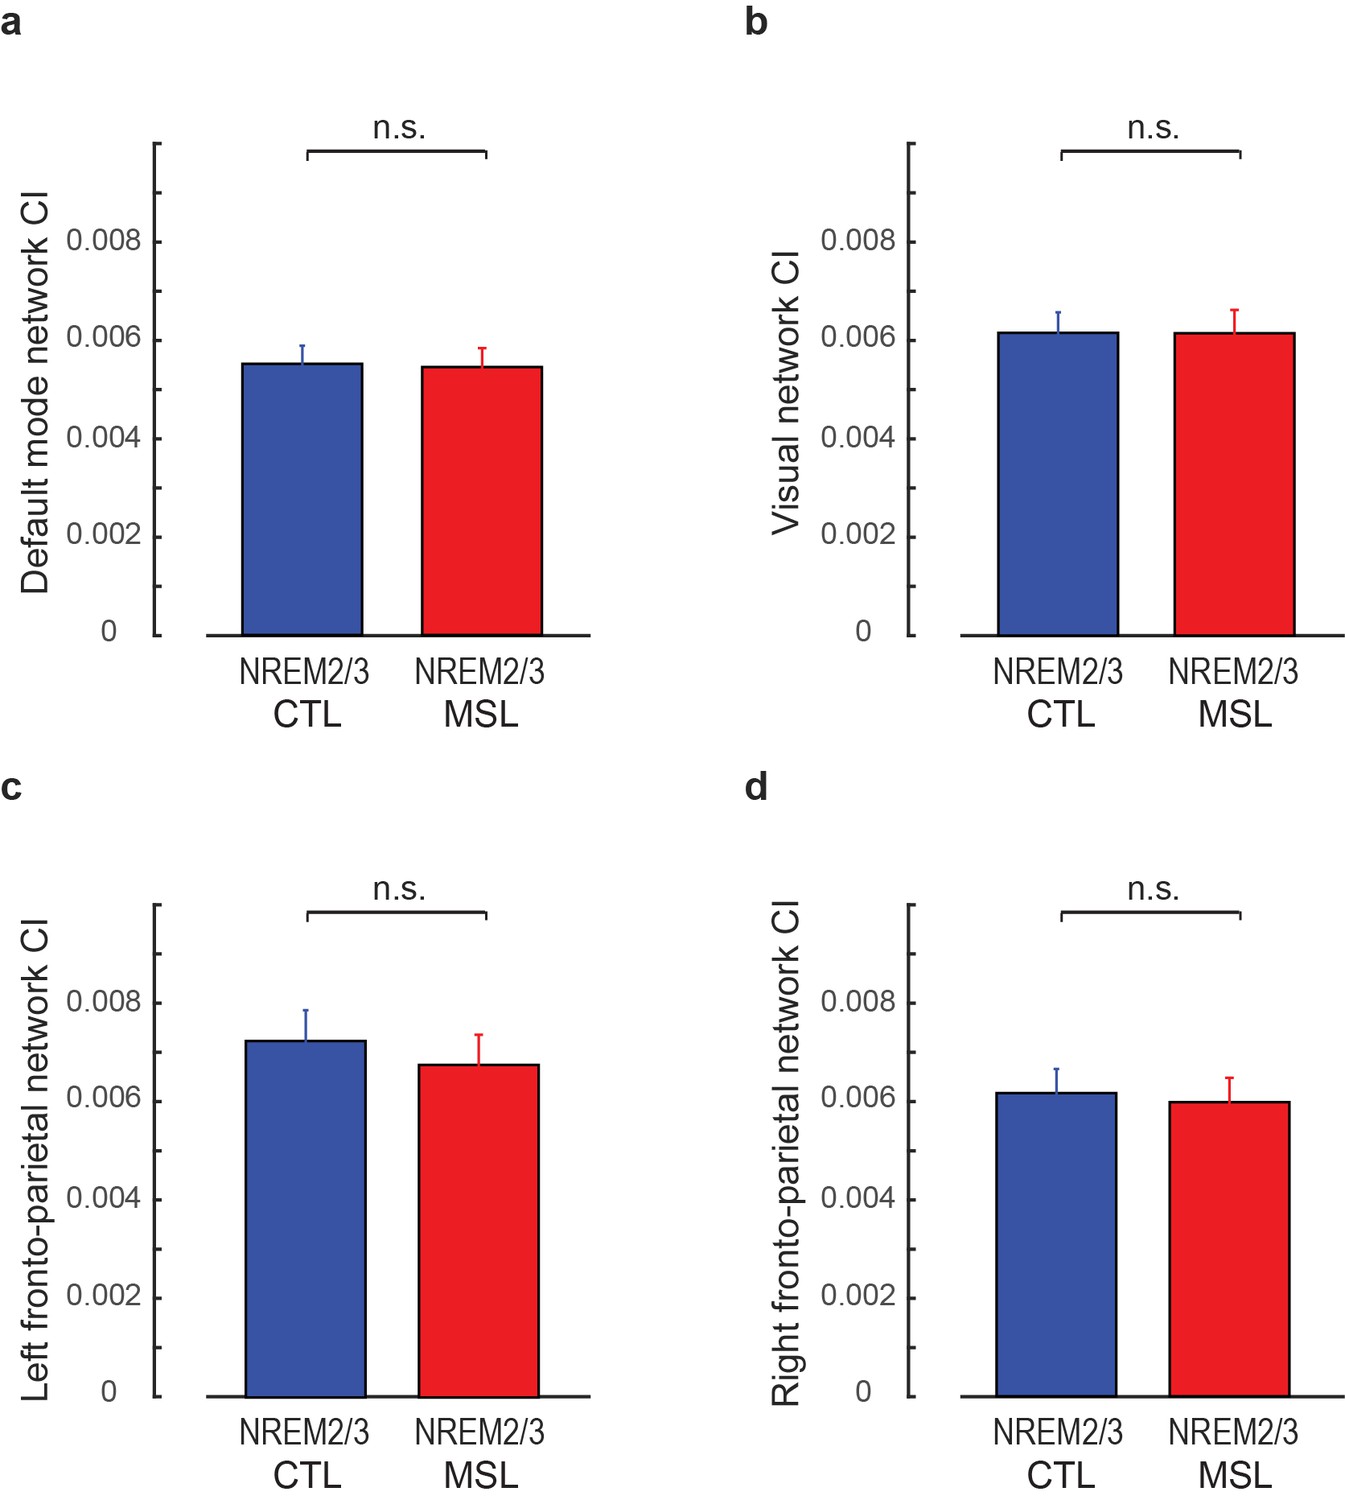
(a–d) show the CI within the default mode, visual, left and right fronto-parietal networks, respectively, averaged across subjects during NREM sleep. No significant difference in CI between MSL and CTL tasks was observed in any of the four control networks (p>0.3, in all cases). Error bars represent s.e.m.; n.s. indicates not significant paired t-statistics.
Figure 3 with 1 supplement
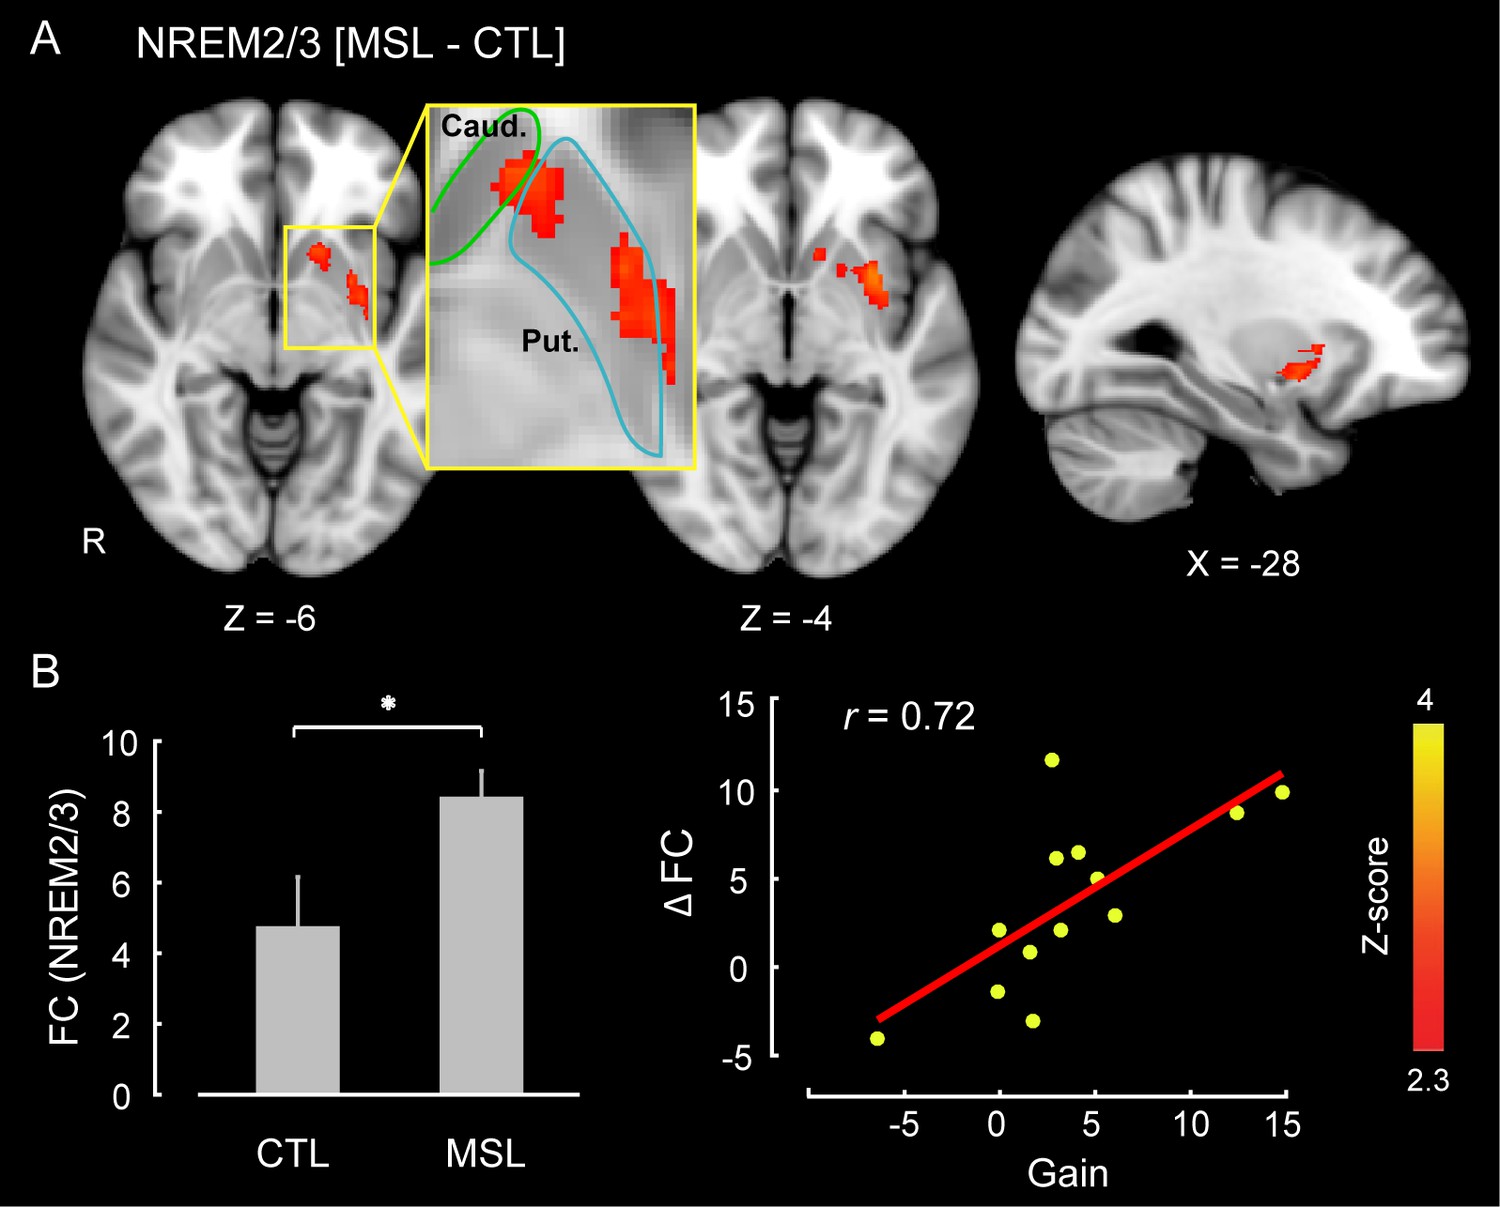
Neural correlates of motor sequence memory consolidation during NREM sleep.
The ventrolateral putamen functional connectivity within the consolidated pattern differed significantly between the MSL and CTL nights during NREM sleep. Bar plot illustrates the functional connectivity of the putamen with the rest of structures in the consolidated pattern averaged across subjects during NREM sleep. Importantly, the putamen connectivity within the consolidated pattern during NREM sleep was significantly related to the extent of sleep-dependent performance speed gains on a per subject basis, as depicted in the scatter plot. The color-coded activation map indicates Z-score values and is corrected for multiple comparisons using GRF, p<0.05. Error bars represent s.e.m.; * indicates .
-
Figure 3—source data 1
Regions of interest (ROI) used in the seed-based functional connectivity analysis.
Each ROI is selected based on the location of activation peaks in the learning pattern (Le), the consolidated pattern (Co), or both (Le/Co). The table shows seeds’ coordinates in MNI space (given in mm) and their anatomical labels.
- https://doi.org/10.7554/eLife.24987.013
Figure 3—figure supplement 1
Changes in brain functional connectivity related to motor sequence learning during non-REM sleep.
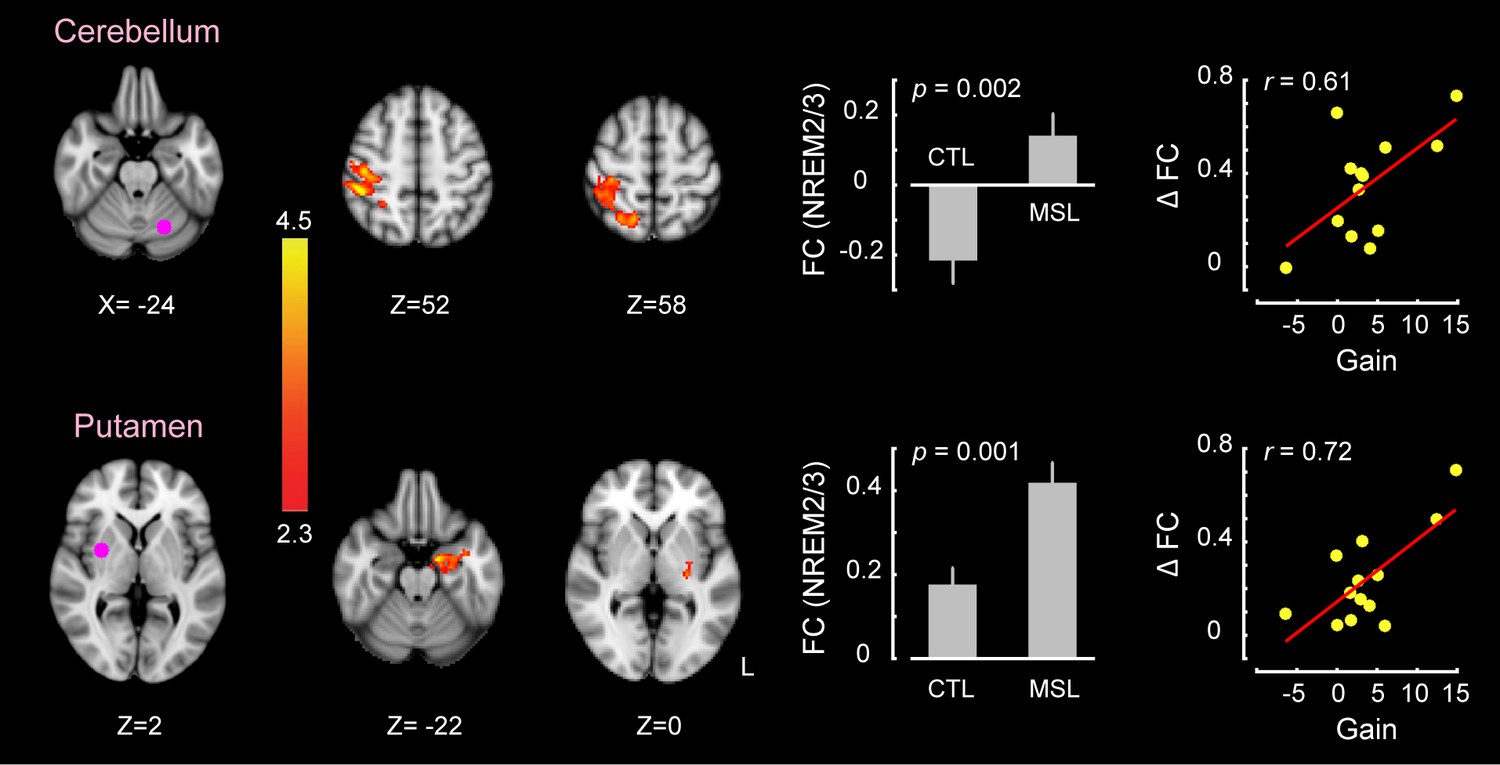
Two ROIs within the consolidated pattern, including the cerebellar cortex (top row) and the putamen (bottom row), showed significant changes in functional connectivity between tasks during non-REM sleep (paired t test , corrected for multiple comparisons using GRF, ). In each row, the left and middle brain slices show the locations of each ROI and the clusters showing significant change in connectivity with that ROI, respectively. The color-coded activation map indicates Z-score values. Each bar plot displays the average values of functional connectivity across subjects during the MSL and CTL nights between the corresponding ROI and the specified clusters. The scatter plots illustrate the linear trend between individual changes in functional connectivity () and the associated offline gains in performance speed on a per subject basis. The value of r represents the Pearson correlation coefficient.
Figure 4 with 3 supplements
Neural correlates of motor sequence memory consolidation during post-sleep resting-state periods.
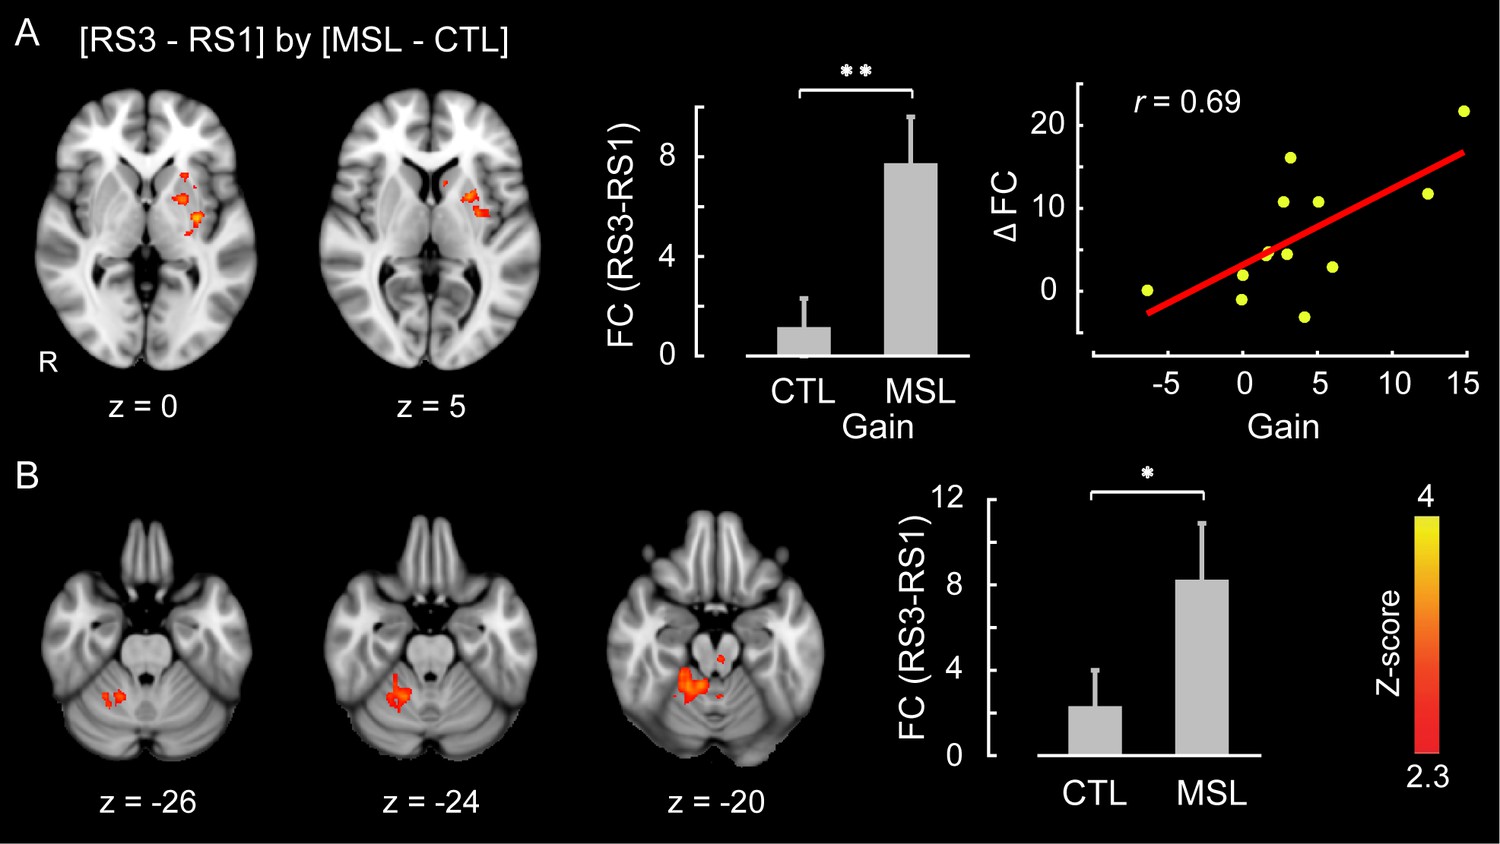
The ventrolateral putamen (A) and the cerebellar cortex (lobules V-VI) (B) functional connectivity within the consolidated pattern differed significantly between the MSL and CTL conditions during post-sleep resting-state periods (RS3) as compared to baseline (RS1). Bar plot illustrates the change in functional connectivity of putamen within the consolidated pattern between RS3 and RS1 scans averaged across subjects in each task condition. The scatter plot in (A) shows that only the putamen functional connectivity was significantly related to the extent of overnight behavioral gains in performance speed. The color-coded activations maps indicate Z-score values and are corrected for multiple comparisons using GRF, p<0.05. Error bars represent s.e.m.; * and ** indicate and , respectively.
Figure 4—figure supplement 1
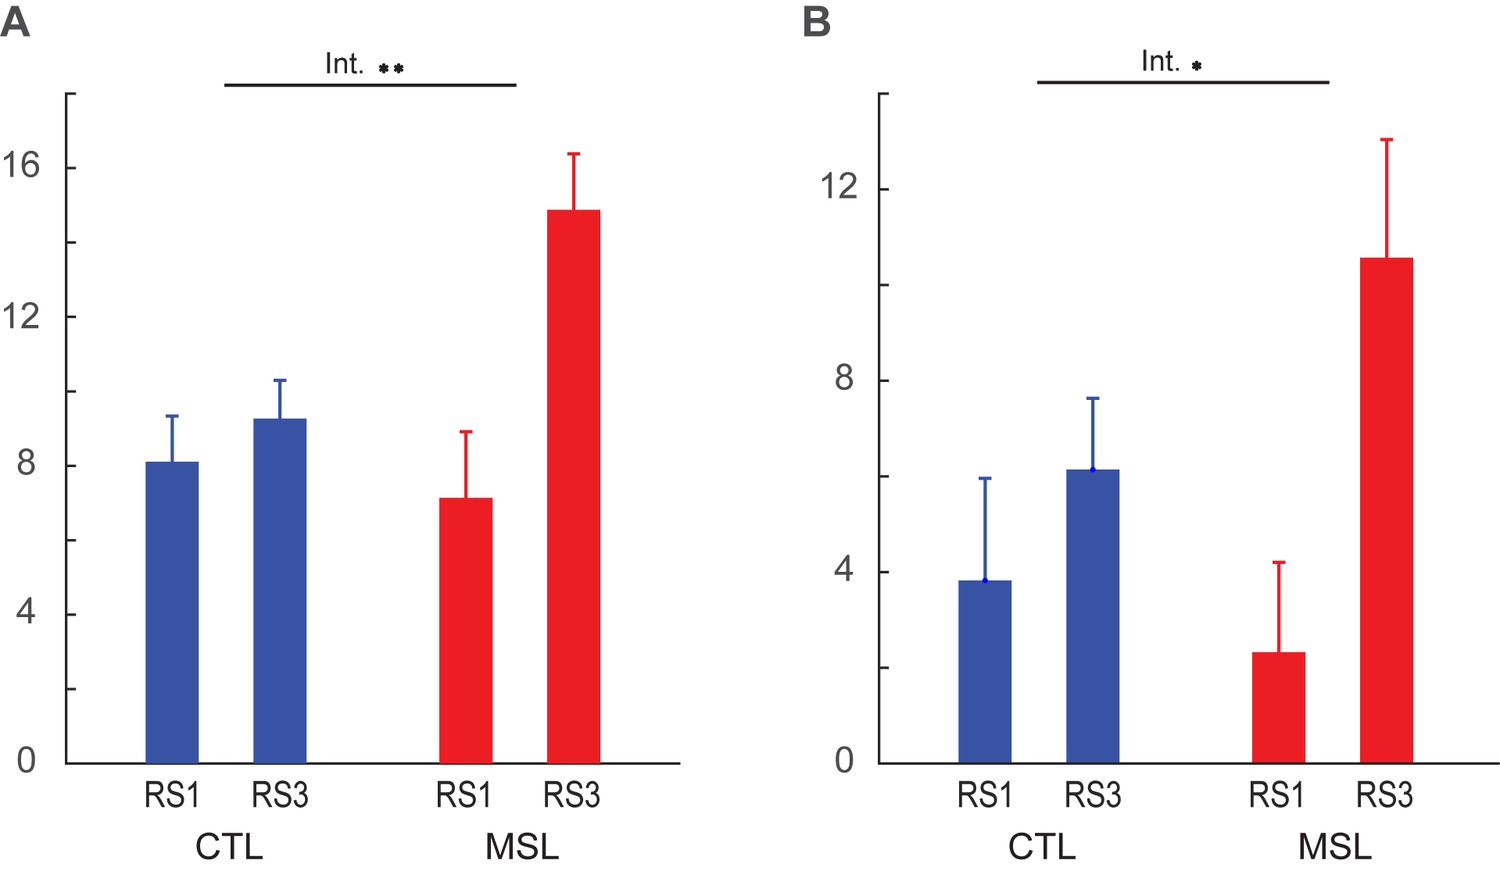
Functional connectivity within the consolidated pattern during post-sleep resting-state periods (RS3) and baseline (RS1) in each task.
(A and B) illustrate, respectively, the average functional connectivity values of the putamen and cerebellum clusters (see Figure 4) within the consolidated pattern during RS3 and RS1 scans in each task condition. Error bars represent s.e.m.; * indicates significant (p<0.05) interaction between task and resting-state condition.
Figure 4—figure supplement 2
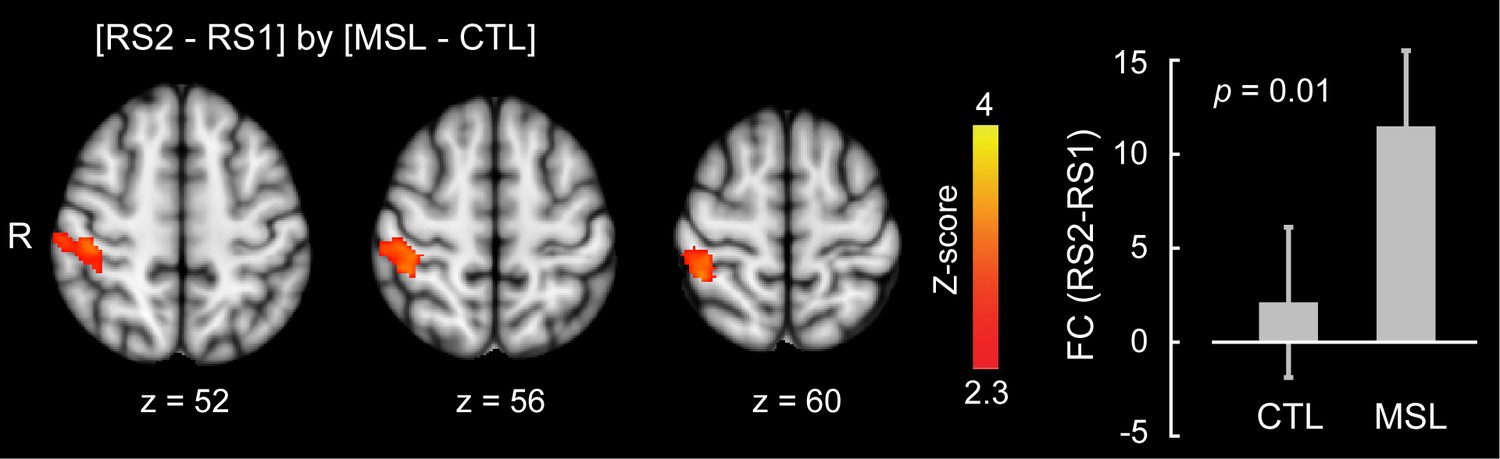
Neural correlates of motor sequence learning during resting-state periods immediately following training.
The posterior parietal lobule functional connectivity within the learning pattern significantly differed between the MSL and CTL tasks during the resting-state condition immediately following training (RS2) as compared to baseline (RS1). Bar plot illustrates the change in functional connectivity of this area within the learning pattern between RS2 and RS1 scans averaged across all subjects in each task condition. The color-coded activation map indicates Z-score values and is corrected for multiple comparisons using GRF, p<0.05. Error bars represent s.e.m.
Figure 4—figure supplement 3
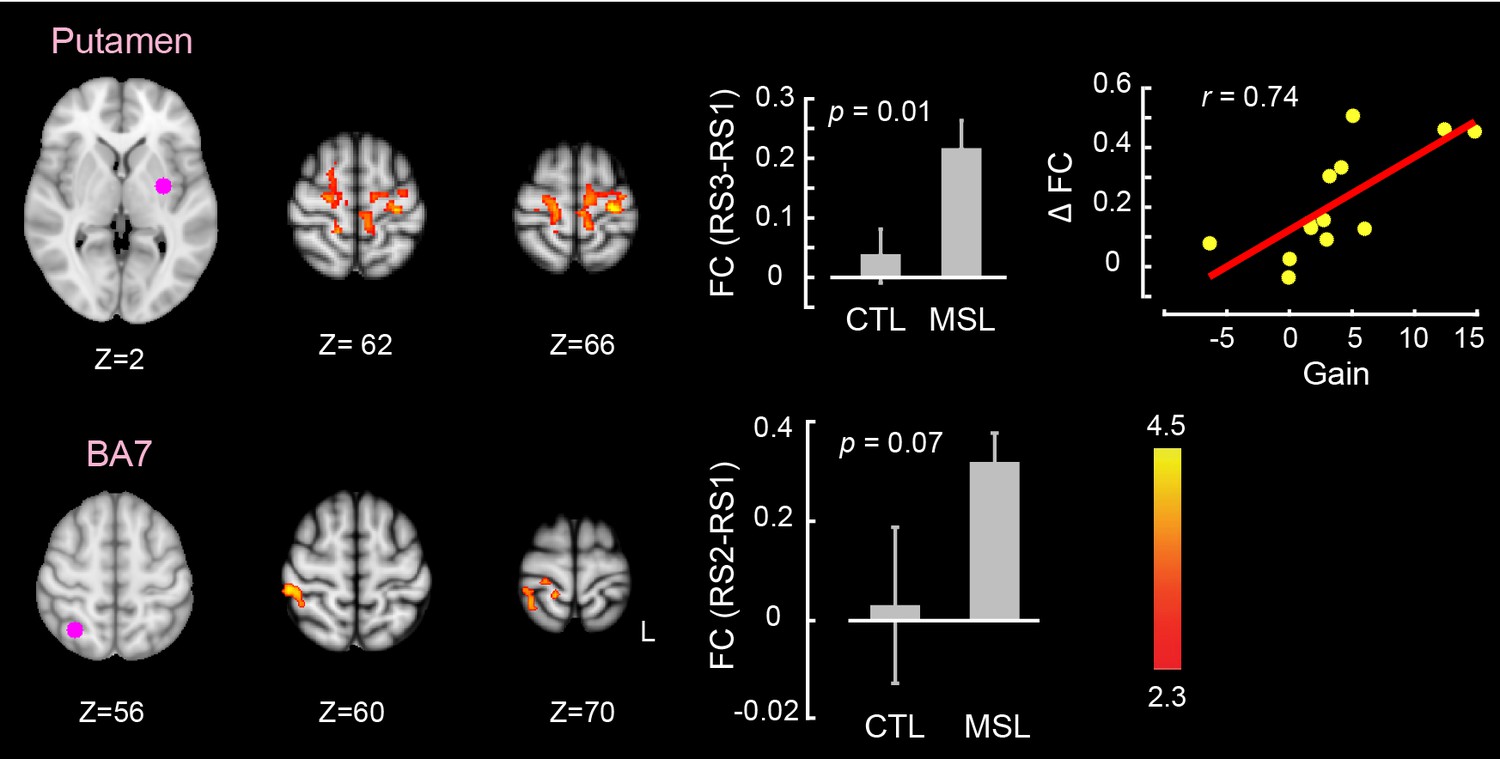
Changes in brain functional connectivity related to motor sequence learning during the post-sleep (top row) and the pre-sleep (bottom row) resting-state conditions.
An ROI located in the let putamen showed a significant change in functional connectivity between tasks during the post-sleep resting state condition (RS3) as compared to the baseline (RS1); significant interaction , top row. In contrast, an ROI located in the right posterior parietal cortex (brodmann area, BA7) showed a significant change in functional connectivity between tasks during the pre-sleep resting state condition immediately following learning (RS2) as compared to the baseline (RS1); significant interaction , bottom row. As shown in the scatter plot, only changes in functional connectivity in the post-sleep condition were correlated with the amount of offline gains in performance speed. All maps are corrected for multiple comparisons using GRF, . Display conventions are as in Figure 3—figure supplement 1.
Figure 5 with 1 supplement
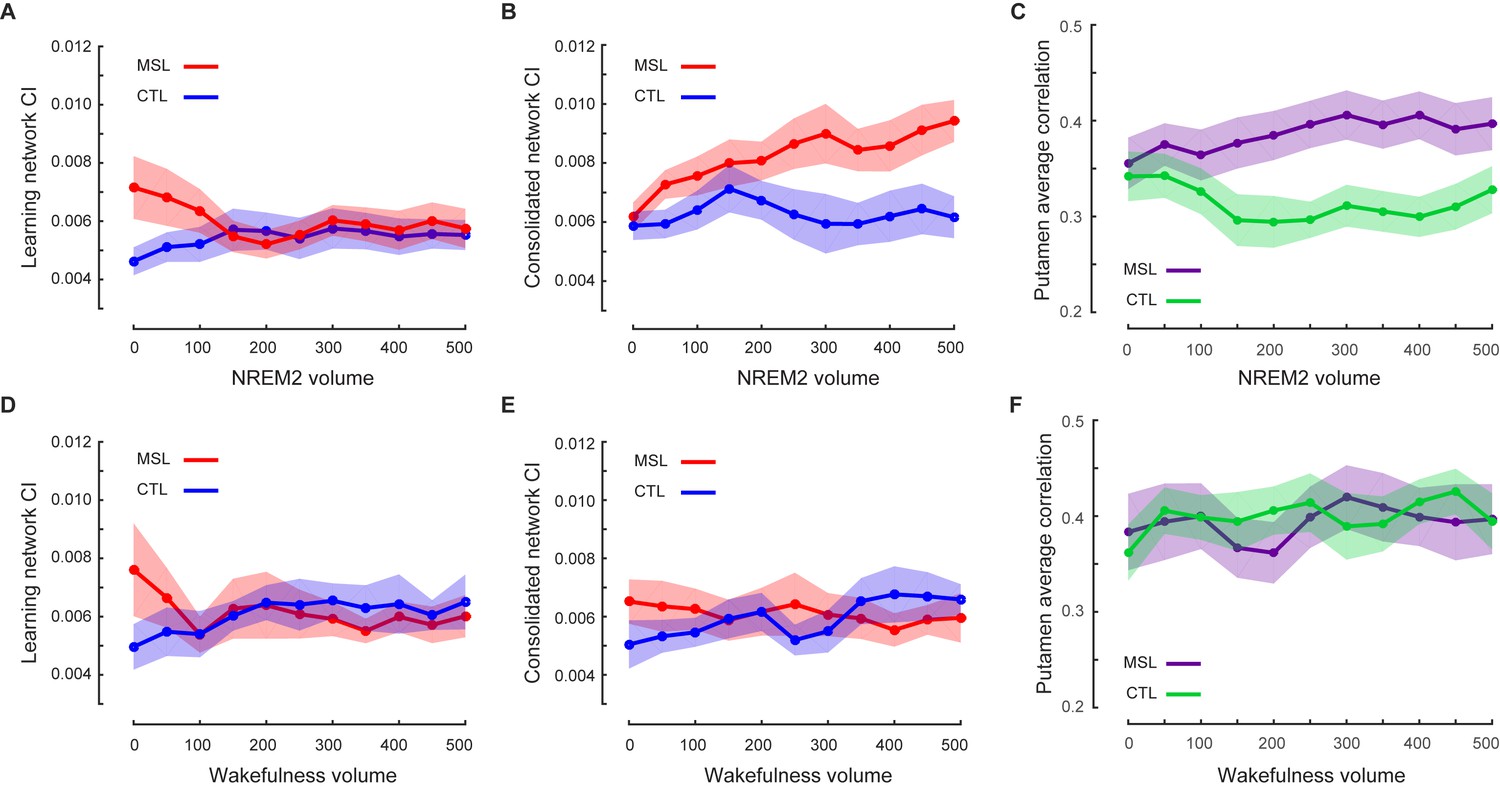
Temporal dynamics of memory trace during NREM stage two sleep.
(A, B) illustrate the time course of CI change within the learning and the consolidated patterns during NREM stage two sleep, respectively. The consolidated pattern’s CI gradually increased during NREM sleep only in the MSL condition (red curve), while the learning pattern’s CI decreased. CI did not differ significantly over the course of NREM stage two sleep in the CTL night (blue curves). Furthermore, CI within the learning (D) and consolidated (E) patterns did not change significantly over the course of intermittent awakenings distributed throughout the sleep session in the CTL (blue curves) or MSL (red curves) night. (C), (F) illustrate the time course of ventrolateral putamen functional connectivity within the consolidated pattern during NREM stage two sleep and intermittent bouts of awakenings, respectively. Likewise, the putamen functional connectivity with the rest of structures in the consolidated pattern gradually increased only during NREM sleep in the MSL condition. Each data point is calculated using 100 fMRI volumes. Shaded area represents s.e.m.
-
Figure 5—source data 1
Average duration and number of epochs used in the temporal dynamics analysis (Figure 5).
Table reports the average epoch duration and the number of epochs which were used in data analysis during the sleep scanning session in the MSL or CTL condition nights. Mean and SEM duration values are reported in minutes. p values are calculated based on paired t-statistics, and Wilcoxon signed rank test for the average duration and the number of epochs, respectively.
- https://doi.org/10.7554/eLife.24987.020
Figure 5—figure supplement 1
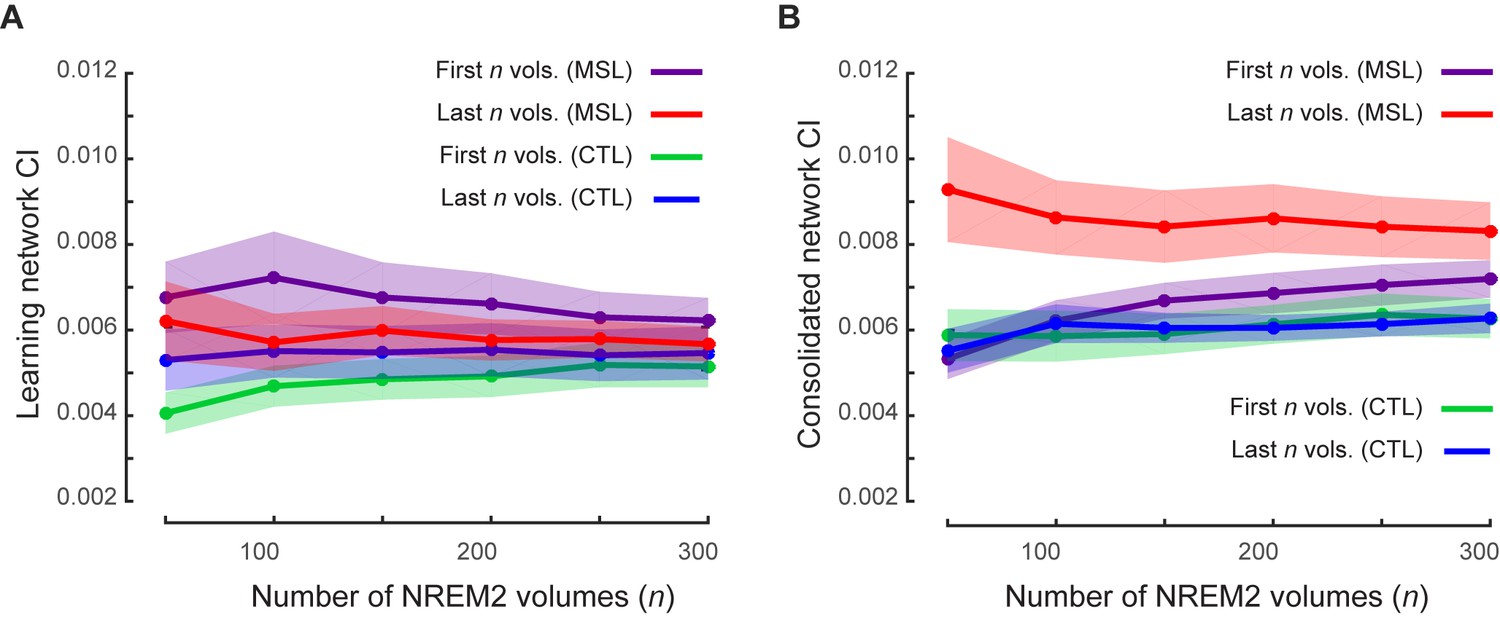
Robustness of temporal dynamics analysis with respect to the window size.
(A, B) illustrate the CI values, averaged over subjects, within the learning and the consolidated patterns respectively during non-REM stage two sleep (including on average 600 volumes) using different window sizes ranging from n = 50 to 300 volumes. Each curve is calculated using different time windows comprising either the first n fMRI volumes (purple, green) or the last n fMRI volumes (red, blue) in the MSL (purple, red) or the CTL (green, blue) condition. Shaded area represents s.e.m.
Tables
Table 1
Sleep architecture during post-training EEG-fMRI recording session on CTL and MSL condition nights. Mean and SEM values are reported in minutes. Sleep onset is calculated relative to the start of simultaneous EEG-fMRI recording. See also Materials and methods and Results for additional details. Slow wave sleep (SWS).
| CTL | MSL | MSL vs. CTL | ||||
|---|---|---|---|---|---|---|
| Mean | SEM | Mean | SEM | T | P | |
| Wake | 53.2 | 8.98 | 66.9 | 7.02 | 1.68 | 0.12 |
| Stage 1 | 10.8 | 2.16 | 8.6 | 1.58 | 0.76 | 0.46 |
| Stage 2 | 42.7 | 5.85 | 34.1 | 5.13 | 1.75 | 0.11 |
| SWS | 17.0 | 4.88 | 10.2 | 3.77 | 0.95 | 0.36 |
| Sleep onset | 16.96 | 6.12 | 15.80 | 3.01 | 0.17 | 0.87 |
Download links
A two-part list of links to download the article, or parts of the article, in various formats.
Downloads (link to download the article as PDF)
Open citations (links to open the citations from this article in various online reference manager services)
Cite this article (links to download the citations from this article in formats compatible with various reference manager tools)
Network-wide reorganization of procedural memory during NREM sleep revealed by fMRI
eLife 6:e24987.
https://doi.org/10.7554/eLife.24987


